87
Educational Leadership Administration: Teaching and Program Development March 2018; Vol.29: Issue 1 1

Educational Leadership Administration: Teaching and Program Development March 2018; Vol.29: Issue 1
1
Educational Leadership Administration: Teaching and Program Development March 2018; Vol.29: Issue 1
2
CAPEA Educational Leadership and
Administration: Teaching and Program Development
Volume 29, March 2018
ISSN 1064-4474
Managing Editors Volume 29
Gilberto Arriaza California State University, East Bay
Noni Mendoza Reis
San José State University
Educational Leadership Administration: Teaching and Program Development March 2018; Vol.29: Issue 1
i
Volume Editorial Review Board
Rebeca Burciaga San Jose State University Mariama Gray California State University, East Bay Courtney Gumora Oakland Unified School District Katherine Hays California State University, East Bay Vera Jacobson San Mateo County Office of Education Albert Jones California State University, Los Angeles Cesar Monterrosa Oakland Unified School District Rollin Nordgren National University Kimmie Tang California State University, Dominguez Hills Louis Wildman California State University, Bakersfield
Educational Leadership Administration: Teaching and Program Development March 2018; Vol.29: Issue 1
Educational Leadership and Administration: Teaching and Program Development is a refereed journal published yearly since 1988 for the California Association of Professors of Educational Administration (CAPEA). Listed in the Current Index to Journals in Education (CIJE), the editors welcome contributions that focus on promising practices and improvement of educational leadership preparation programs. Beginning with Volume 23, 2011 and continuing with this issue, Volume 29, the journal has been published by ICPEL Publications and endorsed by the International Council of Professors of Educational Leadership (https://www.icpel.org). This journal is catalogued in the Education Resources Information Center (ERIC) database, which provides a comprehensive, easy-to-use, searchable Internet-based bibliographic and full-text database for education research and information for educators, researchers, and the general public (California Association of Professors of Educational Administration/U.S. Department of Education's Institute of Education Sciences Contract No. ED-04-CO-0005).
Copyright © 2018 by California Association of Professors of Educational Administration
All rights reserved. No part of this book may be reproduced in any form or by any electronic or mechanical means, including information storage and retrieval systems, without written permission from the publisher, except by a reviewer who may quote passages in a review.
Printed in United States of America Indexed by Education Resources Information Center (ERIC), ISSN 1532-0723
How to order print copies of this Journal:
ICPEL Publications and the International Council of Professors of Educational Leadership offer Educational Leadership and Administration: Teaching and Program Development as a print-on-demand hard copy and electronic copy (eBook). Printed copy are prepared in perfect bound binding and delivery time is 3–5 business days. Ordering is available at: http://www.lulu.com
Educational Leadership and Administration: Teaching and Program Development has been peer-reviewed by CAPEA and accepted and endorsed by the International Council of Professors of Educational Leadership as a significant contribution to the preparation and practice of school administration.
Educational Leadership Administration: Teaching and Program Development March 2018; Vol.29: Issue 1
CAPEA Officers
Executive Council 2017-2018 President: R.D. Nordgren, National University
President Elect: Noni Mendoza Reis, San Jose State University
Secretary/Treasurer: Becky Sumbera, California State University, San Bernardino
Immediate Past Co-Presidents: Bobbi Plough, California State University, East Bay; Carol Van Vooren, California State University, San Marcos; Linda Purrington, Pepperdine University; Delores Lindsey, California State University, San Marcos; Lori Kim, California State University, Los Angeles Journal Managing Editors Volume 29: Gilberto Arriaza, California State University, East Bay; Noni Mendoza Reis, San Jose State University Board Members: Susan Belenardo, University of California, Irvine; Ron Oliver, California State University, Fresno; Sonia Rodriguez, National University; Cliff Tyler, National University; Brooke Soles, California State University, San Marcos; Glenn Sewell, National University Historian: Louis Wildman, California State University, Bakersfield
Membership Committee: Wayne Padover, National University
Liaison to CTC: Peg Winkelman, California State University, East Bay
Liaison to ICPEA: Gary Kinsey, California State University, Channel Islands
Liaison to ACSA/CAPEA: Teri Marcos, National University
Liaison to ACSA Superintendents: Cliff Tyler, National University
Educational Leadership Administration: Teaching and Program Development March 2018; Vol.29: Issue 1
Notes from the Editors
Spring 2018 Edition Welcome to Volume 29 of Educational Leadership and Administration: Teaching and Program Development: The Journal of the California Association of Professors of Educational Administration (CAPEA). After a blind and rigorous review process, the editors have accepted a set of very strong contributions from a variety of perspectives concerning the profession of school leadership and school leadership preparation. Volume 29 begins with the article The Web of Reclassification for English Language Learners —A Cyclical Journey Waiting to Be Interrupted: Discussion of Realities, Challenges, and Opportunities. This article highlights the racialized and social class discourses in the educational field. In spite of the fact that English language learners represent a growing number of students in our public schools, there continues to be no official language policy at the national level. This lack can result in ad hoc language policies developed at the local level that may not advance the academic achievement of English language learners. The authors unpack obstacles and discuss opportunities associated with language minority student classification practices and, more specifically, English language learners’ reclassification to fluent proficient status. The authors conclude with recommendations for school and district leaders concerning how to apply the liberty afforded to districts by the CDE in a way that best meets the students' needs and that is also socially just. The remaining articles in this section focus on praxis, in that the research presented disseminates knowledge for both leadership preparation programs and the field of school/district leadership. Is It Rational or Intuitive? Factors and Processes Affecting School Superintendents’ Decisions When Facing Professional Dilemmas examines the decision-making processes of superintendents and the factors that affect their decisions. This research shows that superintendents’ decisions are influenced by their intention to safeguard the interests of students, their perceptions about the community’s acceptance of their decisions, and the advice of trusted consultants. Findings also suggest that superintendents blend a rational approach with their intuition when making decisions, a strategy that mimics dual process approaches. Job Embeddedness May Hold the Key to the Retention of Novice Talent in Schools reports on ways to improve retention among novice teachers. California is currently experiencing a critical teacher shortage. The authors note that schools with the highest need appear to endure the greatest teacher attrition. This study reports on strategic interventions that school leaders can implement to improve retention among novice teachers. An Examination of K-5 Principal Time and Tasks to Improve Leadership Practice highlights the high rates of attrition among school leaders that result from increased demands on school principals. This study reports on a unique university and school district partnership that worked together in action-based, community-engaged research to address the time allocation and tasks in the daily life of principals. The findings highlight the complex and changing roles in the daily work of school principals. Moreover, this study serves as a model for community engagement and exemplifies how universities and districts can work together to improve school leadership. Do Something That Scares You Each Day: The Role of Self-Efficacy in Preparing School Leaders, the last article in this volume, addresses the importance of paying attention to agency in
Educational Leadership Administration: Teaching and Program Development March 2018; Vol.29: Issue 1
developing leadership preparation coursework. Students reported on the relationship between the leadership readiness beliefs of prospective school leaders and the efficacy-building experiences they participated in during their university preparation program. A moderate positive correlation was found between the number of efficacy-building experiences in which students took part and the leadership readiness that they reported. The article concludes with specific recommendations for university programs that desire to best prepare their students through efficacy-based training. This journal would not have been possible without the efforts of numerous people. First, we would like to thank all the authors who contributed manuscripts. A very special thank you goes to the Editorial Review Board, who worked tirelessly to review and edit all the submissions. We also wish to acknowledge our copyeditor, Stefania De Petris. We could not have completed the journal without her excellent skills and assistance to the authors. We would also like to thank our President R.D. Nordgren, from the National University, for his constant encouragement and support. Lastly, this journal would not exist without the support of ICPEL Publications and especially Brad Bizzell, who has been an invaluable member of our team. To all readers, we hope that this journal will provide an opportunity to expand your insights into the field of school leadership and reflect on your own practice. We also hope that this reflection will bring you to a deeper commitment to our crucial work for our nation’s youth and children.
Educational Leadership Administration: Teaching and Program Development March 2018; Vol.29: Issue 1
About the Authors
The Web of Reclassification for English Language Learners—A Cyclical Journey Waiting to Be Interrupted: Discussion of Realities, Challenges, and Opportunities Irina Okhremtchouk, San Francisco State University Contact: [email protected]
Jennifer Levine-Smith, San Francisco State University Contact: [email protected]
Adam T. Clark Arizona State University Contact: [email protected] Is It Rational or Intuitive? Factors and Processes Affecting School Superintendents’Decisions When Facing Professional Dilemmas William H. Hart, Winthrop University Rock Hill Contact: [email protected] Job Embeddedness May Hold the Key to the Retention of Novice Talent in Schools
Jennifer L. Moradian Watson, California State University, Fresno Contact: [email protected] An Examination of K-5 Principal Time and Tasks to Improve Leadership Practice Carol Van Vooren, California State University, San Marcos Contact: [email protected] Do Something That Scares You Each Day: The Role of Self-Efficacy in Preparing School Leaders Jaymi Abusham, University of LaVerne Contact: [email protected]
Educational Leadership Administration: Teaching and Program Development March 2018; Vol.29: Issue 1
Educational Leadership and Administration: Teaching and Program Development ______________________________________________________________________________ Volume 29 Issue 1 March 2018
CONTENTS
Section One: School Leadership The Web of Reclassification for English Language Learners—a Cyclical Journey Waiting to Be Interrupted: Discussion of Realities, Challenges, and Opportunities
I.Okhremtchouk, San Francisco State University J. Levine-Smith, San Francisco State University A. T. Clark, Arizona State University
1
Pea Is It Rational or Intuitive? Factors and Processes Affecting School Superintendents’ Decisions When Facing Professional Dilemmas
W. H. Hart, Winthrop Universit
14
Job Embeddedness May Hold the Key to the Retention of Novice Talent in Schools
J. L. M. Watson, California State University, Fresno
26
Section Two: Leadership Preparation and Development An Examination of K-5 Principal Time and Tasks to Improve Leadership Practice
C. Van Vooren, California State University, San Marcos
45
Do Something That Scares You Each Day: The Role of Self-Efficacy in Preparing School Leaders
J. Abusham, University of La Verne
64
Educational Leadership Administration: Teaching and Program Development March 2018; Vol.29: Issue 1
1
Section One: School Leadership
The Web of Reclassification for English Language Learners—a Cyclical Journey Waiting to Be Interrupted: Discussion of Realities, Challenges, and
Opportunities
I.Okhremtchouk San Francisco State University
J. Levine-Smith San Francisco State University
Adam T. Clark Arizona State University
Abstract
In this article we unpack the obstacles and opportunities associated with language minority student classification practices and, more specifically, English language learners’ reclassification to fluent proficient status. First, we discuss classification permanency for language minority students. Second, we provide an overview of national reclassification practices. Third, we discuss the practical application of California Department of Education’s (CDE) guidelines for reclassification of students from English Language Learner (ELL) to Fluent English Proficient (FEP). We conclude with recommendations for school and district leaders on how to apply the liberty afforded to districts by the CDE in a way that best meets the students' needs and is socially just.
Educational Leadership Administration: Teaching and Program Development March 2018; Vol.29: Issue 1
2
Conversations around the academic obstacles affecting language minority students frequently permeate educational circles and spaces. Yet, how language minority students are stratified within public school systems is less frequently discussed. In this article, we argue that the way language minority students are classified and reclassified deserves much attention.
The practice of student classification is more than one-fold. Although commonly used in education subfields (e.g., special education, gifted and talented education, Native American education, English language development, among others), classification itself carries a high potential not only to impact classified students’ K-12 experiences (Okhremtchouk, 2014), but also to shape their long-term and even life trajectories, as the two are intertwined and not mutually exclusive. In the case of language minority students, being classified is unavoidable. From the very first day language minority students enroll in a public school, they are classified based on their deemed proficiency level in the English language through an assessment measure used by a school district of enrollment.
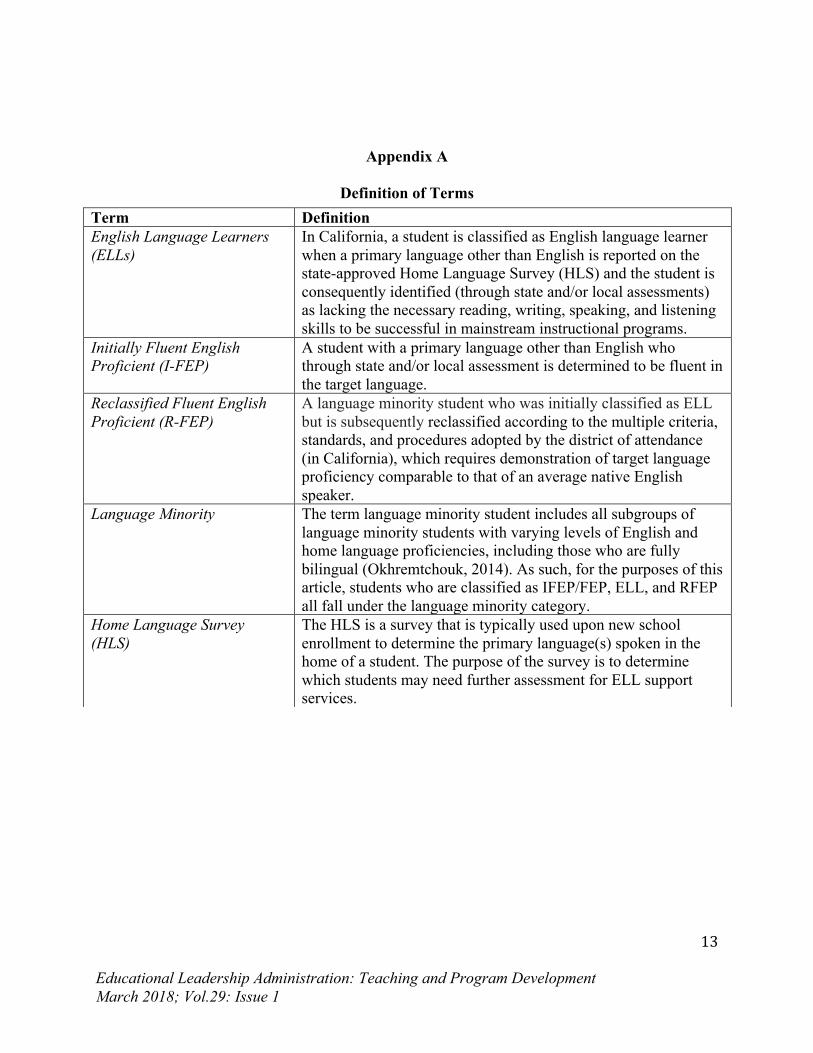
For example, if a language minority student is found to be fluent in the English language, he or she is classified Initially Fluent English Proficient (I-FEP/FEP). If a student is deemed not fluent in the English language by the district of enrollment, he or she is classified as an English Language Learner (ELL). When an ELL student eventually reaches proficiency in the English language as determined by her/his district of attendance, he or she is then reclassified to Fluent English Proficient or R-FEP (please find a more comprehensive definition of terms in Appendix A). Indeed, language minority students are subjected to classification throughout their careers in the K-12 public education system.
It is noteworthy to highlight that unlike classification practices used in other education subfields, classification for language minority students, and specifically English learners, is meant to be temporary as the students learn the English language. However, this classification becomes anything but temporary for this student population. As we engage our readers in the forthcoming discussion, we stress the often-unintended permanent nature (or permanency) of classification for language minority students in order to emphasize its significance on the in-school stratification of this student population. We encourage our readers to keep this classification’s permanency (and its effects on language minority students in general) in mind as they engage in key decision making relating to reclassification criteria for ELLs.
U.S. Reclassification Practices for ELLs
All states in the Union adhere to predetermined classification criteria for language minority students based on guidelines typically set by state departments of education. Likewise, they also adhere to set reclassification criteria. To offer states a starting point, in 2015 the U.S. Department of Justice’s Civil Rights Division and the U.S. Department of Education’s Office of Civil Rights sent states a reminder of their recommendation advising school districts to implement procedures that are both accurate and timely when identifying potential ELL students (U.S. Department of Justice Civil Rights Division & U.S. Department of Education Office for Civil Rights, 2015). Additionally, the guidelines explicitly suggest that school districts use a home language survey at the time of enrollment to gather information about language background and to identify students whose primary/home language is other than English. Finally, the guidelines require that the final step in classification process involve “a valid and reliable test that assesses English language
Educational Leadership Administration: Teaching and Program Development March 2018; Vol.29: Issue 1
3
proficiency in speaking, listening, reading and writing” (U.S. Department of Justice Civil Rights Division & U.S. Department of Education Office for Civil Rights 2015, p. 1). However, in terms of reclassification, federal government’s only guideline is that “an EL[L] student must not be exited from EL[L] programs, services, or status until he or she demonstrates English proficiency on an English language proficiency assessment in speaking, listening, reading, and writing” (U.S. Department of Justice Civil Rights Division & U.S. Department of Education Office for Civil Rights 2015, p. 3). Further, the post-reclassification requirements state that: (a) reclassified students must be monitored for a period of two years to ensure that their exit from ELL programs is not premature, and (b) any academic deficits ELL students incurred during their time in ELL programs must have been remedied.
Whereas the identification process for ELLs shares a number of similarities across the nation (i.e., starting with home language survey, followed by language proficiency assessments), states do differ in the number of criteria used to reclassify their ELL students to FEP. Roughly half U.S. states use a single-criterion system, whereas the remainder use multiple criteria to reclassify students. Objective measures differ from state to state as they pertain to reclassification practices.
In 2015, we conducted our own investigation of reclassification practices to help understand the nation’s reclassification criteria from ELL to FEP (Okhremtchouk, Archibeque, Clark, Baca, & Sellu, 2016). In summary, we found that 27 states (Alabama, Alaska, Arizona, Connecticut, Hawaii, Illinois, Indiana, Iowa, Kentucky, Louisiana, Maine, Minnesota, Nevada, New Hampshire, New Mexico, New York, North Dakota, Ohio, South Carolina, South Dakota, Utah, Vermont, Virginia, Washington, Wisconsin, and Wyoming), or little over half of the total (54%), did not allow their districts to use subjective measures for ELL reclassification, whereas the other 23 states (Arkansas, California, Colorado, Delaware, Florida, Georgia, Idaho, Kansas, Maryland, Massachusetts, Michigan, Mississippi, Missouri, Montana, Nebraska, New Jersey, North Carolina, Oklahoma, Oregon, Pennsylvania, Rhode Island, Tennessee, and Texas) did allow their districts to use discretionary measures. Although both of these practices could be criticized on both theoretical and practical grounds, it could be argued that not having subjective discretionary measures ensures more consistency in reclassification practices. In other words, subjective measures lead to greater variation in what defines “language proficiency” (Abedi, 2008; Cook & Linquanti, 2015). That being said, it can also be argued that multiple measures (including that of a subjective nature) are needed to determine whether a student is proficient in the English language or not.
The use of discretionary measures on top of multiple criteria creates much variability within any given state as well as between states. Although the existing variation in language minority student re/classification criteria and practices might not be an issue for local systems, the systemic differences in re/classification practices can easily shape and ultimately alter a student’s K-12 trajectory. That is, local systems and individual states (at least on some level) exist in a vacuum consumed by their own needs and specific state standards, which therefore, used to shape policies for re/classification practices.
However, the students themselves do not experience the system in a vacuum. They are dynamic. They move from school to school, district to district, and/or from state to state, and much of their K-12 experience is shaped by socioeconomic and other factors impelled by parental/caregiver choices or lack thereof. In fact, language minority students as a group, including migrant students and students who have been classified as ELL, are one of the
Educational Leadership Administration: Teaching and Program Development March 2018; Vol.29: Issue 1
4
identified high-mobility subgroups that typically experience at least one mobility event in a four-year period (Fong, Bae, & Huang, 2010; U.S. Government Accountability Office, 2010).
As we advance our discussion, we turn to California’s reclassification criteria. For the remainder of this article, our intent is to highlight the problems and possibilities to ensure that school administrators and educational leaders think intentionally about the issue of reclassification criteria for ELLs (and about classification practices for language minority students more broadly) when leading schools and districts.
Case in Point: California
We focus on California as a case in point due to the state’s large enrollment numbers for ELL and language minority students. In the last several years, it is estimated that California has enrolled roughly 22% of the nation’s ELLs (National Center for Education Statistics, 2017) and more than 55% of the state’s total enrollments are language minority students.1 The state also uses multiple criteria to reclassify ELLs, which affords much discretion to its districts and allows much room for interpretation of what determines language proficiency.
In California (as in other states) the initial classification is based on the Home Language Survey (HLS), which serves as a trigger for language proficiency testing. After the initial classification, results from statewide standardized tests, language proficiency tests, as well as other subjective measures such as students’ grade-point average (GPA), grade-level standards, teacher recommendations, written assessments, and other academic factors detailed later in this article play a significant role in determining whether students qualify to exit ELL classification. In sum, the reclassification from ELL to R-FEP status in California is a complicated process that involves multivariable criteria. As a result, ELL reclassification practices are largely conditional upon the processes adopted by the local educational agency (LEA), that is, school districts and their corresponding sites.
Such practices, in turn, create inconsistent reclassification outcomes for ELLs across the state (Cook & Linquanti, 2015; Okhremtchouk, 2014). These subjective, non-uniform criteria for reclassification set forth by individual districts make the definition of R-FEP not as straightforward as the acronym suggests (Cook & Linquanti, 2015). To shed light on this significant issue, we further decipher the reclassification practices that California’s districts utilize to reclassify their ELL students to R-FEP status.
Past and Present RFEP Guidelines from the CDE California gives LEAs a great deal of latitude when it comes to determining the requirements for reclassification of ELL to R-FEP. Prior to the R-FEP guidelines adjustment in 2015–16, the CDE required schools to use four components in assessing students: (a) the California Standardized Test (CST), (b) one or more academic achievement measures, (c) the California English Language Development Test (CELDT), and (d) parent consultation. For both standardized tests (CST and CELDT), the CDE defined minimum score requirement but did not cap them, giving LEAs the freedom to designate higher minimum scores for their students. For example, on the CELDT, the CDE requires that students score Early Advanced or higher overall, and
1 Data by California Department of Education, Ed-Data (2015). Retrieved from http://www.ed-
Educational Leadership Administration: Teaching and Program Development March 2018; Vol.29: Issue 1
5
Intermediate on each individual subtest. A school district, however, could decide that students must score Early Advanced on each subtest if it chooses to. Furthermore, LEAs have much liberty when it comes to evaluating a student’s academic performance. They are required to use at least one marker—a teacher recommendation, for example—but can use as many as they want.
Although many of the guidelines for ELL reclassification after the 2015–16 academic year remained the same, several components of the CDE’s reclassification criteria have become even more ambiguous. Based on the CDE’s Reclassification Guidance for the 2017–18 academic year, and because the CST has been eliminated, LEAs are now given the autonomy and flexibility to choose not just the threshold scores that students must achieve on the test/standardized measures to be eligible for reclassification, but also the test itself. Schools must use a “comparison of student performance on an objective assessment of basic skills [against] an empirically established range of performance in basic skills based on the performance of English proficient students of the same age” (Cadiero-Kaplan & Hernandez, 2014). It is noteworthy that this added discretion for LEAs is in conflict with prior expert recommendations calling for more consistent criteria across school districts (Abedi, 2008; Cook & Linquanti, 2015), and it can be viewed as counterproductive to achieving a fairer system for reclassifying state’s ELLs.
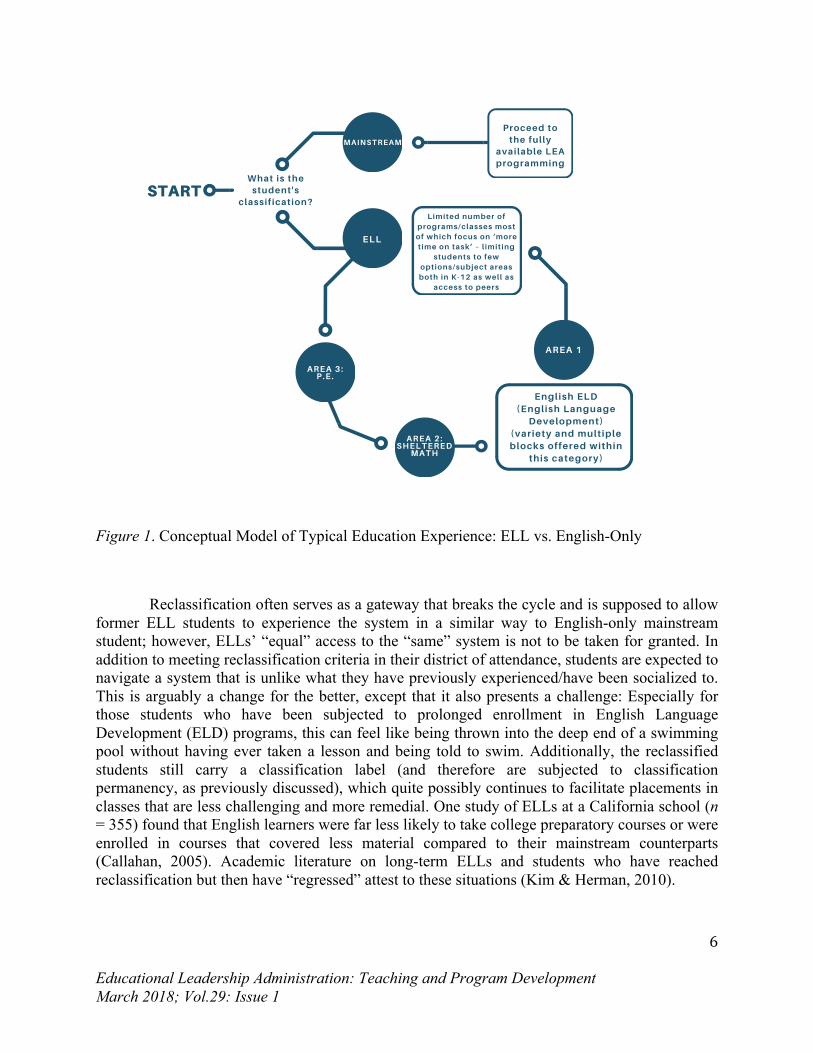
Conceptual Model of Education System and Experiences: ELL vs. English-Only Students When examining what has been documented in the academic literature, it can be inferred that the way language minority students, and more specifically ELLs, experience the K-12 education system is cyclical in nature, which is different from how the English-only mainstream student population (in a broader sense) experiences the same system (see Gándara, 2015; Gándara, Rumberger, Maxwell-Jolly, & Callahan, 2003). This is true both in terms of the subject areas the students have access to and in terms of the programmatic areas of the curriculum.
The systemic structure for mainstream students is designed to resemble building blocks that increase in intensity as students progress to different levels (i.e., years/grades) and that grant access to different programs that better align with the students’ interests/needs (e.g., Advanced Placement, STEM track, etc.). On the contrary, ELLs commonly repeat the cycle that is broadly designed to address the same subject area, i.e., English (see Figure 1). For example, if a student who has been classified as ELL does not make sufficient progress, his or her academic schedule (and therefore course offerings) will continue to reflect more English classes that are habitually remedial (Gándara, 2015). This cyclical nature could quite possibly continue throughout the students’ academic trajectories in K-12, with little to no change to the nature of the educational experience or diversity of content/subject areas they are exposed to.
Educational Leadership Administration: Teaching and Program Development March 2018; Vol.29: Issue 1
6
Figure 1. Conceptual Model of Typical Education Experience: ELL vs. English-Only
Reclassification often serves as a gateway that breaks the cycle and is supposed to allow former ELL students to experience the system in a similar way to English-only mainstream student; however, ELLs’ “equal” access to the “same” system is not to be taken for granted. In addition to meeting reclassification criteria in their district of attendance, students are expected to navigate a system that is unlike what they have previously experienced/have been socialized to. This is arguably a change for the better, except that it also presents a challenge: Especially for those students who have been subjected to prolonged enrollment in English Language Development (ELD) programs, this can feel like being thrown into the deep end of a swimming pool without having ever taken a lesson and being told to swim. Additionally, the reclassified students still carry a classification label (and therefore are subjected to classification permanency, as previously discussed), which quite possibly continues to facilitate placements in classes that are less challenging and more remedial. One study of ELLs at a California school (n = 355) found that English learners were far less likely to take college preparatory courses or were enrolled in courses that covered less material compared to their mainstream counterparts (Callahan, 2005). Academic literature on long-term ELLs and students who have reached reclassification but then have “regressed” attest to these situations (Kim & Herman, 2010).
Educational Leadership Administration: Teaching and Program Development March 2018; Vol.29: Issue 1
7
Problems and Opportunities California gives LEAs much room to interpret and implement the criteria that language minority students must meet in order to become reclassified as English proficient. The implications of this for students and the correlated responsibility taken on by district leadership when it comes to establishing district policy cannot be overstated. Although carrying an ELL classification in the short run can support ELL students’ academic trajectories, the long-term impacts of ELL classification and, therefore, in-school stratification practices affect students’ academic trajectories as well as college and career opportunities (Kanno & Harklau, 2012; Núñez, Rios-Aguilar, Kanno, & Flores, 2016). For example, many long-term ELL students take ELD classes at the expense of other content areas and are denied access to college-track courses while still classified as ELL, which puts them behind their peers in ways that may be impossible to overcome (Callahan, 2005; Kanno & Kangas, 2014). This has the secondary impact of segregating students by language ability, depriving them of access to the kinds of scaffolding that students with differing language skills can provide for each other (Gándara et al., 2003). Finally, because ELL students are a highly mobile population (on average, they move three times during their K-12 career; see Fong et al., 2010; USGAO, 2010), they run the risk of being subjected to different criteria for reclassification as they move districts and are susceptible to misclassification based on nothing more than a change in zip code (Jepson & de Alth, 2005).
All of this begs the question: If the stakes of reclassification are so high for our students, and California policy remains as it is—vague and subjective—what is an individual LEA to do to make sure that its reclassification policies are serving the best interests of the students? In order to address this question, we must dig deeper into the wide range of reclassification criteria currently used in school districts around California and measure them against the purpose of reclassification and the intended meaning of FEP.
Presumably, to be FEP should mean that a student can speak, understand, read, and write English as a native speaker of the same age would do. When evaluating the options available to school districts, then, the focus should be on ways of measuring and assessing these skills and these skills alone.
Of the four areas that the CDE requires LEAs to use, the academic requirement is the area most subject to interpretation and, not surprisingly, the area with greatest variety among individual LEA policies. As Okhremtchouk et al. (2016) found, 53% of school districts use grades beyond those taken, for example, in an ELD class, and 19% use overall GPA as a marker. Students in such districts with identical English fluency, but who vary in their understanding (or, rather, assessed performance) of math and science, may therefore be classified differently. Additionally, 39% of school districts require a written assessment in spite of the fact that the CELDT test includes a written component. Forty percent of LEAs require a teacher recommendation (Okhremtchouk et al., 2016). Although teachers may have the best intentions when writing these recommendations, this measure is so subjective that a child’s re/classification risks being determined by which teacher he or she has.
The large amount of flexibility that CDE policy allows, however, also presents school leaders with some opportunities. The CDE’s flexibility provides much autonomy to individual districts, which is consistent with the notion that the district leadership and governance structures know their students best and can make more informed decisions. In other words, more flexibility translates into a greater value attributed to LEAs. Increased flexibility, however, also creates
Educational Leadership Administration: Teaching and Program Development March 2018; Vol.29: Issue 1
8
heightened responsibility and the need for precise decision making in establishing local criteria by LEAs. The flexibility itself is intended and must be viewed by district/school leadership as an opportunity to afford language minority students the same level of advancement and choices as their English-only counterparts. This shift in paradigm—that is, thinking of flexibility as an opportunity to afford language minority students more options in both the long and the short term—not only creates a greater chance for success for ELLs and language minority in general, but it also allows LEAs to establish classification practices that can open more doors as language minority students progress through various stages in their K-12 careers.
Recommendations
1. Creating Criteria for Reclassification That Are Socially Just As we have established, individual LEAs have considerable power in determining what hoops students have to jump through to become reclassified as R-FEP. It is imperative, then, that districts develop reclassification requirements that center students’ needs through a social justice lens. That is, if the bar is set too low, students may be reclassified too early and be denied access to supports that they need. If the bar is set too high, students may be kept for too long in a program that is ill suited to their academic needs and may be excluded from rigorous academic courses that would challenge them and allow them to thrive.
We recommend that school districts adopt guidelines that focus on English language proficiency and that alone. Overall GPA and grades taken outside of ELD or ELA have the potential to hinder students who are proficient in English from being reclassified due to struggles in other academic arenas. Although it could be argued that overall GPA and academic performance in other core subject area classes (e.g., math) can indicate “readiness” for reclassification, these factors should not hamper reclassification and should only be used as a source of supplementary advice if deemed important by a LEA. We recommend, too, that districts refrain from doubling up on assessment criteria. For example, the CELDT test includes a writing component. If a district decides to include an additional writing assessment as a measure, it risks providing students with greater opportunities for failure.
As far as teacher recommendation, we recommend providing professional development concerning: (a) how teachers can make those assessments/recommendations, as these are highly subjective; (b) what it means to be proficient in the English language (including providing objective data on language proficiency from English-only mainstream students); (c) what the implications are for students in a particular district based on their classification; and (d) how to determine proficiency in a classroom setting. In other words, if the goal is to ensure that students will be successful in mainstream classrooms, it makes sense for all teachers to receive this professional development and for ELD teachers to receive advice from content-area teachers, who may have information about whether students in their classrooms are affected by academic language knowledge or lack thereof.
When it comes to standardized test scores, we circle back to our recommendation for consistency. In this case, consistency would require close adherence to California’s state guidelines across districts. We suggest an agreement among LEAs concerning score caps and acceptable score ranges to ensure less variation among districts and a more consistent approach to reclassification practices. We further suggest that the county offices of education should lead
Educational Leadership Administration: Teaching and Program Development March 2018; Vol.29: Issue 1
9
the charge in establishing more uniform criteria for reclassification in collaboration with LEAs in their region. This will ensure greater consistency without infringing too much on local autonomy.
2. Classification as an Opportunity Model: Avoiding Deficit Pitfalls A socially just view of reclassification practices would start from the students’ needs (e.g., what they are getting out of the ELD curriculum vs. what they are missing outside of it) and plan backwards from there. It would also require that districts view their students as competent, capable, and full of strengths (that is, valuing bilingualism and biculturalism) rather than as coming with deficits that need to be filled (that is, lacking proficiency in the English language). To this end, an opportunity-minded approach to reclassification would include not only a socially just reclassification system, but also an educational system that across all stages of the process gives students the space to learn a new language while keeping their first language and without withholding rigorous academic content until proficiency is met (Gándara, 2017).
Making sure that students who are learning English can access to primary/home language support during content area classes, rather than being put in remedial classes because of their English knowledge, has two beneficial impacts. First, students’ home language, which is an integral part of every human’s identity, is validated and respected, and thus students are more likely to feel heard, seen, and valued (Miller, 2000; Ogbu, 1999). Second, this mitigates the potential impact of classification—namely, the fact that students’ academic (and career and life) trajectories can be inalterably hindered by their language minority status. This, as opposed to a simple deficit approach, would allow for alternative linguistic paths to success.
Giving students access to curricula that reflect their lives and their communities fosters engagement and creates a space for appreciation and validation among minority students, regardless of their primary language. Schools can design curricula that teach about the histories of the communities represented among the language minority student population at the school, and they can use personal narratives of students and their families as a basis for English development. This can include elements of culturally responsive teaching, which calls for highly contextualized teaching practices that can be challenging for pre-service teachers coming from monolingual, mono-ethnic contexts (Gay & Kirkland, 2003).
Finally, giving language minority students and English-only students the opportunity to interact as frequently as possible, particularly around language, is of potential benefit to everyone. It is widely acknowledged that in the globalized world of the 21st century, and in particular in the state of California, with its significantly large community of speakers of languages other than English, speaking English alone will not be enough. Giving ELLs the chance to support English-only students in non-English-language classes would empower these young emergent bilinguals to use the social capital that they bring with them to school (Okhremtchouk, 2014). Conversely, ensuring that all classes integrate students with a variety of English proficiency levels would allow our English-only students to scaffold ELLs’ English development. By supporting the notion that English-only students should become bilingual in order to be successful global citizens, and by highlighting the benefits of bilingualism, including recruitment and retention of teachers with similar heritage as our ranks of students, educators, educational leaders, and experts can productively challenge the deficit model.
Educational Leadership Administration: Teaching and Program Development March 2018; Vol.29: Issue 1
10
3. Ongoing Assessment for Post-Graduation Opportunities We suggest that LEAs take a proactive step in examining and reexamining post-graduation opportunities for language minority students early in their K-12 careers and frequently as the students move through the K-12 pipeline. Taking into account the permanency associated with language minority student classification and its potential impact on the students’ academic as well as life trajectories is a solid start in addressing the opportunity factor. That is, academic placements must be carefully thought through, especially for those language minority students who have been reclassified or are initially classified as fluent proficient. These two classifications should not drive key decisions pertaining to academic opportunities/offerings. We also suggest a cautious examination of academic placement decisions pertaining to ELLs, especially if the students have carried ELL classification for more than two years.
It is absolutely paramount for district leaders to ensure that the academic opportunities for language minority students are similar to those of English-only mainstream students. To this end, language minority students must be offered classes and experiences that serve as a gateway to post-secondary offerings.
4. Need for Uniformity and Further Discussion in Leadership Circles Drawing from our earlier discussion, there are two issues with the current flexibility in California’s (as well as other states’) policies regarding reclassification of ELLs. One issue is with the subjectivity and/or relevance of some of the measures used. Whether a student’s math grades should affect their classification and how (and if it is possible) to make teacher recommendations less subjective are two examples of this.
Another major problem is the lack of consistency among LEAs and among states. The idea that where a student lives could determine his or her learner status is troublesome. If one’s classification is as arbitrary as the place in which one is born, how can the classification be achieving its purpose? We argue that it cannot.
We challenge educational leaders to become a part of the policy conversation around classification and reclassification. There is work to be done, starting with conversations around the purpose of classification and reclassification. Designing curricula centered around student strengths and needs, with the intent of helping students develop the skills they do not have yet and deepen those they bring with them, is one important step. So is doing everything possible to avoid delaying students’ access to rigorous content material until language proficiency is reached. Designing assessment tools (or implementing the use of current ones) that consistently and accurately measure when students become likely to succeed in mainstream classes is critical.
In the absence of these conversations, California (along with many other states) has put the responsibility of making these determinations onto its LEAs. It is our hope that each LEA will use this opportunity to implement policies that are student centered and focused on social justice, and that district leaders will use their influence to bring these conversations to the fore among leaders in the state as a whole.
Educational Leadership Administration: Teaching and Program Development March 2018; Vol.29: Issue 1
11
References
Abedi, J. (2008). Classification system for English language learners: Issues and recommendations. Educational Measurement: Issues and Practice, 27(3), 17–31.
Cadiero-Kaplan, K., & Hernandez, D. (2014). Official letter: Academic criterion for reclassification. California Department of Education. Retrieved from: https://www.cde.ca.gov/sp/el/rd/acadreclass14.asp
Callahan, R.M. (2005). Tracking and high school English learners: Limiting opportunity to learn. American Educational Research Journal, 42(2), 305–328.
Cook, H.G. & Linquanti, R. (2015). Strengthening policies and practices for the initial classification of English learners: Insights from a national working session. Washington, DC: Council of Chief State School Officers. Retrieved from https://eric.ed.gov/?id=ED565758
Fong, A. B., Bae, S., & Huang, M. (2010). Patterns of student mobility among English language learner students in Arizona public schools (No. 093). Regional Education Laboratory West. Retrieved from http://files.eric.ed.gov/fulltext/ED512415.pdf
Gándara, P. (2015). The implications of deeper learning for adolescent immigrants and English language learners. Boston, MA: Jobs for the Future.
Gándara, P. (2017). The potential and promise of Latino students. American Educator, 41(1), 4–11. Retrieved from https://files.eric.ed.gov/fulltext/EJ1137807.pdfGándara, P., Rumberger, R., Maxwell-Jolly, J., & Callahan, R. (2003). English learners in
California schools: Unequal resources, unequal outcomes. Education Policy Analysis Archives, 11(36). Retrieved from http://citeseerx.ist.psu.edu/viewdoc/download?doi=10.1.1.510.9734&rep=rep1&type=pdf
Gay, G., & Kirkland, K. (2003). Developing cultural critical consciousness and self-reflection in preservice teacher education. Theory Into Practice, 42(3), 181–187.
Jepsen, C., & de Alth, S. 2005. English learners in California schools. San Francisco, CA: Public Policy Institute of California. Retrieved from http://www.ppic.org/content/pubs/report/R_405CJR.pdf.
Kanno, Y., & Harklau, L. (2012). Linguistic minority students go to college: Preparation, access, and persistence. New York, NY: Routledge.
Kanno, Y., & Kangas, S. E. N. (2014). “I’m not going to be, like, for the AP”: English language learners’ limited access to advanced college-preparatory courses in high school. American Educational Research Journal, 51(5), 848–878.
Kim, J., & Herman, J. L. (2010). When to exit ELL students: Monitoring subsequent success and failure in mainstream classrooms after ELLs’ reclassification (No. 779). The National Center for Research on Evaluation, Standards, and Student Testing.
Miller, J. M. (2000). Language use, identity, and social interaction: Migrant students in Australia. Research on Language and Social Interaction, 33(1), 69–100.
National Center for Education Statistics. (2017). English language learners in public schools. Washington, DC: U.S. Department of Education.
Núñez, A.-M., Rios-Aguilar, C., Kanno, Y., & Flores, S. M. (2016). English learners and their transition to postsecondary education. In M. B. Paulsen (Ed.), Higher education: Handbook of theory and research (pp. 41–90). Cham, Switzerland: Springer.
Educational Leadership Administration: Teaching and Program Development March 2018; Vol.29: Issue 1
12
Ogbu, J. U. (1999). Beyond language: Ebonics, proper English, and identity in a Black-American speech community. American Educational Research Journal, 36(2), 147–184.
Okhremtchouk, I. S. (2014). Classifying language-minority students: A closer look at individual student data. Bilingual Research Journal, 37(3), 327–348.
Okhremtchouk, I. S., Archibeque, R., Clark, A., Baca, E. C., & Sellu, G. S. (2016). Sentenced for life: An analysis of district reclassification criteria for English language learners
in California. Paper presented at American Education Research Association (AERA), Washington, DC.
U.S. Department of Justice Civil Rights Division, & U.S. Department of Education Office for Civil Rights. (2015). Ensuring English learner students can participate meaningfully and equally in educational programs. Retrieved from https://www2.ed.gov/about/offices/list/ocr/docs/dcl-factsheet-el-students-201501.pdf
U.S. Government Accountability Office. (2010). Report to Congressional requesters: Many challenges arise in educating students who change schools frequently. Retrieved from https://www.gao.gov/assets/320/312480.pdf
Educational Leadership Administration: Teaching and Program Development March 2018; Vol.29: Issue 1
13
Appendix A
Definition of Terms
Term Definition English Language Learners (ELLs)
In California, a student is classified as English language learner when a primary language other than English is reported on the state-approved Home Language Survey (HLS) and the student is consequently identified (through state and/or local assessments) as lacking the necessary reading, writing, speaking, and listening skills to be successful in mainstream instructional programs.
Initially Fluent English Proficient (I-FEP)
A student with a primary language other than English who through state and/or local assessment is determined to be fluent in the target language.
Reclassified Fluent English Proficient (R-FEP)
A language minority student who was initially classified as ELL but is subsequently reclassified according to the multiple criteria, standards, and procedures adopted by the district of attendance (in California), which requires demonstration of target language proficiency comparable to that of an average native English speaker.
Language Minority The term language minority student includes all subgroups of language minority students with varying levels of English and home language proficiencies, including those who are fully bilingual (Okhremtchouk, 2014). As such, for the purposes of this article, students who are classified as IFEP/FEP, ELL, and RFEP all fall under the language minority category.
Home Language Survey (HLS)
The HLS is a survey that is typically used upon new school enrollment to determine the primary language(s) spoken in the home of a student. The purpose of the survey is to determine which students may need further assessment for ELL support services.
Educational Leadership Administration: Teaching and Program Development March 2018; Vol.29: Issue 1
14
Is It Rational or Intuitive? Factors and Processes Affecting School
Superintendents’ Decisions When Facing Professional Dilemmas
Walter H. Hart, Ed.D. Winthrop University
Abstract
Given the critical impact of their decisions and of the community’s perception of their performance, it is reasonable that school superintendents would seek to understand the factors that influence their decisions and the processes used to make them. The researcher in this study used a qualitative approach, interviewing 13 school superintendents about the factors that affected their decisions and the extent to which they utilized a rational or intuitive decision-making model. The results show that superintendents’ decisions are influenced by the belief that they must safeguard the interests of students, by their perceptions about community acceptance of their decisions, and by the advice of trusted consultants. Their responses suggested that superintendents blend a rational approach with their intuition when making decisions, a strategy that mimics dual process approaches.
Educational Leadership Administration: Teaching and Program Development March 2018; Vol.29: Issue 1
15
Every aspect of an organization’s success depends upon leaders making effective decisions. Hiring and retaining personnel, long-range planning, goal setting, resolving conflict, professional development, and budgeting are just a few examples of functions that depend upon quality decisions, and within every major decision lies the opportunity for success or failure (Lunnenburg & Ornstein, 2012).
Before we delve into this matter, it is important to clarify some key terms. A decision is a choice among alternatives; decision making is the process used to make that choice. Because decision making is part of all administrative functions, effective leaders must be adept at this skill (Kowalski, 2013). Individuals occupying mid-level management positions often rely on established policies to guide their actions, making what Lunnenburg and Ornstein (2012, p. 136) call “programmed decisions.” Kasten and Ashbaugh (1988) found that whereas routine programmed decisions required discretion, enforcing existing policy is less challenging than the creative problem solving and complex decision making that executives engage in when facing professional dilemmas. Unlike routine decisions, a dilemma is a predicament for which there is no clear solution, unclear or nonexistent policy, and typically no precedent (Hoy & Tarter, 2008). Executives at the highest level of the organizational hierarchy frequently face dilemmas (Agor, 1985).
Like CEOs in major organizations, school superintendents frequently face dilemmas (Touchton & Acker-Hocevar, 2011). Limited resources, relations with elected boards, conflicting community values, teacher performance issues, and curriculum changes are just a few examples of such challenges (Noppe, Yager, Webb, & Sheng, 2013). Dilemmas faced by superintendents often stem from political and external forces that manifest through state and federal mandates. Dilemmas require creative thinking and may cause discrepancies between the superintendents’ values and the organization’s expectations. Superintendents are committed to following the rules of the organization, a belief system called the “standard administrative orientation” (Langlois, 2004, p. 78). Experienced superintendents understand the difficulties associated with resolving dilemmas and develop mechanisms for coping with this uncertainty (Langlois, 2004). In fact, superintendents must learn to accept ambiguity and conflict (Litchka, Fenzel, & Polka, 2009).
The lively nature of organizations, coupled with the multiple demands placed on executives, requires efficient and logical decision making. The traditional response to this challenge has been to use rational analysis, a process taught in leadership programs for decades (Sadler-Smith & Shefy, 2004). However, Sadler-Smith and Shefy (2004) suggested that the limits of rational models require decision makers to also utilize intuitive approaches, combining two seemingly contradictory models of decision making: rational and intuitive. This “blended” approach is captured through a variety of dual processing theories that have emerged since the 1990s (Akinci & Sadler-Smith, 2012). Although they use a different terminology, these theories advance the idea that our brains use rationality and intuition in tandem to facilitate effective decision making (Salas, Rosen, & DiazGranados, 2010). Context also plays a role in determining which approach is best for a given situation. The experience and beliefs of the leader, the demands (or lack of) from the community, and the level of impact of a decision are some of the contextual factors that leaders consider when determining which decision-making approach to utilize (Khakheli & Morchiladze, 2015).
Given the complex demands on schools, superintendents continuously face professional dilemmas. Although other models/theories have been put forward (Domagoj, 2015), the rational model and the intuitive approach emerge as two opposite ends of the decision-making spectrum.
Educational Leadership Administration: Teaching and Program Development March 2018; Vol.29: Issue 1
16
If, as Sadler-Smith and Shefy (2004) suggest, leaders should integrate both models when making decisions, then considering the factors that affect which method is considered by superintendents would seem worthy of further study. Furthermore, examining the extent to which superintendents utilize a rational process versus their intuition and under what circumstances would also be of interest.
Related Research
The Rational Versus the Intuitive Approach
The rational approach. Peter Drucker (1967) argued that effective executives made decisions by using a systematic process. The rational model requires a step-by-step approach, including problem definition, generating alternatives, and implementing a solution after examining all options (Kowalski, 2013). This model is based on the notion that decision makers will have the time and insight needed to uncover different options and predict the outcomes of each. Tanner and Williams (1981) argued that the rational approach was popular because of its focus on accomplishing goals by minimizing subjectivity and political influence.
However, Simon (1993) found limits to the rational model. Specifically, decision makers do not always have the time or abilities to fully comprehend the problem, search for multiple solutions, and accurately predict the possible outcomes. Therefore, Simon introduced the process of “satisficing” to describe when administrators use intuition, advice from others, experience, and creativity to develop compromise solutions. Kowalski (2013) and Lunenburg (2010) noted that the conflicting demands placed on school administrators and the political context in which they work cause them to engage in satisficing behaviors by implementing acceptable (rather than ideal) solutions.
The intuitive approach. The definition of “intuition” continues to be refined, as the theoretical research base becomes more nuanced over time (Akinci & Sadler-Smith, 2012; Volz & Zander, 2014). Intuition has been described as a quick, affectively charged, subconscious understanding of a complex situation related to experience-based, holistic associations (Dane & Pratt, 2007; Myers, 2002), which can serve as a catalyst for or a warning against quick action (Goleman, 1988). Sadler-Smith and Shefy (2004) noted that intuition is instinctive, and that decision makers find it difficult to describe their reasons for intuitive decisions beyond noting how they felt. Recent developments in neuroscience, particularly the use of brain imaging, have enhanced our understanding of intuition (Dreyfus, 2010). Kandel (2007) noted that all mental functions, including memory, stem from physiological processes and molecular events, many of which are nonconscious. Neurological research also suggests a link between emotions and intuition, as the neural mechanisms that play a central role in engendering the associations that spur intuitive judgments are aroused by positive affective stimuli (Koch, 2015; Liberman, 2007).
Our comprehension of the role of intuition in decision making also continues to be refined. Several studies have noted that executives make decisions based on intuition (Hayashi, 2001; Hensman & Sadler-Smith, 2011; Mintzberg, 1988; Sadler-Smith & Shefy, 2004). However, Campbell, Whitehead, and Finkelstein (2009) found that executives admitted that their intuition is often wrong. For example, individuals may overemphasize the occasions in which their intuition was accurate, causing excessive confidence in their ability to make effective decisions (Kahneman & Klein, 2009). Individuals may also see patterns where none exists or take unnecessary risks to compensate for a disappointing loss (Campbell et al., 2009).
Educational Leadership Administration: Teaching and Program Development March 2018; Vol.29: Issue 1
17
Despite its limitations, however, intuition plays an important role in decision making. Ignoring the intuitive feel that something is not right can result in the implementation of bad decisions, whereas the overemphasis on data analysis suggested by the rational model can result in missed opportunities (Hayashi, 2001). Intuition may also be integral to completing complex tasks with short time horizons (Crandall, Klein, & Hoffman, 2006). Combining intuition with objective analysis can result in an effective management style in which intuitive judgments are intelligently used (Haidt, 2001). The Influence of Context Regardless of which approach is used, the existing literature has long noted the importance of context as a factor in decision making. In the 1970s, Vroom and Yetton (1973) argued that the social context surrounding a decision influences its outcome and acceptance, claiming that the best approach for resolving a dilemma is dependent upon situational variables including problem complexity, time availability, leader and follower understanding, and the impact of the decision on subordinates. Argyris and Schön (1974) suggested a possible link between beliefs, decisions, and intuition, as individuals often state that their beliefs guide their actions. However, Argyris and Schön also noted that tacit knowledge often affects decisions in ways that do not always align with those stated beliefs. More recently, Kahneman and Klein (2009), proponents of the naturalistic decision making approach, noted a link between the decision maker’s experience with a particular environment and the effectiveness of the resulting decision. Salas et al. (2010) also described the level of expertise as a contextual factor, arguing that intuition becomes more useful as the decision maker’s expertise within a specific domain increases.
This research project was designed to further investigate the factors that affect superintendent decision making and the extent to which their decision-making processes reflect rational or intuitive models. The researcher sought to answer the following questions:
1. What factors affect school superintendents’ decisions when resolving professional dilemmas?
2. To what extent are those decisions based on rational or intuitive processes?In this era of heightened accountability, increasing competition between public and private
schools, and growing privatization efforts (such as charter schools and voucher systems), superintendents are going to continue to face unprecedented dilemmas. Given the critical and widespread impact of their decisions, understanding the factors and processes that affect them is a salient issue.
Method
Understanding the nature of decision making requires engaging in dialogues in which participants can elaborate upon their responses. Therefore, this study involved a qualitative design, which is appropriate when there exists a need to better understand “the nature of persons’ experiences with a phenomenon” (Strauss & Corbin, 1990, p. 19). I conducted the research at an institution in the southeastern region of the United States that prepares teacher and school administrator candidates. Here, I conducted semi-structured interviews with 13 school superintendents in spring 2017. The interviews lasted for about 45 minutes and took place in the participants’ offices. Participants were selected from a convenience sample of North and South
Educational Leadership Administration: Teaching and Program Development March 2018; Vol.29: Issue 1
18
Carolina superintendents because of their familiarity with the researcher. Thirteen participants from districts ranging in size from 4,000 to 150,000 students were invited to participate; all contributed to the study. Seven participants (54%) were from North Carolina and six (46%) were from South Carolina. Eight males (62%) and five females (38%) participated; one (8%) participant was African-American and the rest (92%) were White.
Interview questions were developed according to the rational decision-making framework described by Kowalski (2013) and the use of intuition described by Sadler-Smith & Shefy (2004). I hypothesized that recommendations for how to best navigate decision making for superintendents would require an understanding of the extent to which rational and intuitive processes influenced their decisions. To this end, I designed questions targeting the superintendents’ perceptions of the types of dilemmas they find most challenging, their good and bad experiences with decision making, the factors they consider when making decisions, and the advice they would provide to a beginning superintendent. Finally, I speculated that the superintendents’ perceptions of how others in the same role make decisions would provide information about the culture of superintendent decision making in general.
I analyzed the data collected from the interviews using a grounded theory approach (Glaser, 1992). Individual responses to the interview questions were grouped together, and the responses in each group were independently analyzed line by line. In keeping with Saldana’s (2013) suggestions, I conducted two rounds of coding.
Results
Factors Affecting Superintendents’ Decisions Three themes emerged in response to the first research question regarding the factors that affected participants’ decisions. The most dominant factor was the participants’ beliefs about what is best for children. Next came their predictions about how the community would react, as conveyed through the lens of the board of education. Finally, the participants gave much weight to advice from trusted colleagues.
Students first. The participants’ most frequent response about the factors affecting their decisions was the belief that they should do what is best for students. The participants felt responsible for the students’ well-being, with this responsibility taking precedence over the concerns of adults. Words like “belief,” “guiding principle,” and “duty” were used to illustrate this point. Participant 8 said: “I have to do what is in the best interest of students. It’s like a personal, moral compass.” The participants also said that they faced dilemmas when teachers and principals wanted to address problems without keeping the interests of students as their main concern, with this type of situation typically resulting from a disagreement about the interpretation of policies. Participant 2 stated: “When it is a student issue, it may not be what the adults agree with, but I am going to make a decision that is in the best interest of the student.”
The participants’ responses about their empathy for the students led to follow-up questions investigating how they would know that their judgment was more accurate than that of adults with whom they disagreed. Their responses suggested that they perceived themselves to be objective when addressing such challenges because they were removed from the immediacy and emotions of the situation. Participant 13 described asking others to consider a personal perspective when addressing student issues:
Educational Leadership Administration: Teaching and Program Development March 2018; Vol.29: Issue 1
19
The test is, if this were for your child, would you feel differently about the solution we are coming up with. The answer should be no. When it becomes personal, you take a broader view than you might when it is somebody else’s child. The participants noted that when facing disagreements about student issues they would
often seek input from those with expertise, such as legal counsel, curriculum specialists, or other district officials. Doing so helped to ensure they would balance policy guidelines with the best interest of the students. Participant 13, noted that it is challenging to make decisions that adhere to established policies when those policies do not always effectively account for individual student needs: “How do we honor our policy and get to a situation we can stand on but allow a solution to support a child?”
The public context. The responses revealed that the participants were influenced by how they thought stakeholders would respond to their decisions. Participant 6 noted: “I am constantly thinking about how the city council is going to react.” Participant 9 said: “You earn the trust of the community every day. Decisions we make cannot erode that trust.”
The participants described seeking input from those who were going to be affected by their decisions, a process that Participant 13 called “360-degree decision making.” They believed that doing so increased decision acceptance while decreasing mistakes. Several participants attributed negative stakeholder reactions to decisions to not gathering sufficient input. Participant 3 recalled misjudging how poorly a seemingly innocuous decision would be received: “We did not vet or educate or get feedback from every level of the organization to build understanding. The teachers misunderstood our intentions. The miscommunication snowballed. It became a big deal.” Participant 4 said: “If you are going to make a good decision, and it is going to affect a lot of people, you have to make that decision with the input of a lot of people.”
As boards of education represent community views, the participants said that they sometimes consulted with their boards when facing dilemmas and tried to anticipate how they would react to various proposals. The participants said that discretion was required about when to consult, because the board might have to serve as an appeals panel in student or employee discipline cases. When asked who influenced his decisions, Participant 2 responded, “My team, and all the people around me. The principals. And the board. The board forces their will. Everything I do I am thinking about what the board is going to think. They are omnipresent.”
When discussing public context, the participants described satisficing behaviors, seeking workable but not necessarily ideal solutions. Participant 1 said: “There isn’t just one right answer. You go through a process to come up with the best answer you can.” Participant 2 commented: “You implement the solution that is the win-win.” Participant 3 noted: “No matter what we do somebody isn’t going to like it. There’s the right decision and then there’s the one the community may like more or less.” Participant 5 said:
I wrote a budget plan and delivered it to the board and to a public hearing. The process of multiple steps and involving a lot of people gave us a result we could live with. We didn’t necessarily like it, but we could live with it. Consulting counts. Another theme to emerge was that the participants’ decisions were
influenced by the opinions of advisors, frequently district leaders and fellow superintendents. Participant 6 said: “Surround yourself with good people and listen to them.” Participant 12 said: “I value input and I’m ok with disagreement. I tell my folks to not let us fall into a hole that you saw.” Participant 5 said: “I try to build a strong cabinet and I tell them, ‘Don’t say yes to me. We will get in trouble quickly if you are all yes people.’”
Educational Leadership Administration: Teaching and Program Development March 2018; Vol.29: Issue 1
20
The participants said they often consulted with other superintendents who had faced similar dilemmas. Participant 5 said: “I have close superintendents that I talk with. I ask them, ‘So what do you think about this?’ I have one who thinks totally differently than me and thinks of things I would have never thought of.” Participant 4 added: “I have a group of superintendent mentors I look to. I ask if they have ever experienced it before. I want to know how they handled it.”
Decision-Making Processes Used by Superintendents Two themes surfaced in response to the question about whether superintendents use rational or intuitive processes. First, more deliberate (rational) processes were used when time was not a limiting factor. Second, participants’ decision making incorporated elements of the rational model with superintendents’ experience-based intuition.
Context of time as a factor. Responses suggested that the nature of dilemmas influenced the decision-making process. Crises involving safety were resolved in a quick, autocratic manner with limited input from others. When a quick response was not necessary, participants consulted with others using a more deliberate process to clarify the problem and identify and analyze possible solutions. Participant 2 said: “I make the decision if it involves safety or law. I use participatory management when I need to get input and involve stakeholders and I need to hear different perspectives.” Participant 3 described an approach that is used when time is not a factor:
We use a decision-making process. It does two things. One is, hey, what are all the issues? Let’s get them out on the table. The other is, we have options. Let’s put them on the table and make a decision. Sometimes it is hard to buy into, but when you are finished there is a decision. Rational intuition. The second theme to emerge was that participants used a blended
process when facing dilemmas. They described integrating a rational approach and their intuition, with neither used at the complete exclusion of the other. Whereas a rational approach was used to clarify the problem and analyze solutions, a decision still had to be made about which solution to implement. Although participants were informed through dialogue and analysis, their intuition considerably affected the choice of which option to implement.
To illustrate the blending of intuition and methodical processes, the participants described times when they felt an unexpected sense of clarity about the best solution for a dilemma that was being methodically analyzed. They noted that they were not certain why this phenomenon, which happened at unusual times and places, would occur. However, their descriptions suggested that intuition manifested itself during times of reflection. They used phrases like “gut feeling,” “it hit me,” or “something was nagging” when describing intuition.
Participant 8 illustrated this theme: I tend to take my time and be reflective and talk to people and let the dust settle and then see if two weeks from now I feel the same way. When I act quickly I don’t feel as good about a decision. One option emerges if I allow the process to take its time. Participant 5 noted: For me, it’s in the middle of the night or in the shower in the morning. I worry and worry and go over something in my mind and then it hits me and I think about it another way. I really wish I knew why it happened. If I did I would do it more often.
Educational Leadership Administration: Teaching and Program Development March 2018; Vol.29: Issue 1
21
Participant 2 observed: I always try to look at it from the approach of, “Is there a win-win?” You are wrestling for a win-win and have a mental process going on to come up with a solution. It will hit me that we could do that. Maybe it’s divine intervention. I don’t know other than it’s just there. Participant 9 described an intuitive moment that occurred after thoughtful consideration
of how to resolve performance concerns affecting two employees: “It hit me driving to work one morning [snaps fingers], we need to flip these two folks [have them switch assignments]. I was getting ready to dismiss both of them. Now, it works great.”
Participants with lengthier tenures in their districts related intuition to a compilation of learning experiences, believing that they were more intuitive as veteran superintendents. Participant 8 said: “I don’t even remember the specifics, but I will get that intuitive feeling when something comes up that this has the potential to bite somebody if we don’t handle it a certain way. I know it’s from past experiences.” Participants with lengthier tenures believed their experiences helped them to anticipate concerns and predict outcomes. Participant 6 noted: “I trust my gut. I trust the history. I try to remember where we have been and what the community would think is a good decision.” Participant 9 commented: “As long as I have been doing this… I can predict. Anytime I do a presentation for our board, I anticipate the questions so that in the presentation those questions are answered.” Participant 13 added: “I have years of context, so it is hard to ignore that. I have a sense of how the community is going to respond.”
To summarize, in response to Research Question 1, the participants indicated that their decisions were affected by three primary factors. First, they believed that they were supposed to safeguard the children’s interests even if doing so created conflict with the adults. Next, their decisions were affected by the public context, which caused them to engage others and use satisficing behaviors. They were also influenced by the opinions of trusted advisors. In response to Research Question 2, the participants described blending a rational approach with their intuition, with experience positively affecting their intuition. The extent to which a methodical approach was used was dependent on the nature of the dilemma, particularly the amount of time available to make a decision.
Discussion
Superintendents face complex dilemmas, including increased accountability, diverse demands from students and staff, the explosion of technology, and conflicting views from governing boards and communities (Kowalski, McCord, Peterson, Young, & Ellerson, 2010). Complicating these challenges is the fact that stakeholders become emotionally invested, lobby for a particular outcome, and may express their dissatisfaction. The ability to resolve dilemmas is vital to the success of superintendents. This study adds to the understanding of this issue by identifying the factors that affect superintendents’ decisions and analyzing the extent to which their decision making involves intuitive or rational methods. The results provide guidance for superintendent preparation programs and for practicing superintendents.
This study identified three major factors affecting superintendents’ decisions. First, the superintendents exhibited the desire to safeguard the interests of students, a belief system referred to as “guiding principles” and “a moral compass.” They believed that they analyzed student situations more objectively than adults who were emotionally attached to the situation.
Educational Leadership Administration: Teaching and Program Development March 2018; Vol.29: Issue 1
22
Next, the superintendents were influenced by their perceptions about how constituencies would react to their decisions. They had to make decisions that met broad organizational goals while balancing the perceived needs of constituents with different priorities, which caused them to seek pragmatic and generally acceptable solutions to dilemmas. Finally, the public context often caused the superintendents to mimic Vroom-Yetton’s (1973) consultation model by seeking advice from district officials, community representatives, or other superintendents.
The second question aimed at understanding the extent of superintendents’ use of a rational or intuitive approach. The superintendents in this study blended a rational process with their intuition, an approach advocated by Hoyle, Bjork, Collier, and Glass (2005) and Sadler-Smith and Shefy (2004). They began with a rational approach like that described by Hoy and Tarter (2008), in which problems are clarified and potential solutions are vetted. In some cases, this process was informal, whereas in others it was rather scripted. Either way, trusted consultants shared information, suggested solutions, and provided feedback because the superintendents believed this would help them avoid mistakes they might make if they approached the dilemma in isolation. However, after reviewing such feedback, the superintendents ultimately had to decide which solution to implement, and no matter how deliberate and objective the analysis, uncertainty surrounded this act, since there were no guarantees of one “right answer.” It was at this point that the superintendents relied on their intuition about what would work successfully. This intuition, which the superintendents believed was more effective as their tenures increased, created familiarity with the nuances of their districts and a savviness about how to proceed, a phenomenon that aligns with Salas et al.’s (2010) description of expertise-based intuition. When their experiences were limited, the superintendents sought advice from other superintendents, thereby utilizing the intuition of others. The superintendents reported that when they allowed time for reflection and introspection about alternatives, they often had an unexplained aha moment in which the best solution became clear. The superintendents’ intuitive understanding about the chances of acceptance influenced which of the rationally developed and objectively analyzed solutions they would implement. Therefore, it was not a matter of using either rational decision making or intuition: The superintendents blended both, in frequent consultation with advisors, and in ways that aligned with dual process theories.
Several recommendations arise from these findings. Preparation programs should emphasize the rational decision making and intuitive practice needed for effective decision making. There are several ways to do this, including the use of case studies, debate, reflective writing assignments, and clinical internships. Candidates should practice resolving mock dilemmas that mimic the complexity, liveliness, and ambiguity of those faced by superintendents.
The rational decision-making model, with its emphasis on objectively creating and analyzing solutions, should be utilized as an effective starting point. However, aspiring superintendents should also receive training on the role of intuition and understand the inevitable influence of their experiences and biases on the decision-making process. Sustained clinical internships in which they observe and assist veteran superintendents resolving actual dilemmas would be especially helpful. Finally, candidates must master the skills needed to facilitate the involvement of others, because this study demonstrated that superintendents found consultation to be important when they faced dilemmas.
Educational Leadership Administration: Teaching and Program Development March 2018; Vol.29: Issue 1
23
Several recommendations arise for practicing superintendents. First, they should seek to understand their own decision making, realizing that there are advantages to blending the rational approach with their intuition. The superintendents in this study often attributed bad decisions to the failure to adequately involve others in a rational process, and in some cases, the failure to effectively utilize their intuition. Allowing time for reflection and gathering stakeholder input are helpful strategies for resolving these problems. Next, superintendents need to recognize the situational nature of dilemmas, whereby some require a rapid response whereas others demand more deliberate, methodical, and reflective action. Finally, this study illustrated that the effectiveness of decisions was affected by the involvement of quality advisors. Therefore, superintendents need to develop a network of internal and external advisors to provide insight and challenge their own thinking. These shared support systems would allow superintendents to network, share ideas, and debrief about dilemmas. Finally, superintendents must establish community relationships that will help them to understand norms that must be considered and to increase the acceptance of their decisions.
There are several limitations in this study. The small numbers of participants in a convenience sample lessens generalizability. The participants were all from a geographic region that has experienced similar budget and accountability challenges, which may have affected responses. The qualitative results, although informative, would be enhanced by a quantitative study capable of randomization and a more robust sample size. Further research should consider the impact of additional factors on superintendent decisions, such as (a) gender, (b) length of service, (c) district size, (d) presence of the school on academic watch lists, and (e) superintendents’ values.
Effective decision making has always been vital to the success of school superintendents. Making the superintendents’ role unique is the critical impact of their decisions as well as the ambiguity, risk, and heightened stakeholder sentiments that characterize them. As the demands on schools continue to increase, the superintendents’ ability to make effective decisions when facing professional dilemmas will continue to be a cornerstone of good leadership.
Educational Leadership Administration: Teaching and Program Development March 2018; Vol.29: Issue 1
24
References
Agor, W. H. (1985). Intuition as a brain skill in management. Public Personnel Management, 14(1), 15–24.
Akinci, C., & Sadler-Smith, E. (2012). Intuition in management research: A historical review. International Journal of Management Reviews, 14, 104–122. doi:10.1111/j.1468-2370.2011.00313.x
Argyris, M. & Schön, D. (1974). Theory in practice: Increasing professional effectiveness. San Francisco, CA: Jossey-Bass.
Campbell, A., Whitehead, J., & Finkelstein, S. (2009). Why good leaders make bad decisions. Harvard Business Review, 87(2), 60–66. Retrieved from https://hbr.org/2009/02/why-good-leaders-make-bad-decisions
Crandall, B., Klein, G., & Hoffman, R.R. (2006). Working minds: A practitioner’s guide to cognitive task analysis. Cambridge, MA: MIT Press.
Dane, E., & Pratt, M. (2007). Exploring intuition and its role in managerial decision making. The Academy of Management Review, 32(1), 33–54. Retrieved from
http://www.jstor.org/stable/20159279 Domagoj, H. (2015). Radical decision making: Leading strategic change in complex
organizations. New York, NY: Palgrave MacMillan. Dreyfus, S. (April, 2010). Neuroscience and operations research: a two-way street [online
forum]. Operations Research Management Science Today. Retrieved from http://www.orms-today.org/orms-4-10/frforum.html
Drucker, P. F. (1967). The effective decision. Harvard Business Review, 45(1), 92–98. Glaser, B. G. (1992). Basics of grounded theory analysis: Emergence vs. forcing. Mill Valley,
CA: Sociology Press. Goleman, D. (1998). Working with emotional intelligence. New York, NY: Bantam Books. Haidt, J. (2001). The emotional dog and the rational tail: A social intuitionist approach to moral
judgment. Psychological Review, 108(4), 814–834. doi:10.1037/0033-295X.108.4.814 Hayashi, A. (2001). When to trust your gut. Harvard Business Review, 79(2), 58–62. Hensman, A., & Sadler-Smith, E. (2011). Intuitive decision making in banking and finance.
European Management Journal, 29(1), 51–66. Hoy, W. K., & Tarter, C. J. (2008). Administrators solving the problems of practice: Decision-
making cases, concepts, and consequences (3rd ed.). Boston, MA: Pearson. Hoyle, J. R., Bjork, L. G., Collier, V., & Glass, T. (2005). The superintendent as CEO. Thousand
Oaks, CA: Corwin Press. Kahneman, D., & Klein, G. (2009). Conditions for intuitive expertise: A failure to disagree.
American Psychologist, 64(6), 515–526. doi:10.1037/a0016755 Kandel, E. (2007). In search of memory: The essence of a new science of mind. New York, NY:
W.W. Norton & Co. Kasten, K., & Ashbaugh, C. (1988). A comparative study of values in administrative decision
making. Journal of Research and Development in Education, 21(3), 16–23. Khakheli, M., & Morchiladze, G. (2015). Factors affecting decision making in an organization.
International Journal of Management and Commerce Innovations, 3(1), 425–428. Koch, C. (2015). Intuition may reveal where expertise resides in the brain. Scientific American.
Educational Leadership Administration: Teaching and Program Development March 2018; Vol.29: Issue 1
25
Retrieved from https://www.scientificamerican.com/article/intuition-may-reveal-where-expertise-resides-in-the-brain
Kowalski, T. J. (2013). The school superintendent: Theory, practice and cases. Thousand Oaks, CA: Sage Publications.
Kowalski, T. J., McCord, R. S., Petersen, G. J., Young, I. P., & Ellerson, N. M. (2010). The American school superintendent: 2010 decennial study. Lanham, MA: Rowan & Littlefield Education.
Langlois, L. (2004). Responding ethically: Complex decision-making by school district superintendents. International Studies in Educational Administration (ISEA), 32(2), 78–93.
Lieberman, M. D. (2007). Social cognitive neuroscience: A review of core processes. Annual Review of Psychology, 58, 259–289. doi:10.1146/annurev.psych.58.110405.085654
Litchka, P., Fenzel, M. L., & Polka, W. (2009). The stress processes among school superintendents. International Journal of Educational Leadership Preparation, 4(4), 1–7.
Lunenburg, F. C. (2010). The decision making process. National Forum of Educational Administration and Supervision Journal, 27(4), 1–12.
Lunenburg, F. C., & Ornstein, A. C. (2012). Educational administration: Concepts and practices (6th ed.). Belmont, CA: Wadsworth Cengage Learning.
Mintzberg, H. (1988). The nature of managerial work. Reading, MA: Addison-Wesley. Myers, D. (2002). Intuition: Its powers and perils. New Haven, CT: Yale University Press. Noppe, R., Yager, S., Webb, C., & Sheng, B. (2013). Decision making and problem-solving
practices of superintendents confronted by district dilemmas. International Journal of Educational Leadership Preparation, 8(1), 103–120.
Sadler-Smith, E., & Shefy, E. (2004). The intuitive executive: Understanding and applying “gut feel” in decision making. Academy of Management Executive, (18)4, 76–91. doi:10.5465/AME.2004.15268692
Salas, E., Rosen, M., & DiazGranados, D. (2010). Expertise-based intuition and decision making in organizations. Journal of Management, 36(4), 941–973. doi: 10.1177/0149206309350084
Saldaña, J. (2013). The coding manual for qualitative researchers (2nd ed.). Thousand Oaks, CA: Sage Publications.
Simon, H. A. (1993). Decision making: Rational, nonrational, and irrational. Educational Administration Quarterly, 30(1), 97–101. doi:10.1177/0013161X93029003009
Strauss, A., & Corbin, J. (1990). Basics of qualitative research: Grounded theory procedures and techniques. Newbury Park, CA: Sage Publications.
Tanner, C. K., & Williams, E. J. (1981). Educational planning and decision making: A view through the organizational process. Lexington, MA: D.C. Heath.
Touchton, D., & Acker-Hocevar, M. (2011). Decision-making quandaries that superintendents face in their work in small school districts building democratic communities. Journal of School Public Relations, 32(3), 210–236.
Volz, K., & Zander, T. (2014). Primed for intuition? Neuroscience of Decision Making, 1, 26–34. doi:10.2478/ndm-2014-0001
Vroom, V. H., & Yetton, P. W. (1973). Leadership and decision making. Pittsburgh, PA: University of Pittsburgh Press.
Educational Leadership Administration: Teaching and Program Development March 2018; Vol.29: Issue 1
26
Job Embeddedness May Hold the Key to the Retention of Novice Talent in
Schools Jennifer Moradian Watson
California State University, Fresno
Abstract
Teacher retention has been studied for decades, yet it has recently assumed renewed significance due to current teacher shortages. This study was designed to determine whether teachers’ job embeddedness (JE) is related to turnover. JE is found in organizational literature (Mitchell, Holtom, Lee, Sablynski, & Erez, 2001) and has been a robust predictor of retention across diverse groups of employees (Mallol, Holtom, & Lee, 2007) as well as among various countries and cultures (Lee, Burch, & Mitchell, 2014).
For this study, we surveyed over 143 teachers with less than five years of experience in three school districts in Central California, and we identified a correlation between retention and embeddedness through the use of multivariate analysis of variance. The results indicate that JE is indeed related to novice teacher retention.
Educational Leadership Administration: Teaching and Program Development March 2018; Vol.29: Issue 1
27
Large numbers of novice teachers leave education or their original school site at alarming rates. The highest rate of teacher attrition occurs in the first three years of teaching in the United States (Boe, Cook, & Sunderland, 2008). The National Center for Educational Statistics (NCES, 2010) reports that nationwide, 12% of new teachers (with one to three years of experience) left the profession within two years, and 23% left the profession within five years (NCES, 2015). Of the teachers surveyed in 2007 in the United States, another 10% changed schools the following school year. The National Center for Educational Statistics also found that certain subject areas—such as math, science, and special education—are more difficult to staff (Esch et al., 2005). Furthermore, this study noted that low-performing schools have higher proportions of underprepared and/or novice teachers than their higher-performing counterparts.
The negative outcomes caused by the high turnover rate among novice teachers in the United States (e.g., transition and recruitment costs) seem grave when coupled with the large number of retiring veteran teachers (U.S. Department of Labor, 2010) and the anticipated increase of K-12 students (NCES, 2014). The Bureau of Labor Statistics (2010) reports that an estimated 12% additional teachers will be needed in the K-12 school setting through 2022 across the country,2 especially in the southern and western regions. Thus, the retention of novice teachers has become an issue of great importance.
Prior educational research has found that teachers leave education for a variety of reasons, including changes in their personal circumstances (Grissmer & Kirby, 1987), dissatisfaction with the workplace conditions (Berry, 2008; Billingsly, 1993; Kukla-Acevedo, 2009; Thibodeaux, Labat, Lee, & Labat, 2015), and dissatisfaction with the students’ behaviors (Rochkind, Ott, Immerwahr, Doble, & Johnson, 2007). Other studies help to explain why some stay in education. These factors appear to play a key role: site leadership (e.g. Bogler, 2008; Brown & Wynn, 2009; Pogodzinksi, Youngs, Frank, & Belman, 2012), effective mentoring (Alliance for Excellent Education, 2014; Brill & McCartney, 2008; Dingus, 2008; Kapadia & Coca, 2007), helpful professional development (e.g. Eberhard, Reinhardt, & Stottlemeyer, 2000), and valued collegial relationships (e.g. Certo & Fox, 2002; Flores & Day, 2006; Warshauer & Appleman, 2009).
Despite the amount of attention given to the problem of teacher retention, understanding why novice teachers leave or stay continues to present a vexing challenge that affects any efforts to improve retention at the level of the school site, the school district, and the profession itself. The present study complements the research cited so far by suggesting another possible strategy to understand this issue: examining employee retention outside the field of education. Therefore, this study integrates the broader human resource management literature to scrutinize the utility of the concept of job embeddedness (JE). This construct focuses on organizational attachment factors that may keep employees in their position.
We first discuss below existing literature on the loss of human capital in education as well as the reasons some teachers leave or stay. Next, we review the JE construct and its use to study teacher turnover.
2 See http://www.bls.gov/ooh/education-training-and-library/kindergarten-and-elementary-school-teachers.htm#tab-6.
Educational Leadership Administration: Teaching and Program Development March 2018; Vol.29: Issue 1
28
Teacher Turnover and the Loss of Human Capital
Compelling evidence shows that teacher turnover depletes fiscal and human resources. The expenses accrued from teacher attrition are substantial, although with some variation among districts and states. Estimates of turnover costs per teacher range from $10,000 to $18,300. In 2007 The National Commission on Teaching and America’s Future (NCTAF) estimated the total annual costs of district turnover costs to be $7.2 billion (National Commission on Teaching and America’s Future, 2007), whereas a more recent study in 2014 found the annual costs to be $2.2 billion.3
The school site costs associated with the voluntary turnover and migration of teachers certainly pose numerous problems in education (Barnes, Crowe, & Schaefer, 2007; NCTAF, 2010; Shockley, Guglielmino, & Watlington, 2006). It is known that turnover costs reduce human and fiscal resources for site- and district-level administrators, further taxing an already overburdened system (Texas Center for Educational Research, 2000). Sites disburse fiscal and human resources each time a new teacher is added on staff, which is particularly problematic for urban public schools that each year lose 20% of their teachers.
Teacher turnover is further exacerbated by the emphasis on narrowing student learning gaps by ensuring the retention of high-performing teachers. Researchers such as Darling-Hammond (2000) have stated that well-prepared teachers can be a stronger influence on student achievement than a student’s background. However, the achievement gaps between the highest and lowest performing students persist (Haycock, 2001), and one factor may indeed be a teaching quality gap (Useem, Offenberg, & Farley, 2007) aggravated by a yearly influx of novice teachers. As Haycock (1998) notes, turnover in some schools, particularly urban schools, contributes to such inequity.
Based on the negative effects of turnover, heightened concerns about employee retention, and the loss of human capital due in part to the retirement of baby boomers, in the next section we discuss additional reasons for which some employees stay and others leave (Van Dyk, 2012).
Predictors of Turnover A strong predictor of student performance is teacher quality (Darling-Hammond, 2000; Rockoff, 2004). Schools with students with the highest need appear to endure the greatest teacher attrition (Boyd, Grossman, Lankford, Loeb, & Wyckoff, 2008). This problem has become more pronounced since 1994 (NCTAF, 2010), particularly for novice teachers. Researchers have primarily focused on the demographic characteristics of teachers who exit the field as well as on relevant predictive characteristics of the schools they work in and the students they work with.
Billingsly (1993) found that one of the most common problems is an inaccurate view of teacher responsibilities, that is, a disconnection between perceived and actual teacher duties. Additional research has found that teachers who are the least experienced (Boe et al., 2008; Guarino, Santibañez, & Daley, 2006) as well as the most academically able (based on college entrance scores) leave the profession at higher rates (Billingsley, 1993; Feng, 2005; Murnane et al., 1991). Murnane et al. (1991) and Borman and Dowling (2008) list the following
3 See https://all4ed.org/wp-content/uploads/2014/07/PathToEquity.pdf.
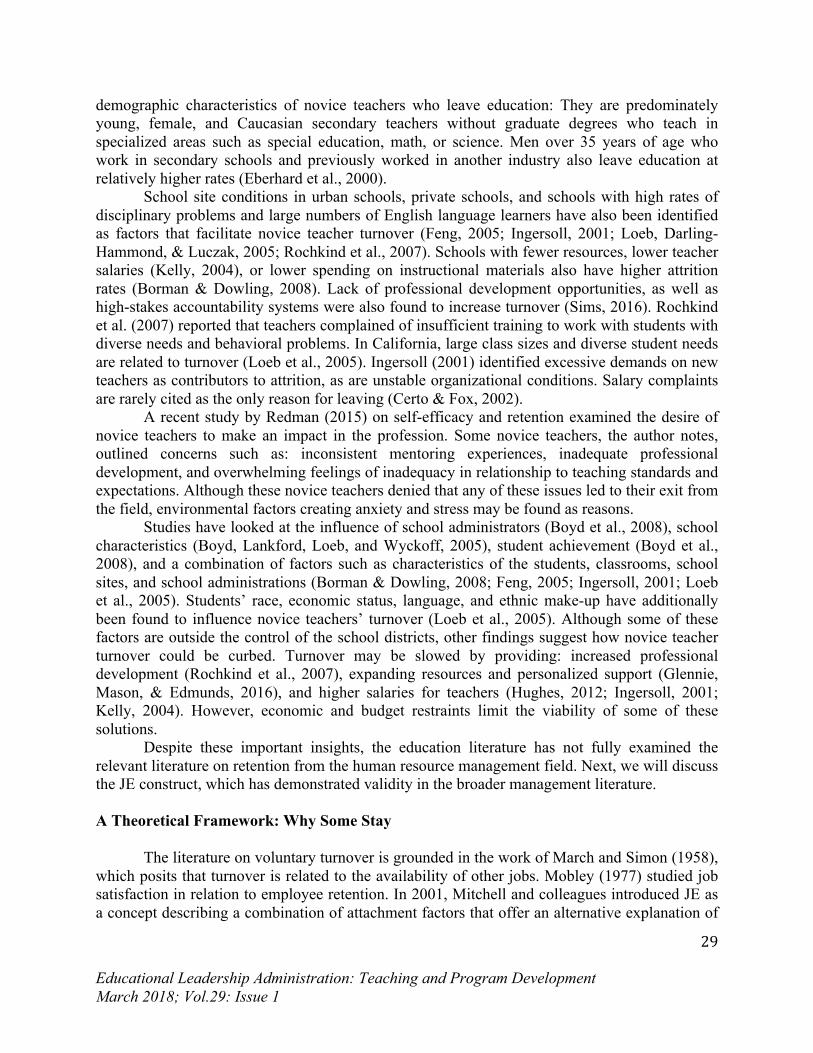
Educational Leadership Administration: Teaching and Program Development March 2018; Vol.29: Issue 1
29
demographic characteristics of novice teachers who leave education: They are predominately young, female, and Caucasian secondary teachers without graduate degrees who teach in specialized areas such as special education, math, or science. Men over 35 years of age who work in secondary schools and previously worked in another industry also leave education at relatively higher rates (Eberhard et al., 2000).
School site conditions in urban schools, private schools, and schools with high rates of disciplinary problems and large numbers of English language learners have also been identified as factors that facilitate novice teacher turnover (Feng, 2005; Ingersoll, 2001; Loeb, Darling-Hammond, & Luczak, 2005; Rochkind et al., 2007). Schools with fewer resources, lower teacher salaries (Kelly, 2004), or lower spending on instructional materials also have higher attrition rates (Borman & Dowling, 2008). Lack of professional development opportunities, as well as high-stakes accountability systems were also found to increase turnover (Sims, 2016). Rochkind et al. (2007) reported that teachers complained of insufficient training to work with students with diverse needs and behavioral problems. In California, large class sizes and diverse student needs are related to turnover (Loeb et al., 2005). Ingersoll (2001) identified excessive demands on new teachers as contributors to attrition, as are unstable organizational conditions. Salary complaints are rarely cited as the only reason for leaving (Certo & Fox, 2002).
A recent study by Redman (2015) on self-efficacy and retention examined the desire of novice teachers to make an impact in the profession. Some novice teachers, the author notes, outlined concerns such as: inconsistent mentoring experiences, inadequate professional development, and overwhelming feelings of inadequacy in relationship to teaching standards and expectations. Although these novice teachers denied that any of these issues led to their exit from the field, environmental factors creating anxiety and stress may be found as reasons.
Studies have looked at the influence of school administrators (Boyd et al., 2008), school characteristics (Boyd, Lankford, Loeb, and Wyckoff, 2005), student achievement (Boyd et al., 2008), and a combination of factors such as characteristics of the students, classrooms, school sites, and school administrations (Borman & Dowling, 2008; Feng, 2005; Ingersoll, 2001; Loeb et al., 2005). Students’ race, economic status, language, and ethnic make-up have additionally been found to influence novice teachers’ turnover (Loeb et al., 2005). Although some of these factors are outside the control of the school districts, other findings suggest how novice teacher turnover could be curbed. Turnover may be slowed by providing: increased professional development (Rochkind et al., 2007), expanding resources and personalized support (Glennie, Mason, & Edmunds, 2016), and higher salaries for teachers (Hughes, 2012; Ingersoll, 2001; Kelly, 2004). However, economic and budget restraints limit the viability of some of these solutions.
Despite these important insights, the education literature has not fully examined the relevant literature on retention from the human resource management field. Next, we will discuss the JE construct, which has demonstrated validity in the broader management literature.
A Theoretical Framework: Why Some Stay
The literature on voluntary turnover is grounded in the work of March and Simon (1958), which posits that turnover is related to the availability of other jobs. Mobley (1977) studied job satisfaction in relation to employee retention. In 2001, Mitchell and colleagues introduced JE as a concept describing a combination of attachment factors that offer an alternative explanation of
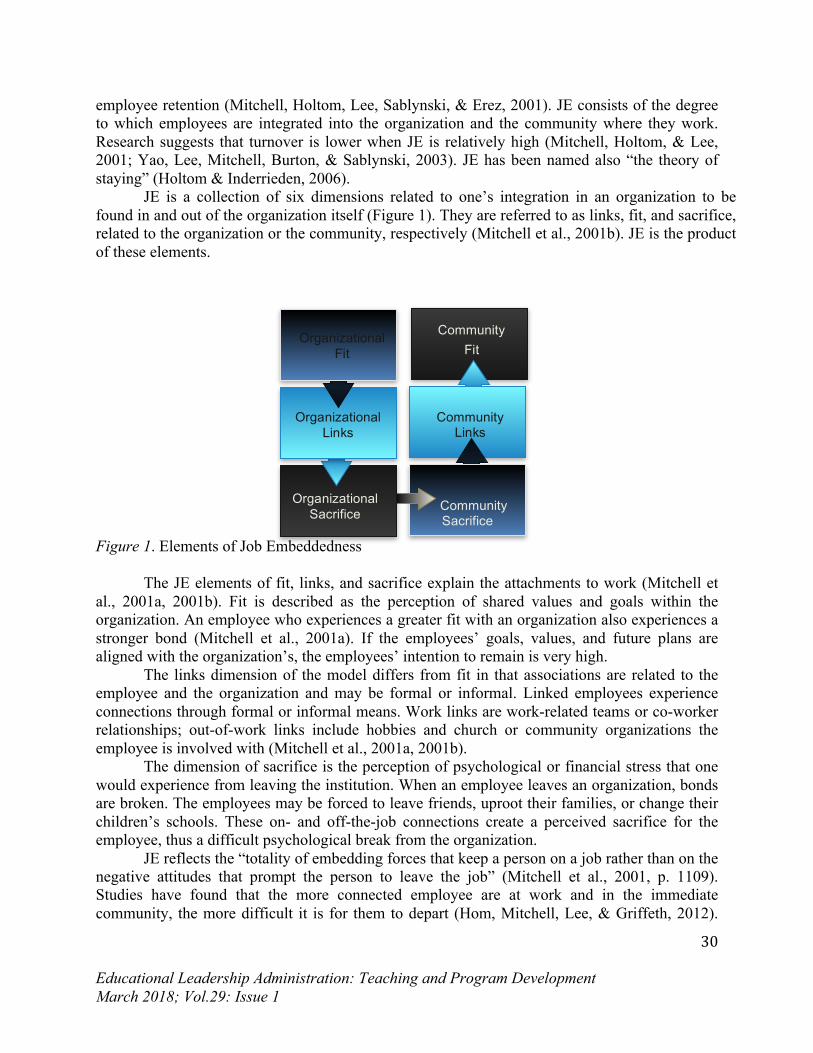
Educational Leadership Administration: Teaching and Program Development March 2018; Vol.29: Issue 1
30
Community Fit
Community Links
Community Sacrifice
Organizational Sacrifice
Organizational Links
Organizational Fit
employee retention (Mitchell, Holtom, Lee, Sablynski, & Erez, 2001). JE consists of the degree to which employees are integrated into the organization and the community where they work. Research suggests that turnover is lower when JE is relatively high (Mitchell, Holtom, & Lee, 2001; Yao, Lee, Mitchell, Burton, & Sablynski, 2003). JE has been named also “the theory of staying” (Holtom & Inderrieden, 2006).
JE is a collection of six dimensions related to one’s integration in an organization to be found in and out of the organization itself (Figure 1). They are referred to as links, fit, and sacrifice, related to the organization or the community, respectively (Mitchell et al., 2001b). JE is the product of these elements.
Figure 1. Elements of Job Embeddedness The JE elements of fit, links, and sacrifice explain the attachments to work (Mitchell et
al., 2001a, 2001b). Fit is described as the perception of shared values and goals within the organization. An employee who experiences a greater fit with an organization also experiences a stronger bond (Mitchell et al., 2001a). If the employees’ goals, values, and future plans are aligned with the organization’s, the employees’ intention to remain is very high.
The links dimension of the model differs from fit in that associations are related to the employee and the organization and may be formal or informal. Linked employees experience connections through formal or informal means. Work links are work-related teams or co-worker relationships; out-of-work links include hobbies and church or community organizations the employee is involved with (Mitchell et al., 2001a, 2001b).
The dimension of sacrifice is the perception of psychological or financial stress that one would experience from leaving the institution. When an employee leaves an organization, bonds are broken. The employees may be forced to leave friends, uproot their families, or change their children’s schools. These on- and off-the-job connections create a perceived sacrifice for the employee, thus a difficult psychological break from the organization.
JE reflects the “totality of embedding forces that keep a person on a job rather than on the negative attitudes that prompt the person to leave the job” (Mitchell et al., 2001, p. 1109). Studies have found that the more connected employee are at work and in the immediate community, the more difficult it is for them to depart (Hom, Mitchell, Lee, & Griffeth, 2012).
Educational Leadership Administration: Teaching and Program Development March 2018; Vol.29: Issue 1
31
Further studies discovered that employees with higher levels of embeddedness found other job options less desirable (Swider, Boswell, & Zimmerman, 2011).
JE is shown to be a robust predictor of retention among a multitude of professions and diverse groups of employees, such as law enforcement and military officers; informational technology workers; hospital, retail, and bank employees; and collegiate coaches (Mallol, Holtom, & Lee, 2007; Ramesh & Gelfand, 2010). Results from a meta-analytic review of job embeddedness in 65 studies on JE uncovered that the link between JE and turnover is stronger in females (Jiang, Liu, McKay, Lee, & Mitchell, 2012).
If applied to the education field, the JE construct may provide an innovative approach to explaining why novice teachers leave, and it may also suggest the changes necessary to bolster the intention to stay. This study examines the question: How does JE predict novice teacher retention?
Method
The purpose of this study was to evaluate the effectiveness of JE as a predictor of novice teacher retention in the K-12 public school setting. This study examined the relationship between teacher attrition and JE by building on prior research in organizational management. We sent surveys to two groups of potential respondents: current and former novice K-12 teachers in three Central California school districts. Two of the districts surveyed are located in rural, agricultural areas, and one in a suburban region in Central California. We identified teachers with fewer than five years of teaching experience who were hired between 2006 and 2010 and sent surveys to 500 currently employed K-12 teachers who had been working for their district for less than 5 years. A total of 128 usable surveys were returned (26% return rate). Surveys were also sent to an additional 100 novice teachers who had voluntarily left one of these three districts during that same period. Of these, 15 usable surveys were returned, resulting in a 15% return rate. Instrumentation JE is “a broad constellation of influences on employee retention” (Mitchell et al., 2001b, p. 1104). Mitchell et al. (2001a) developed a 42-item survey in Likert-type, fill-in-the-blank, and yes/no format to measure the different facets of JE. Survey items focus on the respondents’ fit into the organization’s culture, their linkages to coworkers and members of the community, and the sacrifices they would make if they left. Total scores indicate the degree of JE, which is calculated by computing the mean of the six aspects of the overall construct (Mitchell et al., 2001a).
Each district’s Human Resources provided two lists of novice teachers (Stayers and Leavers). Each of the novice teachers was sent a copy of the embeddedness survey (see Appendix A) with items adjusted to the past tense to accommodate the Leavers. Each of the teachers in both groups was contacted multiple times with the incentive of a gift card provided by lottery to one of the participants in each group.
In order to answer the research question regarding job embeddedness and novice teacher retention, we developed composite variables by clustering Likert responses (Walkey, 1997), as shown in Figure 2. The four composite variables shown in Figure 3 were: Organizational Fit (OrgFit), Community Fit (ComFit), Organizational Sacrifice (OrgSac), and Community Sacrifice
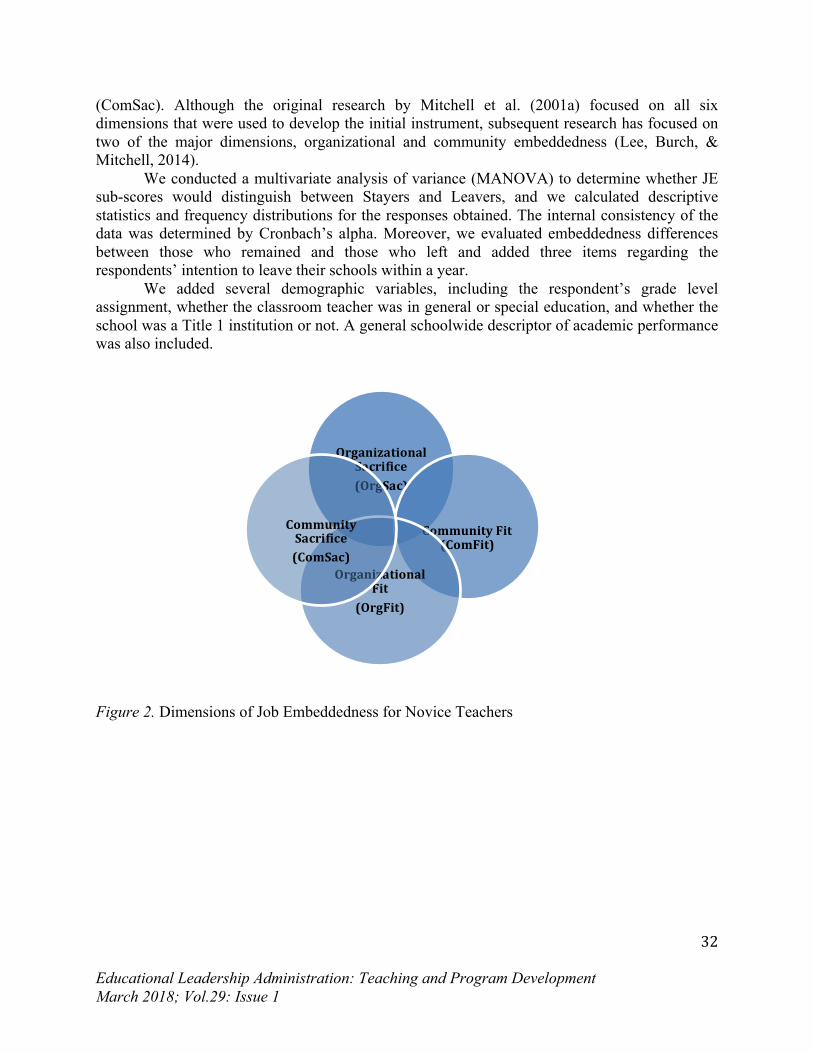
Educational Leadership Administration: Teaching and Program Development March 2018; Vol.29: Issue 1
32
(ComSac). Although the original research by Mitchell et al. (2001a) focused on all six dimensions that were used to develop the initial instrument, subsequent research has focused on two of the major dimensions, organizational and community embeddedness (Lee, Burch, & Mitchell, 2014).
We conducted a multivariate analysis of variance (MANOVA) to determine whether JE sub-scores would distinguish between Stayers and Leavers, and we calculated descriptive statistics and frequency distributions for the responses obtained. The internal consistency of the data was determined by Cronbach’s alpha. Moreover, we evaluated embeddedness differences between those who remained and those who left and added three items regarding the respondents’ intention to leave their schools within a year.
We added several demographic variables, including the respondent’s grade level assignment, whether the classroom teacher was in general or special education, and whether the school was a Title 1 institution or not. A general schoolwide descriptor of academic performance was also included.
Figure 2. Dimensions of Job Embeddedness for Novice Teachers
Organizational
Sacrifice(OrgSac)
CommunityFit(ComFit)
Organizational
Fit(OrgFit)
CommunitySacrifice(ComSac)
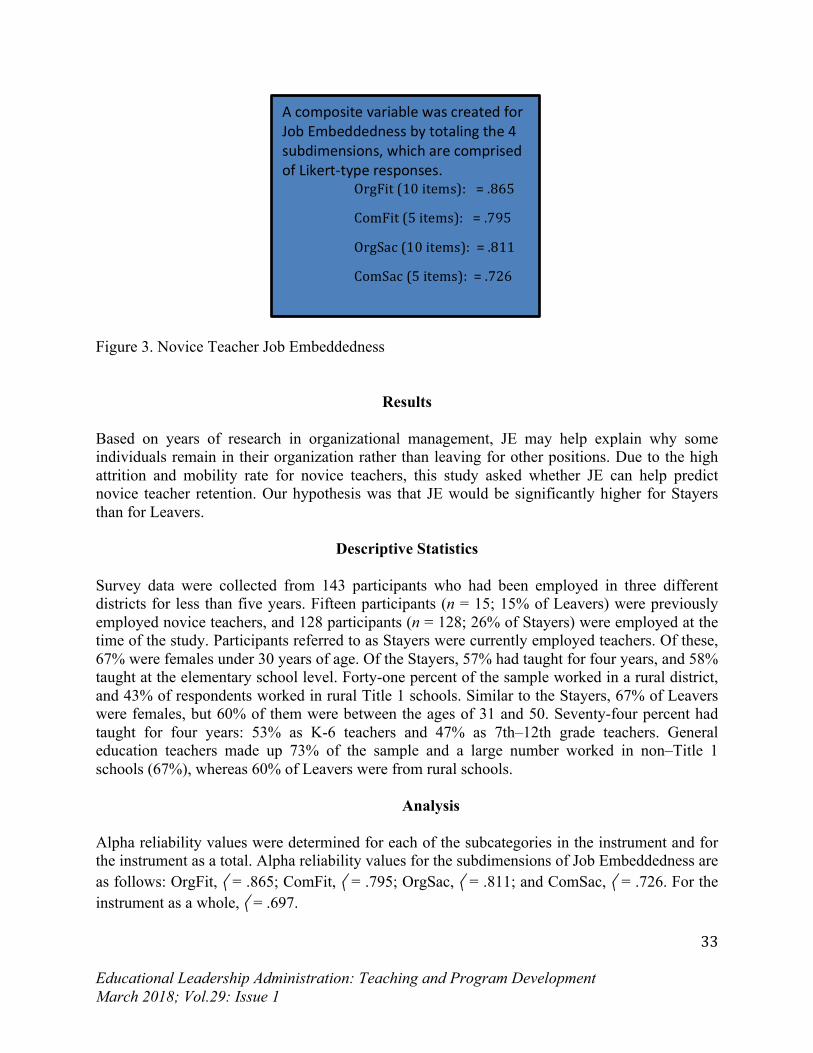
Educational Leadership Administration: Teaching and Program Development March 2018; Vol.29: Issue 1
33
Figure 3. Novice Teacher Job Embeddedness
Results
Based on years of research in organizational management, JE may help explain why some individuals remain in their organization rather than leaving for other positions. Due to the high attrition and mobility rate for novice teachers, this study asked whether JE can help predict novice teacher retention. Our hypothesis was that JE would be significantly higher for Stayers than for Leavers.
Descriptive Statistics
Survey data were collected from 143 participants who had been employed in three different districts for less than five years. Fifteen participants (n = 15; 15% of Leavers) were previously employed novice teachers, and 128 participants (n = 128; 26% of Stayers) were employed at the time of the study. Participants referred to as Stayers were currently employed teachers. Of these, 67% were females under 30 years of age. Of the Stayers, 57% had taught for four years, and 58% taught at the elementary school level. Forty-one percent of the sample worked in a rural district, and 43% of respondents worked in rural Title 1 schools. Similar to the Stayers, 67% of Leavers were females, but 60% of them were between the ages of 31 and 50. Seventy-four percent had taught for four years: 53% as K-6 teachers and 47% as 7th–12th grade teachers. General education teachers made up 73% of the sample and a large number worked in non–Title 1 schools (67%), whereas 60% of Leavers were from rural schools.
Analysis
Alpha reliability values were determined for each of the subcategories in the instrument and for the instrument as a total. Alpha reliability values for the subdimensions of Job Embeddedness are as follows: OrgFit, 〈 = .865; ComFit, 〈 = .795; OrgSac, 〈 = .811; and ComSac, 〈 = .726. For the instrument as a whole, 〈 = .697.
AcompositevariablewascreatedforJobEmbeddednessbytotalingthe4subdimensions,whicharecomprisedofLikert-typeresponses.
OrgFit(10items): =.865
ComFit(5items):=.795
OrgSac(10items):=.811
ComSac(5items):=.726
Total=.697
Educational Leadership Administration: Teaching and Program Development March 2018; Vol.29: Issue 1
34
We analyzed the relationships among the four sub-tests and ran correlations among all four dimensions. The results are reported in Appendix C. The relationship between Community Fit and Organizational Fit is statistically significant but modest (p = .05), as is the relationship between Community Sacrifice and Community Fit (p = .01). The most robust correlation is between the Organizational Fit and Organizational Sacrifice dimensions (p = .01). The correlation values suggest that the items associated with each subcategory measure different characteristics.
Our hypothesis was that JE would be significantly higher for Stayers than for Leavers. We calculated means and standard deviations by sub-scale for responses by Stayers and Leavers (Appendix D). The differences between the means for members of the two groups confirm the results of the multivariate analysis of variance (MANOVA). The MANOVA, which is a statistical analysis of multiple factors, evaluated the degree to which the four sub-test scores could distinguish between the two groups of novice teachers, Stayers and Leavers.
The multivariate results indicate that, among new or novice teachers, the four category scores were significantly different for Stayers and for Leavers. The four dependent variables were treated singularly, as evidenced by the univariate results (Appendix D). The results indicate that measures of Organizational Fit, Community Fit, and Community Sacrifice were significantly different for Stayers and Leavers, whereas Community Sacrifice results went in the opposite direction. Although measures of Organizational Sacrifice were not significantly different for Stayers and Leavers, our general hypothesis was supported.
Discussion
When taken as an aggregate, the scores based on the educators’ fit in the organization and community and their perception of sacrifice to the organization and community if they departed distinguish between those educators who remain and those who leave. Taken individually, all factors except Organizational Sacrifice also distinguish between Stayers and Leavers. The lack of statistical significance when measuring the difference between Stayers and Leavers in relationship to Organizational Sacrifice may be due to the fact that all of the teachers had been employed in the districts for less than five years. Other studies on JE did not focus on employees new in an organization or profession. Univariate analyses indicate that three of the four subdimensions of JE are significantly different for Stayers and Leavers. There is reason to have confidence in these results because measures of internal consistency reliability are high.
Although an analysis of each of the dimensions of the JE model in relationship to novice teacher retention is interesting to contemplate, it is the totality of the dimensions that defines this turnover model. The JE model as applied to this study represents the employees’ entanglement within the overall school and/or district.
The results indicate that the degree to which teachers are connected to their schools and communities explain a substantial amount of the difference between teachers who remain in their position and those who leave. The findings indicate that JE is related to novice teacher retention; specifically, JE is negatively related to educators’ intentions to leave.
Educational Leadership Administration: Teaching and Program Development March 2018; Vol.29: Issue 1
35
Implications for Practice In a recent study, teacher attrition and mobility data showed that 7% of novice teachers surveyed left the profession and another 13% moved to another school (Goldring, Taie, & Riddles, 2014). Research points to a higher rate of departure for teachers with fewer than five years of experience (NCES, 2010). The National Commission on Teaching and America’s Future claims that teacher turnover may cost more than $7.3 billion per year (NCTAF, 2007).
Due to the high costs of attrition and mobility it is imperative to understand how to retain novice teachers at a higher rate. This study has shown that JE is related to novice teacher retention; therefore, efforts to improve embeddedness may pay dividends in higher rates of retention. By applying the JE model to education, leader practitioners can review the links, fit, and sacrifice model to retain more teachers. Beneficial strategies include the use of (a) professional learning teams, (b) mentoring structures, (c) site-based management with collegial interactions, and (d) teacher/administrator collaboration and shared decision making (Bogler, 2008; Brown & Wynn, 2009; Hughes, 2012; Huling, Resta & Yeargain, 2012; Ingersoll & Strong, 2011; Inmann & Marlow, 2004; Kapadia & Coca, 2007; Kraft, Marinell, & Shen-Wei Yee, 2016).
The implementation of the above-stated processes or structures can help develop the webs of connectivity found in the JE model. Relationships at the school or organization and the desire to avoid the sacrifice of departure have been shown to be important facets of JE. Respondents have shown similar results in the area of Community Fit. When individuals are connected to the local community through projects, partnerships, and focused interactions, a sense of belonging is forged that contributes to the decision to stay. School administrators can and should help to develop these associations in a deliberate and thoughtful manner.
The development of processes to address connectivity on campus is one area in which school site administrators can strengthen retention strategies. Another area of focus may be the new generation of employees: the millennials. Millennial teachers flood the market as baby boomers retire at high numbers. Studies on the generational work attitudes of the millennials reveal that when younger employees feel connected or well integrated within their work environment they are more likely to enjoy their work (Westerman & Yamamura, 2007). Harris, Wheeler, and Kacmar (2011) found that the interaction between leadership and employee may predict organizational embeddedness. Other research has concluded that autonomy and participation increased in institutions where new teachers were part of a learning system, where input was sought regarding decisions affecting student achievement, and where teachers were made to feel a part of the school leadership (Weis, 1999). Further research points toward the ability of the new generation of workers to comfortably communicate with supervisors and work well in teams (Myers & Sadaghiana, 2010). School site administrators can encourage the development of such bonds by developing structures that may appeal to the multiple generations currently in the work force. Through (a) work teams, (b) collaborative decision making, (c) the creation of a family atmosphere, and (d) the engagement of staff in extra-curricular activities, leaders can help create the webs of interconnectivity that lead to increased opportunities for embeddedness to develop. By understanding the factors that lead to the retention of novice teachers, and millennials in particular, administrators can create the conditions that lead to interconnectivity and collaboration, modeling an environment that would be difficult, if not painful, to leave.
Educational Leadership Administration: Teaching and Program Development March 2018; Vol.29: Issue 1
36
Limitations This study provides empirical support for the use of the JE framework for predicting retention in novice teachers. The limitations of this research point to a low return rate, which suggests that when surveying younger generations, an alternative method of contact might be more fruitful. Web surveys have become common and provide an alternative, or a supplement, to conventional mail (Cook, Heath & Thompson, 2000; Kaplowitz, Hadlock, & Levine, 2004). Failure to receive an adequate number of surveys can limit the usefulness of a study. Providing a greater incentive for participants could help increase the number of respondents (Zúñiga, 2004).
March and Simon (1958) have argued that voluntary turnover is influenced by labor market conditions. The 2007 economic crisis in the United States and its impact on employment opportunities may be an additional limitation that likely had an effect on this study. Turnover rates are likely affected by high rates of unemployment. According to the Job Openings and Labor Turnover Survey, the recent recession ended in June 2009; however, there are still six unemployed persons for every job opening, and fewer employees are quitting their positions due to job scarcity (U.S. Department of Labor, Bureau of Labor Statistics, 2011). The results of this study may not be generalizable for these reasons.
One last limitation to consider is that the specific forces that connect an individual to a job vary and are not always possible to predict: “We do not yet know what the key forces are in a given setting, organization, industry, or profession” (Lee et al., 2014, p. 202). Although quantitative research can provide reliable measurements of the phenomenon under scrutiny, a mixed-methods study may have provided additional data on novice teacher retention decisions in the area of Community Sacrifice, for example. Employers may seek to understand their employees’ needs and consider that the ties that bind each employee may not be linear and may differ based on life stage.
Summary
This study began with a question: Can job embeddedness help to predict novice teacher retention? The findings support the use of JE to explain turnover in K-12 education. Although the sample size was limited, the results of this study may help practitioners make thoughtful and strategic decisions to improve retention. This body of research will give insight to scholars and leaders that continue to look for new means to retain the important resource of human capital. As districts continue to hire thousands of new teachers in the years to come, JE with its web of connections can be fostered to increase novice teacher retention rates.
Educational Leadership Administration: Teaching and Program Development March 2018; Vol.29: Issue 1
37
References
Alliance for Excellent Education. (2014). On the path to equity: Improving the effectiveness of beginning teachers. Retrieved from https://all4ed.org/wp-content/uploads/2014/07/PathToEquity.pdf
Barnes, G., Crowe, E., & Schaefer, B. (2007). The cost of teacher turnover in five school districts: A pilot study. Paper presented at the International Congress for School Effectiveness and Improvement. Retrieved from http://nctaf.org/wp-content/uploads/2012/01/NCTAF-Cost-of-Teacher-Turnover-2007-fullreport.pdf
Berry, B. (2008). Staffing high-need schools: Insights from the nation’s best teachers. Phi Delta Kappan, 89(10), 766–771.
Billingsly, B. S. (1993). Teacher retention and attrition in special and general education: A critical review of the literature. The Journal of Special Education, 27(2), 137–174.
Boe, E., Cook, L., & Sunderland, R. (2008). Teacher turnover: Examining exit attrition, teaching area transfer, and school migration. Council for Exceptional Children, 75(1), 7–31.
Bogler, R. (2008). The influence of leadership style on teacher job satisfaction. Educational Administration Quarterly, (37)5, 662–683. doi:10.117/00131610121969460
Borman, G., & Dowling, N. M. (2008). Teacher attrition and retention: A meta-analytic and narrative review of the research. Review of Educational Research, 78(3), 367–409. doi:10.3102/0034654308321455
Boyd, D., Grossman, P., Lankford, H., Loeb, S. & Wyckoff J. (2008). Who leaves? Teacher attrition and student achievement. Working paper No. 14022 for Analysis of Longitudinal Data in Education Research, National Bureau of Economic Research. Retrieved from http://www.nber.org/papers/w14022
Boyd, D., Lankford, H., Loeb, S. & Wyckoff J. (2005). Explaining the short careers of high-achieving teachers in schools with low-performing students. American Economic Review, 95(2), 166–171.
Brill, S., & McCartney, A. (2008). Stopping the revolving door: Increasing teacher retention. Politics & Policy, 36(5), 750–774.
Brown, K. M., & Wynn, S. (2009). Finding, supporting, and keeping: The role of the principal in teacher retention issues. Leadership and Policy in Schools, 8, 37–63.
Certo, J. L., & Fox, J. E. (2002). Retaining quality teachers. The High School Journal, 86(1), 55–75. Cook, C., Heath, F., & Thompson, R. L. (2000). A meta-analysis of response rates in web- or
internet-based surveys. Educational and Psychological Measurement, 60, 821–836. Darling-Hammond, L. (2000). Teacher quality and student achievement: A review of state policy
evidence. Education Policy Analysis Archives, 8(1). Retrieved from http://epaa.asu.edu/epaa/v8n1
Dingus, J. (2008). “I’m learning the trade”: Mentoring networks of Black women teachers. Urban Education, 43(3), 361–377. doi:10.177/0042085907311794
Eberhard, J., Reinhardt, M., & Stottlemeyer, B., (2000). Strategies for new teacher retention: Creating a climate of authentic professional development for teachers with three years or less years experience. The South Texas Research and Development Center. Retrieved from http://eric.ed.gov/ERICWebPortal/search/detailmini.jsp?_nfpb=true&_&ERICExtSearch_SearchValue_0=ED450116&ERICExtSearch_SearchType_0=no&accno=ED450116
Educational Leadership Administration: Teaching and Program Development March 2018; Vol.29: Issue 1
38
Esch, C. E., Chang-Ross, C. M., Guha, R., Humphrey, D. C., Shields, P. M., Tiffany-Morales, J. D., …Woodworth, K. R. (2005). The status of the teaching profession 2005. Santa Cruz, CA: The Center for the Future of Teaching and Learning. Retrieved from http://eric.ed.gov/PDFS/ED491141.pdf
Feng, L. (2005). Hire today, gone tomorrow: The determinants of attrition among public school teachers (Doctoral dissertation). Retrieved from Munich Personal RePEc Archive (No. 589). http://mpra.ub.uni-muenchen.de/589/
Flores, M. A., & Day C. (2006). Contexts which shape and reshape new teachers’ identities: A multi-perspective study. Teaching and Teacher Education, 22, 219–232.
Glennie, E. J., Mason, M., & Edmunds, J.A. (2016). Retention and satisfaction of novice teachers: Lessons from a school reform model. Journal of Education and Training Studies, 4(4). Retrieved from http://dx.doi.org/10.11114/jets.v4i4.1458
Goldring, R., Taie, S., & Riddles, M. (2014). Teacher attrition and mobility: Results from the 2012–13 Teacher Follow-up Survey (NCES 2014-077). Washington, DC: National Center for Education Statistics. Retrieved from http://nces.ed.gov/pubsearch
Grissmer, D. W., & Kirby, S. N. (1987). Teacher attrition: The uphill climb to staff the nation’s schools (R-3512-ICJ). Retrieved from RAND website: http://www.rand.org/pubs/reports/R3512/
Guarino, C. M., Santibañez, L., & Daley, G. A. (2006). Teacher recruitment and retention: A review of the recent empirical literature. Review of Educational Research, 76, 173–208.
Harris, K. J., Wheeler, A. R., & Kacmar, K. M. (2011). The mediating role of organizational job embeddedness in the LMX-outcomes relationships. The Leadership Quarterly, 22(2), 271–281. doi:10.1016/j.leaqua.2011.02.003
Haycock, K. (1998). Good teaching matters: How well-qualified teachers can close the gap. Retrieved from www.edtrust.org/sites/edtrust.org/files/publications/files/k16_summer98.pdf
Haycock, K. (2001). Helping all students achieve: Closing the achievement gap. Educational Leadership, 58(6), 1–15.
Holtom, B. C., & Inderieden, E. J. (2006). Integrating the unfolding model and job embeddedness model to better understand voluntary turnover. Journal of Managerial Issues, 18(4), 435–452.
Hom, P. W., Mitchell, T. R., Lee, T. W., & Griffeth, R. W. (2012). Reviewing employee turnover: Focusing on proximal withdrawal states and an expanded criterion. Psychological Bulletin, 138, 831–858.
Hughes, G. (2012). Teacher retention: Teacher characteristics, school characteristics, organizational characteristics, and teacher efficacy. The Journal of Educational Research, 105, 245–255.
Huling, L., Resta, V. & Yeargain, P. (2012). Supporting and retaining novice teachers. Kappa Delta Pi Record, 48, 140–143.
Ingersoll, R. (2001). Teacher turnover and teacher shortages: An organizational analysis. Educational Research Journal, 38(3), 499–534.
Ingersoll, R. M., & Strong, M. (2011). The impact of induction and mentoring programs for beginning teachers a critical review of the research. Review of Educational Research, 81(2), 201–233.
Inman, D., & Marlow, L. (2004). Teacher retention: Why do beginning teachers remain in the profession? Education, 124(4), 605–614.
Educational Leadership Administration: Teaching and Program Development March 2018; Vol.29: Issue 1
39
Jiang, K., Liu, D., McKay, P., Lee, T. W., & Mitchell, T.R. (2012). When and how is job embeddedness predictive of turnover? A meta-analytic investigation. American Psychological Association, 97(5), 1077–1096.
Kapadia, K., & Coca, V. (2007). Keeping new teachers: A first look at the influences of induction in the Chicago Public Schools. Consortium on Chicago School Research at the University of Chicago. Retrieved from http://ccsr.uchicago.edu/publications/keeping_new_teachers012407.pdf
Kaplowitz, M. D., Hadlock, T. D., & Levine, R. (2004). A comparison of web and mail survey response rates. Public Opinions Quarterly, 68(1), 94–101.
Kelly, S. (2004). An event history analysis of teacher attrition: Salary, teacher tracking, and socially disadvantaged schools. Journal of Experimental Education, 72(3), 195–220.
Kraft, M. A., Marinell W. H., & Shen-Wei Yee D. (2016). School organizational contexts, teacher turnover, and student achievement: Evidence from panel data. American Educational Research Journal, 53(5), 1411–1449. doi:10.3102/0002831216667478
Kukla-Acevedo, S. (2009). Leavers, movers and stayers: The role of workplace conditions in teacher mobility decisions. The Journal of Educational Research, 102(6), 443–452.
Lee, T., Burch, T., & Mitchell, T. (2014). The story of why we stay: A review of job embeddedness. Annual Review of Organizational Psychology and Organizational Behavior, 1, 199–216.
Loeb, S., Darling-Hammond, L., & Luczak, J. (2005). How teaching conditions predict teacher turnover in California schools. Peabody Journal of Education, 80(3), 44–70.
Mallol, C. M., Holtom, B. C., & Lee, T. L. (2007). Job embeddedness in a culturally diverse environment. Journal of Business Psychology, 22(1), 35–44.
March, J. G., & Simon, H. A. (1958). Organizations. New York, NY: Wiley. Mitchell, T. R., Holtom, B. C., & Lee, T. W. (2001a). How to keep your best employees:
Developing an effective retention policy. Academy of Management Executives, 15(4), 96–108.
Mitchell, T. R., Holtom, B. C., Lee, T. W., Sablynski, C. J., & Erez, M. (2001b). Why people stay: Using job embeddedness to predict voluntary turnover. Academy of Management Journal, 44(6), 1102–1121.
Mobley, William H. (1977). Intermediate linkages in the relationship between job satisfaction and employee turnover. Journal of Applied Psychology, 62(2), 237–240.
Murnane, R. J., Singer, J. D., Willett, J. B., Kemple, J. J., & Olsen, R. J. (1991). Who will teach? Policies that matter. Cambridge, MA: Harvard University Press.
Myers, K. K., & Sadaghiana, K. (2010). Millenials in the workplace: A communication perspective on millenial’s organizational relationships and performance. Journal of Business Psychology, 25, 225–238. doi:10.1007/s10869-010-9172-7
National Center for Educational Statistics. (2010). Teacher attrition and mobility: Results from the 2008-2009 teacher follow-up survey (NCES-353). Retrieved from http://nces.ed.gov/pubsearch
National Center for Education Statistics. (2014). Projections of education statistics to 2022 (NCES2014-051). Retrieved from http://nces.ed.gov/pubsearch
National Center for Education Statistics. (2015). Career paths of beginning public school teachers: Results from the first through fifth waves of the beginning teacher longitudinal study (NCES2015-196). Retrieved from http://nces.ed.gov/pubsearch
Educational Leadership Administration: Teaching and Program Development March 2018; Vol.29: Issue 1
40
National Commission on Teaching and America’s Future. (2007). The cost of teacher turnover in five school districts: A pilot study. Washington, DC: NCTAF. Retrieved from www.nctaf.org
National Commission on Teaching and America’s Future. (2010). Who will teach? Experience matters. Washington, DC: NCTAF. Retrieved from www.nctaf.org
Pogodzinksi, B., Youngs, P., Frank, K. A., & Belman, D. (2012). Administrative climate and novices' intent to remain teaching. The Elementary School Journal, 113(2), 252–275.
Ramesh, A., & Gelfand, M. (2010). Will they stay or will they go? The role of job embeddedness in predicting turnover in individualistic and collectivist cultures. Journal of Applied Psychology, 95, 807–823.
Redman, S. F. (2015). Self-efficacy, and teacher retention: Perception of novice teachers on job preparation, job support and job satisfaction. Electronic thesis and Dissertations. Paper 2611. http://dc.etsu.edu/etd/2611
Rochkind, J., Ott, A., Immerwahr, J., Doble, J., & Johnson, J. (2007). Lessons learned: New teachers talk about their jobs, challenges and long-range plans, Issue No. 1. Retrieved from National Comprehensive Center for Teacher Quality and Public Agenda website: http://publicagenda.org
Rockoff, J. E. (2004). The impact of individual teachers on student achievement: Evidence from panel data. The American Economic Review, 94(2), 247–252.
Shockley, R., Guglielmino, P., & Watlington, E. (2006). The costs of teacher attrition. Paper presented at the International Congress for School Effectiveness and Improvement, Fort Lauderdale, Florida. Retrieved from http://www.pearsonassessments.com/hai/images/NES_Publications/2006_11ShockleyGuglielminoWatlington_558_1.pdf
Sims, S. (2016). High-stakes accountability and teacher turnover: How do different school inspection judgements affect teachers’ decisions to leave their school? Unpublished manuscript, Department of Social Science, University College of London, England.
Swider B.W., Boswell W.R., & Zimmerman R.D., (2011). Examining the job search–turnover relationship: The role of embeddedness, job satisfaction, and available alternatives. Journal of Applied Psychology, 96(2), 432–441.
Texas Center for Educational Research. (2000). The cost of teacher turnover. Retrieved from http://www.tcer.org/research/index.aspx
Thibodeaux, A. K., Labat M. B., Lee, D. E., & Labat, C. A., (2015). The effects of leadership and high high-stakes testing on teacher retention. Academy of Educational Leadership, 19(1), 227–249.
U.S. Department of Labor, Bureau of Labor Statistics. (2010). Occupational outlook handbook, 2010-2011 edition. Retrieved from http://www.bls.gov/oco/ocos318.htm
U.S. Department of Labor, Bureau of Labor Statistics. (2011). Job openings and labor turnover survey highlights. Retrieved from http://www.bls.gov/web/jolts/jlt_labstatgraphs.pdf
Useem, E., Offenberg, R., & Farley, E. (2007). Closing the teacher quality gap in Philadelphia. Retrieved from Research for Action website: http://eric.ed.gov/PDFS/ED496638.pdf
Van Dyk, J. (2012). The relationship between organisational commitment, retention factors and job embeddedness (Unpublished master’s thesis). University of South Africa, Pretoria.
Walkey, F. H. (1997). Composite Variable Analysis: A simple and transparent alternative to factor analysis. Personality and Individual Differences, 22(5), 757–767.
Educational Leadership Administration: Teaching and Program Development March 2018; Vol.29: Issue 1
41
Warshauer, S., & Appleman, D. (2009). “In it for the long haul”: How teacher education can contribute to teacher retention in high-poverty, urban schools. Journal of Teacher Education, 60, 323–337. doi:10.1177/0022487109336181
Weiss, E. M. (1999). Perceived workplace conditions and first-year teachers’ morale, career choice commitment, and planned retention: A secondary analysis. Teaching and Teacher Education, 15, 861–879.
Westermann, J. W., & Yamamura, J. H. (2007). Generational preferences for work environment fit: Effects on employee outcomes. Career Development International, 12(2), 150–161. doi:10.1108/13620430710733631
Yao, X., Lee, T. W., Mitchell, T. R., Burton, J. P., & Sablynski, C. J. (2003). Job embeddedness: Current research and future directions. In R. Griffeth & P. Hom (Eds.), Innovative theory and empirical research on employee turnover (pp. 153–187). Greenwich, CT: Information Age.
Zúñiga, R. E. (2004). Increasing Response Rates for Online Surveys – A Report from the Flashlight Program’s BeTA Project. Retrieved 15-03-2006, from http://www.tltgroup.org/resources/F-LIGHT/2004/03-04.html#BeTA (accessed 15 March 2006).
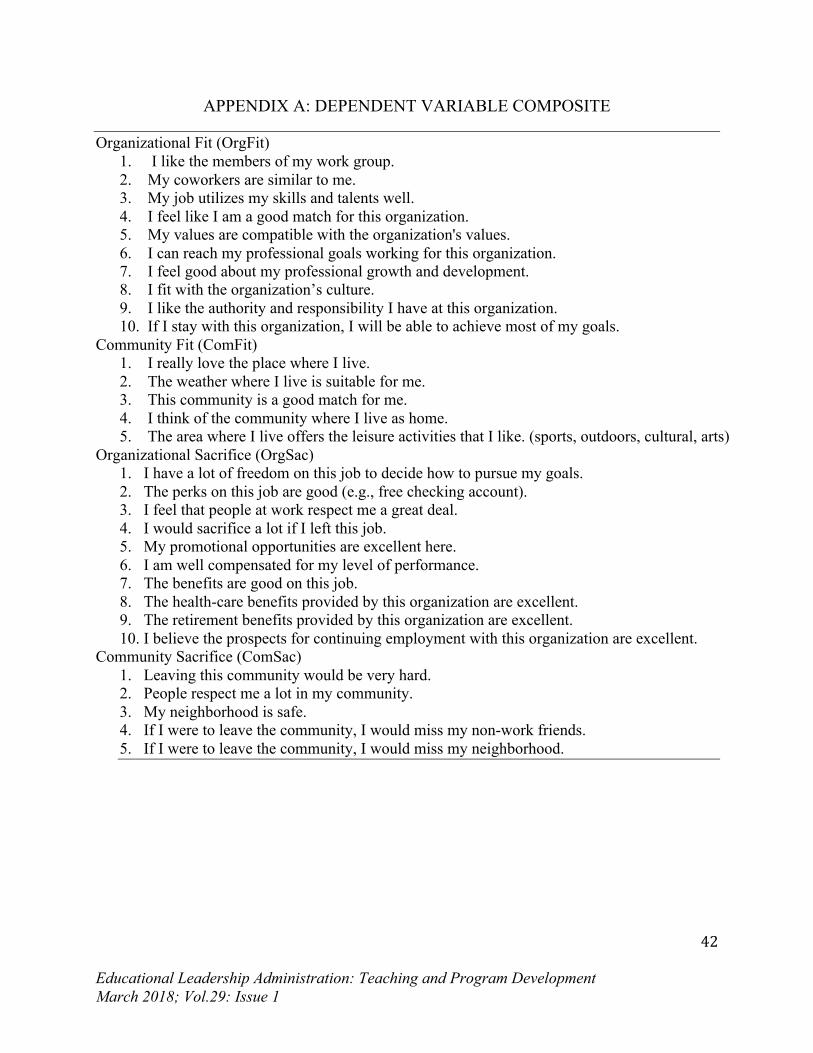
Educational Leadership Administration: Teaching and Program Development March 2018; Vol.29: Issue 1
42
APPENDIX A: DEPENDENT VARIABLE COMPOSITE
Organizational Fit (OrgFit) 1. I like the members of my work group. 2. My coworkers are similar to me. 3. My job utilizes my skills and talents well. 4. I feel like I am a good match for this organization. 5. My values are compatible with the organization's values. 6. I can reach my professional goals working for this organization. 7. I feel good about my professional growth and development. 8. I fit with the organization’s culture. 9. I like the authority and responsibility I have at this organization. 10. If I stay with this organization, I will be able to achieve most of my goals.
Community Fit (ComFit) 1. I really love the place where I live. 2. The weather where I live is suitable for me. 3. This community is a good match for me. 4. I think of the community where I live as home. 5. The area where I live offers the leisure activities that I like. (sports, outdoors, cultural, arts)
Organizational Sacrifice (OrgSac) 1. I have a lot of freedom on this job to decide how to pursue my goals. 2. The perks on this job are good (e.g., free checking account). 3. I feel that people at work respect me a great deal. 4. I would sacrifice a lot if I left this job. 5. My promotional opportunities are excellent here. 6. I am well compensated for my level of performance. 7. The benefits are good on this job. 8. The health-care benefits provided by this organization are excellent. 9. The retirement benefits provided by this organization are excellent. 10. I believe the prospects for continuing employment with this organization are excellent.
Community Sacrifice (ComSac) 1. Leaving this community would be very hard. 2. People respect me a lot in my community. 3. My neighborhood is safe. 4. If I were to leave the community, I would miss my non-work friends. 5. If I were to leave the community, I would miss my neighborhood.
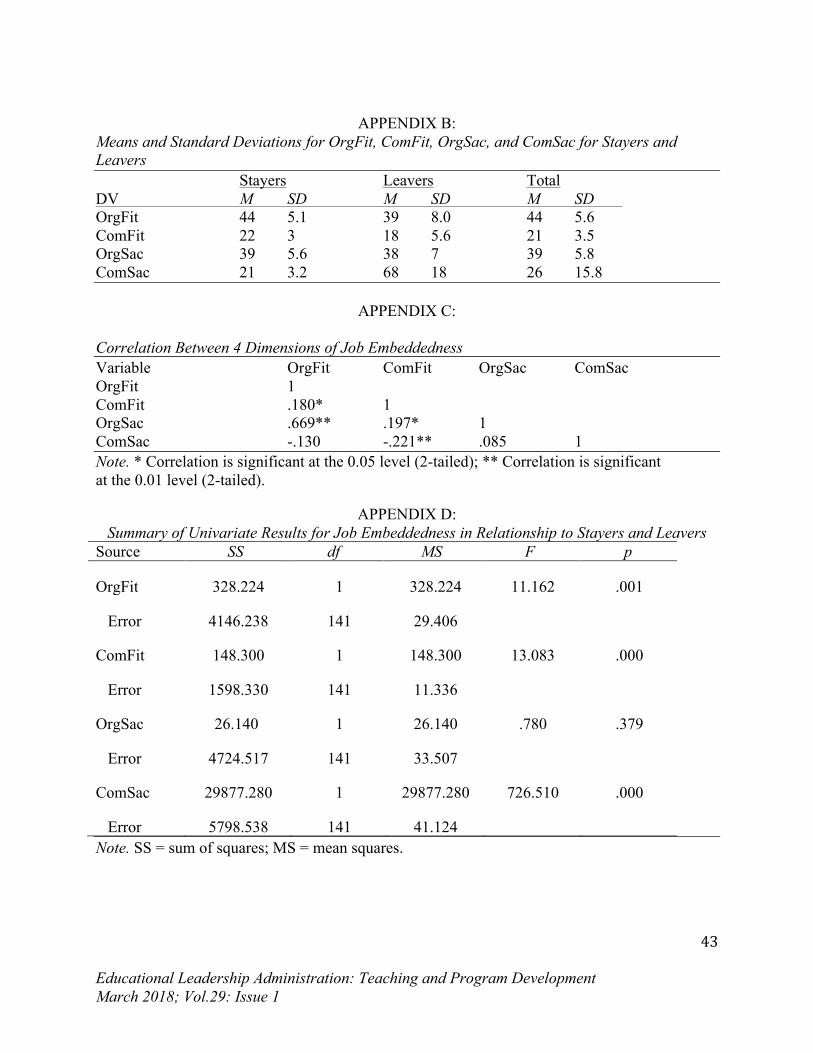
Educational Leadership Administration: Teaching and Program Development March 2018; Vol.29: Issue 1
43
APPENDIX B:
Means and Standard Deviations for OrgFit, ComFit, OrgSac, and ComSac for Stayers and Leavers Stayers Leavers Total DV M SD M SD M SD OrgFit 44 5.1 39 8.0 44 5.6 ComFit 22 3 18 5.6 21 3.5 OrgSac 39 5.6 38 7 39 5.8 ComSac 21 3.2 68 18 26 15.8
APPENDIX C:
Correlation Between 4 Dimensions of Job Embeddedness Variable OrgFit ComFit OrgSac ComSac OrgFit 1 ComFit .180* 1 OrgSac .669** .197* 1 ComSac -.130 -.221** .085 1 Note. * Correlation is significant at the 0.05 level (2-tailed); ** Correlation is significant at the 0.01 level (2-tailed).
APPENDIX D: Summary of Univariate Results for Job Embeddedness in Relationship to Stayers and Leavers
Source SS df MS F p
OrgFit 328.224 1 328.224 11.162 .001
Error 4146.238 141 29.406
ComFit 148.300 1 148.300 13.083 .000
Error 1598.330 141 11.336
OrgSac 26.140 1 26.140 .780 .379
Error 4724.517 141 33.507
ComSac 29877.280 1 29877.280 726.510 .000
Error 5798.538 141 41.124 Note. SS = sum of squares; MS = mean squares.
Educational Leadership Administration: Teaching and Program Development March 2018; Vol.29: Issue 1
44
Section Two: Leadership Development
Educational Leadership Administration: Teaching and Program Development March 2018; Vol.29: Issue 1
45
An Examination of K-5 Principal Time and Tasks to Improve
Leadership Practice
Carol Van Vooren California State University, San Marcos
Abstract This study highlights the high rates of attrition among school leaders that result from increased demands on school principals. This article reports on a unique university and school district partnership that worked together in action-based, community-engaged research to address the time allocation and tasks in the daily life of principals. The findings highlight the complex and changing roles in the daily work of school principals. Moreover, this study serves as a model for community engagement and exemplifies how universities and districts can work together to improve school leadership.
Educational Leadership Administration: Teaching and Program Development March 2018; Vol.29: Issue 1
46
Need for the Study4 Several principals in a school district near a state university with a large education college felt overwhelmed with the quantity of work derived not only from their own schedules, but also from the expectations of the district, parents, and faculty. In this school district, one principal approached the superintendent asking for help. This superintendent turned to the university and asked to build a partnership with a school faculty member and candidates in the university’s Educational Administration cohort to collect information through action-based, community-engaged research. This partnership was not the first of its kind, but it was the first for this class of administrative credential students. They were excited to be exposed to the methodology of research, to practice the work needed for Institutional Review Board approval, and to have the chance to discuss this topic with acting principals in the field. This project would satisfy a one-unit field study course for these 11 graduate students.
The superintendent was aware of the great challenge for districts to attract and retain effective school leaders. In a district such as this one with many Title I schools, Quinn (2002) indicates there is a high-turnover rate of principals who are facing the additional challenges of students in poverty. The MetLife (2013) nationwide survey of school principals found that 75% of principals believed the job had become too complex. Job satisfaction among principals has decreased 12% since 2008, from 68% to 59%. This issue may be due to the increased accountability demands placed on schools, the costly needs of special populations, and the concept that the principal’s main job is to be the school’s instructional leader (Pounder, Galvin, & Shepherd, 2003; Winter & Morgenthal, 2002). Moreover, longevity among principals is diminishing. Studies in various states and districts indicate that annual principal turnover rates are in the range of 12–30% (Battle & Gruber, 2010; Béteille, Kalogrides, & Loeb, 2011; Dhuey & Smith, 2011; Gates, Ringel, Santibanez, Guarino, & Brown, 2006). Of the principals who leave the principalship, 62% do so for reasons other than retirement (Battle & Gruber, 2010).
These statistics show a lack of tenure for principals; in this study, the heartfelt cry of the local principal to the superintendent created an urgency to collect data on what principals are engaged in during their workday. This information could lead to further discussion pertaining to the question, What tasks and timelines do K-5 principals in a North County School District (NCSD)5 engage in during work? These answers might help district leaders to form decisions and policies regarding principal schedules, pressures, and staffing to support the time-challenged principals.
4Thank you to the candidates in the Master of Arts in Educational Administration program who contributed to this research: Kari Auerbach, Emily Chamow, Jed Clark, Dianne Cox, Gabriel Ginez, Amy Glancy, April Jacoby, Solomon Katz, Alexa Scheidler, Shehan Sirimanne, and Amanda Tsoi. 5Thisisapseudonym.
Educational Leadership Administration: Teaching and Program Development March 2018; Vol.29: Issue 1
47
Literature Review
The Changing Role of Principals The role of the principal has been evolving over the years. The concept of the principal as a building manager has given way to a model in which the principal is an aspirational leader, a team builder, a coach, and an agent of visionary change (Alvoid & Black, 2014). There have been increasing layers of responsibilities for principals (Cooley & Shen, 2003). Wells (2013, p. 335) observes:
Across America, principals are charged with leading schools with diminished resources, increased expectations for student achievement, changing demographics, and increased accountability and connectivity, often referred to as “24/7” access from central office personnel, parents, students and school board members. Clearly, the role of the principal continues to expand and new responsibilities are added;
however, few are deleted (Walker, 2009). Whereas principals with a staff of several assistant principals can often assign instructional leadership to a colleague, elementary principals do not have the same luxury (Sherman & Crum, 2007). How can K-5 (elementary school) principals effectively balance all the demands? Have the expectations concerning tasks and timelines changed in accordance with those changing roles?
“Superhero principals,” defined as preternaturally driven leaders who buck bureaucracies, work around the clock, and circumvent endless barriers to create oases of high performance in the midst of dysfunctional systems have become something of a motif in our national education narrative (Ikemoto, Taliaferro, Fenton, & Davis, 2014). Though commendable, is it realistic to have this superhero expectation for all administrators?
In light of changing expectations, it is important for districts to reevaluate how principals spend their time and prioritize the roles they must fill on a daily basis. The increase in the principals’ responsibilities and the incongruence between what instructional leaders want to do and what they have time to do may create serious consequences for school leaders (Walker, 2009).
Time Management It is important to reflect on how principals manage the various job-related tasks and demands placed upon them. Research outside education suggests that effective time management skills may help principals meet job demands, reduce job stress, and improve performance (Grissom, Loeb, & Mitani, 2013).
Principals have noted that they were spending an increasing amount of time on managerial tasks as opposed to instructional leadership tasks (Shen & Crawford, 2003). For the majority of principals, employee supervision and office work were the two management areas that continued to garner the most time. The time spent performing these tasks reduces the amount of time principals can spend on teacher development, student achievement, and school culture (Walker, 2009).
Educational Leadership Administration: Teaching and Program Development March 2018; Vol.29: Issue 1
48
Support With regard to time management, experience may help. Research shows that time spent on administrative tasks decreases by roughly 13% as principals gain more experience (Horng, Klasik, & Loeb, 2010). This may be due to the fact that principals with longer tenure in the same schools appear to delegate more (Grissom, Loeb, & Hajime, 2013). This information indicates that principals require supports from all levels including parent leaders, administrative assistants, assistant principals, resource teachers, school leaders, and district leaders. Newer principals have reported that sometimes they do not feel adequately supported in their roles by their school districts (Alvoid, 2014). Support from superintendents is important for all principals, but it is especially important for principals who have less experience in their current school districts (Chang, Leach, & Anderman, 2015). Professional Development Building leadership capacity in others requires effort, unique insight, and explicit skills. Specific training and support systems can allow principals to perform more effectively. It is important for districts to develop systems and policies that will give principals the authority and support that they need to appropriately train their staff, and that will also provide principals with ongoing opportunities for feedback and development (Wells, 2013).
Slater (2008) discusses the importance of training principals in the methods of building capacity, which require the principal to share leadership with others. School reform may be achieved and sustained more effectively when improvement is not dependent on one person but is a shared responsibility among staff, students, and parents.
Technology to Assist Principal Time Schedules The Northwestern University School of Education has developed electronic applications that capture the activities and allocation of time across workdays. One such tool, the Principal Experience Sampling Method, instructs principals to use handheld computers to report the activities they are performing any time the device beeps during the day. Another web-based tool called The End of the Day Log captures how school leaders allocate their time across nine leadership domains: building operations, finances, community or parent relations, school district functions, student affairs, personnel issues, planning/setting goals, instructional leadership, and professional growth. Using a calendar interface, school leaders report how much time they spent on each domain during each hour of the school day (Northwestern University, 2017). This tool helps leaders to be aware of their actions and to better allocate their time. Often, principals are not able to pinpoint what they have done when they sit down and reflect at the end of the day. With the vast array of activities, interruptions, and outside influences they experience at work, many principals may see their day as a blur. Principal Activities Camburn et al. (2014) conceived of principal leadership practice as a series of actions taken by principals to influence people, processes, and organizational structures. According to these
Educational Leadership Administration: Teaching and Program Development March 2018; Vol.29: Issue 1
49
scholars, principals exercise influence through nine domains of responsibility: (a) building operations, (b) finances, (c) community or parent relations, (d) school district functions, (e) student affairs, (f) personnel issues, (g) planning and setting goals, (h) instructional leadership, and (i) professional growth. Further, theyorganized the domains into five broad areas: school management, instructional leadership, planning and setting goals, boundary spanning, and personal development (Camburn et al., 2014).
Grissom, Loeb, and Master (2013) found that principals spent an average of 12.7% of their time on instruction-related activities. Brief classroom walkthroughs were the most common activity, accounting for 5.4% of principals’ time use; formally evaluating teachers accounted for 1.8% of principals’ time; informally coaching teachers to improve their instruction occupied 0.5% of their time; and 2.1% of their time was spent developing the educational program and evaluating the school curriculum.
Marshall (2008, p. 18) indicates that principals perform many different roles, namely: ● Mission: Giving staff members and students a clear sense of direction. ● Climate: Making the school a safe place that runs smoothly. ● Alignment: Meshing curriculum and assessments with state standards. ● Resources: Getting teachers the tools they need to be effective. ● Instruction: Nurturing the best possible teaching in every classroom. ● Hiring: Using every vacancy to bring in excellent teachers.● Interim assessments: Using data to continuously improve teaching.● Collaboration: Fostering constant sharing of ideas and resources. ● Results: Keeping supervision, professional development, and teams focused on
outcomes. ● Parents: Maximizing family support of students’ education.
Because there is no consensus about the roles and responsibilities of the principal, school leaders are often overwhelmed by the possibility of having to do it all. According to Alvoid (2014, p. 3), "These changing expectations, coupled with insufficient training and support, have led many principals to the conclusion that the job is no longer sustainable.”
Methodology
The study took a multi-phased approach to provide better insight into the demands elementary principals face and the way they allocate their time on daily activities in a school district near a state university on the West Coast. The district is a suburban, middle-sized K-12 public school system. The demographics indicate that 60% of the students are Hispanic, and 25% are English learners. In addition, there are many students in poverty in this district, with more than half the students qualifying for free and reduced lunch and 10% considered homeless.
The team of researchers set out to gather qualitative and quantitative information from 18 K-5 principals currently working in the North County School District. Eleven of the 18 principals completed the survey. The team organized quantitative survey data by the number of hours per week that each principal spent on named tasks and calculated the mean scores. They also identified trends in hours spent on certain tasks.
The graduate student researchers collected qualitative data by shadowing four elementary principals during their school workday. The researchers carried clipboards with a research-based list of principal tasks, and they put a check mark on the chart every five minutes to indicate the
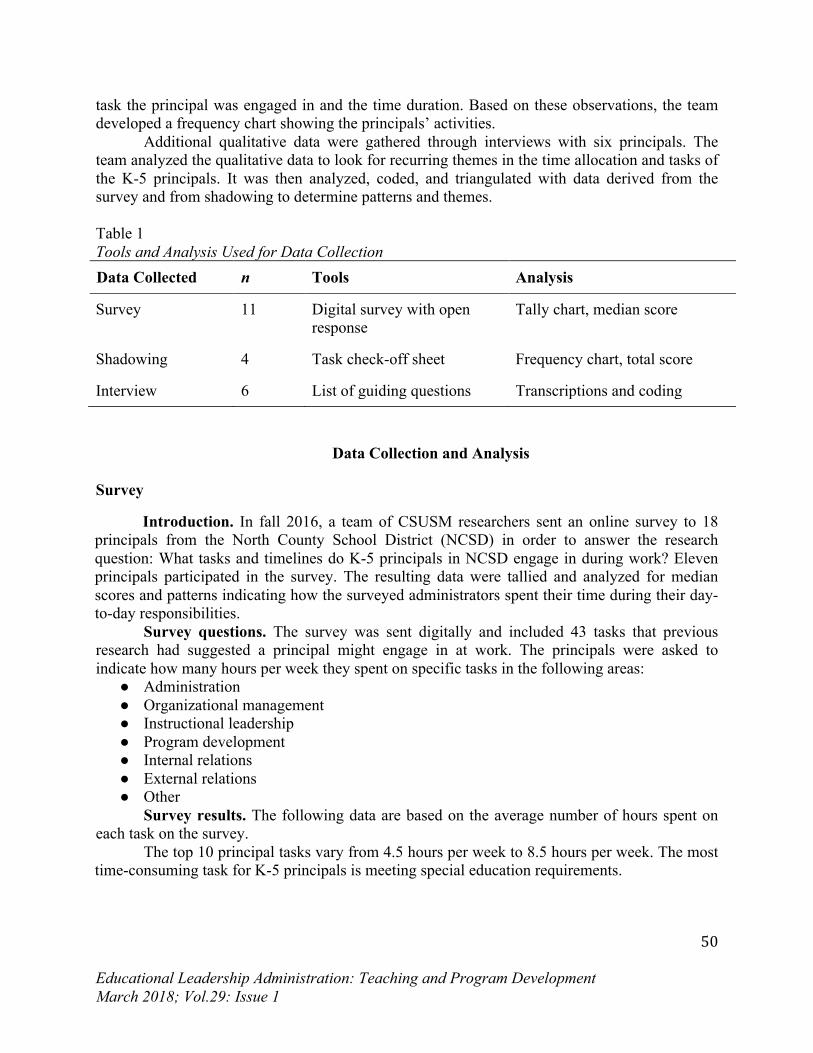
Educational Leadership Administration: Teaching and Program Development March 2018; Vol.29: Issue 1
50
task the principal was engaged in and the time duration. Based on these observations, the team developed a frequency chart showing the principals’ activities.
Additional qualitative data were gathered through interviews with six principals. The team analyzed the qualitative data to look for recurring themes in the time allocation and tasks of the K-5 principals. It was then analyzed, coded, and triangulated with data derived from the survey and from shadowing to determine patterns and themes. Table 1 Tools and Analysis Used for Data Collection Data Collected n Tools Analysis
Survey 11 Digital survey with open response
Tally chart, median score
Shadowing 4 Task check-off sheet Frequency chart, total score
Interview 6 List of guiding questions Transcriptions and coding
Data Collection and Analysis
Survey
Introduction. In fall 2016, a team of CSUSM researchers sent an online survey to 18 principals from the North County School District (NCSD) in order to answer the research question: What tasks and timelines do K-5 principals in NCSD engage in during work? Eleven principals participated in the survey. The resulting data were tallied and analyzed for median scores and patterns indicating how the surveyed administrators spent their time during their day-to-day responsibilities.
Survey questions. The survey was sent digitally and included 43 tasks that previous research had suggested a principal might engage in at work. The principals were asked to indicate how many hours per week they spent on specific tasks in the following areas: ● Administration● Organizational management● Instructional leadership● Program development● Internal relations● External relations● Other
Survey results. The following data are based on the average number of hours spent on each task on the survey.
The top 10 principal tasks vary from 4.5 hours per week to 8.5 hours per week. The most time-consuming task for K-5 principals is meeting special education requirements.
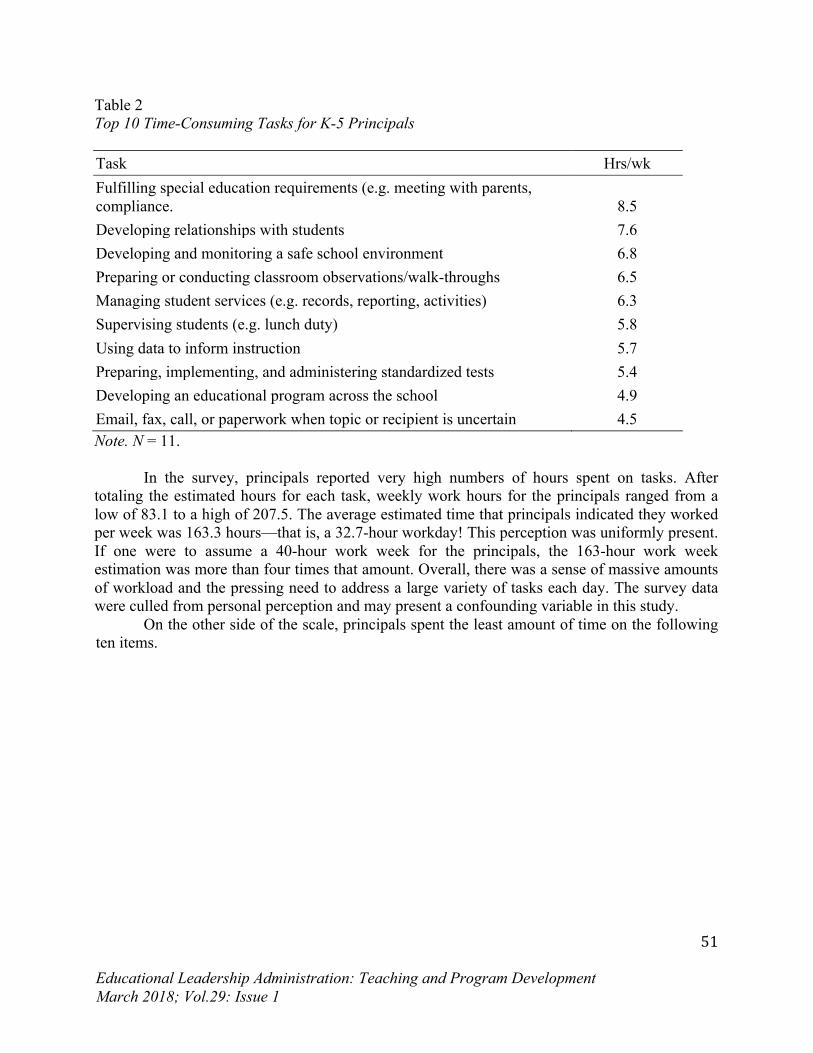
Educational Leadership Administration: Teaching and Program Development March 2018; Vol.29: Issue 1
51
Table 2 Top 10 Time-Consuming Tasks for K-5 Principals Task Hrs/wk Fulfilling special education requirements (e.g. meeting with parents, compliance. 8.5 Developing relationships with students 7.6 Developing and monitoring a safe school environment 6.8 Preparing or conducting classroom observations/walk-throughs 6.5 Managing student services (e.g. records, reporting, activities) 6.3 Supervising students (e.g. lunch duty) 5.8 Using data to inform instruction 5.7 Preparing, implementing, and administering standardized tests 5.4 Developing an educational program across the school 4.9 Email, fax, call, or paperwork when topic or recipient is uncertain 4.5 Note. N = 11.
In the survey, principals reported very high numbers of hours spent on tasks. After
totaling the estimated hours for each task, weekly work hours for the principals ranged from a low of 83.1 to a high of 207.5. The average estimated time that principals indicated they worked per week was 163.3 hours—that is, a 32.7-hour workday! This perception was uniformly present. If one were to assume a 40-hour work week for the principals, the 163-hour work week estimation was more than four times that amount. Overall, there was a sense of massive amounts of workload and the pressing need to address a large variety of tasks each day. The survey data were culled from personal perception and may present a confounding variable in this study.
On the other side of the scale, principals spent the least amount of time on the following ten items.
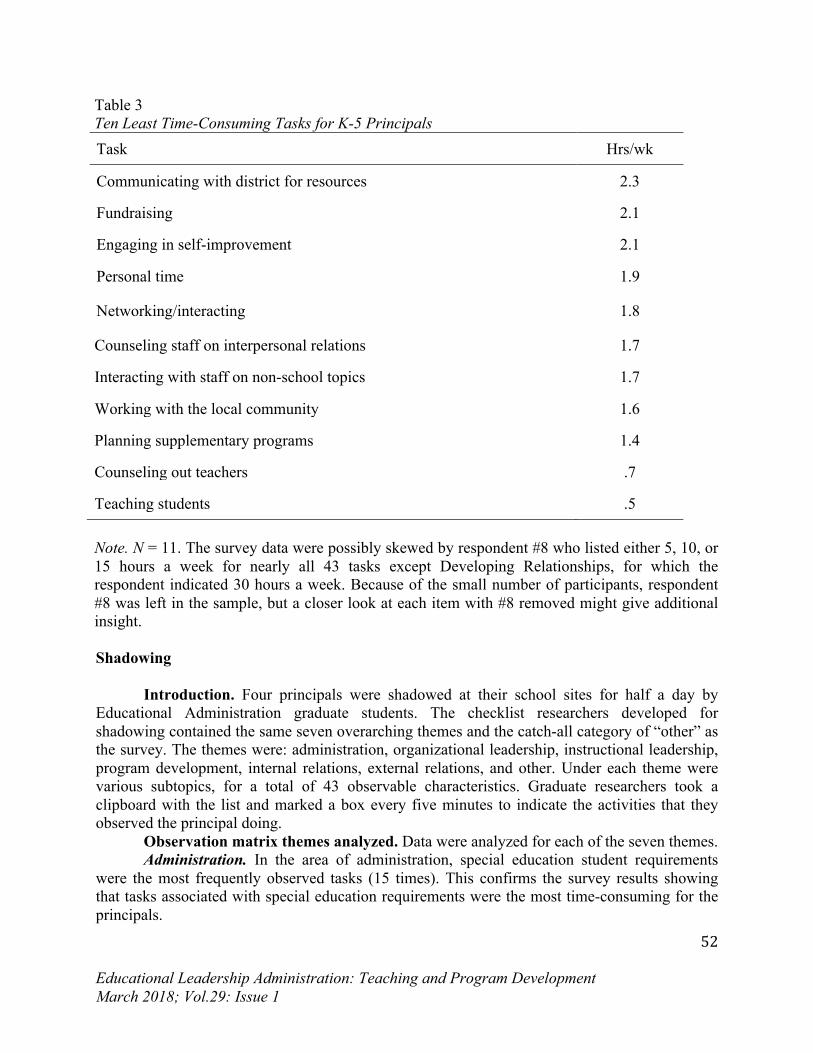
Educational Leadership Administration: Teaching and Program Development March 2018; Vol.29: Issue 1
52
Table 3 Ten Least Time-Consuming Tasks for K-5 Principals Task Hrs/wk
Communicating with district for resources 2.3
Fundraising 2.1
Engaging in self-improvement 2.1
Personal time 1.9
Networking/interacting 1.8
Counseling staff on interpersonal relations 1.7
Interacting with staff on non-school topics 1.7
Working with the local community 1.6
Planning supplementary programs 1.4
Counseling out teachers .7
Teaching students .5 Note. N = 11. The survey data were possibly skewed by respondent #8 who listed either 5, 10, or 15 hours a week for nearly all 43 tasks except Developing Relationships, for which the respondent indicated 30 hours a week. Because of the small number of participants, respondent #8 was left in the sample, but a closer look at each item with #8 removed might give additional insight. Shadowing
Introduction. Four principals were shadowed at their school sites for half a day by Educational Administration graduate students. The checklist researchers developed for shadowing contained the same seven overarching themes and the catch-all category of “other” as the survey. The themes were: administration, organizational leadership, instructional leadership, program development, internal relations, external relations, and other. Under each theme were various subtopics, for a total of 43 observable characteristics. Graduate researchers took a clipboard with the list and marked a box every five minutes to indicate the activities that they observed the principal doing.
Observation matrix themes analyzed. Data were analyzed for each of the seven themes. Administration. In the area of administration, special education student requirements
were the most frequently observed tasks (15 times). This confirms the survey results showing that tasks associated with special education requirements were the most time-consuming for the principals.
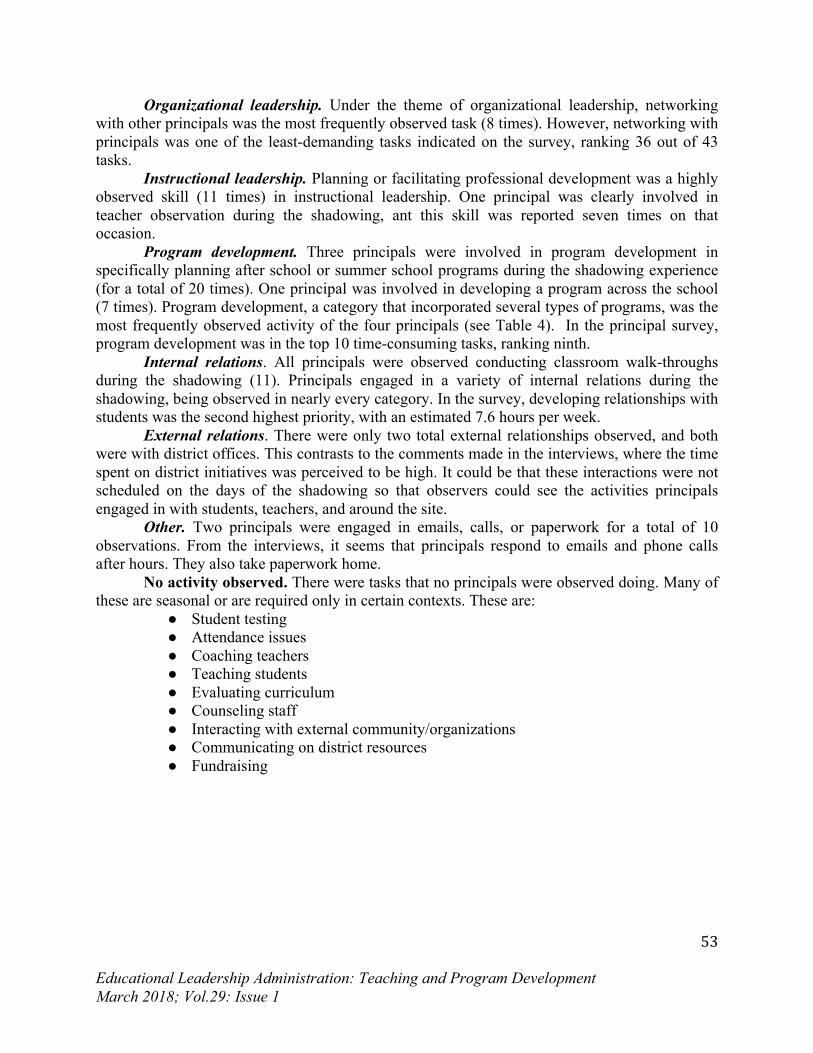
Educational Leadership Administration: Teaching and Program Development March 2018; Vol.29: Issue 1
53
Organizational leadership. Under the theme of organizational leadership, networking with other principals was the most frequently observed task (8 times). However, networking with principals was one of the least-demanding tasks indicated on the survey, ranking 36 out of 43 tasks.
Instructional leadership. Planning or facilitating professional development was a highly observed skill (11 times) in instructional leadership. One principal was clearly involved in teacher observation during the shadowing, ant this skill was reported seven times on that occasion.
Program development. Three principals were involved in program development in specifically planning after school or summer school programs during the shadowing experience (for a total of 20 times). One principal was involved in developing a program across the school (7 times). Program development, a category that incorporated several types of programs, was the most frequently observed activity of the four principals (see Table 4). In the principal survey, program development was in the top 10 time-consuming tasks, ranking ninth.
Internal relations. All principals were observed conducting classroom walk-throughs during the shadowing (11). Principals engaged in a variety of internal relations during the shadowing, being observed in nearly every category. In the survey, developing relationships with students was the second highest priority, with an estimated 7.6 hours per week.
External relations. There were only two total external relationships observed, and both were with district offices. This contrasts to the comments made in the interviews, where the time spent on district initiatives was perceived to be high. It could be that these interactions were not scheduled on the days of the shadowing so that observers could see the activities principals engaged in with students, teachers, and around the site.
Other. Two principals were engaged in emails, calls, or paperwork for a total of 10 observations. From the interviews, it seems that principals respond to emails and phone calls after hours. They also take paperwork home.
No activity observed. There were tasks that no principals were observed doing. Many of these are seasonal or are required only in certain contexts. These are:
● Student testing● Attendance issues● Coaching teachers● Teaching students● Evaluating curriculum● Counseling staff● Interacting with external community/organizations● Communicating on district resources● Fundraising
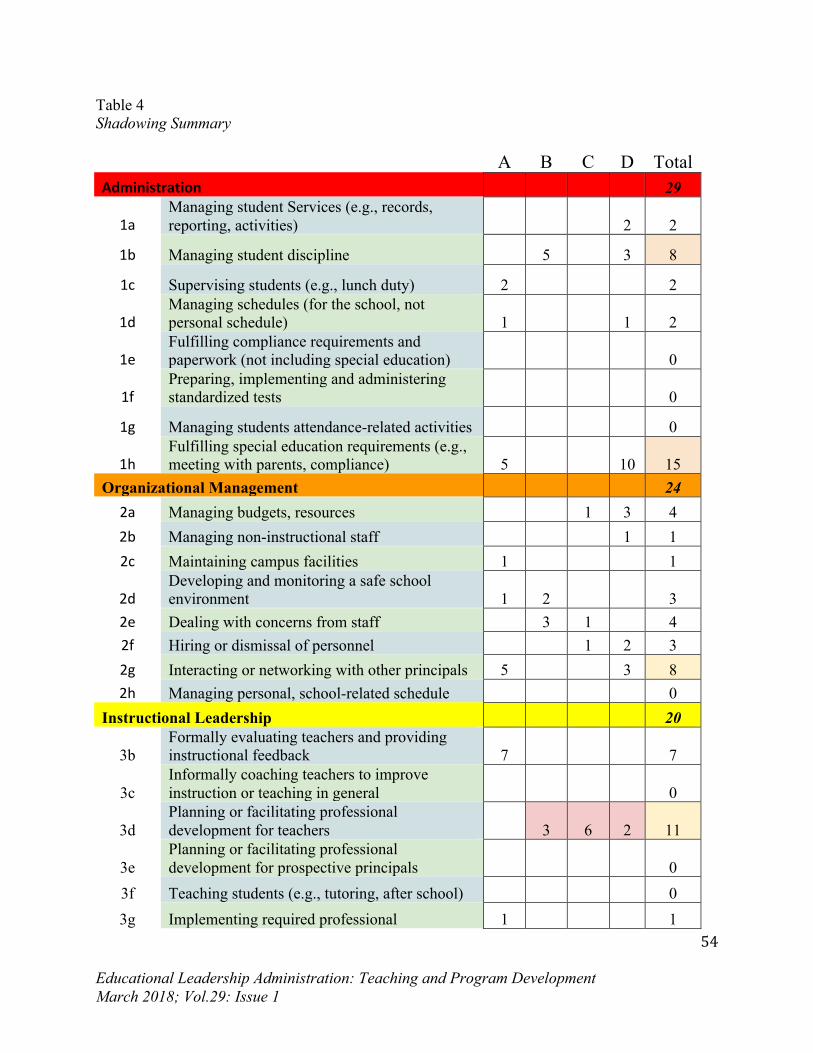
Educational Leadership Administration: Teaching and Program Development March 2018; Vol.29: Issue 1
54
Table 4 Shadowing Summary
A B C D Total Administration 29
1aManaging student Services (e.g., records, reporting, activities) 2 2
1b Managing student discipline 5 3 8
1c Supervising students (e.g., lunch duty) 2 2
1dManaging schedules (for the school, not personal schedule) 1 1 2
1eFulfilling compliance requirements and paperwork (not including special education) 0
1fPreparing, implementing and administering standardized tests 0
1g Managing students attendance-related activities 0
1hFulfilling special education requirements (e.g., meeting with parents, compliance) 5 10 15
Organizational Management 24 2a Managing budgets, resources 1 3 4 2b Managing non-instructional staff 1 1 2c Maintaining campus facilities 1 1
2dDeveloping and monitoring a safe school environment 1 2 3
2e Dealing with concerns from staff 3 1 4 2f Hiring or dismissal of personnel 1 2 3 2g Interacting or networking with other principals 5 3 8 2h Managing personal, school-related schedule 0
Instructional Leadership 20
3b Formally evaluating teachers and providing instructional feedback 7 7
3c Informally coaching teachers to improve instruction or teaching in general 0
3d Planning or facilitating professional development for teachers 3 6 2 11
3e Planning or facilitating professional development for prospective principals 0
3f Teaching students (e.g., tutoring, after school) 0 3g Implementing required professional 1 1
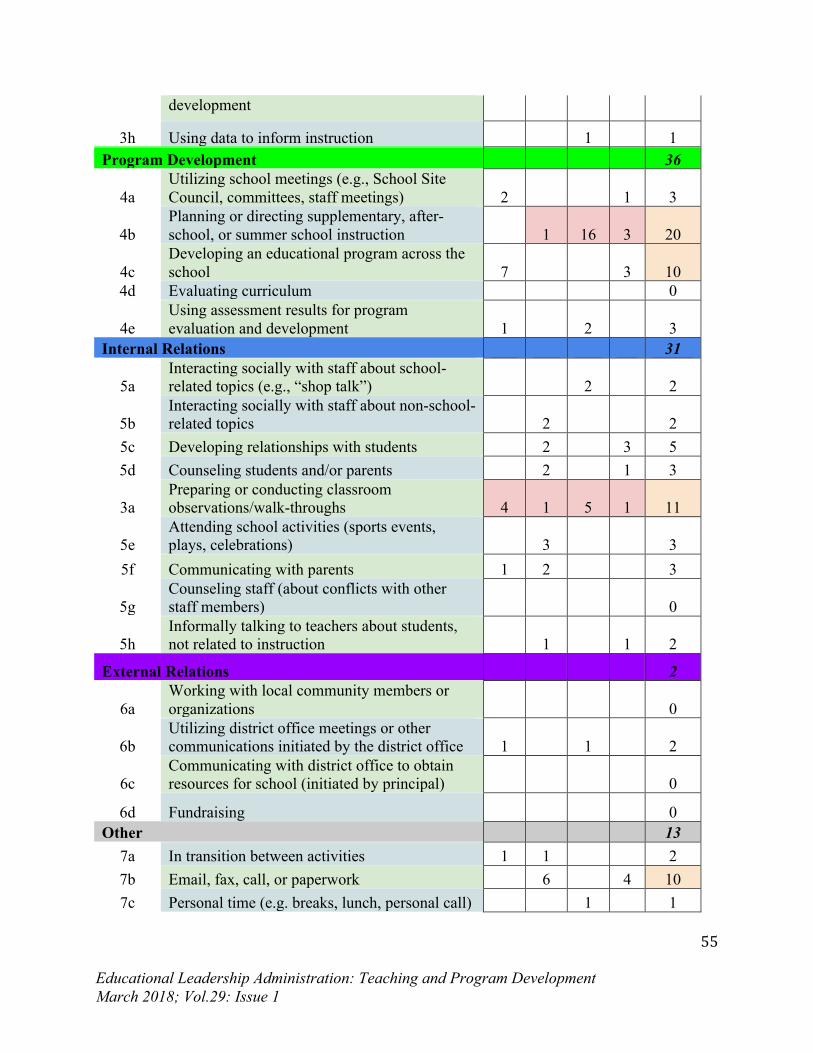
Educational Leadership Administration: Teaching and Program Development March 2018; Vol.29: Issue 1
55
development
3h Using data to inform instruction 1 1 Program Development 36
4a Utilizing school meetings (e.g., School Site Council, committees, staff meetings) 2 1 3
4b Planning or directing supplementary, after-school, or summer school instruction 1 16 3 20
4c Developing an educational program across the school 7 3 10
4d Evaluating curriculum 0
4e Using assessment results for program evaluation and development 1 2 3
Internal Relations 31
5a Interacting socially with staff about school-related topics (e.g., “shop talk”) 2 2
5b Interacting socially with staff about non-school-related topics 2 2
5c Developing relationships with students 2 3 5 5d Counseling students and/or parents 2 1 3
3a Preparing or conducting classroom observations/walk-throughs 4 1 5 1 11
5e Attending school activities (sports events, plays, celebrations) 3 3
5f Communicating with parents 1 2 3
5g Counseling staff (about conflicts with other staff members) 0
5h Informally talking to teachers about students, not related to instruction 1 1 2
External Relations 2
6a Working with local community members or organizations 0
6b Utilizing district office meetings or other communications initiated by the district office 1 1 2
6c Communicating with district office to obtain resources for school (initiated by principal) 0
6d Fundraising 0 Other 13
7a In transition between activities 1 1 2 7b Email, fax, call, or paperwork 6 4 10 7c Personal time (e.g. breaks, lunch, personal call) 1 1
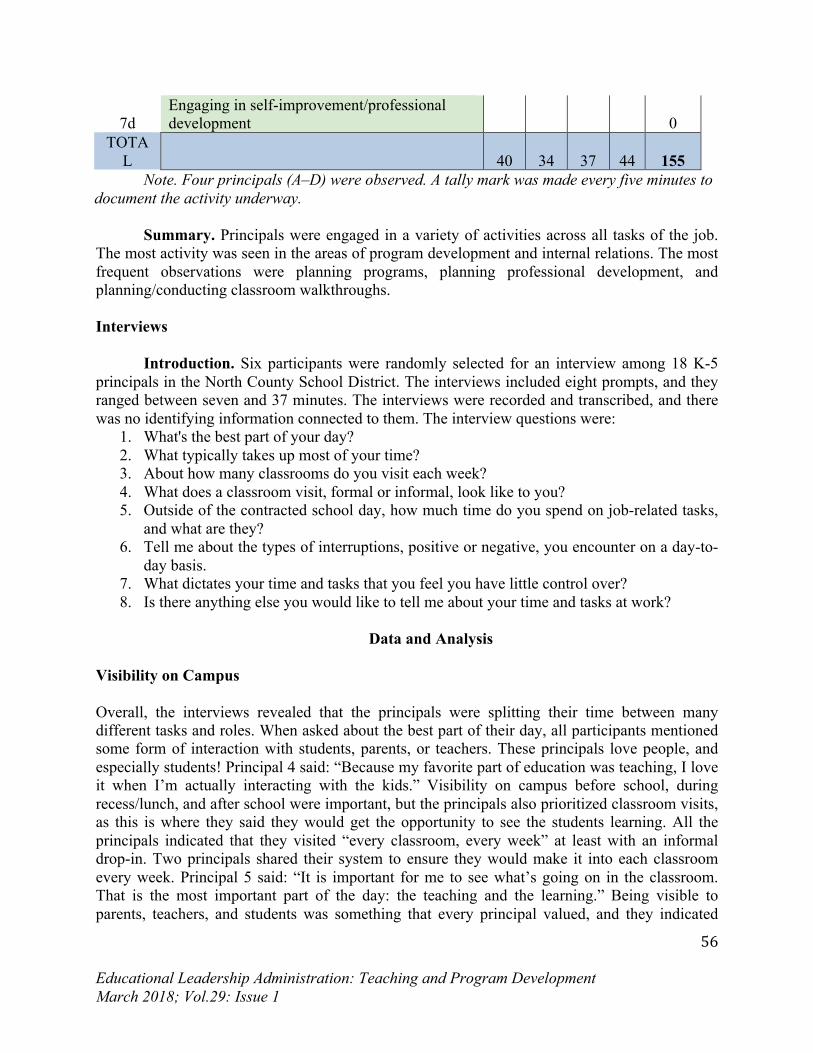
Educational Leadership Administration: Teaching and Program Development March 2018; Vol.29: Issue 1
56
7d Engaging in self-improvement/professional development 0
TOTAL 40 34 37 44 155
Note. Four principals (A–D) were observed. A tally mark was made every five minutes to document the activity underway.
Summary. Principals were engaged in a variety of activities across all tasks of the job.
The most activity was seen in the areas of program development and internal relations. The most frequent observations were planning programs, planning professional development, and planning/conducting classroom walkthroughs.
Interviews
Introduction. Six participants were randomly selected for an interview among 18 K-5 principals in the North County School District. The interviews included eight prompts, and they ranged between seven and 37 minutes. The interviews were recorded and transcribed, and there was no identifying information connected to them. The interview questions were:
1. What's the best part of your day? 2. What typically takes up most of your time? 3. About how many classrooms do you visit each week? 4. What does a classroom visit, formal or informal, look like to you? 5. Outside of the contracted school day, how much time do you spend on job-related tasks,
and what are they? 6. Tell me about the types of interruptions, positive or negative, you encounter on a day-to-
day basis. 7. What dictates your time and tasks that you feel you have little control over? 8. Is there anything else you would like to tell me about your time and tasks at work?
Data and Analysis
Visibility on Campus Overall, the interviews revealed that the principals were splitting their time between many different tasks and roles. When asked about the best part of their day, all participants mentioned some form of interaction with students, parents, or teachers. These principals love people, and especially students! Principal 4 said: “Because my favorite part of education was teaching, I love it when I’m actually interacting with the kids.” Visibility on campus before school, during recess/lunch, and after school were important, but the principals also prioritized classroom visits, as this is where they said they would get the opportunity to see the students learning. All the principals indicated that they visited “every classroom, every week” at least with an informal drop-in. Two principals shared their system to ensure they would make it into each classroom every week. Principal 5 said: “It is important for me to see what’s going on in the classroom. That is the most important part of the day: the teaching and the learning.” Being visible to parents, teachers, and students was something that every principal valued, and they indicated
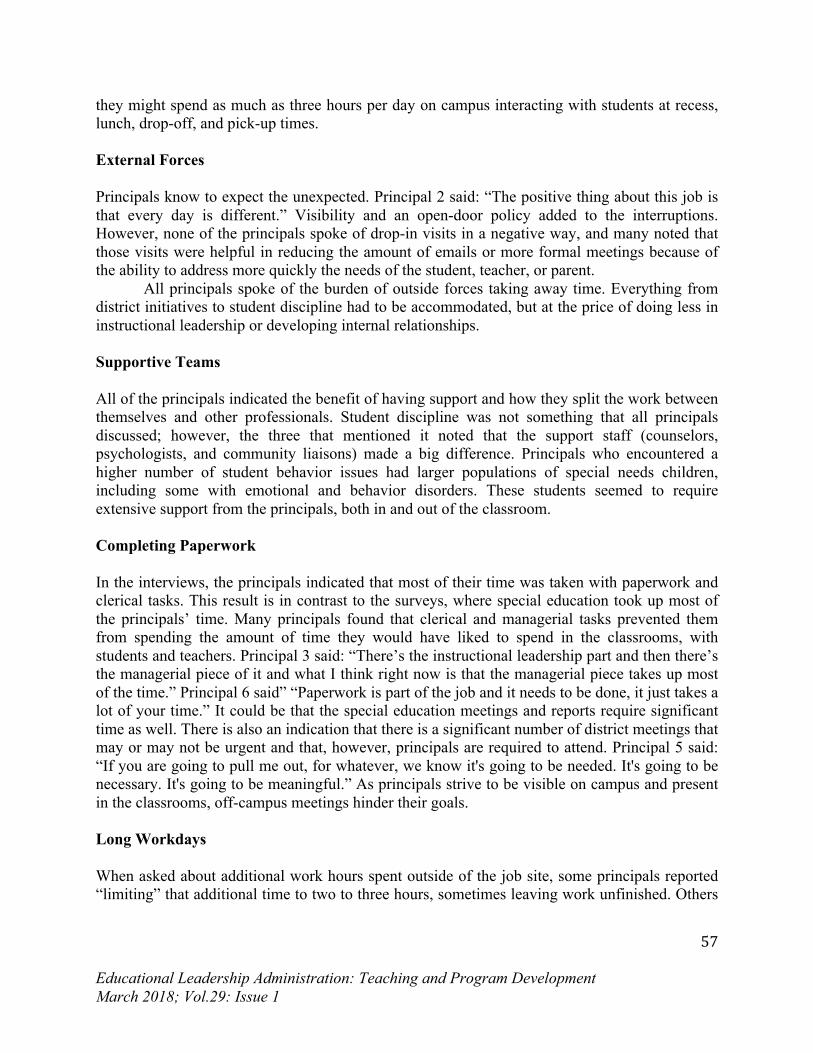
Educational Leadership Administration: Teaching and Program Development March 2018; Vol.29: Issue 1
57
they might spend as much as three hours per day on campus interacting with students at recess, lunch, drop-off, and pick-up times. External Forces Principals know to expect the unexpected. Principal 2 said: “The positive thing about this job is that every day is different.” Visibility and an open-door policy added to the interruptions. However, none of the principals spoke of drop-in visits in a negative way, and many noted that those visits were helpful in reducing the amount of emails or more formal meetings because of the ability to address more quickly the needs of the student, teacher, or parent.
All principals spoke of the burden of outside forces taking away time. Everything from district initiatives to student discipline had to be accommodated, but at the price of doing less in instructional leadership or developing internal relationships.
Supportive Teams All of the principals indicated the benefit of having support and how they split the work between themselves and other professionals. Student discipline was not something that all principals discussed; however, the three that mentioned it noted that the support staff (counselors, psychologists, and community liaisons) made a big difference. Principals who encountered a higher number of student behavior issues had larger populations of special needs children, including some with emotional and behavior disorders. These students seemed to require extensive support from the principals, both in and out of the classroom. Completing Paperwork In the interviews, the principals indicated that most of their time was taken with paperwork and clerical tasks. This result is in contrast to the surveys, where special education took up most of the principals’ time. Many principals found that clerical and managerial tasks prevented them from spending the amount of time they would have liked to spend in the classrooms, with students and teachers. Principal 3 said: “There’s the instructional leadership part and then there’s the managerial piece of it and what I think right now is that the managerial piece takes up most of the time.” Principal 6 said” “Paperwork is part of the job and it needs to be done, it just takes a lot of your time.” It could be that the special education meetings and reports require significant time as well. There is also an indication that there is a significant number of district meetings that may or may not be urgent and that, however, principals are required to attend. Principal 5 said: “If you are going to pull me out, for whatever, we know it's going to be needed. It's going to be necessary. It's going to be meaningful.”As principals strive to be visible on campus and present in the classrooms, off-campus meetings hinder their goals. Long Workdays When asked about additional work hours spent outside of the job site, some principals reported “limiting” that additional time to two to three hours, sometimes leaving work unfinished. Others
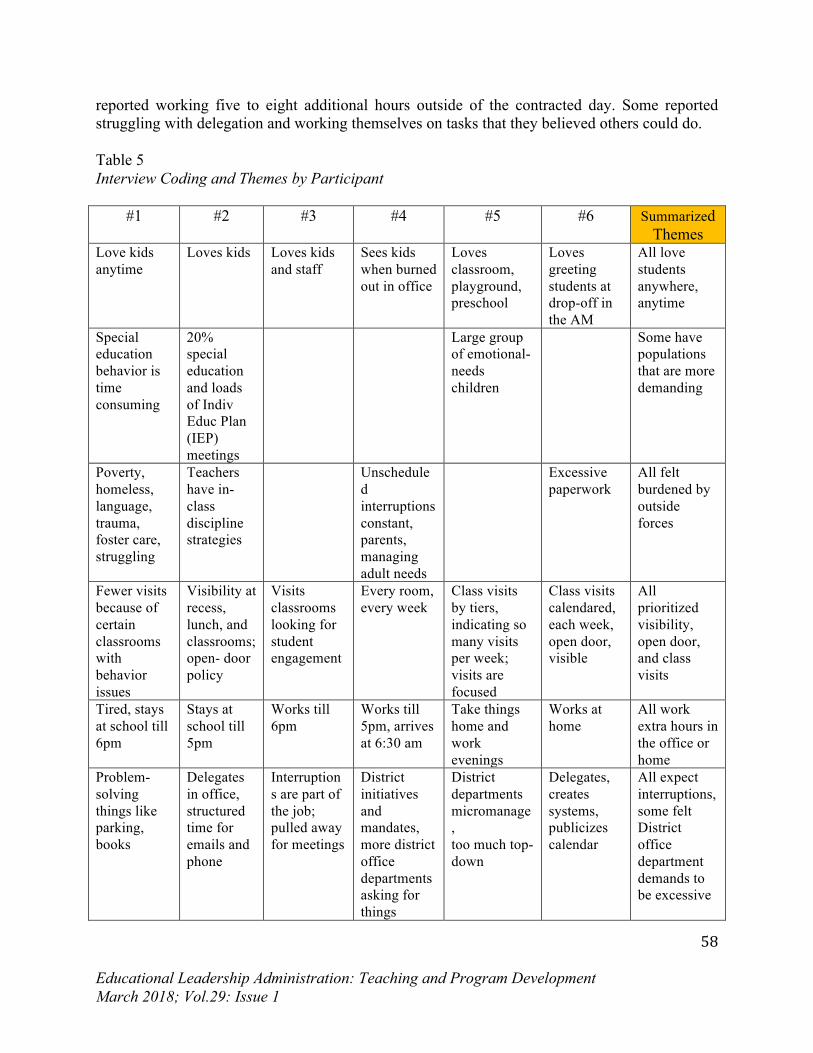
Educational Leadership Administration: Teaching and Program Development March 2018; Vol.29: Issue 1
58
reported working five to eight additional hours outside of the contracted day. Some reported struggling with delegation and working themselves on tasks that they believed others could do. Table 5 Interview Coding and Themes by Participant
#1 #2 #3 #4 #5 #6 Summarized Themes
Love kids anytime
Loves kids Loves kids and staff
Sees kids when burned out in office
Loves classroom, playground, preschool
Loves greeting students at drop-off in the AM
All love students anywhere, anytime
Special education behavior is time consuming
20% special education and loads of Indiv Educ Plan (IEP) meetings
Large group of emotional-needs children
Some have populations that are more demanding
Poverty, homeless, language, trauma, foster care, struggling
Teachers have in-class discipline strategies
Unscheduled interruptions constant, parents, managing adult needs
Excessive paperwork
All felt burdened by outside forces
Fewer visits because of certain classrooms with behavior issues
Visibility at recess, lunch, and classrooms; open- door policy
Visits classrooms looking for student engagement
Every room, every week
Class visits by tiers, indicating so many visits per week; visits are focused
Class visits calendared, each week, open door, visible
All prioritized visibility, open door, and class visits
Tired, stays at school till 6pm
Stays at school till 5pm
Works till 6pm
Works till 5pm, arrives at 6:30 am
Take things home and work evenings
Works at home
All work extra hours in the office or home
Problem-solving things like parking, books
Delegates in office, structured time for emails and phone
Interruptions are part of the job; pulled away for meetings
District initiatives and mandates, more district office departments asking for things
District departments micromanage, too much top-down
Delegates, creates systems, publicizes calendar
All expect interruptions, some felt District office department demands to be excessive
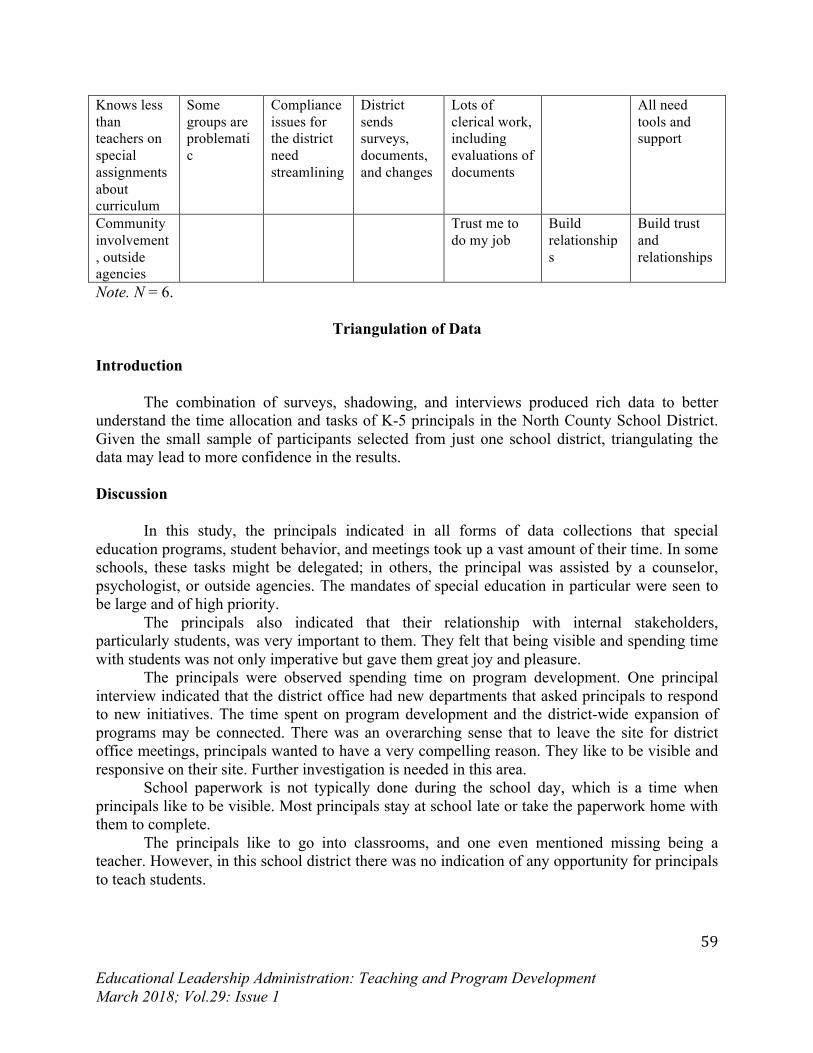
Educational Leadership Administration: Teaching and Program Development March 2018; Vol.29: Issue 1
59
Knows less than teachers on special assignments about curriculum
Some groups are problematic
Compliance issues for the district need streamlining
District sends surveys, documents, and changes
Lots of clerical work, including evaluations of documents
All need tools and support
Community involvement, outside agencies
Trust me to do my job
Build relationships
Build trust and relationships
Note. N = 6.
Triangulation of Data
Introduction
The combination of surveys, shadowing, and interviews produced rich data to better understand the time allocation and tasks of K-5 principals in the North County School District. Given the small sample of participants selected from just one school district, triangulating the data may lead to more confidence in the results.
Discussion
In this study, the principals indicated in all forms of data collections that special education programs, student behavior, and meetings took up a vast amount of their time. In some schools, these tasks might be delegated; in others, the principal was assisted by a counselor, psychologist, or outside agencies. The mandates of special education in particular were seen to be large and of high priority.
The principals also indicated that their relationship with internal stakeholders, particularly students, was very important to them. They felt that being visible and spending time with students was not only imperative but gave them great joy and pleasure.
The principals were observed spending time on program development. One principal interview indicated that the district office had new departments that asked principals to respond to new initiatives. The time spent on program development and the district-wide expansion of programs may be connected. There was an overarching sense that to leave the site for district office meetings, principals wanted to have a very compelling reason. They like to be visible and responsive on their site. Further investigation is needed in this area.
School paperwork is not typically done during the school day, which is a time when principals like to be visible. Most principals stay at school late or take the paperwork home with them to complete.
The principals like to go into classrooms, and one even mentioned missing being a teacher. However, in this school district there was no indication of any opportunity for principals to teach students.
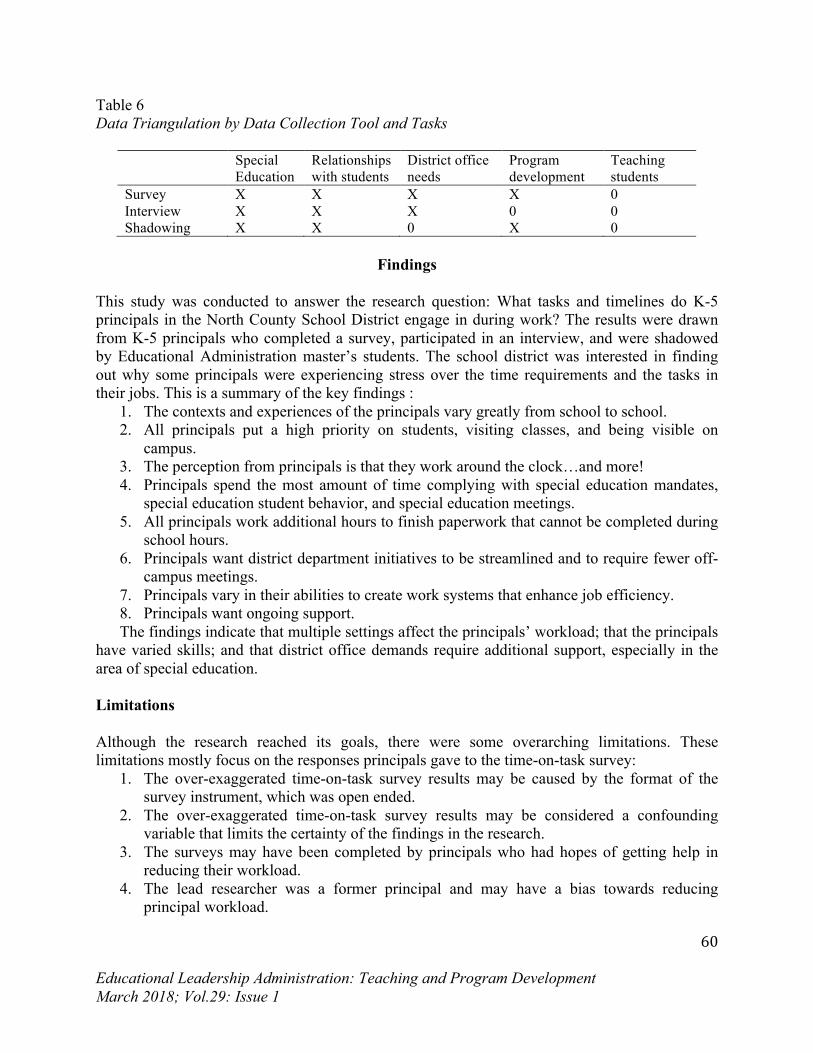
Educational Leadership Administration: Teaching and Program Development March 2018; Vol.29: Issue 1
60
Table 6 Data Triangulation by Data Collection Tool and Tasks
Special Education
Relationships with students
District office needs
Program development
Teaching students
Survey X X X X 0 Interview X X X 0 0 Shadowing X X 0 X 0
Findings
This study was conducted to answer the research question: What tasks and timelines do K-5 principals in the North County School District engage in during work? The results were drawn from K-5 principals who completed a survey, participated in an interview, and were shadowed by Educational Administration master’s students. The school district was interested in finding out why some principals were experiencing stress over the time requirements and the tasks in their jobs. This is a summary of the key findings :
1. The contexts and experiences of the principals vary greatly from school to school. 2. All principals put a high priority on students, visiting classes, and being visible on
campus. 3. The perception from principals is that they work around the clock…and more! 4. Principals spend the most amount of time complying with special education mandates,
special education student behavior, and special education meetings. 5. All principals work additional hours to finish paperwork that cannot be completed during
school hours. 6. Principals want district department initiatives to be streamlined and to require fewer off-
campus meetings. 7. Principals vary in their abilities to create work systems that enhance job efficiency. 8. Principals want ongoing support. The findings indicate that multiple settings affect the principals’ workload; that the principals
have varied skills; and that district office demands require additional support, especially in the area of special education.
Limitations Although the research reached its goals, there were some overarching limitations. These limitations mostly focus on the responses principals gave to the time-on-task survey:
1. The over-exaggerated time-on-task survey results may be caused by the format of the survey instrument, which was open ended.
2. The over-exaggerated time-on-task survey results may be considered a confounding variable that limits the certainty of the findings in the research.
3. The surveys may have been completed by principals who had hopes of getting help in reducing their workload.
4. The lead researcher was a former principal and may have a bias towards reducing principal workload.
Educational Leadership Administration: Teaching and Program Development March 2018; Vol.29: Issue 1
61
The limitations affected the way the data were analyzed; the list of the top and bottom 10 time-consuming activities can help get a sense of the items that took up the most time, but it does not necessarily indicate how much time.
Further Areas of Research The findings from the study indicate the need for further research on principal’s tasks and time allocation to be used as a foundation for decisions that may support principals who feel stressed and overworked. Two questions that need to be addressed are:
1. What is the impact and benefit of district initiatives on school principals and their sites? 2. What strategies and resources for reducing principal tasks can be gleaned from research?
Summary
This research recruited Educational Administration master’s level students to gather data on the time allocation and tasks of K-5 principals using surveys, interviews, and shadowing. The results vary and may be confounded by some responses, but overall they indicate that not all schools have the same demands on their principals, nor do all principals have the same organizational and time-management skills. A deeper awareness of the strains associated with the role of the principal and of the role of the school district office leadership in supporting or hindering the principals’ tasks and time allocation may increase the likelihood that principals will be content on the job, have balance in their lives, and remain in their positions longer.
Educational Leadership Administration: Teaching and Program Development March 2018; Vol.29: Issue 1
62
References Alvoid, L., & Black Jr, W. L. (2014). The changing role of the principal: How high-achieving
districts are recalibrating school leadership. Center for American Progress. Retrieved from https://cdn.americanprogress.org/wp-content/uploads/2014/06/PrincipalPD-FINAL.pdf.
Battle, D., & Gruber, K. (2010). Principal attrition and mobility: Results from the 2008-09 principal follow-up survey (NCES 2010-337). US Department of Education, National Center for Education Statistics. Washington, DC: US Government Printing Office. Retrieved from https://nces.ed.gov/pubs2010/2010337.pdf.
Beteille, T., Kalogrides, D., & Loeb, S. (2011). Stepping stones: Principal career paths and school outcomes. National Center for Analysis of Longitudinal Data in Education Research. Retrieved from http://www.caldercenter.org/upload/CALDERWorkPaper_58.pdf
Briggs, K., Rhines, Cheney, G., Davis, J., & Moll, K. (2013). Operating in the dark: What outdated state policies and data gaps mean for effective school leadership. Dallas, TX: The George W. Bush Institute.
Camburn, E., Spillane, J., Sebastian, J. (May, 2014). Assessing the utility of a daily log for measuring principal leadership practice. Educational Administration Quarterly, 707-737. Retrieved from http://www.cpre.org/sites/default/files/journal/1090_assessingtheutilityofdailylogs.pdf
Chang, Y., Leach, N., & Anderman, E. M. (2015). The role of perceived autonomy support in principals’ affective organizational commitment and job satisfaction. Social Psychology of Education, 18(2), 315–336.
Cooley, V., & Shen, J. (2003). School accountability and professional job responsibilities: A perspective from secondary principals. NASSP Bulletin, 87(684), 10–25.
Dhuey, E., & Smith, J. (2011). How important are school principals in the production of student achievement? Retrieved from http://www.clsrn.econ.ubc.ca/workingpapers/CLSRN%20Working%20Paper%20no.%2090%20
Gates, S. M., Ringel, J.S., Santibanez, L., Guarino, C., & Brown, A. (2006). Mobility and turnover among school principals. Economics of Education Review, 25, 289–302.
Grissom, J. A., Loeb, S., & Master, B. (2013). Effective instructional time use for school leaders: Longitudinal evidence from observations of principals. Educational Researcher, 42(8), 433–444.
Horng, E.L., Klasik, D., & Loeb, S. (2010). Principal’s time use and school effectiveness. American Journal of Education, 16(4), 491–523.
Ikemoto, G., Taliaferro, L., Fenton, B., & Davis, J. (2014). Great principals at scale: Creating district conditions that enable all principals to be effective new leaders. Dallas, TX: The George W. Bush Institute, New Leaders. Retieved from http://newleaders.org/wp-content/uploads/2016/09/Great-Principals-at-Scale-Report.pdf
MetLife. (2013, February). The MetLife survey of the American teacher: Challenges for school leadership. Retrieved from https://www.metlife.com/assets/cao/foundation/metlife-teacher-survey-2012.pdf
Northwestern University School of Education and Social Policy (2017). The distributed leadership study. Retrieved from http://www.distributedleadership.org/instruments.html.
Educational Leadership Administration: Teaching and Program Development March 2018; Vol.29: Issue 1
63
Pounder, D. G., Galvin, P., & Shepherd, P. (2003). An analysis of the United States educational administrator shortage. Australian Journal of Education, 47(2), 133–145.
Quinn, D. M. (2002). The impact of principal leadership behaviors on instructional practice and student engagement. Journal of Educational Administration, 40(5), 447–467. http://dx.doi.org/10.1108/09578230210440294
Shen, J. & Crawford, C.S. (2003). Introduction to the special issue: Characteristics of the secondary principalship. NASSP Bulletin, 87(634), 2–8. Sherman, W.H. & Crum, K. (2007). Student achievement, principal catalysts: Instructional
leadership in reading. International Journal for Educational Reform, 16(4), 390–410. Slater, L. (2008). Pathways to building leadership capacity. Educational Management
Administration & Leadership, 36(1), 55–69. Walker, J. (2009). Reorganizing leaders’ time: Does it create better schools for students? NASSP
Bulletin, 93(4), 213–226. Wells, Caryn M. (2013). Principals responding to constant pressure: Finding a source of stress
management. NASSP Bulletin, 97(4), 335-349. Winter, P. A., & Morgenthal, J. R. (2002). Principal recruitment in a reform environment: Effects of school achievement and school level on applicant attraction to the job. Educational Administration Quarterly, 38(3), 319–340.
Educational Leadership Administration: Teaching and Program Development March 2018; Vol.29: Issue 1
64
Do Something That Scares You Each Day:
The Role of Self-Efficacy in Preparing School Leaders
Jaymi Abusham University of La Verne
Abstract This study examined the relationship between the leadership readiness beliefs of perspective school leaders and the efficacy-building experiences in which they participated during university preparation programs. I developed and administered a survey to 176 prospective school leaders during the final months of their preliminary administrative credential preparation programs. I found a moderate positive correlation between the number of efficacy-building experiences in which students took part and the leadership readiness that they reported. Based on these results, this article offers specific recommendations for university programs that desire to best prepare their students through efficacy-based training.
Educational Leadership Administration: Teaching and Program Development March 2018; Vol.29: Issue 1
65
As a new leader, I arrived at my school site each day and told myself that I would confront my fear of new challenges at least one time during that day. If I encountered that task first thing, I gave myself permission to delay subsequent challenges when possible. In time, I came to realize I was leaning on solid research for success in school leadership. However, the list of demands placed upon today’s leaders is longer than it was for me, and it continues to grow (Davis, Darling-Hammond, LaPointe, & Meyerson, 2005; Fisher, 2011). Among other responsibilities, our school leaders are expected to transform instructional practices for diverse learners, foster inclusive cultures, meet the social and emotional needs of students and staff, develop coalitions that engage families and community partners, optimize fiscal resources, and respond to crises as they develop. Indeed, a newly appointed school principal is tasked with considerably different work than the retiring principal that he or she replaces. Complex tasks, often occurring simultaneously, require leaders to constantly rethink their roles, modify their responsibilities, and build new relationships (Davis et al., 2005; Dimmock & Hattie, 1996).
Although alternative methods for credentialing are available in some states, most school leaders continue to prepare through university programs. Critics have called for reform to these programs for many years (English, 2006; Levine, 2005; Murphy, 2006; Teitel, 2006), and some progress has been made with the revision of professional standards. Updated standards can serve to align expectations within and across programs, but they alone are not sufficient to ensure that programs will adequately prepare prospective leaders. Acknowledging this, some states have developed performance assessments that require candidates for the administrative credential to execute responsibilities associated with school leadership. Although the shift to performance assessment holds promise, effective preparation programs must do more to develop learning experiences that promote success in a broad range of school settings, under widely varied circumstances, and within an environment that changes rapidly.
The preparation of effective leaders should not focus on a fixed set of skills, because those skills are likely to continue to change at a rapid pace. Leadership preparation should be based upon tools that have been proven to correlate with successful performance, and the construct of efficacy has been shown to be essential. Bandura (1977, 1993) demonstrated that individuals process, weigh, and integrate diverse sources of information when encountering a new task. They filter the tasks that they choose and the effort that they expend based on feelings about their capacity to succeed. People with stronger efficacy set higher goals for themselves and are more committed to accomplishing them. Knowledge, skills, and prior success are all less predictive of performance than efficacy (Pajares, 1996).
Efficacy can be characterized as a “product of reciprocal causation” between belief and environment (Bandura & Wood, 1989, p. 806), and people who have greater efficacy are more likely to be successful and therefore feel more capable. This leads them to take on more challenging tasks that they are likely to do well, and their success yields even greater efficacy. Efficacy contributes to success in four distinct ways: It regulates the goals people are willing to set for themselves, it influences the amount of effort invested into goal attainment, it controls the amount of time people are willing to persevere in the face of obstacles, and it determines how well they will recover when they do not succeed (Bandura, 1993).
Individuals with stronger efficacy demonstrated more effective analytical thinking (Bandura & Wood, 1989). In management simulation exercises, those with high efficacy set increasingly challenging goals and exceeded their initial goals by a significant margin. Conversely, people identified with low efficacy set diminishing goals as the experiment
Educational Leadership Administration: Teaching and Program Development March 2018; Vol.29: Issue 1
66
progressed. This is similar to what happens with successful and struggling schools and districts. Once school teams have been identified as achieving, they are praised for their performance, which begets higher goals and greater performance; conversely, schools that are identified as failing seldom seem to get beyond the label and continue to fail year after year.
Efficacious leaders are more effective in their pursuit of long-range goals (Tschannen-Moran & Gareis, 2004). Individuals with high efficacy are more willing to modify intermediate goals and strategies to respond to the needs of the individuals whom they lead. In contrast, leaders with low efficacy are rigidly persistent when confronted with failure, and they prove unwilling or unable to revise their goals or generate alternative strategies. Efficacy changes the way that leaders talk about their work: Individuals with high efficacy are overwhelmingly optimistic and reframe failures as challenges. They see a lack of progress as a realistic part of their jobs and not as an indictment of their own ability to lead (Tschannen-Moran & Gareis, 2004).
The research on efficacy in schools unilaterally points to the need for highly efficacious leaders (Bandura & Wood, 1989; Dimmock & Hattie, 1996; Eberhard, 2013). Efficacious schools and leaders are able to increase student achievement, reduce the impact of economic disadvantage, enhance relationships with families, and reinforce teacher commitment (Brinson & Steiner, 2007). In contrast, low self-efficacy was directly linked to the choice of some principals to leave the profession as well as a major consideration when a school failed to improve (Federici & Skaalvik, 2012).
If our schools need efficacious leaders, then university programs should seek to develop efficacy in prospective leaders. Although research supports the proposition that school leaders need efficacy, there is a paucity of data to inform how efficacy can be developed during preparation. Bandura’s (1977, 1978, 1986, 1993, 2006) extensive body of research gives clear direction on the four ways that efficacy can be developed: performance accomplishments, vicarious experiences, verbal persuasion, and affective state.
The present research sought to determine if prospective administrators developed efficacy through participation in efficacy-building experiences in university preparation programs. This article presents the methodology for this quantitative study, a discussion of research findings, and implications for the field of educational administration.
Method
This study explored the relationship between participation in efficacy-building experiences in leader preparation programs and the leadership readiness reported by candidates in those programs. There is ample research both on methods for developing efficacy and on the preparation of school leaders, but no instrument existed to examine the two factors in concert. The quasi-experimental design for this study investigated quantitative data from a survey developed and administered to preliminary credential candidates nearing the end of their preparation programs. The hypothesis was that if prospective school leaders are trained using methods identified to build efficacy, then students will report a greater readiness to lead our schools. The guiding research question for this study was: Do students who participate in more efficacy-building experiences during their administrative preparation programs report greater leadership readiness than do those whose programs contained fewer efficacy-building experiences?
Educational Leadership Administration: Teaching and Program Development March 2018; Vol.29: Issue 1
67
I asked candidates for the preliminary administrative services credential about their preparation programs. I selected five state university campuses for participation because they were well established, offered competitively priced programs, and were the top producers of educational leaders in the region of study at the time. In addition, graduates of these programs work in a wide variety of school settings. Although the requirements of these programs are specific to the state of California, prospective school leaders in other states participate in similar courses of study. This study sought to include all students who were within six months of completing their preliminary credential program. I administered a paper-and-pencil survey during face-to-face encounters in all classes that granted access. The convenience sample included 176 respondents.
Designed to explore the efficacy beliefs of individuals enrolled in preliminary administrative preparation programs, items in the survey measured two general constructs: leadership readiness (dependent variable) and efficacy-building experiences (independent variable). The first construct, leadership readiness, was developed to measure leadership efficacy. Efficacy is not a global trait but rather a measure of an individual’s belief in his or her ability to succeed in a given domain (Bandura, 2006). Therefore, an efficacy survey in a given area, such as school leadership, must first identify the traits or behaviors that are required for success in that domain. It did not matter whether a respondent believed that he or she would actually have the opportunity to demonstrate a certain leadership behavior; rather, what mattered in the construct of efficacy was the individual’s belief that he or she would be able to demonstrate the behavior. I also carefully worded my questions to avoid confusion with the construct of motivation: The survey did not ask participants to state whether they were eager to demonstrate the behavior, but rather whether they believed they could do so when needed.
Efficacy is measured by determining what is necessary to be successful in a particular domain of functioning (Bandura, 2006), and for this purpose I used the McREL Balanced Leadership Framework (Waters & Cameron, 2007). This meta-analysis identifies 21 leadership responsibilities that are correlated to student achievement. These responsibilities are grouped into three domains: focus, magnitude, and purposeful community.
The first domain, focus, designates the set of behaviors by which effective leaders ensure that the efforts of the school are aimed at developing practices that promote positive outcomes for students. The second domain, magnitude, includes responsibilities that support a substantial shift in the underlying value systems whereby schools operate rather than changes in isolated procedures or practices. Magnitude is represented by a break with the past as opposed to an extension of old practices: This is change that is outside of existing paradigms and that requires new knowledge and a new set of skills to implement. The third domain, purposeful community, is the cultivation of a school community that is bonded together by a common goal that can only be achieved if all members participate.
In the survey, these responsibilities were formulated into statements, and prospective school leaders were asked to consider whether they believed they would be able to successfully execute them. The statements were designed to provide information about overall perceptions of leadership readiness as well as readiness within the subdomains of focus, magnitude, and purposeful community. The data were measured by a 5-point Likert scale, ranging from 1 = strongly agree to 5 = strongly disagree (Table 1).
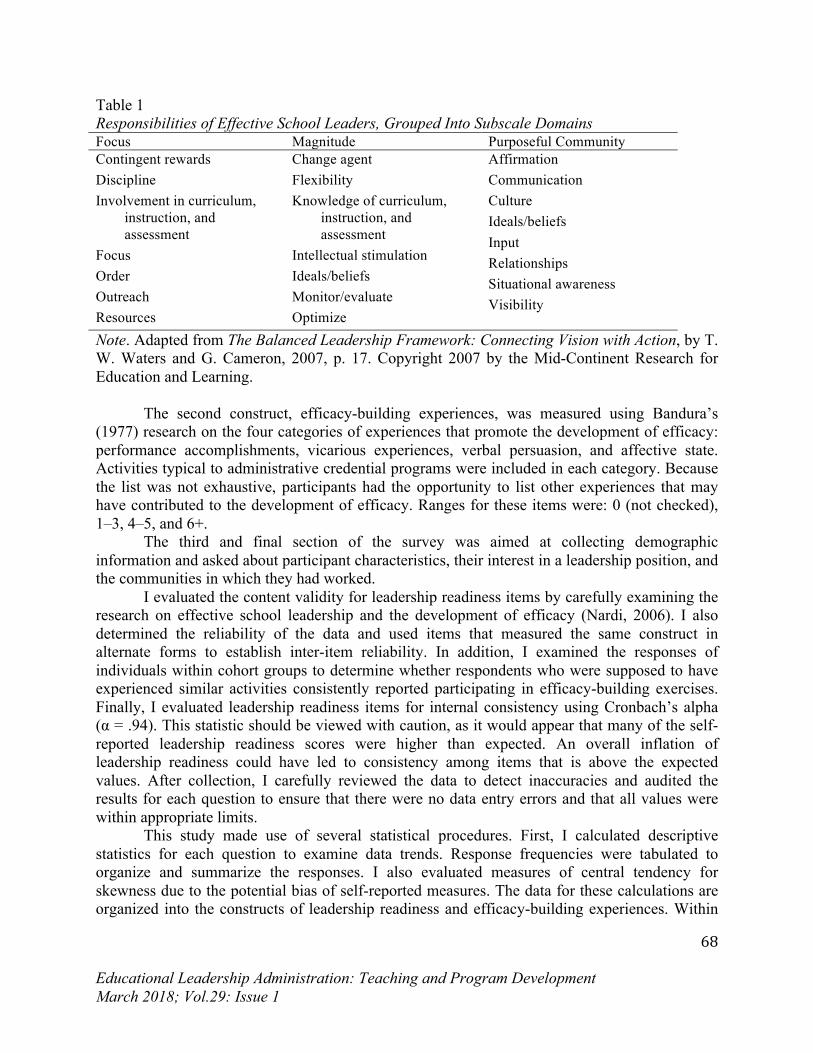
Educational Leadership Administration: Teaching and Program Development March 2018; Vol.29: Issue 1
68
Table 1 Responsibilities of Effective School Leaders, Grouped Into Subscale Domains Focus Magnitude Purposeful Community Contingent rewards Discipline Involvement in curriculum,
instruction, and assessment
Focus Order Outreach Resources
Change agent Flexibility Knowledge of curriculum,
instruction, and assessment
Intellectual stimulation Ideals/beliefs Monitor/evaluate Optimize
Affirmation Communication Culture Ideals/beliefs Input Relationships Situational awareness Visibility
Note. Adapted from The Balanced Leadership Framework: Connecting Vision with Action, by T. W. Waters and G. Cameron, 2007, p. 17. Copyright 2007 by the Mid-Continent Research for Education and Learning.
The second construct, efficacy-building experiences, was measured using Bandura’s (1977) research on the four categories of experiences that promote the development of efficacy: performance accomplishments, vicarious experiences, verbal persuasion, and affective state. Activities typical to administrative credential programs were included in each category. Because the list was not exhaustive, participants had the opportunity to list other experiences that may have contributed to the development of efficacy. Ranges for these items were: 0 (not checked), 1–3, 4–5, and 6+.
The third and final section of the survey was aimed at collecting demographic information and asked about participant characteristics, their interest in a leadership position, and the communities in which they had worked.
I evaluated the content validity for leadership readiness items by carefully examining the research on effective school leadership and the development of efficacy (Nardi, 2006). I also determined the reliability of the data and used items that measured the same construct in alternate forms to establish inter-item reliability. In addition, I examined the responses of individuals within cohort groups to determine whether respondents who were supposed to have experienced similar activities consistently reported participating in efficacy-building exercises. Finally, I evaluated leadership readiness items for internal consistency using Cronbach’s alpha (α = .94). This statistic should be viewed with caution, as it would appear that many of the self-reported leadership readiness scores were higher than expected. An overall inflation of leadership readiness could have led to consistency among items that is above the expected values. After collection, I carefully reviewed the data to detect inaccuracies and audited the results for each question to ensure that there were no data entry errors and that all values were within appropriate limits.
This study made use of several statistical procedures. First, I calculated descriptive statistics for each question to examine data trends. Response frequencies were tabulated to organize and summarize the responses. I also evaluated measures of central tendency for skewness due to the potential bias of self-reported measures. The data for these calculations are organized into the constructs of leadership readiness and efficacy-building experiences. Within
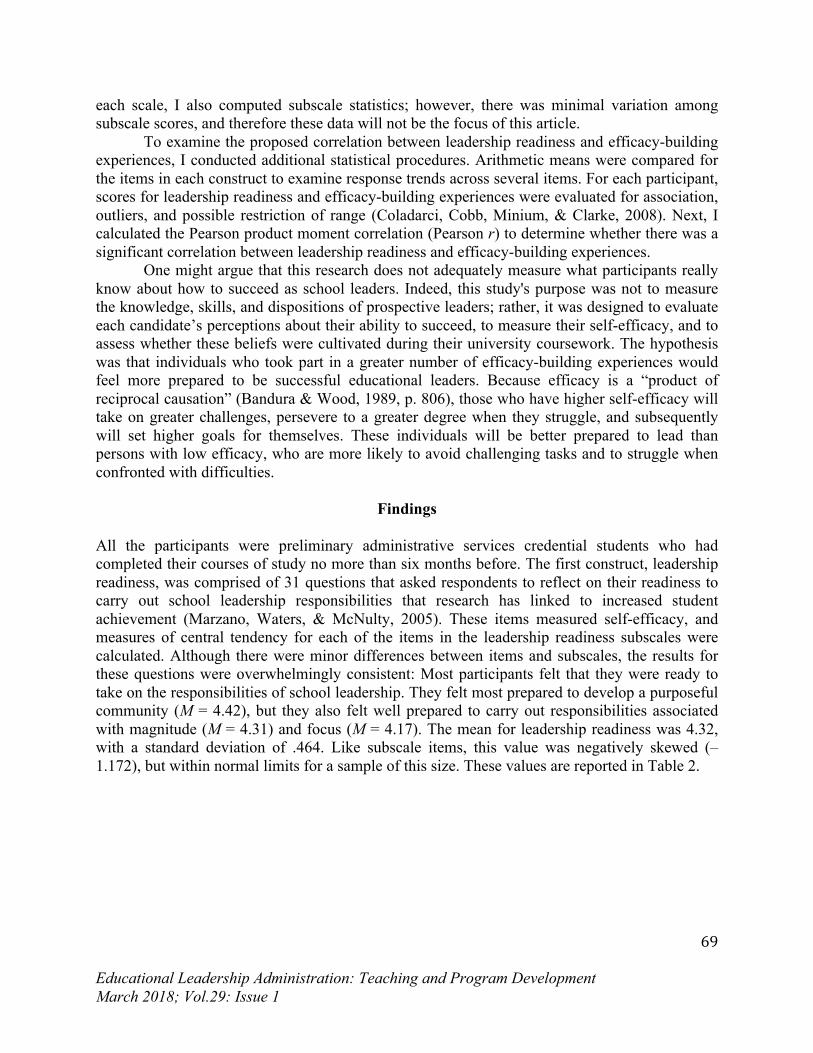
Educational Leadership Administration: Teaching and Program Development March 2018; Vol.29: Issue 1
69
each scale, I also computed subscale statistics; however, there was minimal variation among subscale scores, and therefore these data will not be the focus of this article.
To examine the proposed correlation between leadership readiness and efficacy-building experiences, I conducted additional statistical procedures. Arithmetic means were compared for the items in each construct to examine response trends across several items. For each participant, scores for leadership readiness and efficacy-building experiences were evaluated for association, outliers, and possible restriction of range (Coladarci, Cobb, Minium, & Clarke, 2008). Next, I calculated the Pearson product moment correlation (Pearson r) to determine whether there was a significant correlation between leadership readiness and efficacy-building experiences.
One might argue that this research does not adequately measure what participants really know about how to succeed as school leaders. Indeed, this study's purpose was not to measure the knowledge, skills, and dispositions of prospective leaders; rather, it was designed to evaluate each candidate’s perceptions about their ability to succeed, to measure their self-efficacy, and to assess whether these beliefs were cultivated during their university coursework. The hypothesis was that individuals who took part in a greater number of efficacy-building experiences would feel more prepared to be successful educational leaders. Because efficacy is a “product of reciprocal causation” (Bandura & Wood, 1989, p. 806), those who have higher self-efficacy will take on greater challenges, persevere to a greater degree when they struggle, and subsequently will set higher goals for themselves. These individuals will be better prepared to lead than persons with low efficacy, who are more likely to avoid challenging tasks and to struggle when confronted with difficulties.
Findings
All the participants were preliminary administrative services credential students who had completed their courses of study no more than six months before. The first construct, leadership readiness, was comprised of 31 questions that asked respondents to reflect on their readiness to carry out school leadership responsibilities that research has linked to increased student achievement (Marzano, Waters, & McNulty, 2005). These items measured self-efficacy, and measures of central tendency for each of the items in the leadership readiness subscales were calculated. Although there were minor differences between items and subscales, the results for these questions were overwhelmingly consistent: Most participants felt that they were ready to take on the responsibilities of school leadership. They felt most prepared to develop a purposeful community (M = 4.42), but they also felt well prepared to carry out responsibilities associated with magnitude (M = 4.31) and focus (M = 4.17). The mean for leadership readiness was 4.32, with a standard deviation of .464. Like subscale items, this value was negatively skewed (–1.172), but within normal limits for a sample of this size. These values are reported in Table 2.
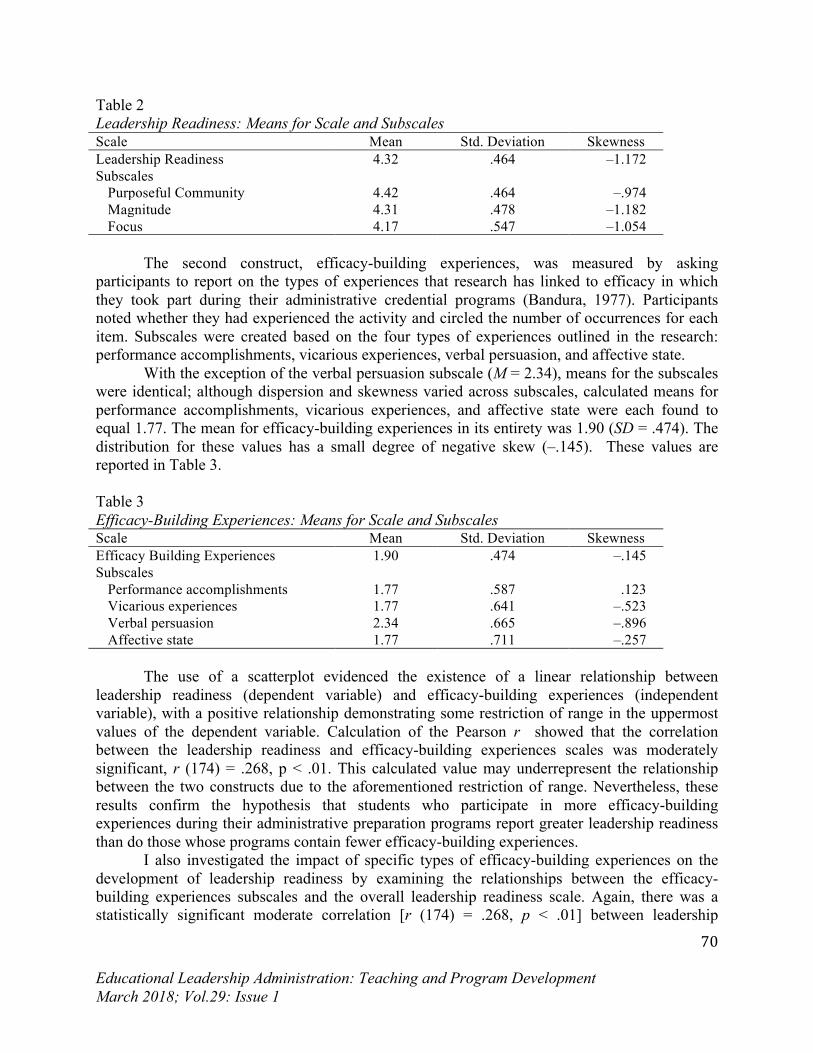
Educational Leadership Administration: Teaching and Program Development March 2018; Vol.29: Issue 1
70
Table 2 Leadership Readiness: Means for Scale and Subscales Scale Mean Std. Deviation Skewness Leadership Readiness 4.32 .464 –1.172 Subscales
Purposeful Community 4.42 .464 –.974 Magnitude 4.31 .478 –1.182 Focus 4.17 .547 –1.054
The second construct, efficacy-building experiences, was measured by asking
participants to report on the types of experiences that research has linked to efficacy in which they took part during their administrative credential programs (Bandura, 1977). Participants noted whether they had experienced the activity and circled the number of occurrences for each item. Subscales were created based on the four types of experiences outlined in the research: performance accomplishments, vicarious experiences, verbal persuasion, and affective state.
With the exception of the verbal persuasion subscale (M = 2.34), means for the subscales were identical; although dispersion and skewness varied across subscales, calculated means for performance accomplishments, vicarious experiences, and affective state were each found to equal 1.77. The mean for efficacy-building experiences in its entirety was 1.90 (SD = .474). The distribution for these values has a small degree of negative skew (–.145). These values are reported in Table 3. Table 3 Efficacy-Building Experiences: Means for Scale and Subscales Scale Mean Std. Deviation Skewness Efficacy Building Experiences 1.90 .474 –.145 Subscales
Performance accomplishments 1.77 .587 .123 Vicarious experiences 1.77 .641 –.523 Verbal persuasion 2.34 .665 –.896 Affective state 1.77 .711 –.257
The use of a scatterplot evidenced the existence of a linear relationship between
leadership readiness (dependent variable) and efficacy-building experiences (independent variable), with a positive relationship demonstrating some restriction of range in the uppermost values of the dependent variable. Calculation of the Pearson r showed that the correlation between the leadership readiness and efficacy-building experiences scales was moderately significant, r (174) = .268, p < .01. This calculated value may underrepresent the relationship between the two constructs due to the aforementioned restriction of range. Nevertheless, these results confirm the hypothesis that students who participate in more efficacy-building experiences during their administrative preparation programs report greater leadership readiness than do those whose programs contain fewer efficacy-building experiences.
I also investigated the impact of specific types of efficacy-building experiences on the development of leadership readiness by examining the relationships between the efficacy-building experiences subscales and the overall leadership readiness scale. Again, there was a statistically significant moderate correlation [r (174) = .268, p < .01] between leadership
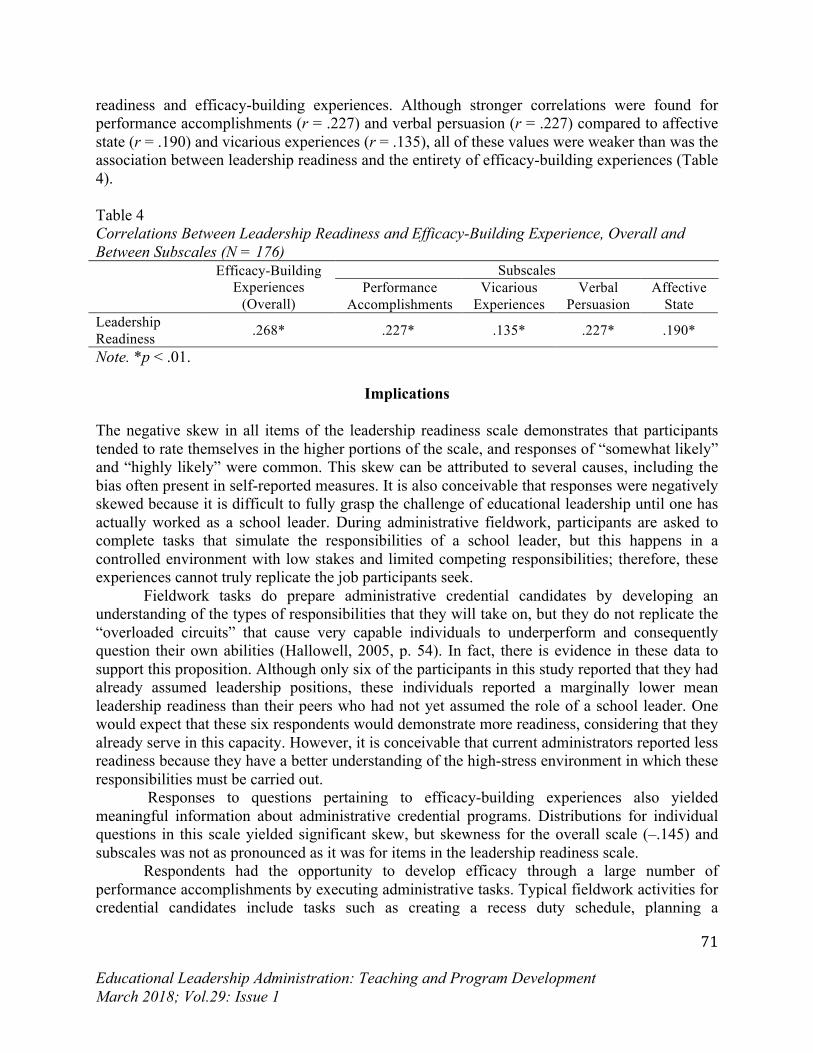
Educational Leadership Administration: Teaching and Program Development March 2018; Vol.29: Issue 1
71
readiness and efficacy-building experiences. Although stronger correlations were found for performance accomplishments (r = .227) and verbal persuasion (r = .227) compared to affective state (r = .190) and vicarious experiences (r = .135), all of these values were weaker than was the association between leadership readiness and the entirety of efficacy-building experiences (Table 4). Table 4 Correlations Between Leadership Readiness and Efficacy-Building Experience, Overall and Between Subscales (N = 176) Efficacy-Building
Experiences (Overall)
Subscales Performance
Accomplishments Vicarious
Experiences Verbal
Persuasion Affective
State Leadership Readiness .268* .227* .135* .227* .190*
Note. *p < .01.
Implications
The negative skew in all items of the leadership readiness scale demonstrates that participants tended to rate themselves in the higher portions of the scale, and responses of “somewhat likely” and “highly likely” were common. This skew can be attributed to several causes, including the bias often present in self-reported measures. It is also conceivable that responses were negatively skewed because it is difficult to fully grasp the challenge of educational leadership until one has actually worked as a school leader. During administrative fieldwork, participants are asked to complete tasks that simulate the responsibilities of a school leader, but this happens in a controlled environment with low stakes and limited competing responsibilities; therefore, these experiences cannot truly replicate the job participants seek.
Fieldwork tasks do prepare administrative credential candidates by developing an understanding of the types of responsibilities that they will take on, but they do not replicate the “overloaded circuits” that cause very capable individuals to underperform and consequently question their own abilities (Hallowell, 2005, p. 54). In fact, there is evidence in these data to support this proposition. Although only six of the participants in this study reported that they had already assumed leadership positions, these individuals reported a marginally lower mean leadership readiness than their peers who had not yet assumed the role of a school leader. One would expect that these six respondents would demonstrate more readiness, considering that they already serve in this capacity. However, it is conceivable that current administrators reported less readiness because they have a better understanding of the high-stress environment in which these responsibilities must be carried out.
Responses to questions pertaining to efficacy-building experiences also yielded meaningful information about administrative credential programs. Distributions for individual questions in this scale yielded significant skew, but skewness for the overall scale (–.145) and subscales was not as pronounced as it was for items in the leadership readiness scale.
Respondents had the opportunity to develop efficacy through a large number of performance accomplishments by executing administrative tasks. Typical fieldwork activities for credential candidates include tasks such as creating a recess duty schedule, planning a
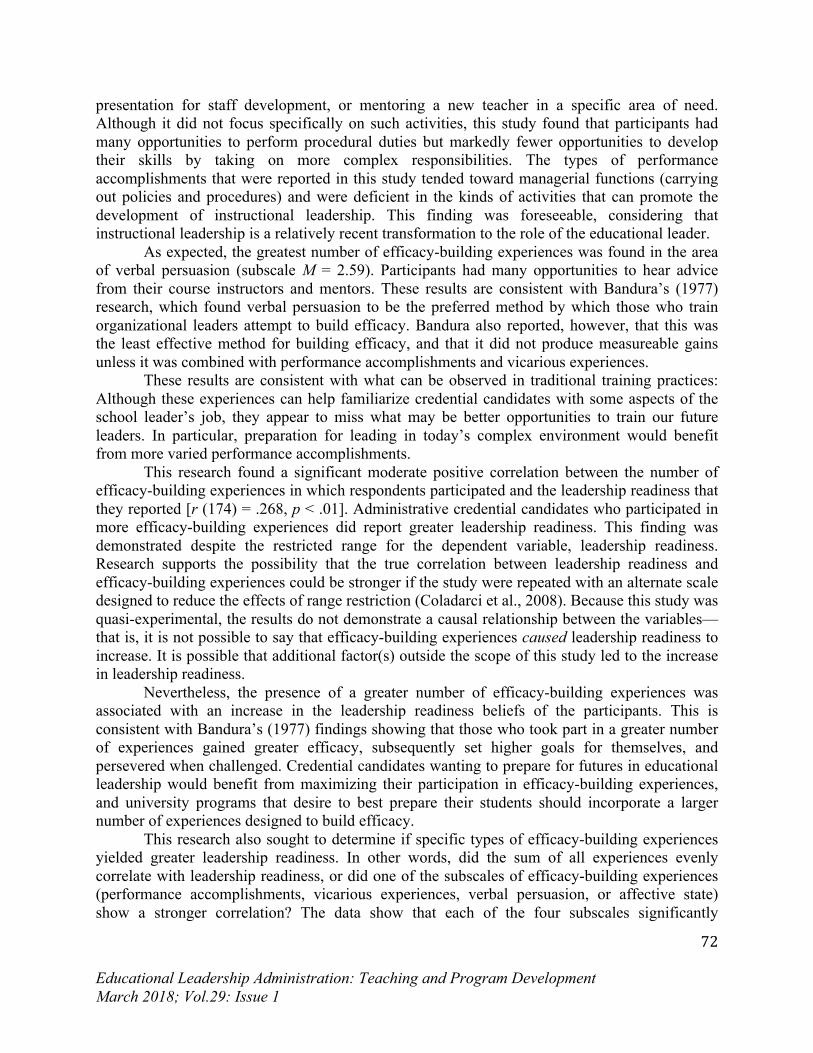
Educational Leadership Administration: Teaching and Program Development March 2018; Vol.29: Issue 1
72
presentation for staff development, or mentoring a new teacher in a specific area of need. Although it did not focus specifically on such activities, this study found that participants had many opportunities to perform procedural duties but markedly fewer opportunities to develop their skills by taking on more complex responsibilities. The types of performance accomplishments that were reported in this study tended toward managerial functions (carrying out policies and procedures) and were deficient in the kinds of activities that can promote the development of instructional leadership. This finding was foreseeable, considering that instructional leadership is a relatively recent transformation to the role of the educational leader.
As expected, the greatest number of efficacy-building experiences was found in the area of verbal persuasion (subscale M = 2.59). Participants had many opportunities to hear advice from their course instructors and mentors. These results are consistent with Bandura’s (1977) research, which found verbal persuasion to be the preferred method by which those who train organizational leaders attempt to build efficacy. Bandura also reported, however, that this was the least effective method for building efficacy, and that it did not produce measureable gains unless it was combined with performance accomplishments and vicarious experiences.
These results are consistent with what can be observed in traditional training practices: Although these experiences can help familiarize credential candidates with some aspects of the school leader’s job, they appear to miss what may be better opportunities to train our future leaders. In particular, preparation for leading in today’s complex environment would benefit from more varied performance accomplishments.
This research found a significant moderate positive correlation between the number of efficacy-building experiences in which respondents participated and the leadership readiness that they reported [r (174) = .268, p < .01]. Administrative credential candidates who participated in more efficacy-building experiences did report greater leadership readiness. This finding was demonstrated despite the restricted range for the dependent variable, leadership readiness. Research supports the possibility that the true correlation between leadership readiness and efficacy-building experiences could be stronger if the study were repeated with an alternate scale designed to reduce the effects of range restriction (Coladarci et al., 2008). Because this study was quasi-experimental, the results do not demonstrate a causal relationship between the variables—that is, it is not possible to say that efficacy-building experiences caused leadership readiness to increase. It is possible that additional factor(s) outside the scope of this study led to the increase in leadership readiness.
Nevertheless, the presence of a greater number of efficacy-building experiences was associated with an increase in the leadership readiness beliefs of the participants. This is consistent with Bandura’s (1977) findings showing that those who took part in a greater number of experiences gained greater efficacy, subsequently set higher goals for themselves, and persevered when challenged. Credential candidates wanting to prepare for futures in educational leadership would benefit from maximizing their participation in efficacy-building experiences, and university programs that desire to best prepare their students should incorporate a larger number of experiences designed to build efficacy.
This research also sought to determine if specific types of efficacy-building experiences yielded greater leadership readiness. In other words, did the sum of all experiences evenly correlate with leadership readiness, or did one of the subscales of efficacy-building experiences (performance accomplishments, vicarious experiences, verbal persuasion, or affective state) show a stronger correlation? The data show that each of the four subscales significantly
Educational Leadership Administration: Teaching and Program Development March 2018; Vol.29: Issue 1
73
correlated to leadership readiness, but none of the subscales demonstrated a correlation as strong as that which was found overall. Therefore, it appears that it is the sum of these experiences that matters more than any specific domain of activities. This is consistent with Bandura’s (1977) research, which alluded to the effects of combining verbal persuasion with performance experiences. Further, Bandura stated that an individual’s affective state mattered to the extent that it either aided or hindered involvement in other types of experiences.
This finding also calls into question the manner in which fieldwork often focuses on individual tasks in isolation. If the sum of experiences is more important than individual tasks, and the job of a school leader is characterized by an environment in which multiple duties must be accomplished simultaneously, then fieldwork should require a similar experience.
This research demonstrates that the areas of responsibility for education leaders are interrelated and should not be considered in isolation. Theoretical constructs often present frameworks for leaders as a collection of discrete actions. However, these data reinforce the practical reality that the responsibilities of a school leader are not so linear or discrete. The work of a school leader is not performed as a series of isolated actions, detached from each other. Educational leadership involves multiple tasks that depend upon one another, happen simultaneously, and affect each other’s outcome. The data in this study support the proposition that leadership readiness is developed in sum, rather than in specific domains.
The results of this study form the basis for several recommendations for the preparation of educational leaders. The main finding of this study is that the inclusion of a greater number of efficacy-building experiences into administrative credential programs will increase the leadership readiness of our future leaders. A systematic program that explicitly includes efficacy-building experiences (performance accomplishments, vicarious experiences, verbal persuasion, and affective state) into field experiences and coursework will provide future school leaders with better training for their positions.
The impetus for this research was a criticism of educational leadership programs that has permeated both the literature and the public dialogue. This study posited that programs that invest in efficacy building can increase their viability by proving that they are needed to develop effective leaders prepared to meet the complex demands of today’s schools.
However, this study was not able to identify specific programs or program characteristics that contributed to the development of leadership readiness. Therefore, this research suggests that a wide range of efficacy-building activities should be incorporated in administrative credential programs, so that students can maximize the number of efficacy-building experiences in which they participate. Further, individuals who participate in these experiences should expect them to help develop a generalized leadership readiness, as the development of specific types of leadership readiness was not found. It is my hope that this research will serve as an impetus for the refinement of educational leadership curricula and that future research will provide further insights on incorporating efficacy-based training into the preparation of high-quality educational leaders.
Educational Leadership Administration: Teaching and Program Development March 2018; Vol.29: Issue 1
74
References
Bandura, A. (1977). Self-efficacy: Toward a unifying theory of behavioral change. Psychological Review, 84(2), 191–215.
Bandura, A. (1978). Reflections on self-efficacy. Advanced Research Therapy, 1, 237–269. Bandura, A. (1986). Social foundations of thought and action. Englewood Cliffs, NJ: Prentice-
Hall. Bandura, A. (1993). Perceived self-efficacy in cognitive development and functioning.
Educational Psychologist, 28(2), 117–148. Bandura, A. (2006). Guide for constructing self-efficacy scales. In F. Pajares & T. Urdan (Eds.),
Self-efficacy beliefs of adolescents (pp. 307–337). Greenwich, CT: Information Age. Bandura, A., & Wood, R. (1989). Effects of perceived controllability and performance standards
on self-regulation of complex decision making. Journal of Personality and Social Psychology, 56(5), 805–814.
Brinson D., & Steiner, L. (2007). Building collective efficacy: How leaders inspire teachers to achieve (Issue Brief). Washington, DC: Center for Comprehensive School Reform and Improvement.
Coladarci, T., Cobb, C. D., Minium, E. W., & Clarke, R. B. (2008). Fundamentals of statistical reasoning in education (2nd ed.). Hoboken, NJ: Wiley & Sons.
Davis, S., Darling-Hammond, L., LaPointe, M., & Meyerson, D. (2005). School leadership study: Developing successful principals (review of research). Stanford, CA: Stanford University Stanford Educational Leadership Institute.
Dimmock, C., & Hattie, J. (1996). School principals’ self-efficacy and its measurement in a context of restructuring. School Effectiveness and School Improvement, 7(1), 62–75.
Eberhard, J. (2013). School administration self-efficacy: Change-agents in an environment of turbulence. In M. Plakhotnik, & S. Nielsen (Ed.), Proceedings of the 12th annual South Florida education research conference (pp. 45–52). Miami, FL: Florida International University.
English, F. W. (2006). The unintended consequences of a standardized knowledge base in advancing educational leadership preparation. Education Administration Quarterly, 42(3), 461–472.
Federici, R.A. & Skaalvik, E.M. (2012). Principal self-efficacy: Relations with burnout, job satisfaction and motivation to quit. Social Psychology of Education, 15(3), 295–320.
Fisher, Y. (2011). The sense of self-efficacy of aspiring principals: Exploration in a dynamic concept. Social Psychology of Education, 14, 93–117.
Hallowell, E. M. (2005). Overloaded circuits: Why smart people underperform. Harvard Business Review, 83(1), 54–62.
Levine, A. (2005). Educating school leaders. Washington, DC: The Education Schools Project. Marzano, R. J., Waters, T., & McNulty, B. A. (2005). School leadership that works: From
research to results. Alexandria, VA: ASCD. Murphy, J. T. (2006). Dancing lessons for elephants: Reforming ed school leadership programs,
Phi Delta Kappan, 87(7), 489–491. Nardi, P. M. (2006). Doing survey research: A guide to quantitative methods. Boston, MA:
Allyn & Bacon.
Educational Leadership Administration: Teaching and Program Development March 2018; Vol.29: Issue 1
75
Pajares, F. (1996). Self-efficacy beliefs in academic settings. Review of Educational Research, 66(4), 543–578.
Teitel, L. (2006). Mapping the terrain of “alternative” leadership education: Lessons for universities. Phi Delta Kappan, 87(7), 500–507.
Tschannen-Moran, M., & Gareis, C. R. (2004). Principals’ sense of efficacy: Assessing a promising construct. Journal of Educational Administration, 42(5), 573–585.
Waters, T. W., & Cameron, G. (2007). The balanced leadership framework: Connecting vision with action. Denver, CO: Mid-Continent Research for Education and Learning.
Educational Leadership Administration: Teaching and Program Development March 2018; Vol.29: Issue 1
76
Manuscript Submission Information
Volume 30: July 30th, 2018 deadline Call for Papers of the Journal of Educational Leadership and Administration:
Teaching and Program Development
The Journal of Educational Leadership and Administration: Teaching and Program Development is a refereed journal published since 1988 by the California Association of Professors of Educational Administration (CAPEA). This 30th volume, published in partnership with CAPEA’s national affiliate, ICPEL Publications, and the International Council of Professors of Educational Leadership [formerly the National Council of Professors of Educational Administration (NCPEA)], is produced in a digital format as an Open Education Resource (OER) intended for worldwide readership, and it also includes a print-on-demand option. The Journal is listed in the Current Index to Journals in Education (CIJE). The editors welcome contributions that focus on promising practices and on ways to improve educational leadership preparation programs. The Journal pays close attention to current issues, such as schools’ local control and the surrender of public education to market business interests. Reversing policy trends that have been on the rise since 1983 with the release of the seminal US Department of Education report A Nation at Risk, a political consensus appears to be developing that calls for the devolution of public education policy decision making from the federal level to the state and local level. At the same time, a parallel and seemingly contradictory effort for the privatization and marketization of elementary, secondary, and higher public institutions is also on the rise. The Journal invites articles on public policies that have an impact on leadership preparation as well as articles addressing national policies and trends such as anti-immigration and anti-union efforts that affect schools and communities. The Journal seeks articles that provide creatively surprising perspectives and solutions to said trends. The Journal also pursues the publication of articles documenting new and creative alternatives to traditional pedagogies and leadership approaches, as well as bold organizational models that counter dominant discourses and threats such as the destruction of public education and the end of secular public education in the country. We follow five organizing focus areas:
Educational Leadership Administration: Teaching and Program Development March 2018; Vol.29: Issue 1
77
1) Preparing educational leaders is the primary function of professors of educational administration. As faculty who actively pursue teaching, scholarship, service, and research while staying in touch with state and local school systems, we should be open to how we develop and implement school leadership preparation programs: How does research inform best practices for educating school leaders? What curriculum, teaching, and assessment practices seem most promising for equipping school leaders with the knowledge, skills, and dispositions necessary for today’s leaders? What resources are useful to faculty members in the preparation of school leaders? How have policy proposals at the state or national level, such as the introduction and adoption of national and state standards for school leaders, affected curriculum, instruction, or assessment of leadership preparation and administrative credential programs? 2) Diversity and social justice is an area of rich opportunities for the development of leaders, research, program design, and curriculum innovation. How can educational administration program faculty increase their knowledge and take action related to diversity issues that affect schools and school leaders? How do leaders enhance self-awareness, attitudes, behaviors, and perceptions regarding diversity? How can educational administration programs train school leaders who will promote democratic schools? What steps are being taken to recruit and retain underrepresented university faculty and those in school leadership positions? 3) Technology serves as an overarching focus permeating all other areas. CAPEA members accept the responsibility of preparing leaders for our information age and global society. What strategies and techniques effectively integrate technology into the curriculum and/or teaching of education leaders? What current research supports distance learning, electronic communication, presentation skills, web journals, web folios, etc.? What teaching formats and activities invite a variety of perspectives and favor the inclusion of the nontraditional student? 4) Research in educational leadership is essential to ensure ongoing, high-quality development of the field. The members of CAPEA are interested in pursuing various research paradigms and methodologies, ways to share and present scholarly research, ideas about generating research topics, vehicles for reporting research, the integration of research and technology, resources and grants to support student research, and the use of educational research to influence public policy. 5) Advocacy is a way of integrating the development of leaders with the responsibility of influencing public policy. How can educational leaders identify important political issues, lobby effectively, and affect public policy decisions? How can technology assist in the role and responsibility of advocacy for education leaders? What issues are education leaders and policy makers currently addressing across the country?
Educational Leadership Administration: Teaching and Program Development March 2018; Vol.29: Issue 1
78
Protocols for Submission to the Journal of Educational Leadership and Administration:
Teaching and Program Development
Besides a permanent call for papers focused on CAPEA’s key areas of concern, the Journal periodically puts out blind calls for special issues. All submissions must be original and unpublished. Authors published in the Journal can submit a new article, as single authors or in collaboration with others, three years after the publication of their last accepted manuscript.
Beginning with Volume 30, CAPEA membership fee will cover the publication fee for accepted submission of the organization’s members. Authors of accepted submissions who are not members will pay the following fee: Doctoral students: $35; All others: $50. Submissions must include:
1. A one-hundred (100) word abstract and five (5) key words. Send to the Managing Editor one electronic copy of the manuscript prepared using a Word processing program.
2. A letter signed by the author(s) authorizing permission to publish the manuscript. 3. A separate cover page must be included containing the article’s title, each author’s name,
professional title, highest degree obtained, institutional affiliation, preferred mailing address, email address, and telephone and fax numbers.
4. A manuscript that does not exceed five thousand words (5,000), equivalent to 20 pages, not including the bibliography, abstract, and appendixes. The title should appear on the first page only. Any reference to the author(s) must be removed from the entire paper, including citations in the body of the article, and the bibliography section. If any of the authors are cited, the name should be substituted with the word “Author”.
5. Submissions must adhere to the criteria and standards of the APA Manual (latest Edition).
Additional Manuscript Protocols: • All text must be in Times New Roman 12 pt; • All text must be fully justified except headings; • All text must be single spaced; • Paragraphs must be indented with a standard indent (i.e., do not use the spacebar to indent); • Do no insert additional lines between paragraphs; • Heading levels must follow APA 6th edition’s guidelines; • Do not use any section breaks, page numbers, or headers; • Tables must be created with Word’s insert table function (not tabs and spaces) and should be within the same Word file in their correct position. Do not create a section break and insert a table in landscape orientation. If the table cannot be formatted in portrait orientation, we will create a picture file of the table and insert it in the document. • Figures must be inserted within the same Word file in their correct position and have appropriate permissions and citations. They should be appropriate for black and white printing; • References should be formatted with a hanging indent and not with hard returns and tabs.


![Encyclopedia of Educational Leadership Administration€¦ · Encyclopedia of educational leadership and administration / Fenwick W. English, [editor]. p. cm. Includes bibliographical](https://static.documents.pub/doc/80x56/5f0623467e708231d4167ad5/encyclopedia-of-educational-leadership-administration-encyclopedia-of-educational.jpg)
