EDUCAUSE Center for Applied Research Safeguarding the Tower: IT Security in Higher Education 2006 EDUCAUSE Webcast December 15, 2006 John Voloudakis Copyright ECAR, 2006. This work is the intellectual property of the author. Permission is granted for this material to be shared for non-commercial, educational purposes, provided that this copyright statement appears on the reproduced materials and notice is given that the copying is by permission of the author. To disseminate otherwise or to republish requires written permission from the author.
Transcript
EDUCAUSE Center for Applied ResearchEDUCAUSE Center
for Applied Research
Safeguarding the Tower: IT Security in Higher
Education 2006
EDUCAUSE Webcast
December 15, 2006
John VoloudakisCopyright ECAR, 2006. This work is the intellectual property of the author. Permission is granted for this material to be shared for non-commercial, educational purposes, provided that this copyright statement appears on the reproduced materials and notice is given that the copying is by permission of the author. To disseminate otherwise or to republish
requires written permission from the author.
Study BackgroundStudy Background
Page 3
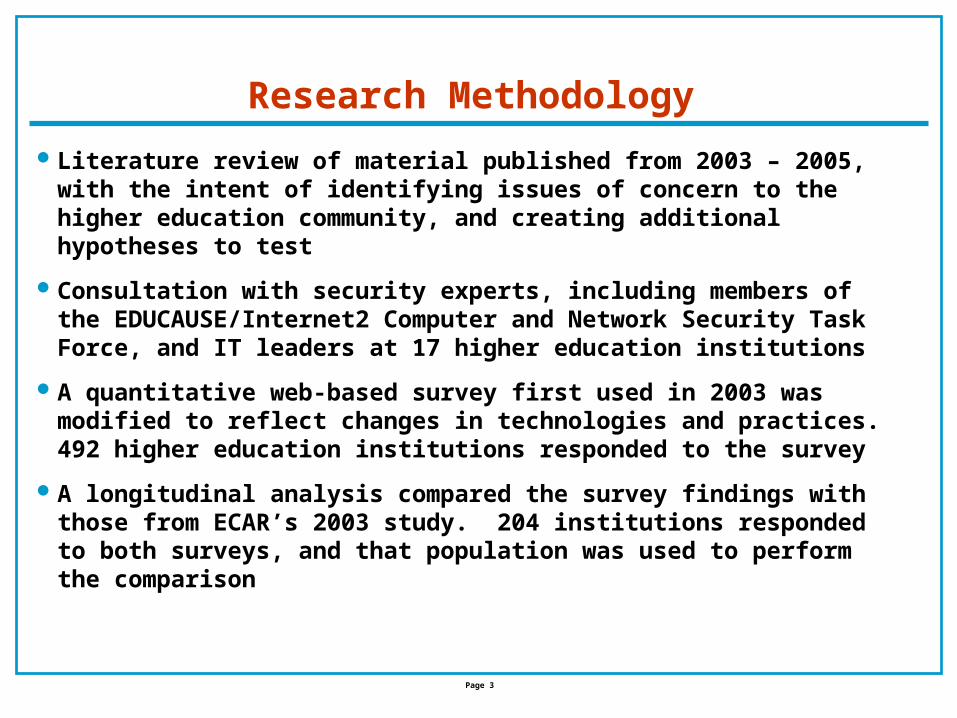
Research Methodology
Literature review of material published from 2003 – 2005, with the intent of identifying issues of concern to the higher education community, and creating additional hypotheses to test
Consultation with security experts, including members of the EDUCAUSE/Internet2 Computer and Network Security Task Force, and IT leaders at 17 higher education institutions
A quantitative web-based survey first used in 2003 was modified to reflect changes in technologies and practices. 492 higher education institutions responded to the survey
A longitudinal analysis compared the survey findings with those from ECAR’s 2003 study. 204 institutions responded to both surveys, and that population was used to perform the comparison
Page 4
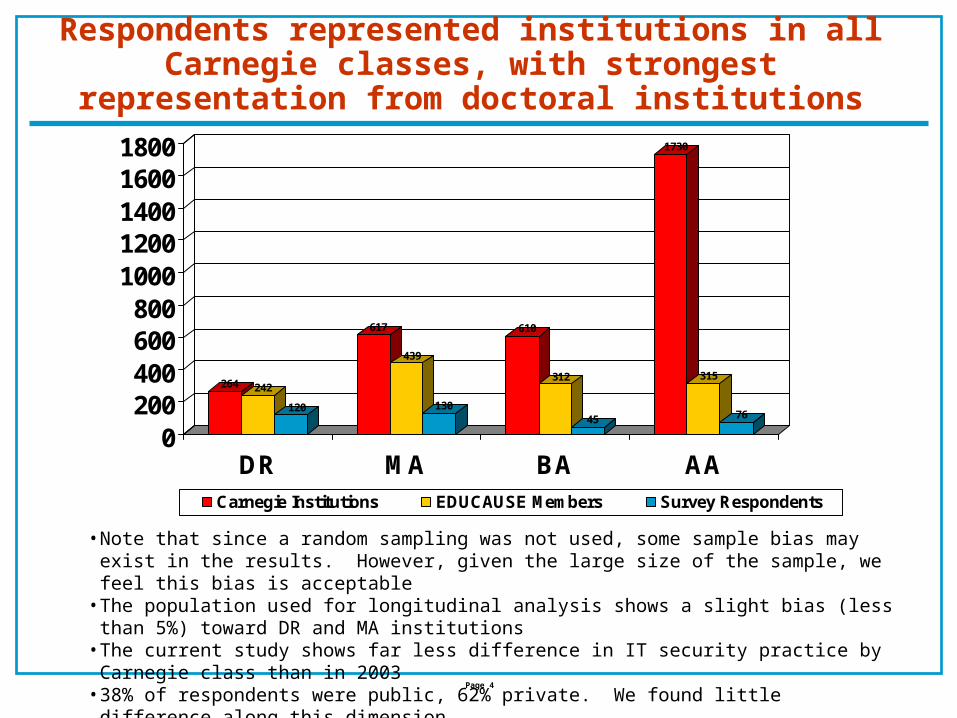
Respondents represented institutions in all Carnegie classes, with strongest representation from doctoral
institutions
• Note that since a random sampling was not used, some sample bias may exist in the results. However, given the large size of the sample, we feel this bias is acceptable
• The population used for longitudinal analysis shows a slight bias (less than 5%) toward DR and MA institutions
• The current study shows far less difference in IT security practice by Carnegie class than in 2003
• 38% of respondents were public, 62% private. We found little difference along this dimension
264 242
120
617
439
130
610
312
45
1730
315
76
0200400600800
10001200140016001800
DR MA BA AA
Carnegie Institutions EDUCAUSE Members Survey Respondents
Page 5
Respondents also represented a spectrum of institutional size, with smaller institutions more prevalent
• 44% of respondents had under 4,000 students, while fewer than 20% had over 15,000
• The mean student body for the current study was 8,375, compared to 7,169 in 2003
• Institutional size was less significant than in the 2003 study, but there are differences, especially in the areas of planning and awareness programs
Numbers represent student FTE
8001 - 1500016%
15,001 - 2500013%
25000+7% 4001 - 8000
20%
2001 - 400021%
Under 200023%
Page 6
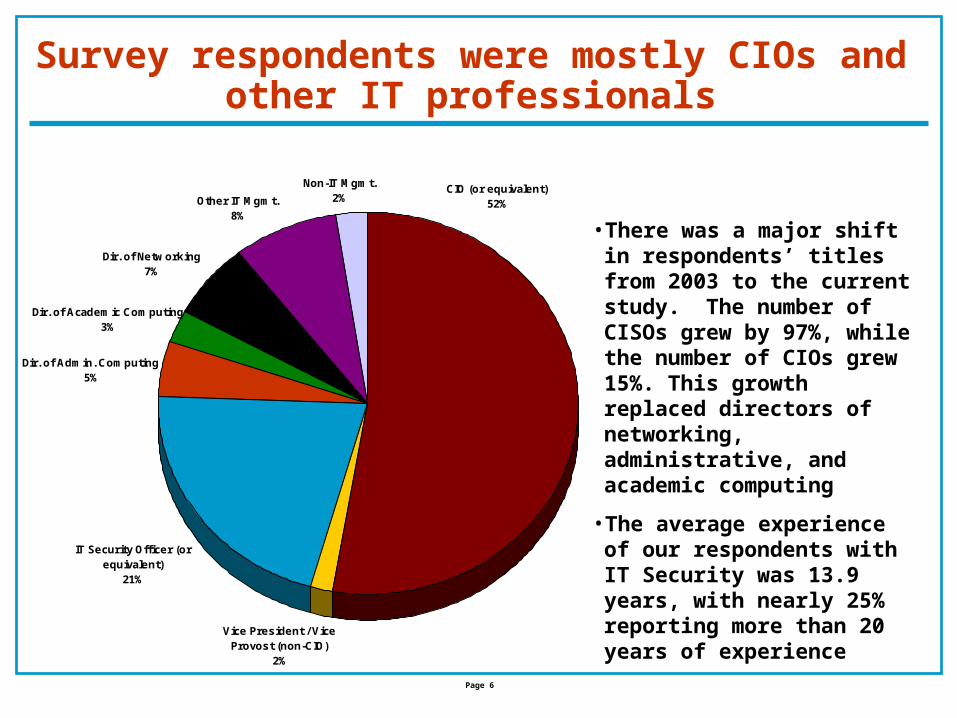
Survey respondents were mostly CIOs and other IT professionals
• There was a major shift in respondents’ titles from 2003 to the current study. The number of CISOs grew by 97%, while the number of CIOs grew 15%. This growth replaced directors of networking, administrative, and academic computing
• The average experience of our respondents with IT Security was 13.9 years, with nearly 25% reporting more than 20 years of experience
Vice President / Vice Provost (non-CIO)
2%
IT Security Officer (or equivalent)
21%
Dir. of Networking7%
Other IT Mgmt.8%
Non-IT Mgmt.2%
Dir. of Academic Computing3%
Dir. of Admin. Computing5%
CIO (or equivalent)52%
Summary of FindingsSummary of Findings
Page 8
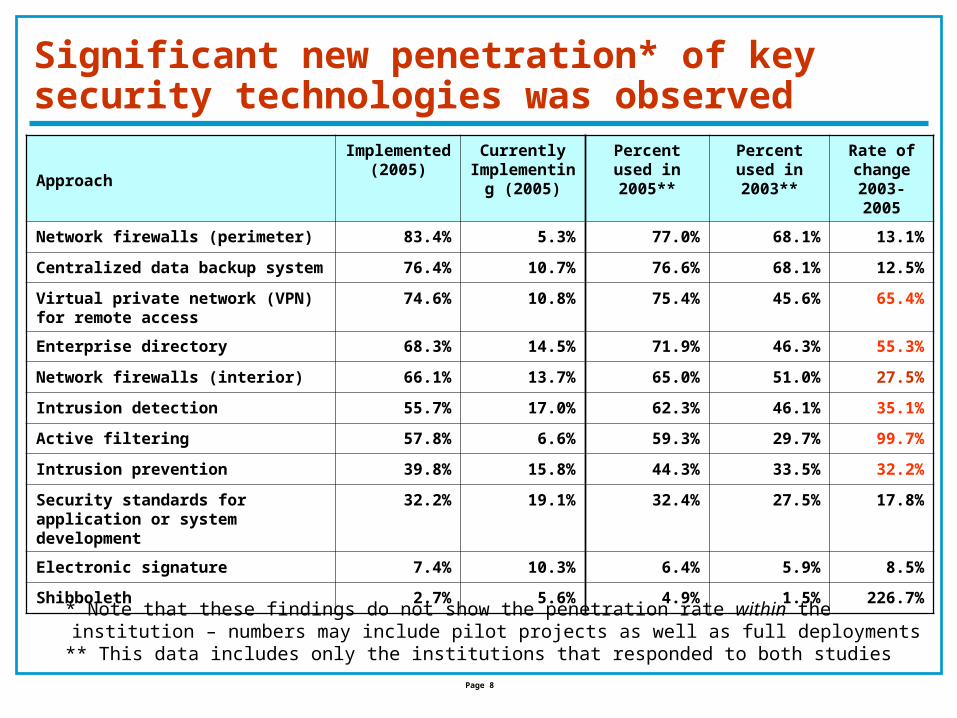
Significant new penetration* of key security technologies was observed
* Note that these findings do not show the penetration rate within the institution – numbers may include pilot projects as well as full deployments
** This data includes only the institutions that responded to both studies
Security standards for application or system development
32.2% 19.1% 32.4% 27.5% 17.8%
Electronic signature 7.4% 10.3% 6.4% 5.9% 8.5%
Shibboleth 2.7% 5.6% 4.9% 1.5% 226.7%
Page 9
Observations on penetration of security approaches
There was significantly less difference in technologies in use by Carnegie class than in 2003
Use of perimeter firewalls greatly increased at doctoral institutions (21%), though they still deploy less than other types of institutions. These institutions made heaviest use of VPN as well (83%).
The average responding institution utilized 7.5 of the 16 approaches listed. 5% used 13 or more approaches, and 10% reported 3 or fewer
Page 10
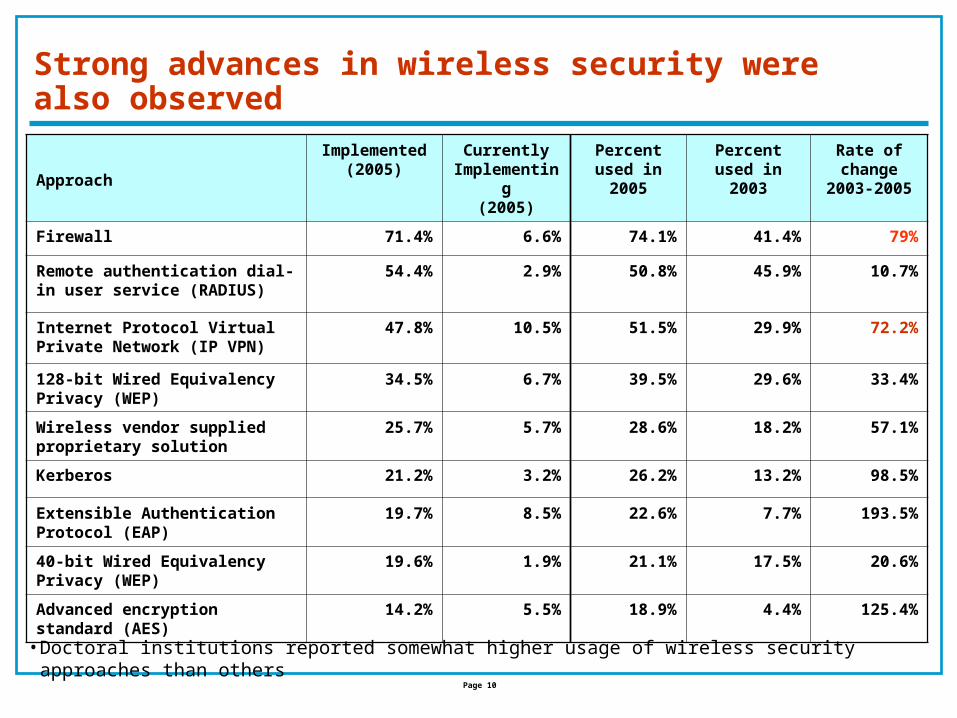
Strong advances in wireless security were also observed
Approach
Implemented (2005)
Currently Implementing
(2005)
Percent used in 2005
Percent used in 2003
Rate of change
2003-2005
Firewall 71.4% 6.6% 74.1% 41.4% 79%
Remote authentication dial-in user service (RADIUS)
54.4% 2.9% 50.8% 45.9% 10.7%
Internet Protocol Virtual Private Network (IP VPN)
47.8% 10.5% 51.5% 29.9% 72.2%
128-bit Wired Equivalency Privacy (WEP)
34.5% 6.7% 39.5% 29.6% 33.4%
Wireless vendor supplied proprietary solution
25.7% 5.7% 28.6% 18.2% 57.1%
Kerberos 21.2% 3.2% 26.2% 13.2% 98.5%
Extensible Authentication Protocol (EAP)
19.7% 8.5% 22.6% 7.7% 193.5%
40-bit Wired Equivalency Privacy (WEP)
19.6% 1.9% 21.1% 17.5% 20.6%
Advanced encryption standard (AES)
14.2% 5.5% 18.9% 4.4% 125.4%
• Doctoral institutions reported somewhat higher usage of wireless security approaches than others
Page 11
Little change in authentication approaches was observed from 2003 to 2005
• Higher education’s usage of non-password authentication lags other industries• 90% of respondents use 3 or fewer approaches. This is a change from 2003, where 65% used 3 or less• Doctoral institutions were the primary users of non-password authentication methods
Approach
Implemented (2005)
Currently Implementing
(2005)
Conventional password/PIN 94.4% 0%
Strong password 59.9% 12.8%
Kerberos 26.9% 2.9%
Secure ID-style one-time password 8.9% 2.8%
Other multi-factor authentication methods 8.1% 4.0%
PKI certificate (software) without PIN 6.8% 1.3%
PKI certificate (software) with PIN 5.1% 1.5%
Biometric identification 2.8% 2.3%
PKI hardware token with PIN 1.7% 1.7%
PKI hardware token without PIN 0.9% 0.9%
Page 12
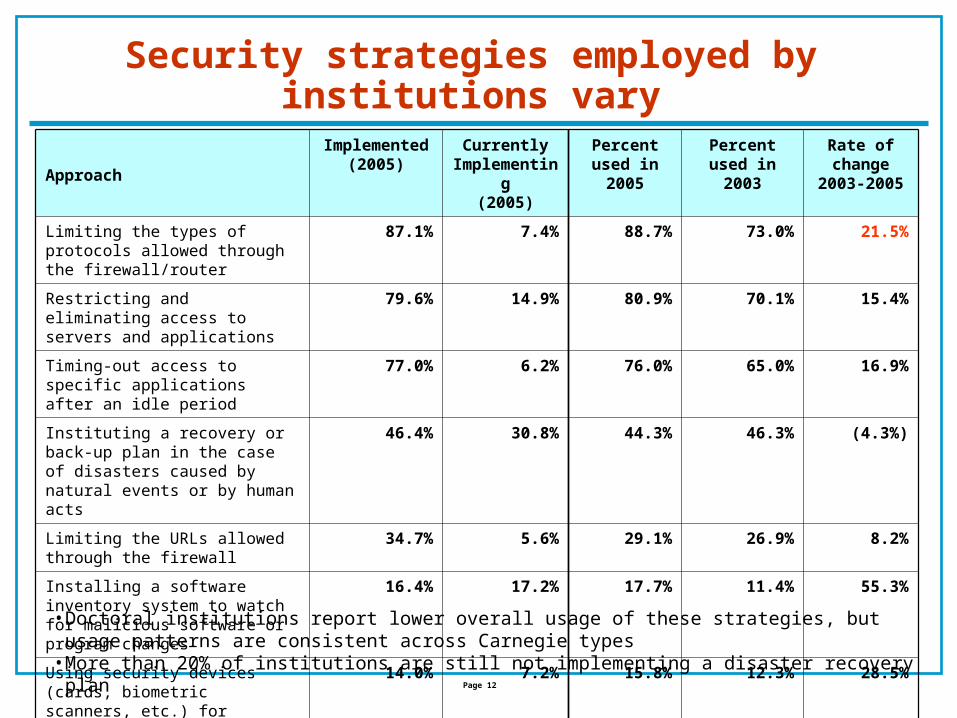
Security strategies employed by institutions vary
Approach
Implemented (2005)
Currently Implementing
(2005)
Percent used in
2005
Percent used in 2003
Rate of change
2003-2005
Limiting the types of protocols allowed through the firewall/router
87.1% 7.4% 88.7% 73.0% 21.5%
Restricting and eliminating access to servers and applications
79.6% 14.9% 80.9% 70.1% 15.4%
Timing-out access to specific applications after an idle period
77.0% 6.2% 76.0% 65.0% 16.9%
Instituting a recovery or back-up plan in the case of disasters caused by natural events or by human acts
46.4% 30.8% 44.3% 46.3% (4.3%)
Limiting the URLs allowed through the firewall
34.7% 5.6% 29.1% 26.9% 8.2%
Installing a software inventory system to watch for malicious software or program changes
16.4% 17.2% 17.7% 11.4% 55.3%
Using security devices (cards, biometric scanners, etc.) for authentication
14.0% 7.2% 15.8% 12.3% 28.5%
• Doctoral institutions report lower overall usage of these strategies, but usage patterns are consistent across Carnegie types
• More than 20% of institutions are still not implementing a disaster recovery plan
Page 13
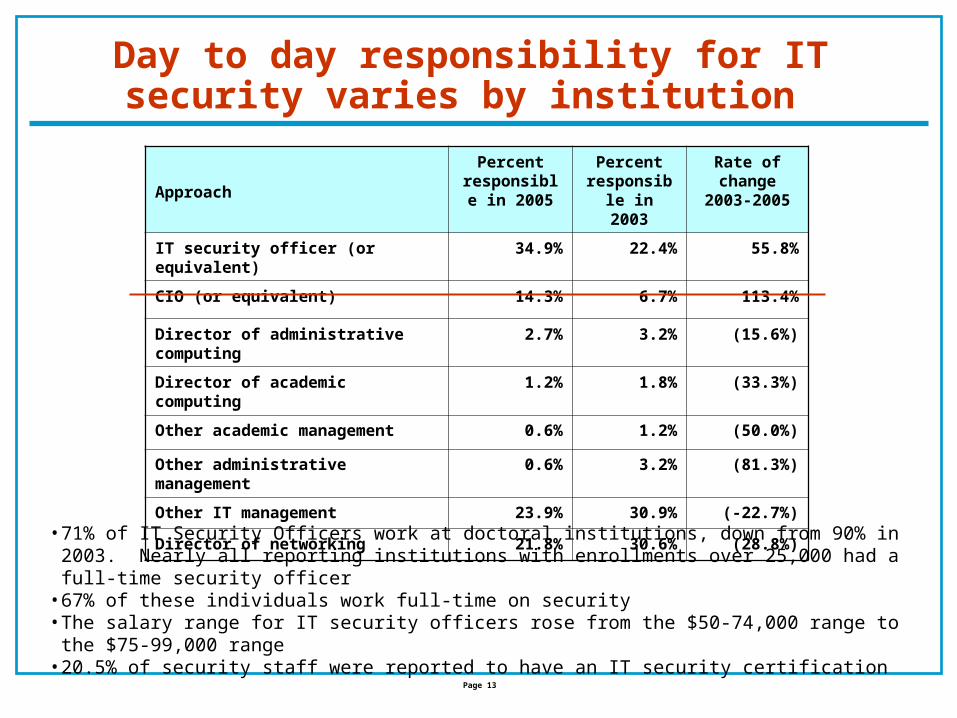
Day to day responsibility for IT security varies by institution
• 71% of IT Security Officers work at doctoral institutions, down from 90% in 2003. Nearly all reporting institutions with enrollments over 25,000 had a full-time security officer
• 67% of these individuals work full-time on security• The salary range for IT security officers rose from the $50-74,000 range to the $75-99,000 range• 20.5% of security staff were reported to have an IT security certification
Approach
Percent responsible
in 2005
Percent responsible
in 2003
Rate of change 2003-
2005
IT security officer (or equivalent) 34.9% 22.4% 55.8%
CIO (or equivalent) 14.3% 6.7% 113.4%
Director of administrative computing 2.7% 3.2% (15.6%)
Director of academic computing 1.2% 1.8% (33.3%)
Other academic management 0.6% 1.2% (50.0%)
Other administrative management 0.6% 3.2% (81.3%)
Other IT management 23.9% 30.9% (-22.7%)
Director of networking 21.8% 30.6% (28.8%)
Page 14
There has been a major change in the structure of IT security organizations
• 68% of respondents had at least one full time security staff member, up from 50% in 2003• Doctoral institutions were more likely to have larger IT security teams, averaging 2.8 FTE.
68% of other institutions reported having a staff of one or less.• 32% of institutions expect to add staff in the next two years, mostly doctoral institutions
and institutions with enrollments over 25,000.
Staffing structure 2005 Percent
2003 Percent
Percent Change
Rate of change
One central IT security unit/function 61.8% 38.7% 23.1% 59.7%
Spread across multiple central IT units/functions
32.7% 58.2% -25.5% -43.8%
Other 5.5% 3.1% 2.4% 77.4%
Page 15
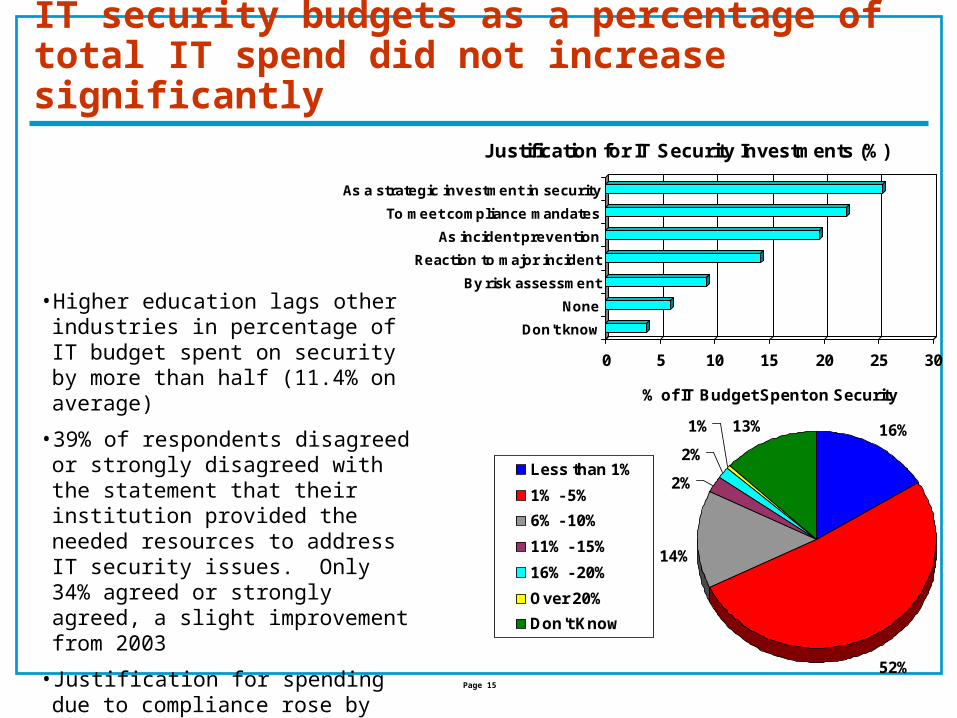
IT security budgets as a percentage of total IT spend did not increase significantly
• Higher education lags other industries in percentage of IT budget spent on security by more than half (11.4% on average)
• 39% of respondents disagreed or strongly disagreed with the statement that their institution provided the needed resources to address IT security issues. Only 34% agreed or strongly agreed, a slight improvement from 2003
• Justification for spending due to compliance rose by 124% from 2003 - 2005
% of IT Budget Spent on Security
16%
52%
14%
2%
2%
1% 13%
Less than 1%
1% - 5%
6% - 10%
11% - 15%
16% - 20%
Over 20%
Don't Know
0 5 10 15 20 25 30
As a strategic investment in security
To meet compliance mandates
As incident prevention
Reaction to major incident
By risk assessment
None
Don't know
Justification for IT Security Investments (%)
Page 16
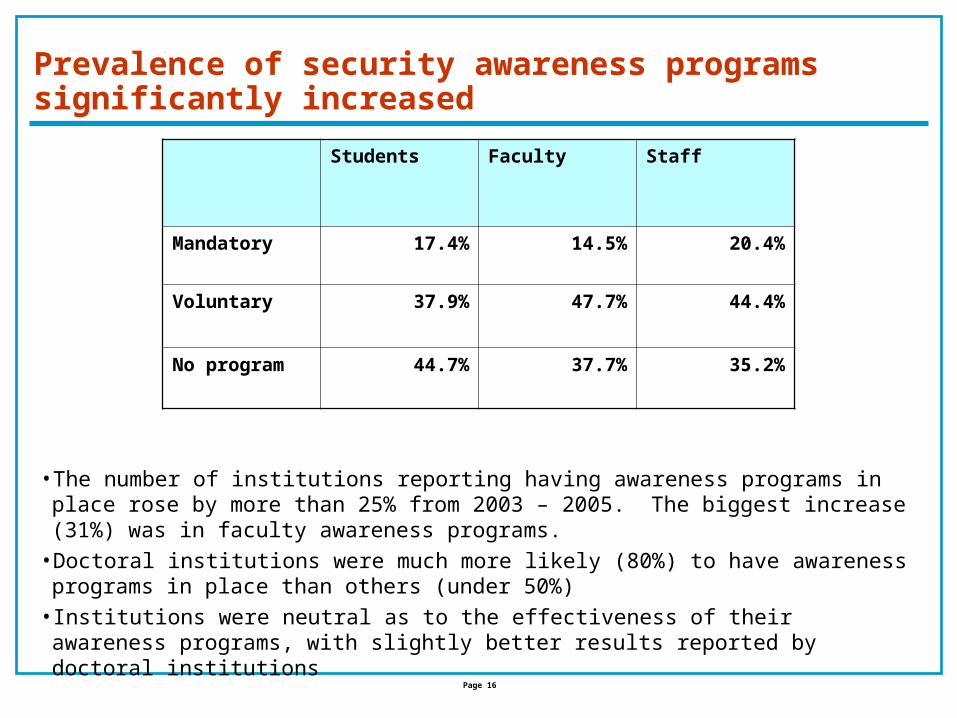
Prevalence of security awareness programs significantly increased
Students Faculty Staff
Mandatory 17.4% 14.5% 20.4%
Voluntary 37.9% 47.7% 44.4%
No program 44.7% 37.7% 35.2%
• The number of institutions reporting having awareness programs in place rose by more than 25% from 2003 – 2005. The biggest increase (31%) was in faculty awareness programs.
• Doctoral institutions were much more likely (80%) to have awareness programs in place than others (under 50%)
• Institutions were neutral as to the effectiveness of their awareness programs, with slightly better results reported by doctoral institutions
Page 17
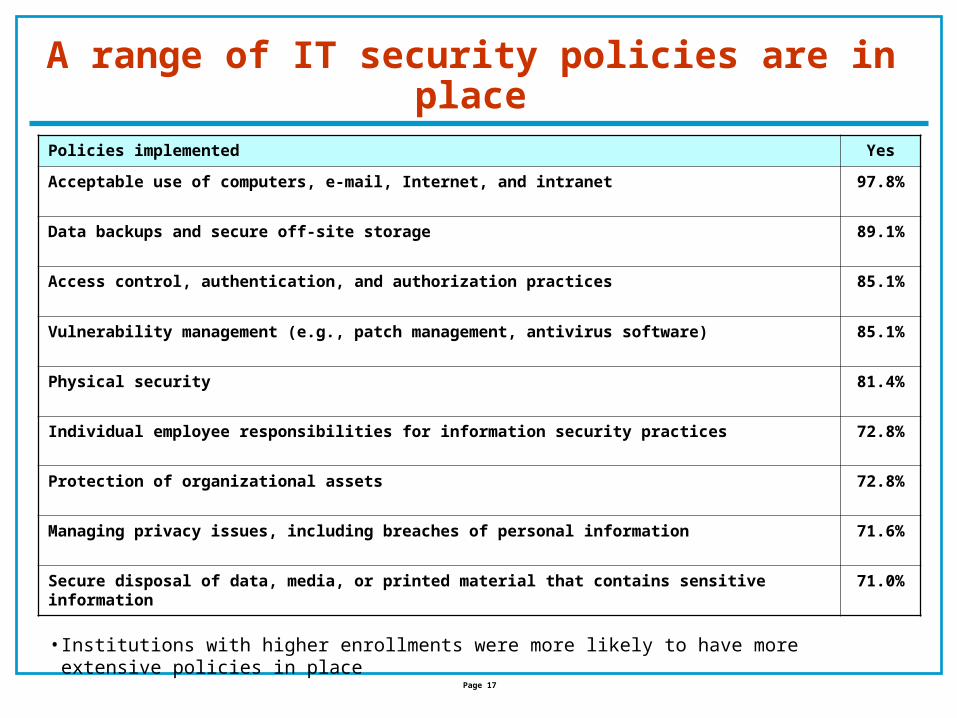
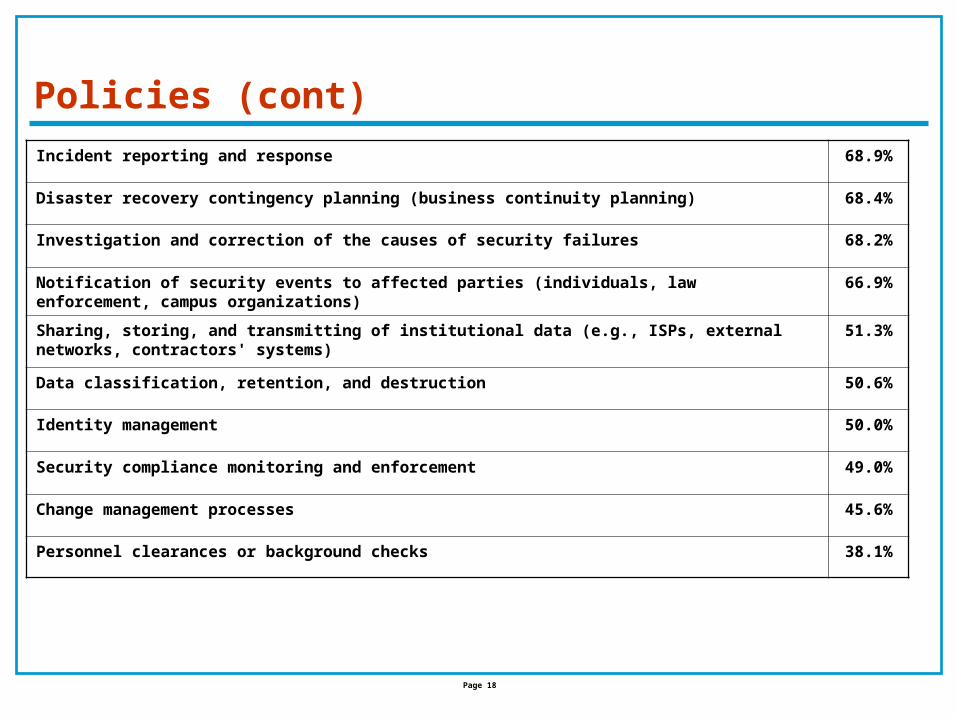
A range of IT security policies are in place
• Institutions with higher enrollments were more likely to have more extensive policies in place
Policies implemented Yes
Acceptable use of computers, e-mail, Internet, and intranet 97.8%
Data backups and secure off-site storage 89.1%
Access control, authentication, and authorization practices 85.1%
Investigation and correction of the causes of security failures 68.2%
Notification of security events to affected parties (individuals, law enforcement, campus organizations) 66.9%
Sharing, storing, and transmitting of institutional data (e.g., ISPs, external networks, contractors' systems)
51.3%
Data classification, retention, and destruction 50.6%
Identity management 50.0%
Security compliance monitoring and enforcement 49.0%
Change management processes 45.6%
Personnel clearances or background checks 38.1%
Page 19
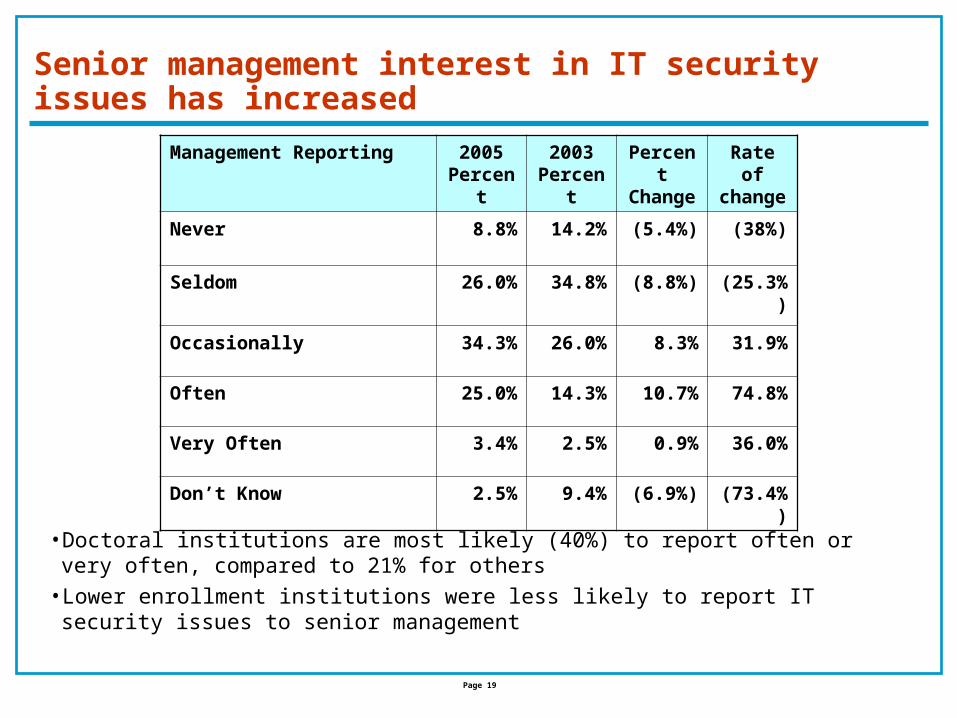
Senior management interest in IT security issues has increased
Management Reporting 2005 Percent
2003 Percent
Percent Change
Rate of change
Never 8.8% 14.2% (5.4%) (38%)
Seldom 26.0% 34.8% (8.8%) (25.3%)
Occasionally 34.3% 26.0% 8.3% 31.9%
Often 25.0% 14.3% 10.7% 74.8%
Very Often 3.4% 2.5% 0.9% 36.0%
Don’t Know 2.5% 9.4% (6.9%) (73.4%)
• Doctoral institutions are most likely (40%) to report often or very often, compared to 21% for others
• Lower enrollment institutions were less likely to report IT security issues to senior management
Page 20
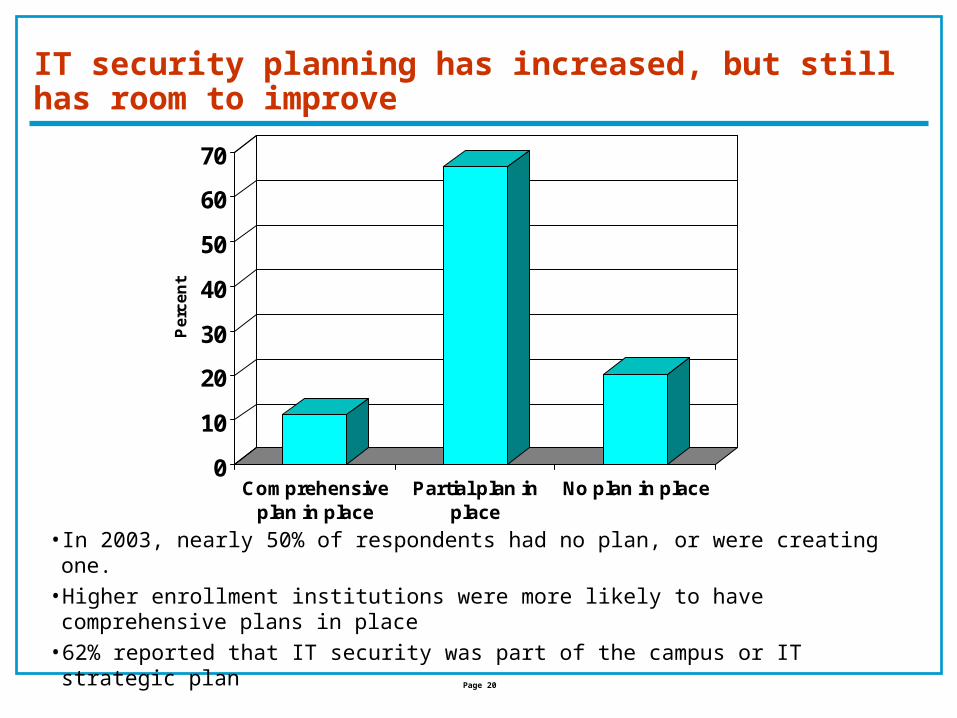
IT security planning has increased, but still has room to improve
0
10
20
30
40
50
60
70P
erc
en
t
Comprehensiveplan in place
Partial plan inplace
No plan in place
• In 2003, nearly 50% of respondents had no plan, or were creating one. • Higher enrollment institutions were more likely to have comprehensive plans in place• 62% reported that IT security was part of the campus or IT strategic plan
Page 21
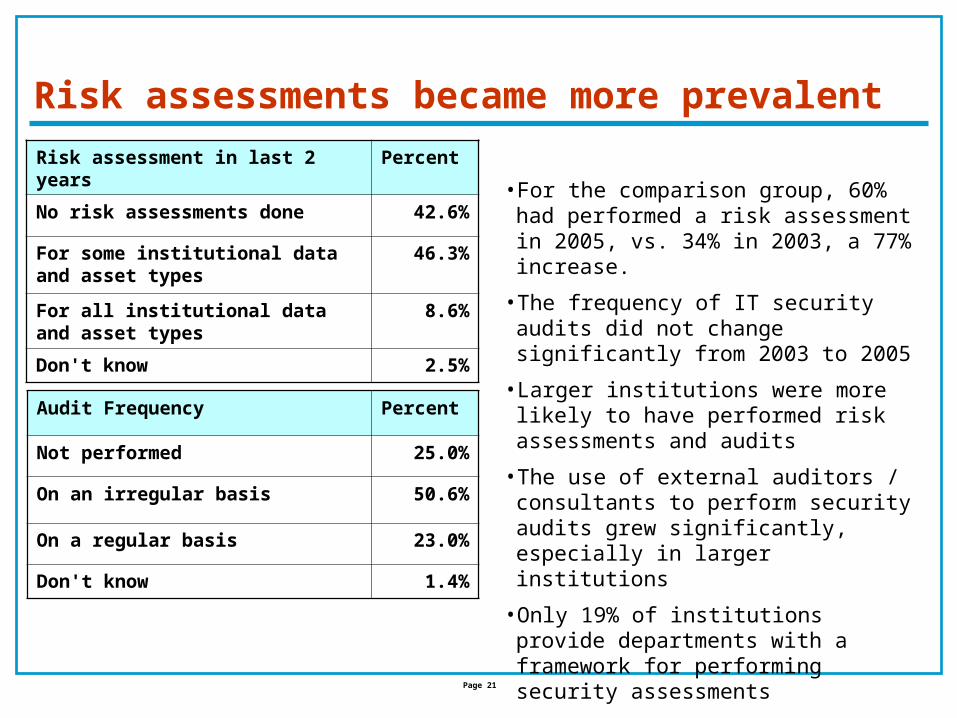
Risk assessments became more prevalent
Risk assessment in last 2 years Percent
No risk assessments done 42.6%
For some institutional data and asset types
46.3%
For all institutional data and asset types
8.6%
Don't know 2.5%
Audit Frequency Percent
Not performed 25.0%
On an irregular basis 50.6%
On a regular basis 23.0%
Don't know 1.4%
• For the comparison group, 60% had performed a risk assessment in 2005, vs. 34% in 2003, a 77% increase.
• The frequency of IT security audits did not change significantly from 2003 to 2005
• Larger institutions were more likely to have performed risk assessments and audits
• The use of external auditors / consultants to perform security audits grew significantly, especially in larger institutions
• Only 19% of institutions provide departments with a framework for performing security assessments
Page 22
Institutions identified viruses and theft of personal information as high-risk areas
Perceived Risk Percent
Computer virus, worm, or Trojan horse 72.6%
Theft of personal financial information (SSN, credit/debit/ATM card, account or PIN numbers, etc.) 64.8%
Unlicensed use or copying (piracy) of digital products (software, music, motion pictures, etc.) 25.2%
Breaches resulting from information obtained from stolen laptops 11.0%
Electronic vandalism or sabotage 10.4%
Misuse of computers by employees (Internet, e-mail, etc.) 10.0%
Theft of intellectual property (copyrights, patents, trade secrets, trademarks) 7.7%
Fraud 2.6%
Embezzlement 0.6%
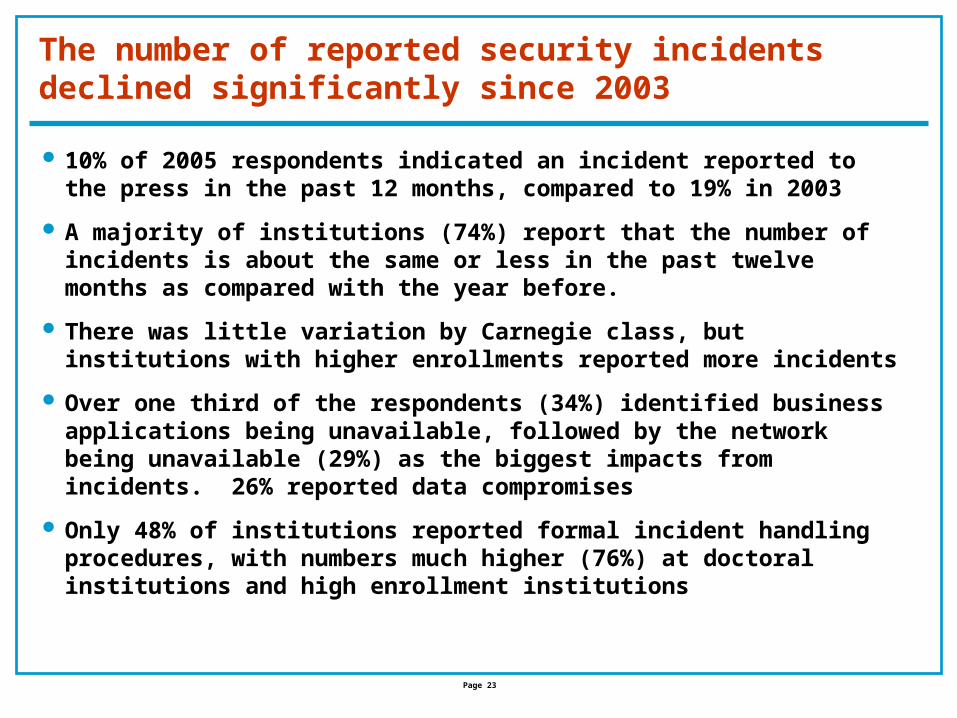
Page 23
The number of reported security incidents declined significantly since 2003
10% of 2005 respondents indicated an incident reported to the press in the past 12 months, compared to 19% in 2003
A majority of institutions (74%) report that the number of incidents is about the same or less in the past twelve months as compared with the year before.
There was little variation by Carnegie class, but institutions with higher enrollments reported more incidents
Over one third of the respondents (34%) identified business applications being unavailable, followed by the network being unavailable (29%) as the biggest impacts from incidents. 26% reported data compromises
Only 48% of institutions reported formal incident handling procedures, with numbers much higher (76%) at doctoral institutions and high enrollment institutions
Page 24
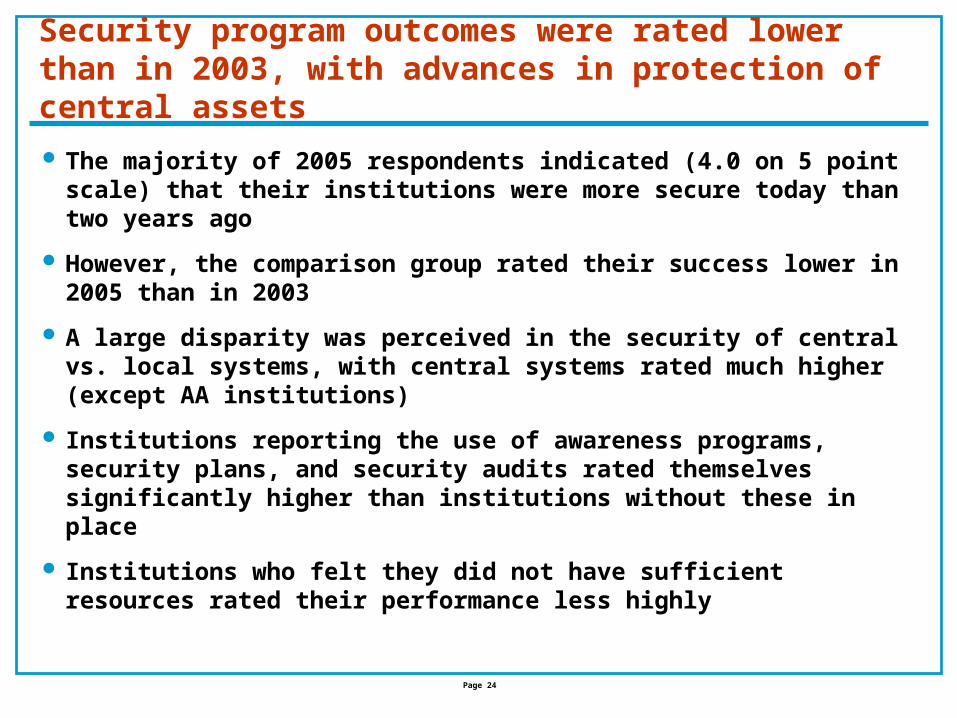
Security program outcomes were rated lower than in 2003, with advances in protection of central assets
The majority of 2005 respondents indicated (4.0 on 5 point scale) that their institutions were more secure today than two years ago
However, the comparison group rated their success lower in 2005 than in 2003
A large disparity was perceived in the security of central vs. local systems, with central systems rated much higher (except AA institutions)
Institutions reporting the use of awareness programs, security plans, and security audits rated themselves significantly higher than institutions without these in place
Institutions who felt they did not have sufficient resources rated their performance less highly
Page 25
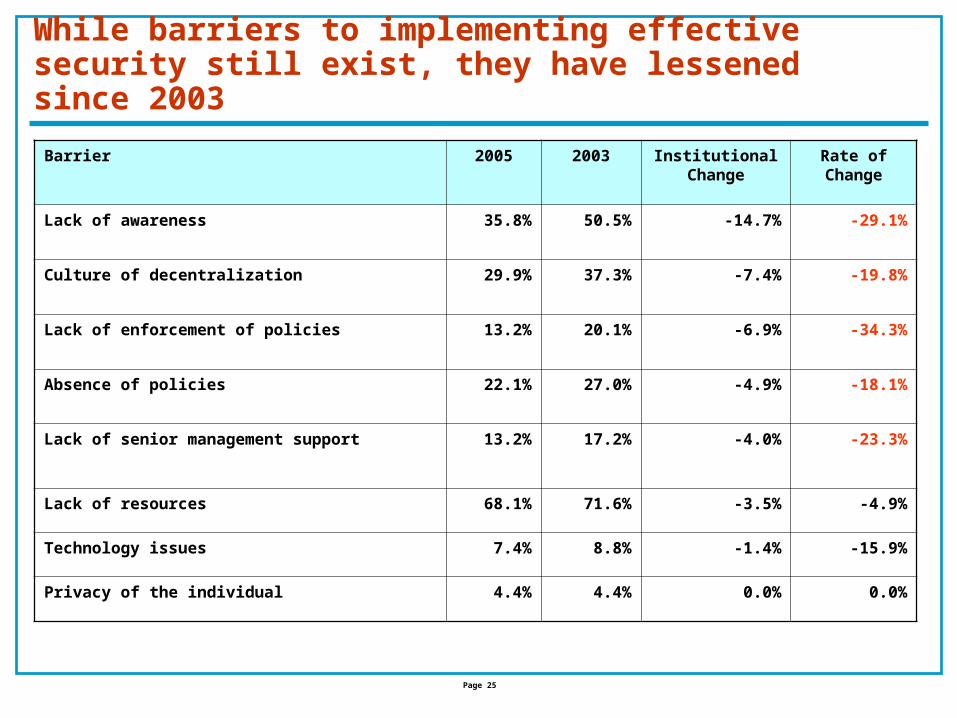
While barriers to implementing effective security still exist, they have lessened since 2003
Barrier 2005 2003 Institutional Change
Rate of Change
Lack of awareness 35.8% 50.5% -14.7% -29.1%
Culture of decentralization 29.9% 37.3% -7.4% -19.8%
Lack of enforcement of policies 13.2% 20.1% -6.9% -34.3%
Absence of policies 22.1% 27.0% -4.9% -18.1%
Lack of senior management support 13.2% 17.2% -4.0% -23.3%