1056 at each attempt. The feeling of distension consequently increases, until tinally the stomach becomes so distended with .ga.s that an attempt to eructate is at last successful, and the feeling of fulness, which is at the end largely due to the increased intragastric pressure brought about by the rapid distension of the stomach with swallowed air, is relieved. ’ Kelling 1° has demonstrated that a reflex mechanism - exists, by means of which the tone of the muscles of the abdominal wall adapts itself to the varying volume of the contents of the alimentary canal. In the absence of such a mechanism the consumption of a meal of moderate size would result in a considerable rise of intra-abdominal pressure :and consequently of intragastric pressure. Thus I have found that the volume of the abdominal contents varies between 4000 and 5000 c c. ; after a moderately large meal with a bulk of 1000 to 1500 c.c. the volume of the ablominal contents must therefore increase by 25 to 35 per <nt. When a meal is rapidly eaten it might be expected that there would be insufficient time for the proper relaxation of the abdominal wall as well as of the stomach, and that con- sequently the general intra-abdominal tension as well as the intragastric tension would be increased. The sense of fulness which results might therefore be a result of tension on the .abdominal muscles as well as on the wall of the stomach, and Becher has even suggested that the tension on the various structures of the abdominal wall is the sole cause of the sensation. Such a view, however, cannot be accepted, as the sensation may be felt by an individual whose abdo- minal wall is so lax that it can never be stretched when he ds lying down, however full the stomach may be. Moreover, the exactly analogous sensation produced in the oesophagus and rectum can only be visceral in origin, and our experi- ments, which I shall describe later, on the sensation of fulness in the intestine prove that this also is independent of the abdominal muscles. A further proof in the case of the stomach is afforded by the result of inflating the stomach by the carbon dioxide given off when solutions of 6 grammes each of sodium bicarbonate and tartaric acid are separately drank. Under atmospheric pressure at the body tem- perature 1700 c.c. of carbon dioxide are produced. :Kelling 20 showed that in normal individuals the tone of the stomach is such that sudden inflation with from 600 to 1600 c.c. of gas produces a sufficient rise in intragastric pressure to act as an adequate sensory stimulus. The -pressure produced by the sudden formation of 1700 c. c. is thas so great that normal individuals invariably complain of an unpleasant and often of a painful sense of fulness, which -is relieved by eructation. On the other hand, in patients with atonic dilatation the tone of the muscular coat of the stomach i’9 so feeble that the potential capacity of the stomach, even when empty, is more than 1700 c.c., and con- sequently this volume of gas produces no rise in intragastric pressure. If the sense of fulness depended upon stretching of the abdominal wall, it would follow inflation of an atonic stomach, as the volume occupied by the gas is greater than - dn the normal stomach owing to the smaller intragastric pressure, but no sensation of fulness is felt, and the patient may actually feel more comfortable after the inflation. lb may therefore be concladed that the sensation of fulness in the stomach is due to tension on its muscular coat and depends very little, and only in extreme cases, on stretching of the abdominal wall. 19 G. Kelling : Zeitschrift für Biologie, Band xliv., p. 161, 1903. 20 G. Kelling: Deutsche medizinische Wochenschrift, Band xviii., p. 1191, 1892. GLOUCESTERSHIRE ROYAL INFIRMARY AND EYE INSTITUTION.—The annual meeting of the subscribers to the Gloucestershire Royal Infirmary was held recently under the presidency of Colonel Curtis Hayward. The medical report stated that 1520 in-patients had been admitted, a decrease of 70 compared with 1909, but with that exception it was the largest that had been admitted in one year. The daily .average number of in-patients was 86 8, and the average cost per bed L75 7s. 10d. The out-patients numbered 9302, the largest on record. The financial statement showed that - workpeople’s contributions amounted to over E1000, and that an adverse balance of £ 48 remained against the charity. Edward Jenner Lecture ON THE DECLINING BIRTH-RATE. Delivered at St. George’s Hospital Medical School (University of London) BY F. E. FREMANTLE, M.B., CH.M. OXON., F.R.C.P. LOND., F.R.C.S. ENG., D.P.H., COUNTY MEDICAL OFFICER FOR HERTS. GENTLEMEN,-This question of the birth-rate is taken for our first lecture as furnishing a good and concrete example of a problem in vital statistics. The numerical maintenance of any geographic population must depend on the balance of four factors-namely, birth plus immigration, less death and emigration. In most statis- tical countries the population is actually increasing at the present time. This "actual increase" is ascertained by census-in our country every ten years. " Natural increase," on the other hand, is the increase by births against deaths, without taking count of the figures of migration. It is reckoned from the births and deaths registered by the Registrar-General through the sub-registrars; the birth-rate per thousand of population per annum less the death-rate per thousand per annum,gives the rate of natural increase. MIGRATION. The difference, then, between actual and natural increase is due to migration, and is in some countries very great. Chart 1 is founded upon a chart in the celebrated report in 1904 of the Royal Commission that inquired into the declining birth-rate of New South Wales. The mean natural increase of the several parts and the whole of Australasia and of other countries during the decade 1890 to 1899 is shown as so many black lines of length, corresponding to the differ- ence between their respective crude birth- and death-rates accordingly. The shaded lines show the meanactualincrease for the same years. Where the shaded lines are longer than the black, immigrants have outnumbered emigrants. Where the shaded lines are shorter, emigration has prevailed. Emigrants are, presumably, above the average in fitness and procreative power. A land, therefore, like Ireland or Italy, which loses emigrants suffers further in retaining a dispro. portionate number of the unfit and aged. (The shaded line opposite Ireland should run from right to left, about as long as the black line runs from left to right. It has had to be omitted in making the chart.) In Canada, on the other hand, and in the United States the population contains a dispropor- tionate number of immigrants whose fertility veils the lesser fertility of the native-born. Unfortunately, North American statistics are incomplete and, as a rule, untrustworthy. But in Boston the corrected legitimate birth-rate for native- born in 1900 was 18-20, for foreign-born 31-06; in Rhode Island, for native-born in 190117-01, for foreign-born 30’96. Even the natural increase, therefore, of any geographic population, touched by migration, is no exact measure of its fertility. Migration has a selective or qualitative as well as a numerical effect on the birth-rate. NATURAL INCREASE. The following are the rates for England and Wales in every other period of five years during the last 60 years:- Quinauennia from 1851. 1861. 1871. 1881. 1891. 1901. 1910. ’ Birth-rate...... 33-9 ... 35-2 ... 35’5 ... 33-5 ... 30’5 ... 28’1 ... 24-8 Death-rate ... 22-6 ... 22-5 ... 21-9 ... 19-4 ... 18-7 ... 16-0 ... 13-4 It generally happens that a high death-rate accompanies a high birth-rate, and a low death-rate a low birth-rate. But to this there are striking exceptions, showing that the relation between these two ratios is not one of cause and effect. The statement holds good for most countries in Chart 1 ; although in the Australasian colonies, with a birth-rate fairly high, the death-rate last decade rules low in comparison with European countries, there is a rough conformity between the birth- and death-rates amongst the different colonies themselves. France, however, is an exception, with a
Transcript
1056
at each attempt. The feeling of distension consequentlyincreases, until tinally the stomach becomes so distended with.ga.s that an attempt to eructate is at last successful, and thefeeling of fulness, which is at the end largely due tothe increased intragastric pressure brought about by therapid distension of the stomach with swallowed air, isrelieved. ’
Kelling 1° has demonstrated that a reflex mechanism- exists, by means of which the tone of the muscles of theabdominal wall adapts itself to the varying volume of thecontents of the alimentary canal. In the absence of such amechanism the consumption of a meal of moderate sizewould result in a considerable rise of intra-abdominal pressure:and consequently of intragastric pressure. Thus I have foundthat the volume of the abdominal contents varies between4000 and 5000 c c. ; after a moderately large mealwith a bulk of 1000 to 1500 c.c. the volume of theablominal contents must therefore increase by 25 to 35 per<nt.When a meal is rapidly eaten it might be expected that
there would be insufficient time for the proper relaxation ofthe abdominal wall as well as of the stomach, and that con-sequently the general intra-abdominal tension as well as theintragastric tension would be increased. The sense of fulnesswhich results might therefore be a result of tension on the.abdominal muscles as well as on the wall of the stomach,and Becher has even suggested that the tension on thevarious structures of the abdominal wall is the sole cause ofthe sensation. Such a view, however, cannot be accepted,as the sensation may be felt by an individual whose abdo-minal wall is so lax that it can never be stretched when heds lying down, however full the stomach may be. Moreover,the exactly analogous sensation produced in the oesophagusand rectum can only be visceral in origin, and our experi-ments, which I shall describe later, on the sensation offulness in the intestine prove that this also is independent ofthe abdominal muscles. A further proof in the case of thestomach is afforded by the result of inflating the stomach bythe carbon dioxide given off when solutions of 6 grammeseach of sodium bicarbonate and tartaric acid are separatelydrank. Under atmospheric pressure at the body tem-
perature 1700 c.c. of carbon dioxide are produced.:Kelling 20 showed that in normal individuals the tone ofthe stomach is such that sudden inflation with from 600 to1600 c.c. of gas produces a sufficient rise in intragastricpressure to act as an adequate sensory stimulus. The
-pressure produced by the sudden formation of 1700 c. c. isthas so great that normal individuals invariably complain ofan unpleasant and often of a painful sense of fulness, which-is relieved by eructation. On the other hand, in patientswith atonic dilatation the tone of the muscular coat of thestomach i’9 so feeble that the potential capacity of thestomach, even when empty, is more than 1700 c.c., and con-sequently this volume of gas produces no rise in intragastricpressure. If the sense of fulness depended upon stretchingof the abdominal wall, it would follow inflation of an atonicstomach, as the volume occupied by the gas is greater than- dn the normal stomach owing to the smaller intragastricpressure, but no sensation of fulness is felt, and the patientmay actually feel more comfortable after the inflation.lb may therefore be concladed that the sensation of fulnessin the stomach is due to tension on its muscular coat and
depends very little, and only in extreme cases, on stretchingof the abdominal wall.
19 G. Kelling : Zeitschrift für Biologie, Band xliv., p. 161, 1903.20 G. Kelling: Deutsche medizinische Wochenschrift, Band xviii.,
p. 1191, 1892.
GLOUCESTERSHIRE ROYAL INFIRMARY AND EYEINSTITUTION.—The annual meeting of the subscribers to theGloucestershire Royal Infirmary was held recently under thepresidency of Colonel Curtis Hayward. The medical reportstated that 1520 in-patients had been admitted, a decrease of70 compared with 1909, but with that exception it was thelargest that had been admitted in one year. The daily.average number of in-patients was 86 8, and the averagecost per bed L75 7s. 10d. The out-patients numbered 9302,the largest on record. The financial statement showed that
- workpeople’s contributions amounted to over E1000, andthat an adverse balance of £ 48 remained against thecharity.
Edward Jenner LectureON
THE DECLINING BIRTH-RATE.Delivered at St. George’s Hospital Medical School
(University of London)BY F. E. FREMANTLE, M.B., CH.M. OXON.,
F.R.C.P. LOND., F.R.C.S. ENG., D.P.H.,COUNTY MEDICAL OFFICER FOR HERTS.
GENTLEMEN,-This question of the birth-rate is taken forour first lecture as furnishing a good and concrete exampleof a problem in vital statistics.The numerical maintenance of any geographic population
must depend on the balance of four factors-namely, birthplus immigration, less death and emigration. In most statis-tical countries the population is actually increasing at thepresent time. This "actual increase" is ascertained bycensus-in our country every ten years. " Natural increase,"on the other hand, is the increase by births against deaths,without taking count of the figures of migration. It isreckoned from the births and deaths registered by theRegistrar-General through the sub-registrars; the birth-rateper thousand of population per annum less the death-rate perthousand per annum,gives the rate of natural increase.
MIGRATION.
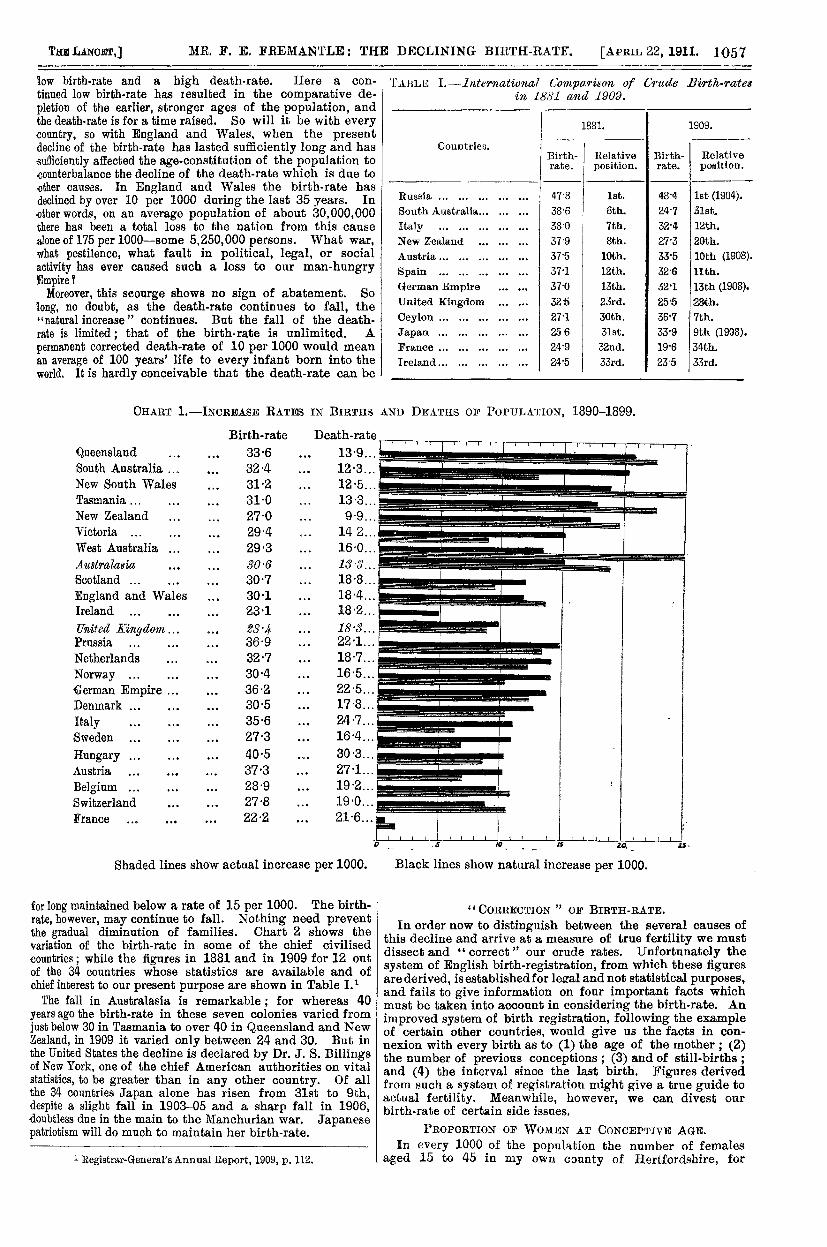
The difference, then, between actual and natural increaseis due to migration, and is in some countries very great.Chart 1 is founded upon a chart in the celebrated report in1904 of the Royal Commission that inquired into the decliningbirth-rate of New South Wales. The mean natural increaseof the several parts and the whole of Australasia and ofother countries during the decade 1890 to 1899 is shown asso many black lines of length, corresponding to the differ-ence between their respective crude birth- and death-ratesaccordingly. The shaded lines show the meanactualincreasefor the same years. Where the shaded lines are longer thanthe black, immigrants have outnumbered emigrants. Wherethe shaded lines are shorter, emigration has prevailed.Emigrants are, presumably, above the average in fitness andprocreative power. A land, therefore, like Ireland or Italy,which loses emigrants suffers further in retaining a dispro.portionate number of the unfit and aged. (The shaded lineopposite Ireland should run from right to left, about as longas the black line runs from left to right. It has had to beomitted in making the chart.) In Canada, on the other hand,and in the United States the population contains a dispropor-tionate number of immigrants whose fertility veils the lesserfertility of the native-born. Unfortunately, North Americanstatistics are incomplete and, as a rule, untrustworthy.But in Boston the corrected legitimate birth-rate for native-born in 1900 was 18-20, for foreign-born 31-06; in RhodeIsland, for native-born in 190117-01, for foreign-born 30’96.Even the natural increase, therefore, of any geographicpopulation, touched by migration, is no exact measure of itsfertility. Migration has a selective or qualitative as well asa numerical effect on the birth-rate.
NATURAL INCREASE.The following are the rates for England and Wales in
every other period of five years during the last 60 years:-Quinauennia from
It generally happens that a high death-rate accompanies ahigh birth-rate, and a low death-rate a low birth-rate. Butto this there are striking exceptions, showing that the relationbetween these two ratios is not one of cause and effect. Thestatement holds good for most countries in Chart 1 ; althoughin the Australasian colonies, with a birth-rate fairly high,the death-rate last decade rules low in comparison withEuropean countries, there is a rough conformity betweenthe birth- and death-rates amongst the different coloniesthemselves. France, however, is an exception, with a
1057
low birth-rate and a high death-rate. Here a con-
tinued low birth-rate has resulted in the comparative de-pletion of the earlier, stronger ages of the population, andthe death-rate is for a time raised. So will it be with everycountry, so with England and Wales, when the presentdecline of the birth-rate has lasted sufficiently long and hassufficiently affected the age-constitution of the population tocounterbalance the decline of the death-rate which is due to-other causes. In England and Wales the birth-rate hasdeclined by over 10 per 1000 during the last 35 years. Inother words, on an average population of about 30,000,000there has been a total loss to the nation from this cause.alone of 175 per 1000-some 5,250,000 persons. What war,what pestilence, what fault in political, legal, or social
activity has ever caused such a loss to our man-hungryEmpire?
Moreover, this seourge shows no sign of abatement. Solong, no doubt, as the death-rate continues to fall, the"natural increase" continues. But the fall of the death-rate is limited ; that of the birth-rate is unlimited. A
permanent corrected death-rate of 10 per 1000 would meanan average of 100 years’ life to every infant born into theworld. It is hardly conceivable that the death-rate can be
Shaded lines show actual increase per 1000.
for long maintained below a rate of 15 per 1000. The birth-rate, however, may continue to fall. Nothing need preventthe gradual diminution of families. Chart 2 shows thevariation of the birth-rate in some of the chief civilisedcountries; while the figures in 1881 and in 1909 for 12 outof the 34 countries whose statistics are available and ofchief interest to our present purpose are shown in Table 1.1The fall in Australasia is remarkable ; for whereas 40
years ago the birth-rate in these seven colonies varied fromjust below 30 in Tasmania to over 40 in Queensland and NewZealand, in 1909 it varied only between 24 and 30. But inthe United States the decline is declared by Dr. J. S. Billingsof New York, one of the chief American authorities on vitalstatistics, to be greater than in any other country. Of allthe 34 countries Japan alone has risen from 31st to 9th,despite a slight fall in 1903-05 and a sharp fall in 1906,doubtless due in the main to the Manchurian war. Japanesepatriotism will do much to maintain her birth-rate.
1 Registrar-General’s Annual Report, 1909, p. 112.
TABLE I.-Interriational G’onapa,riao7e of Crude Birth-ratesin 1881 and 1909.
I I
Black lines show natural increase per 1000.
" CORRECTION " OF BIRTH-RATE.In order now to distinguish between the several causes of
this decline and arrive at a measure of true fertility we mustdissect and " correct " our crude rates. Unfortunately thesystem of English birth-registration, from which these figuresare derived, is established for legal and not statistical purposes,and fails to give information on four important facts whichmust be taken into account in considering the birth-rate. Animproved system of birth registration, following the exampleof certain other countries, would give us the facts in con-nexion with every birth as to (1) the age of the mother ; (2)the number of previous conceptions ; (3) and of still-births ;and (4) the interval since the last birth. Figures derivedfrom such a system of registration might give a true guide toactual fertility. Meanwhile, however, we can divest ourbirth-rate of certain side issues.
PROPORTION OF WOMEN AT CONCEPTIVE AGE.In every 1000 of the population the number of females
aged 15 to 45 in my own county of Hertfordshire, for
1058
instance, rose from 210 in 1881 to 234 in 1901, in London inthe same years from 262 to 274. Instead, therefore, of
stating the birth-rate in terms of total population, it is
obviously more precise to state it in terms of women aged15 to 45.
ILLEGITIMACY.
There is a greater decline in illegitimate than in legitimatebirths. Thus in England and Wales in 40 years the crudebirth-rates have sank as follows :- I
This decline of illegitimate births may be due to improve-ment in morals or to increased knowledge of and oppor-tnnities for practising methods of preventing conception orprocuring abortion after illicit intercourse. Inclusion of
illegitimate births obviously introduces a confusing factor inspecial degree ; they are best excluded from a statement offertility.
AGE AT MARRIAGE.
The fertility at different ages is shown in the number ofbirths per annum per 1000 wives at each period of life.These figures are obtainable only where a more completesystem of registration obtains than in England and Wales.In certain towns and countries the relative fertility at eachage, taking that at the age 20 to 25 in each column as 100, Iworks out as follows, the last column giving the average forthe seven sets of figures from which these are selected :-
TABLE n.-Relative Þèrtility Rates per 1000 Wives at Dif-ferent Ages in Certmn Areas where the Figures are available,the -Fertility-rate for the Age Period 20-25 being taken a,100. (Aotual -Fertility-rate per 1000 Wives aged 20-25 inBravkets. )
This table may be read as follows. In Norway 1000 wivesaged 20-25 have on an average 579 infants in a year; puttingthis figure at 100 the corresponding fertility for Norway atages 15-20 is 71 ; at 25-30, 74; and so on. Fluctuations,therefore, in the mean age at marriage must materiallyinfluence the birth-rate.Now let us see the facts as to the increased age at marriage
in England and Wales during the 14 years 1896 to 1909.TABLE IIL-Meczn Age at Marriage—Endland and Wales.
Some slight allowance must therefore be made for the in-creased age at marriage before we can arrive at a truefertility-rate.
NUMBER OF MARRIAGES.Still more obviously must the birth-rate be affected by the
number of marriages that take place.TABLE IV.—Mean Annual Marriage-rate—Persons under-
going marriage per 1000 marriageable persons (unmarriedand widowed persons over 15).
This shows a decrease in 38 years of 12-7, or 22 per cent.The decline in the marriage-rate is reflected in the proportionof unmarried, married, and widowed over 15 years of age ofeither sex in the populations of successive years, as found bythe census.
TABLE V. *-Married State, Proportion to 1000 of eaoh Sexabove 15.
* In this and following tables, unless otherwise stated, rates refer toEngland and Wales per 1000 per annum.
This factor, obviously voluntary, must also be discountedwith a view to obtaining a true measure of fertility.
FERTILITY RATE.Now three of these four factors in the decline of the crude
rate-proportion of women at conceptive age to total popula-tion, illegitimacy, marriage-rate-can be eliminated by givingthe number of legitimate births per 1000 married women ofconceptive age, a method introduced 50 years ago bythe Registrar-General, Dr. Farr, the father of public health,as he has been called. With them we may contrast the pro-portion of illegitimate births to 1000 unmarried women ofconceptive age.
TABLE VL-Legitimate Births per 1000 Married Women ofConceptive Age Contrasted with the Proportion ofIllegitimate Births to 1000 Unmarried Women of such Age.
The amount of error avoided by these corrections is
suggested by comparing the decrease in 30 years, as shown,by these different calculations.
TABLE VII.—Contrasting Fertility-rates and Birth-rates.
This table shows, curiously enough, that the decline infertility is even greater than that in the crude rate.
Although fewer marriages and the decline of illegitimatebirths have led to a decline of the crude birth-rate, this effecthas been more than discounted by the larger proportion ofwomen of conceptive age in the population. Their fertilityhas declined even more than we suspected. The discrepancybetween these methods of stating the birth-rate may beshown by comparing the figures obtained in each case for
1059
CHART 2.-ANNUAL CRUDE BIRTH RATES PER 1000 PERSONS LIVING, 1881-1908.
(Ilerlistrccr- General’s Annual Report, 1909, p. 111.) )
Quinquennial period Years
1060
Kensington with those obtained for Whitechapel in any oneyear : -
TABLE VIII.-Three Methods of Showing Birth-rate 1891.
Obviously it makes a fundamental difference whetherwe speak of the rate in Kensington as 66 per cent. of that inWhitechapel, or 55 or only 36. 66 is the result by Farr’smethod and gives the actual mean fertility of marriedwomen. But even Farr’s method does not correct the errordue to a different age-constitution, to women now marrying ata higher and usually less fertile age. To do this Newsholme,now medical officer to the Local Government Board, andStevenson, now Superintendent of Statistics in the Office ofthe Registrar-General, devised the following method bywhich standard birth-rates are devised, as by the usualmethod of calculating standard death-rates-rates comparableon a common basis as regards the age and number of wives inthe population of each district or county. Our English censushas not hitherto given us the age of the mother at each con-finement ; it has only given us the ages of married women.The Swedish census, however, has given us the age of mothersat confinement.
Taking, therefore, the figures obtained by the completesystem of registration of births at each maternal age inSweden as the fixed standard, we find the rate of births tothe number of wives at each quinquennium of age in Sweden,say in 1891, and apply these rates to the number of wivesat each quinquennium, say in England and Wales, in anycensus year. We thus obtain the number of births thatwould have occurred in any year in a population constituted like that, for instance, of England and Wales as regards ageand number of wives, but under the 1891 Swedish conditionsof relative fertility. This number, when compared with thenumber of the population, is called the standard legitimatebirth-rate for the area in question. This rate in 1901 forEngland and Wales was 34.9 per 1000 of population ;that for Hertfordshire was 29-7. In other words, if theconditions as to fertility in each case had been those ofSweden in 1891, the factor relating to age and number ofwives in England and Wales in 1901 as compared withHertfordshire would have been as 34’9 to 29-7. Now
- 1.1754. 1.1754, then, is the factor by which, if the
crude legitimate birth-rate of Hertfordshire for any year bemultiplied, a "corrected" rate is obtained, strictly com-parable in respect of the age and number of wives with thecrude birth-rate of England and Wales. Thus it is a " cor-rected " rate of 27-6, rather than the crude rate of 23-4,by which the fertility of Hertfordshire in 1901 may be com-pared with that for England and Wales of 27-3. In this wayfactors for correction of the birth-rate may be obtained forany district, group of districts, or country, and such factors,multiplied by the crude birth-rates, will give the correspond-ing corrected legitimate birth-rates. The need of this cor-rection is shown by Table IX. Many deductions that mightbe made from the commoner method of stating the birth-rate are at once negatived by the corrected rates. The cruderates, for instance, for Hertfordshire both in 1881 and 1901are far lower than any other crude rates on this table, butthe corrected rates are the highest.Where possible, then, we should deal only with corrected
rates-they alone are a true measure of fertility ; and suchcorrected rates should be made out in every district afterevery census. In their absence deductions from rates calcu-lated in any other way must be made and expressed withreserve. May we therefore ask the Registrar-General to
supply every district with the factor for correction ? Mean-while, the best measure to use for common statistical
2 Journal of Hygiene, vol. v., April, 1905.
TABLE IX—Contrasting Crude with Corrected Birth-rates.
purposes is the legitimate fertility rate or number of birt’-s to 1000 wives of conceptive age.
CAUSES OF REDUCED FERTILITY.The general tendency of all these rates is a marked decline.
Let us consider to what causes their decline in various com-munities during the past 20 years may be due.
Urbanisation is not a factor. The corrected rate forselected urban counties-27-is now barely lower than thatfor rural counties-28 ; and in the 22 years, 1881 to 1903,while the rate for London has declined by 16 and for Englandand Wales by 17 per cent., that for four typical ruralcounties of Beds, Berks, Cornwall, and Rutland showed adecline of 23, 21, 29, and 28 per cent.
Occupation as such has no clear relation to the birth-rate.Agricultural counties had the highest fertility in 1881, butin 1903 the difference had almost disappeared.
Woollen industries certainly coincide with a low correctedbirth-rate of 23, 21, and 22 respectively in Huddersfield,Halifax, and Bradford ; but the percentage of women
industrially employed does not vary directly with the rate.Mining districts, on the other hand, generally show a highrate.
Religion, on the other hand, affords some indication of thecause of this decline. Countries mainly Roman Catholicdiffer little from those mainly Protestant; but the rate inBavaria has shown little diminution since 1881, that inIreland has actually increased, while those in the lessorthodox Roman Catholic countries of Italy and France havecontinued their steady decline. The best comparison is thatof Canada, where in 1902 the Protestants had a crude rate of24, the French Canadians-being strict Catholics-of 44,and other Roman Catholics of 22. Measures for the pre-vention of conception are strictly banned by the RomanCatholic Church, as indeed by our own but, at least inorthodox countries, with greater authority.
It may be said that the proportion of men servinq theircountry or pursuing trade abroad for part of their time hasincreased. But the proportion of males to females ascalculated by the census has only fallen from 95 to 93per cent. in the last 50 years.
,
As to social oonditions, no doubt the birth-rate hasdeclined, both in England and Germany, for instance, with
,
the increase of social comforts. In comparing the figuresfor six different strata of the population in London in 1903,
’ the total corrected birth-rate varied between 32 in the poorest.
class and 20 in the wealthiest class. In Ireland, on theother hand, where preventive measures are banned by the
. Roman Catholic Church, the corrected rate has increased,despite her share of the increase in social comfort. Bavariaand France are both prosperous, one with a high rate, theother with a low. Norway, like Ireland, is poor, but has ahigh rate of fertility.
r Heron has made out the mathematical correspondence- between various social conditions and the birth-rate. As a
result he finds the birth-rate lowest in districts where pro-fessional classes are most numerous or many domestic
- servants are employed, and highest where labour is of the1 lowest type, or poverty, drunkenness, overcrowding, phthisis,- and pauper lunacy are highest, and thrift and culture least.
Karl Pearson has shown that 25 per cent. of the married
1061
population produce 20 per cent. of the next generation. Thenation is being recruited from its least prosperous, least suc-cessful classes in increasing degree. From every point ofview save that of the anarchist, it is the least fit classes ofmen that survive. If there be such a thing as heredity, thenation is undergoing racial degeneration.Do the facts, then, indicate a deoline in natural fertility
under more civilised or luxurious conditions ? It would be
strange if that were so, for the birth-rate was at its zenith in1876. Luxurious living was common before then ; even thewealthier classes produced families of a dozen or more, andthose dozen now only produce a dozen infants between them.The Royal Commissioners who inquired into the subject inNew South Wales found no evidence of any increase of
physiological sterility in the women of the colony. Thematter cannot yet be taken as proved. Instances of barren-ness or of one-child families, where parents are perfectly
. healthy, are anxious for children and have used no checks,- occur not infrequently. I can vouch myself for two or threecases amongst medical men, on whose word one may rely.Quite recently a well-known peerage was saved from extinc-tion by the birth to healthy parents of a son and heir 11 yearsafter a second marriage, where there had been three daughtersby the first wife. But has this not ever been so ? What ishe extent of this lesser natural fertility in some "higherclass" families ? This we can only know through the familydoctors and possibly the obstetricians. I should be gratefulto them for any instances or information on the subject.
THE ARTIFICIAL DECLINE.
Any decline, however, that there may be in naturalfertility is insignificant as compared with the artificialdecline. The evidence is overwhelming, to quote againfrom the New South Wales report, as to " the marked effectof a force adverse to reproduction ; and this force was oneover which the individuals themselves have control." It is a
voluntary limitation of the birth-rate with which we have inthe main to deal. There are two methods : prevention ofconception and destruction of foetal life ; rubber goods andchemical pessaries on the one hand, abortifacients and
spurious nursing homes on the other. Both methods flourish ;both should be relentlessly pursued and checked by thelaw. It is significant that it was in 1876 that the Bristolpublisher of an American pamphlet describing these methodsunder the title Fruits of Philosophy " was sentenced, andCharles Bradlaugh and Mrs. Besant aggressively republishedand circulated the pamphlet; and that in 1877 began thedecline of the British birth-rate which has continued since.The chief factors, then, in the decline of the birth-rate are
mechanical and logical. The mechanical factors just namedare in reality only methods. It is the following logicalfactors that are the ultimate cause.
A. In the interests of health wives are advised to securea two or three years’ interval after the first and each sub-
-sequent birth ; and after any severe confinement to avoidsimilar danger in the future. It is often this well-meantinterval after the first birth that effects the mischief.
B. With the higher education of women comes an in-
creasing habit on their part, both before and after marriage,of undertaking charitable, political, or other occupations,paid or unpaid, which it seems difficult, even selfish, and atleast unreasonable for the young wife to abandon. Often inher desire to help her husband, intellectually and socially, itseems to her a duty to direct her seasons of child-bearingaccordingly ; and this well-meant interference has unforeseenresults.
C. The desire for economy strikes at all parents in everyclass, and especially in that class-the wealthiest-whichhas the largest experience of converting money into powerand opportunity of every kind. Such power and opportunitywill perhaps be lost through another child, whereas they mayotherwise be used for the education or physical welfare ofthe children already born or for their " start in life " on com-pletion of their education ; or they may be required for theserious aims and life’s work of the husband ; or for the- competition to keep or improve the position and authority ofthe family in the class of society to which it belongs or
wishes to belong. Lastly, and no doubt only in a minorityof cases, the primary object is that of leisure, comfort, andthe avoidance of pain.This desire, whether for economy or comfort, depends
osentially upon the unfettered Darwinian principles of the
struggle for survival of the fittest ; it is a recrudescence ofNature’s method for natural selection, rendered possible bythe free interchange of information, as a result of the steam-engine, electricity, cheap printing, and the penny post;fostered by the time-honoured liberal principles of laasser-faire without the correcting factors of sound scientific know-ledge and rigid moral discipline. Free play of naturalforces, as developed by the inventions of the nineteenthcentury, has led by inevitable if superficial logic to thedecline of the birth-rate. Sound scientific knowledge ofitself only directs into certain grooves and does not checkthis decline. Rigid moral discipline is hardly possible,except as part of a religious code ; while scientific thoughtand the liberal tendencies of the last century have unhappilydone much to destroy discipline and undermine religiousauthority. On the other hand, there must be noted thenewer growth of athletic discipline, the cult of a healthybody, which, combined with the sounder scientific know-ledge of the last few years and saner views of moral andreligious discipline, may lead the civilised world to recogniseand check the material dangers that accompany the abuse ofnature in her most vital and essential activities.What, then, are the effects on the potential parent of this
voluntary prevention of conception and this practice of abor-tion ? The direct physical effects are considerable. In his pre-sidential address to the British Gynaecological Society in 1904the late Professor J. W. Taylor spoke of both sudden dangerand of chronic disease, especially chronic nervous disorders,as common results. In commenting in his annual report onthe prosecution of a woman abortionist for manslaughter atthe Nottingham Assizes in 1906, Dr. P. Boobbyer, the medicalofficer of health, described the effect of diachylon or leadoleate plaster, much used for this purpose in the Midlands, asoften producing abortion, but always lead poisoning, leadingin a large proportion of cases to paralysis, blindness, insanity,and even death. It is noted again that ovarian and uterinetumours, innocent and malignant, coincide largely with thepractice of restriction. Above all, it is a commonplace ingynaecological practice that when a woman who has practisedrestriction wishes to have a child she is frequently unable toconceive, at least for some months or even years.The direct and moral effects are even more serious. The
practice of prevention is a check on nature’s check to sexualintercourse; it tends unconsciously to sexual excess andhabituates the being to general self-indulgence. Parentalqualities are not stimulated and the children lose the
discipline and delights of a full nursery. Wives, being thusset more free of home-ties, take up other occupations, and,indeed, in the struggling classes, are in increasing extentchosen according to their wage-earning capacity. Woman isthus pushed out from her natural sphere of home-life intothe outside world; and man takes the advantage of it.Hence the decay of home-life, the decline of chivalry, theclaim for female suffrage.The national effects are best shown in a quotation from
Polybius, for history repeats itself :-In our times all Greece has been afflicted with a failure of offspring.For when men gave themselves up to ease and comfort andindolence and would neither marry nor rear children born out ofmarriage, or at most only one or two, in order to leave these rich andto bring them up in luxury, the evil soon spread imperceptibly but withrapid growth....... And there is no need to consult the gods about themode of deliverance from this evil ; for any man would tell us that thefirst thing we have to do is to change our habits, or at all events toenact laws compelling parents to rear their children.
Whether by abortion, by infanticide, or by prevention, thelimitation was effected and its result was the decay of Greece.The same cause it was, according to Sir John Seeley, thatbrought about the decay of Rome :-The invincible power had been tamed by a slow disease. Rome had
stopped from a misgiving she could not explain to herself in the careerof victory. She had centralised herself successfully and created a
government of mighty efficiency and stability. But against thisdisease she was powerless; and the disease was sterility. Men werewanting ; the empire perished for want of men.
With all extinct races the birth-rate must either havefallen to zero, as we see now happening with the RedIndians and Australian aborigines; or, on its way thus toextinction, the race is swallowed up by intermarriage and itselements of permanence retained in fusion with the qualitiesof stronger breeds. So must it have been with Rome andGreece, Carthage and Egypt, Hittites, Cretans, Assyrians,and every mighty nation in the history of the world.The same fell disease affects the British Empire to-day ;
1062
and vast territories committed to her charge are lying fallowfor lack of those men whom, through the insidious tempta-tions of comfort or through unsound reasoning in the nameof science, she has deliberately failed to produce. Thosemen and women unborn may well have included in theirnumbers potential inventors and rulers, artists and writers,prophets and priests of unknown power. The whole worldis deprived of them. The empire is the weaker for theirloss. And, alas, this is no mere numerical decline. Wehave seen that it is a decline also in quality, due, asKarl Pearson has shown, to a reduced net fertility in themore cultured, more prosperous, healthy, and thrifty classesof the community. The British race in its struggle forsurvival is killing off the fittest stocks and leaving the lessfit in ever-increasing ratio to perpetuate their defects.How, then, can we fight this disease and save for the
individual, the empire, and the whole world the benefit ofNature’s full human harvest ? Such physiological causes asthere may be for this decline are beyond our ken, and for thepresent, if they exist at all, must be left alone ; howeverserious to those they affect, to the nation, I believe, they areof minor importance. The chief and obvious factors arethree in number: (1) the rational, due to knowledge ofmethods of prevention and ignorance of its results ; (2) theeconomic, due to the inventions of the Victorian era and theconsequent freedom of communications and competition inevery phase of life ; and (3) the moral, due to indulgence andlack of discipline.With the economic and moral factors medical men have
only indirect concern. But against the rational factor weare responsible for the remedy. Both personally and in
public we must insist, as no other profession can, on the
paramount value of nature’s own methods and checks, onthe serious danger resulting from celibacy, from prostitution,from interference with the normal married life, from
disregard of nature’s seasons ; and not least on behalf of allconcerned on the healthy influence, the gaiety, and theultimate economic value of a well-stocked nursery.
Bibliography.—The Diminishing Birth-rate and What is Involvedby It," by Professor J. W. Taylnr, Brit. Med. Jour., Feb. 20tb, 1904,p. 427. Dr. Newsholme and Dr. Stevenson on " The Decline of HumanFertility in the United Kingdom and other Countries as shown by theCorrected Birth-Rates," Journal of Royal Statistical Society. 1906,vol. Ixix. A similar paper, Journal of Hygiene, vol. v., April, 1905." On the Relation of Fertility in Man to Social Status." Drapers’Com-pany’s Research Memoir, D. Heron (Dulan and Co.). " Vital Statistics,"by Dr. Newsholme (Swan Sonnenschein and Co.), chapters viii.,ix. Annual Report of Registrar-General for England and Wales,1909, pp. xxvi.-xxxvi., and Table 57, p. 112. Report of Royal Commis-sion on the Decline of the Birth-rate and on the Mortality of Infants inNew South Wales, 1904. "The Family and the Nation," by W. C. D.Whetham, F.R.S., and Mrs. C. W. Whetham. Papers and Discussion atBritish Medical Association Conference, Brit. Med. Jour., August 20th.1910, pp. 451-457. Art. : " Population," British Encyclopædia, eleventhedition.
NOTES ON SOME VICTIMS OF A RECENTRAILWAY ACCIDENT, WITH SPECIAL
REFERENCE TO CEREBRALFAT-EMBOLISM.
BY RICKMAN J. GODLEE, M.S. LOND., F.R.C.S. ENG.,SURGEON TO UNIVERSITY COLLEGE HOSPITAL, LONDON;
AND
G. E. O. WILLIAMS, M.S. LOND., F.R.C.S. ENG.,SURGICAL REGISTRAR TO UNIVERSITY COLLEGE HOSPITAL.
MANY of the victims of the Willesden railway accident ofDec. 5th, 1910, were brought to University College Hospital.The casualty-room presented a most unusual appearance,being literally filled with more or less severe accident cases.Nineteen of these were admitted to the wards, and as someof them presented points of interest we desire to put themshortly on record.The accident, it will be remembered, was caused by one
train running at a moderate speed into the rear of anotherwhich was standing at the platform. Photographs show thatthe bogie of the last carriage was driven under that of thelast carriage but one for about half its length. The fourlast wheels of the latter were detached, but the carriageitself, with its front wheels attached, was lifted up andturned partly over on to the platform. The telescoping thusinvolved at least six compartments. The occupants of those
of the last carriage but one were spared the dreadfuh
impact of the advancing bogie of the rear carriage; but.it is difficult to imagine how many of those in thelast carriage can have escaped fracture of both their legs,unless they adopted the plan which is usually recom-
mended under such circumstances of putting their feet onthe opposite seat. It is probable, however, that the
injuries were not produced in this way, but that the floorsof both carriages were raised above the bogies, as otherwisethe injuries would have been more severe than they actuallywere. They were probably mostly caused by the seats andthe splintering of the floors. An attempt was made toascertain which compartments suffered most, but the patientswere not always able to state which carriage they were in.Two points are, however, clear. The greater number of thecases admitted were in the last carriage, and all those whohad broken legs were sitting with their backs to the engine,but one of them had risen from his seat before the crashcame and his one broken leg was between those of hisbrother who had both legs broken. This may, of course, beonly a coincidence. It will be noticed that most of thesefractures were about the middle of the bones. The other
patients of whom the inquiry was made, but it was notascertained in all cases, were sitting the other way. One ofthese had a thyroid dislocation of the right hip-joint. Hehad just settled himself in a comfortable position, " as usual,with his thighs apart." There could not be a more favour-able position for the production of this rare accident. Hethinks the seats were forced upwards ; he was in thesixth compartment of the last carriage and was pinnedamongst the debris with two or three passengers on the topof him. It was easily reduced by manipulation. Both thispatient and at least three others had effusion probably ofblood into one or both knee-joints. One of those in the lastcompartment of the last carriage but one, besides havingboth bones of the right leg broken, sustained bruises of theface and chest, and the somewhat uncommon fracture of theclavicle at the junction of the inner and middle thirds withslight displacement backwards of the outer fragment. Likethe other occupants of this carriage, he was thrown overtowards the platform side, and indeed was actually lying onthe platform on his back, the door being off, and his feetpinned under the seat. AnQther rare fracture was found inone of the fatal cases-namely, a separation of the cribriformplate of the ethmoid from the frontal. Of this we only knowof one other example, which illustrates its dangers; it wasin a boy who was thrown from a horse. He had a dischargefrom Ms nose, probably caught in a stable where there weresome infected horses, and he quickly died with meningitisand phlegmonous suppuration of the forehead. The othercases did not present any special features of importanceexcept those to be presently referred to ; but it is interestingto observe that there were amongst them none of severe
chest or abdominal injuries.The following is a complete list of the injuries, in which
are included those that were under the care of Mr. A. E.Barker and Mr. Bilton Pollard with their kind permission.
1.—Compound fracture of both bones of right leg about the middle.Fracture at junction of inner and middle thirds of left clavicle. Chestand nose bruised. The patient was sitting back to the engine in thelast compartment but one of the last carriage but one, and was thrownout of the carriage door on to the platform on his back, his feet being.still under the seat.2.-Fracture of both bones of both legs about the middle, the left badly
comminuted. Blood in left knee-joint and the joint loose. The patientwas sitting back to the engine in the third or fourth compartment, buthe forgets of which carriage. He put out his hands to try to savehimself. His legs were fixed by the wreckage.3.-Fracture of both bones of left leg about middle. Fracture of
right internal malleolus. Bruise of forehead. The patient was sittingback to the engine in the third compartment, but he forgets of which.carriage, the third from the door. He said that the seats met andnipped their legs. He was face downwards on the top of the otherpassengers. Only the right leg pained him.4.-Simple fracture of both bones of both legs about the middle, The
patient was sitting, back to the engine, in the right-hand corner of thefirst compartment of the last carriage. His legs were caught between,the seats.5.-Fracture of both bones of left leg about the middle. This patient
was the brother of the last patient and was sitting next to him. Hejumped up to get out. The right leg escaped, but the left was stillbetween his brother’s legs and was caught in a similar way.6.-Simple fracture of the left fibula below the middle. Effusion-
into the left knee. Left ear almost torn off. The patient was sitting,back to the engine, in the left-hand corner of the third compartmentfrom the guard’s van of the last carriage. After the smash he was-facing the engine, his head and body being fixed between a seat and theback part of the compartment. His legs were also fixed between theseats.
7 -Simple fractm of both bonrs of the left leg about the middle.