38
EEAG Report 2016 Europe: What next? John Driffill 22 February 2016 Figure 1. 1
| Date post: | 01-Apr-2018 |
| Category: |
Documents |
| Upload: | phungxuyen |
| View: | 219 times |
| Download: | 3 times |

EEAG Report 2016 Europe: What next?
John Driffill
22 February 2016
Figure 1. 1

Contents
• Macroeconomic conditions and outlook
• Intergenerational Fairness
• Tuning Secondary Education
• Denmark: Too good to be true?
• The Western Balkans: Coming together
Figure 1. 2

Macroeconomic Outlook
Figure 1. 3

-60
-50
-40
-30
-20
-10
0
10
20
30
40
50
60
70
80
90
100
110
120
130
08 09 10 11 12 13 14 15
Regional contributions to world trade
and industrial production
Index (2008Q1=100) %
a) Three month moving average level. b) Contribution to annualised monthly growth rate thereof.
Source: CPB Netherlands Bureau for Economic Policy Analysis, World Trade Monitor: October
2015.
World tradea)
(left-hand scale) Advanced economiesb)
(right-hand scale)
Emerging and developing
countriesb)
(right-hand scale)
-35
-30
-25
-20
-15
-10
-5
0
5
10
15
65
70
75
80
85
90
95
100
105
110
115
08 09 10 11 12 13 14 15
World industrial productionIndex (2008Q1=100) %
World industrial
productiona)
(left-hand scale)
Advanced economiesb)
(right-hand scale)
Emerging and developing countriesb)
(right-hand scale)
World trade
Figure 1. 4

-60
-40
-20
0
20
40
60
80
100
120
140
-3
-2
-1
0
1
2
3
4
5
6
7
06 07 08 09 10 11 12 13 14 15
% change over previous year's month % change over previous year's month
Source: International Monetary Fund, International Financial Statistics, last accessed on 1 January 2016.
Inflation in the world and oil price movements
Oil price changes
(dollar) (right-hand scale)
Inflation in the
world (left-hand scale)
Inflation in the euro area (left-hand scale)
Figure 1. 5

06 07 08 09 10 11 12 13 14 15 16
Ifo World Economic Survey
Economic situation
Source: Ifo World Economic Survey IV/2015.
North
America
Western
Europe
Asia Latin
America
bad
good
satisfactory
Figure 1. 6

-10
-8
-6
-4
-2
0
2
4
6
06 07 08 09 10 11 12 13 14 15
-10
-8
-6
-4
-2
0
2
4
6
Change in inventories
Foreign balance
Final domestic demand (excl. inventories)
a) Annualised quarterly growth.
Source: US Bureau of Economic Analysis, last accessed on 1 January 2016; EEAG calculations.
Contributions to GDP growtha) in the United States
%
Seasonally adjusted data
Real GDP
growth
%
Figure 1. 7

a) In constant prices, seasonally adjusted and work-day adjusted.
Source: US Bureau of Economic Analysis, last accessed on 1 January 2016.
Business cycle developments in the United States
-6
-4
-2
0
2
4
6
8
9750
10000
10250
10500
10750
11000
11250
11500
2008 2009 2010 2011 2012 2013 2014 2015
Consumption(left-hand scale)
Annualised quarterly
growth rates (right-hand scale)
Private consumptiona)
Billion US dollars %
-30
-20
-10
0
10
20
30
1800
2000
2200
2400
2600
2800
3000
2008 2009 2010 2011 2012 2013 2014 2015
Annualised quarterly
growth rates (GFCF)(right-hand scale)
Gross fixed capital formation (left-hand scale)
Gross capital formation (left-hand scale)
Gross fixed capital formationa)
Billion US dollars %
-600
-500
-400
-300
-200
-100
0
100
1500
1600
1700
1800
1900
2000
2100
2200
2008 2009 2010 2011 2012 2013 2014 2015
Trade balance (right-hand scale)
Imports(left-hand scale)
(left-hand scale)
Exports
Foreign tradea)
Billion US dollars Billion US dollars
Figure 1. 8

3
5
7
9
11
13
3
5
7
9
11
13
06 07 08 09 10 11 12 13 14 15
% of labour force
Japan
Euro area
United Kingdom
United States
Source: OECD, Main Economic Indicators, Ministry of Human Resources and Social Security, China, last
accessed on 11 January 2016.
Unemployment rates% of labour force
Figure 1. 9

-3
-2
-1
0
1
2
3
4
5
6
7
8
9
2008 2009 2010 2011 2012 2013 2014 2015
-3
-2
-1
0
1
2
3
4
5
6
7
8
9
United States China
Japan United Kingdom
Euro area
% change over previous year's month
Source: US Bureau of Labor Statistics, Statistics Bureau of Japan, National Bureau of Statistics of China, Eurostat;
last accessed on 1 January 2016.
Inflation rates
% change over previous year's month
-2
-1
0
1
2
3
4
2008 2009 2010 2011 2012 2013 2014 2015
-2
-1
0
1
2
3
4
United States
China
Japan
United Kingdom
Euro area
% change over previous year's month
Source: US Bureau of Labor Statistics, Statistics Bureau of Japan, National Bureau of Statistics of China, Eurostat;
last accessed on 1 January 2016.
Core inflation rates
% change over previous year's month
Figure 1. 10

-12
-9
-6
-3
0
3
6
06 07 08 09 10 11 12 13 14 15
-12
-9
-6
-3
0
3
6
Change in inventories
Foreign balance
Final domestic demand (excl. inventories)
Contributions to GDP growtha) in the European Union
%
Seasonally adjusted data
Real GDP growth
a) Annualised quarterly growth.
Source: Eurostat, last accessed on 1 Janaury 2016; EEAG calculations.
%
Figure 1. 11

Source: Eurostat, last accessed on 1 Janaury 2016.
Business cycle developments in the European Union
-4
-3
-2
-1
0
1
2
3
4
1810
1820
1830
1840
1850
1860
1870
1880
1890
08 09 10 11 12 13 14 15
Consumption(left-hand scale)
Annualised quarterly growth rates (right-hand scale)
Private consumptiona)
Billion euros %
-25
-20
-15
-10
-5
0
5
10
600
625
650
675
700
725
750
775
08 09 10 11 12 13 14 15
Annualised quarterly growth rates (GFCF) (right-hand scale)
Gross fixed capital formation (left-hand scale)
Gross capital formation(left-hand scale)
Gross fixed capital formationa)
Billion euros %
-50
0
50
100
150
200
250
300
350
400
450
1050
1100
1150
1200
1250
1300
1350
1400
1450
1500
1550
08 09 10 11 12 13 14 15
Trade balance (right-hand scale)
(left-hand scale)
ExportsImports
(left-hand scale)
Foreign tradea)
Billion euros Billion euros
a) In constant prices, chain-linked volumes, reference year 2010, seasonally adjusted and work-day adjusted.
Figure 1. 12

-1
0
1
2
3
4
2008 2009 2010 2011 2012 2013 2014 2015
-1
0
1
2
3
4
% change over previous year's month
a) Harmonised Index of Consumer Prices (HICP). b) HICP excluding energy, food, alcohol and tobacco.
Source: Eurostat, last accessed on 11 January 2016.
Price developments in the euro area
HICPa)
Core inflation rateb)
% change over previous year's month
GDP deflator
Figure 1. 13
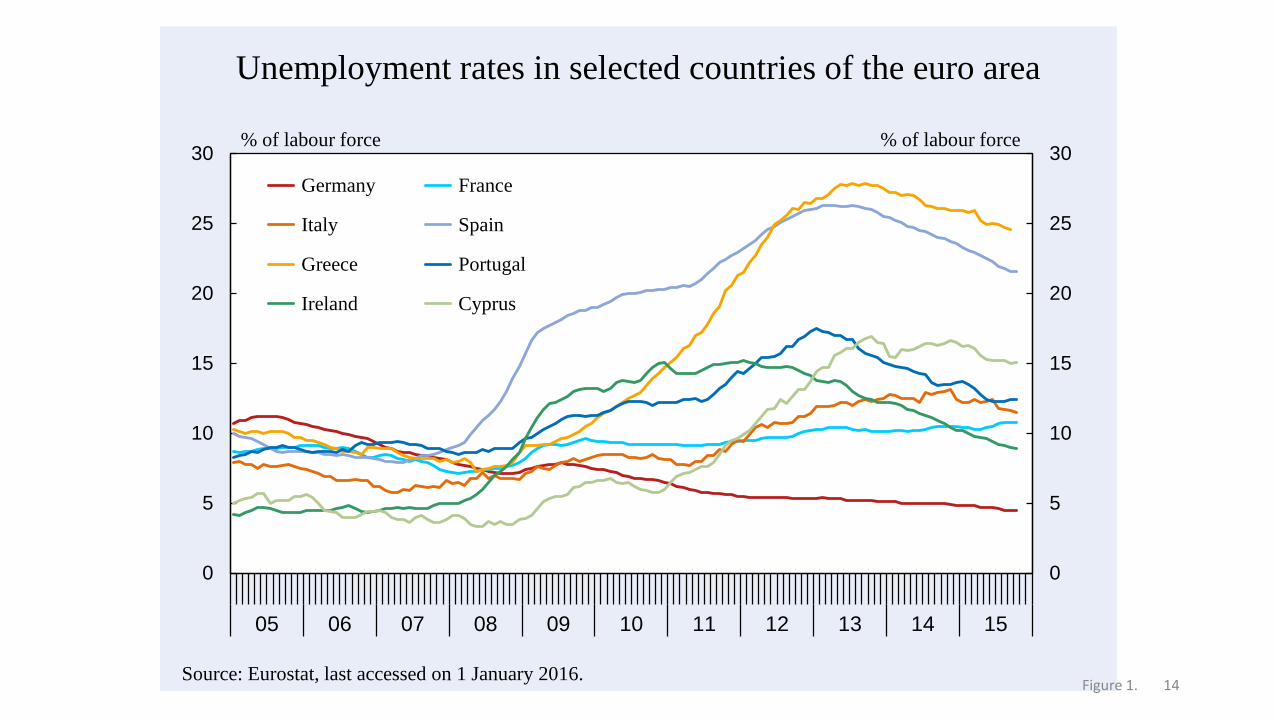
0
5
10
15
20
25
30
0
5
10
15
20
25
30
05 06 07 08 09 10 11 12 13 14 15
Germany France
Italy Spain
Greece Portugal
Ireland Cyprus
Unemployment rates in selected countries of the euro area
Source: Eurostat, last accessed on 1 January 2016.
% of labour force % of labour force
Figure 1. 14

-12
-10
-8
-6
-4
-2
0
06 07 08 09 10 11 12 13 14 15 16
-12
-10
-8
-6
-4
-2
0% of GDP
United States
Euro area
Japan
Source: OECD, OECD Economic Outlook, Vol. 2015 issue 2, November.
Government structural budget balances
United
Kingdom
% of GDP
Forecast
period
Figure 1. 15

-50
0
50
100
150
200
250
300
350
400
0
20
40
60
80
100
120
140
160
180
2009 2010 2011 2012 2013 2014 2015
Persons (in thousands) % change over previous year's month
Source: Eurostat, last accessed on 1 January 2016.
First-time asylum applicants in the European Union
Growth in first-time asylum applicants(right-hand scale)
Number of first-time asylum
applicants (left-hand scale)
0
50,000
100,000
150,000
200,000
250,000
300,000
350,000
400,000
450,000
500,000
First-time asylum applicants in 2014 and 2015
0.00
0.50
1.00
1.50
2.00
2.50
First-time asylum applicants in 2014 and 2015 as percentage of the population
Share EU
Figure 1. 16

-15
-10
-5
0
5
10
15
-15
-10
-5
0
5
10
15
2015 2010-2014 2008/2009 Total improvement during 2010-2015
% of GDP in 2007 % of GDP in 2007
Changes in the primary fiscal balances relative to pre-crisis GDPa)
a) Below the horizontal axis at zero deteriorations of the primary fiscal balance are reported; above this line
improvements are shown. The sum of the three bars result in the overall change during 2008-2015.
Source: European Commission, DG ECFIN, General Government Data and AMECO, Autumn 2015.Figure 1. 17

0
1
2
3
4
5
6
06 07 08 09 10 11 12 13 14 15 16
0
1
2
3
4
5
6%
Main refinancing
rate (ECB, euro area)
Federal target rate
(Fed, United States)
Bank rate (BoE,
United Kingdom)
Target policy rate
(BoJ, Japan)
Source: European Central Bank; Federal Reserve Bank of St. Louis, Bank of England, Bank of Japan,
last accessed on 1 January 2016.
Central bank interest rates%
Figure 1. 18

0
200
400
600
800
1,000
1,200
1,400
1,600
0
200
400
600
800
1,000
1,200
1,400
1,600
08 09 10 11 12 13 14 15
Billion euros Billion euros
Liquidity provision by the ECB
a) Monthly average of main and longer-term refinancing operations, marginal lending facility and securities
held for monetary policy purposes. b) Monthly average of the use of fixed-term deposits at the ECB. c) Monthly
average of excess reserves at the ECB. d) Monthly average of all securities held for monetary purposes.
Source: European Central Bank, last accessed on 1 January 2016.
Net liquidity provision
Fixed-term depositsb)
Liquidity providing measuresa)
Direct Purchasesd)
Excess reservesc)
Figure 1. 19

-4
-2
0
2
4
6
8
10
12
98
100
102
104
106
108
110
112
114
08 09 10 11 12 13 14 15a) These indexes of adjusted outstanding amounts are calculated according to It = It-1(1+Ft/Lt-1), where L stands for
the outstanding nominal amount of credit and F the amount of transactions (credit granted). The transactions F are
calculated from differences in outstanding amounts adjusted for reclassifications, other revaluations, exchange rate
variations and other changes which do not arise from transactions (see European Central Bank, 2010, for details). A
specific securitisation operation in France has led to a downward level shift in mortgages in May 2014.
Source: European Central Bank, last accessed on 1 January 2016.
Index (2007=100) % change over previous year's month
Corporate credit
Credit developments in the euro areaa)
Mortgages
Consumer credit
Bars: year-on-year growth
Lines: indexed levels
Figure 1. 20
0
1
2
3
4
5
6
0
1
2
3
4
5
6
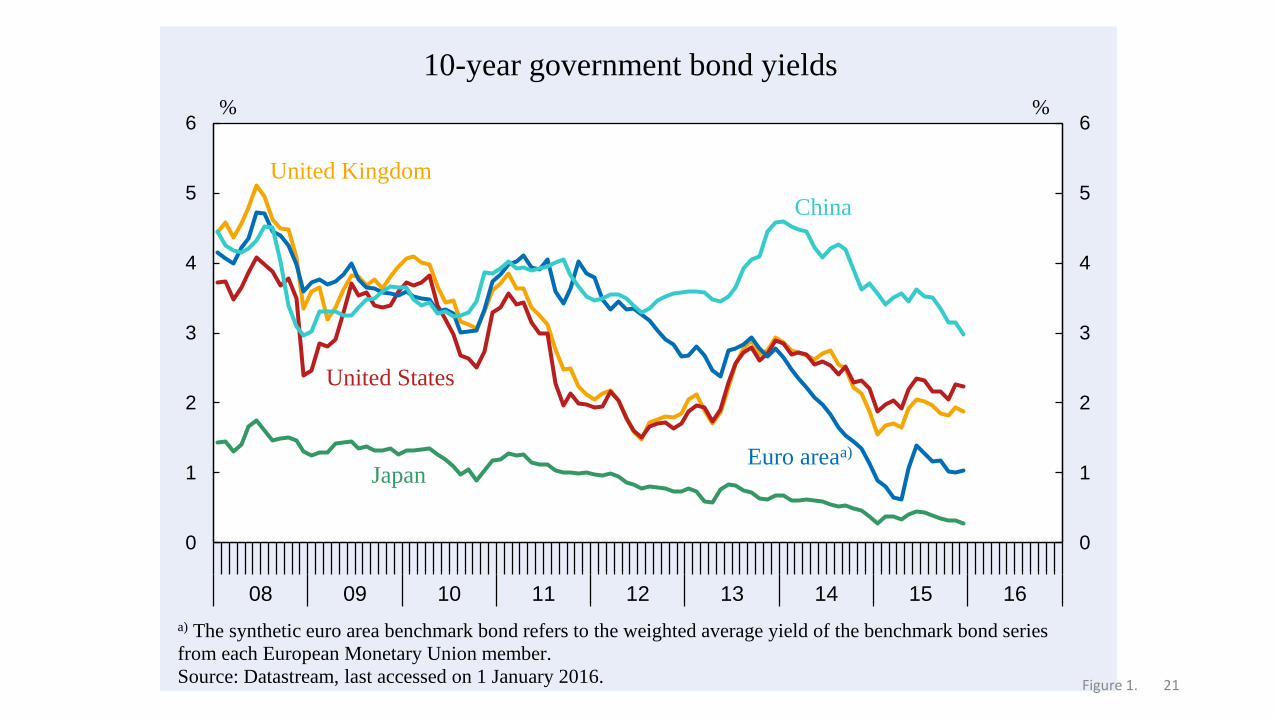
08 09 10 11 12 13 14 15 16
10-year government bond yields
%
a) The synthetic euro area benchmark bond refers to the weighted average yield of the benchmark bond series
from each European Monetary Union member.
Source: Datastream, last accessed on 1 January 2016.
Japan
United States
China
Euro areaa)
%
United Kingdom
Figure 1. 21

-4
0
4
8
12
16
-10
0
10
20
30
40
08 09 10 11 12 13 14 15 16
Greece (left-hand scale)
Portugal
Ireland
Italy
Spain
Belgium
France
Austria
Finland
Netherlands
Germany
% points
Source: Datastream, last accessed on 1 January 2016.
Regional disparties w.r.t. government bond yields in the euro areaDifferences between 10-year national and synthetic euro area benchmark bond yields
% points
Figure 1. 22
0
1
2
3
4
5
6
7
8
9
0
1
2
3
4
5
6
7
8
9
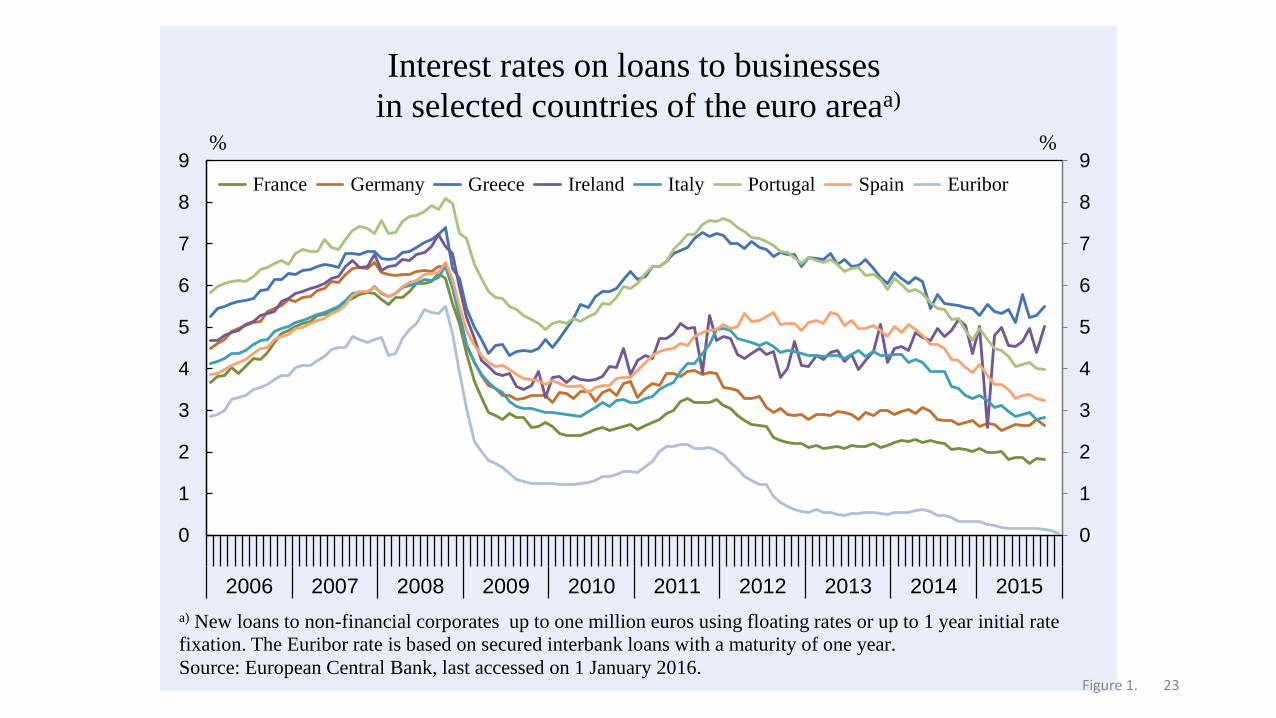
2006 2007 2008 2009 2010 2011 2012 2013 2014 2015
France Germany Greece Ireland Italy Portugal Spain Euribor
%
a) New loans to non-financial corporates up to one million euros using floating rates or up to 1 year initial rate
fixation. The Euribor rate is based on secured interbank loans with a maturity of one year.
Source: European Central Bank, last accessed on 1 January 2016.
Interest rates on loans to businesses
in selected countries of the euro areaa)
%
Figure 1. 23

40
60
80
100
120
140
160
180
40
60
80
100
120
140
160
180
08 09 10 11 12 13 14 15 16
DJ Industrial Average
Shanghai SE Composite
Nikkei 225
FTSE 100
Euro STOXX 50
Index (2007=100)
a) Stock market indexes outside the euro area are first converted into euros.
Source: Datastream, last accessed on 1 January 2016.
Developments in international stock markets
from an euro-area perspectivea)
Index (2007=100)
Figure 1. 24

0
20
40
60
80
100
120
140
160
0
20
40
60
80
100
120
140
160
08 09 10 11 12 13 14 15 16
CAC 40 (France) DAX (Germany)
MIB (Italy) IBEX 35 (Spain)
Athex (Greece) PSI (Portugal)
ISEQ (Ireland)
Index (2007=100)
Source: Datastream, last accessed on 1 January 2016.
Developments of selected stock markets within the euro areaIndex (2007=100)
Figure 1. 25

70
80
90
100
110
120
130
140
150
70
80
90
100
110
120
130
140
150
08 09 10 11 12 13 14 15
Index (2007=100)
Real effective exchange rates around the world
Euro area
United Kingdom
United States
JapanChina
Source: Bank for International Settlements, last accessed on 1 January 2016.
Index (2007=100)
Figure 1. 26

1.00
1.10
1.20
1.30
1.40
1.50
1.60
1.70
06 07 08 09 10 11 12 13 14 15 16
1.00
1.10
1.20
1.30
1.40
1.50
1.60
1.70US dollars per euro
a) The nominal exchange rate is based on monthly data, while the exchange rate based on purchasing power parity
(PPP) is given at a quarterly frequency. The US dollar-euro PPP rate is calculated as the GDP-weighted average of
the euro country-specific PPP estimates vis-à-vis the US dollar. The PPP upper bound represents the 90th percentile
of the euro country-specific PPP estimates vis-à-vis the US dollar; the lower bound the 10th percentile. In calculating
these bounds the 11 euro area member countries with the largest GDP weights are used. Source: OECD, OECD
Economic Outlook, Vol. 2015 issue 2, November , European Central Bank, last accessed on 1 January 2016.
US dollars per euro
Exchange rate of the euro against the US dollar and PPPa)
Exchange rate
Purchasing
Power
Parity
Lower bound
Upper bound
Figure 1. 27

Figure 1. 28
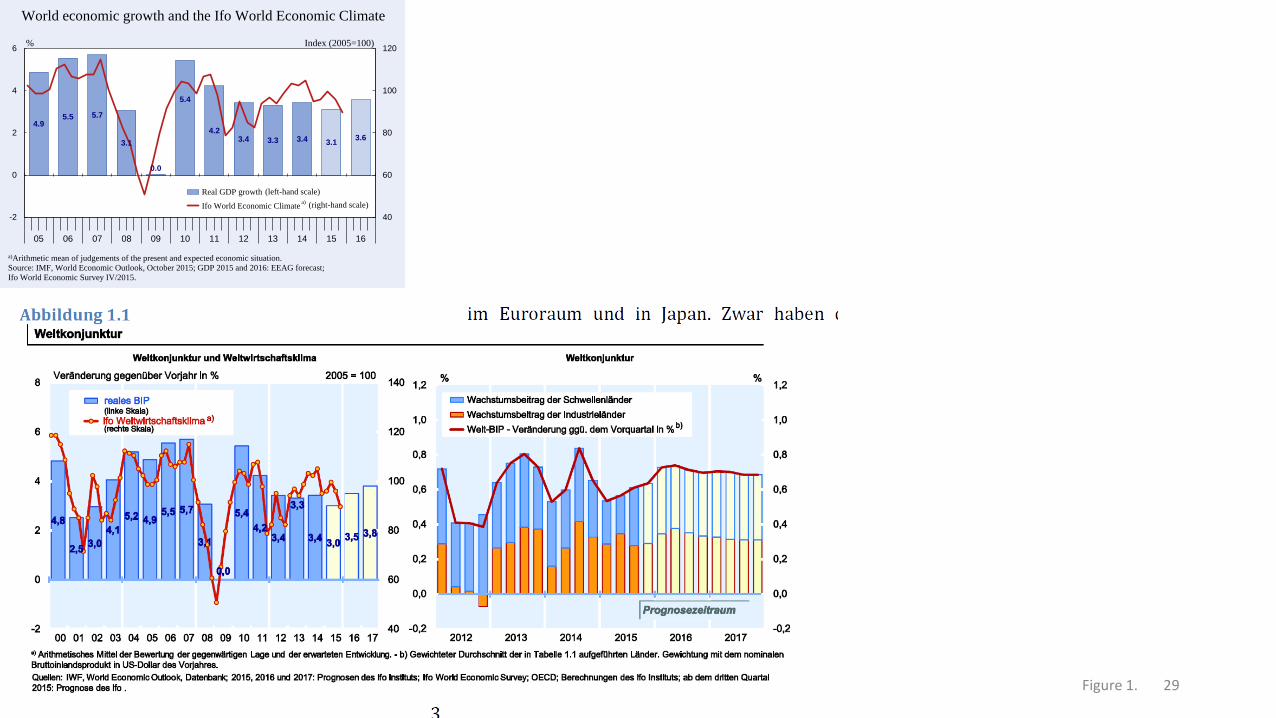
4.95.5 5.7
3.1
0.0
5.4
4.23.4 3.3 3.4 3.1
3.6
40
60
80
100
120
05 06 07 08 09 10 11 12 13 14 15 16
-2
0
2
4
6
Real GDP growth
Ifo World Economic Climate
World economic growth and the Ifo World Economic Climate
% Index (2005=100)
(left-hand scale)
(right-hand scale)
a)Arithmetic mean of judgements of the present and expected economic situation.
Source: IMF, World Economic Outlook, October 2015; GDP 2015 and 2016: EEAG forecast;
Ifo World Economic Survey IV/2015.
a)
Figure 1. 29

-3
-2
-1
0
1
2
3
4
5
06 07 08 09 10 11 12 13 14 15 16-3
-2
-1
0
1
2
3
4
5
Other countries
Latin America and Russia
Asia
North America
Western and Central Europe
World GDP growth
Regional contributions to world GDP growtha)
%
a) Based on market weights.
Source: IMF; EEAG calculations. 2015 and 2016: EEAG forecast.
%
Forecast
period
Figure 1. 30
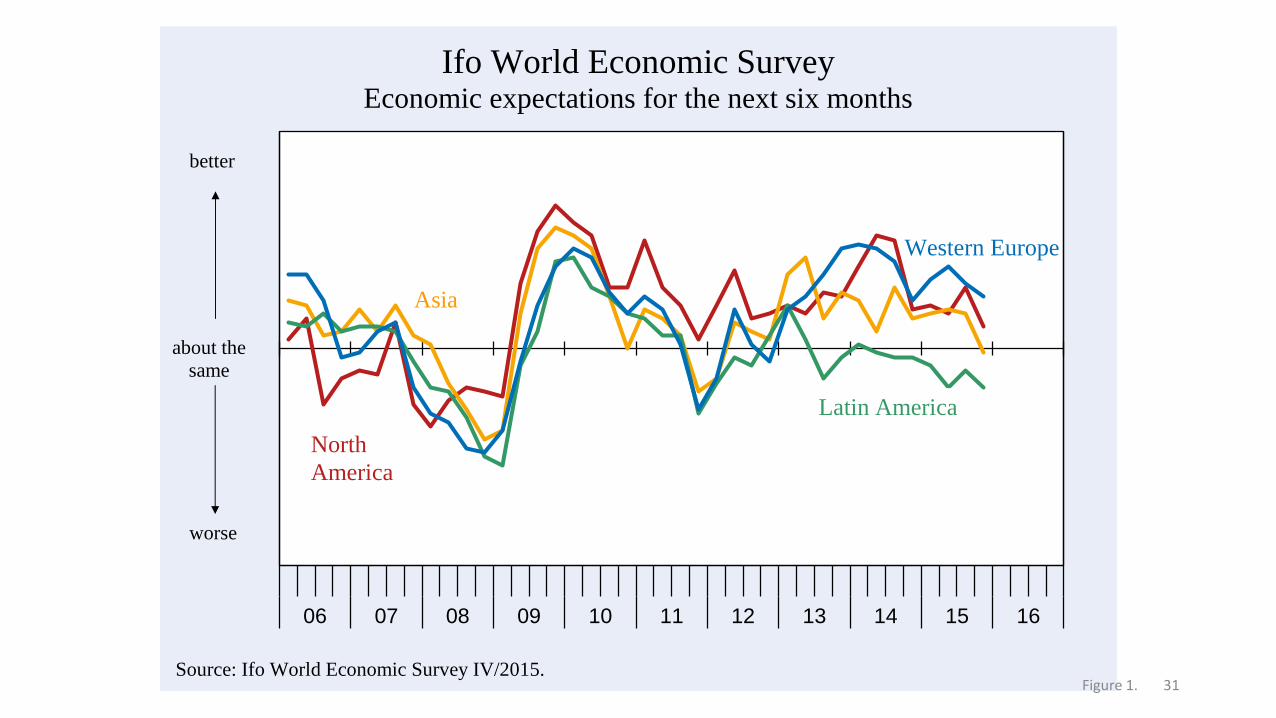
06 07 08 09 10 11 12 13 14 15 16
Source: Ifo World Economic Survey IV/2015.
Ifo World Economic SurveyEconomic expectations for the next six months
North
America
Western Europe
Latin America
Asia
worse
better
about the
same
Figure 1. 31

3
5
7
9
11
13
15
06 07 08 09 10 11 12 13 14 15 16-6
-4
-2
0
2
4
6
United States
Japan
European Union
China (right-hand scale)
Economic growth by regionReal GDP percentage change from previous year
% %
Source: BEA; Eurostat; ESRI; National Bureau of Statistics of China; 2015 and 2016 EEAG forecast.
Forecast
period
Figure 1. 32

33
-45
-35
-25
-15
-5
5
15
25
35
-45
-35
-25
-15
-5
5
15
25
35
08 09 10 11 12 13 14 15 16
Confidence indicatorsa) for different sectors
in the European Union
a) Arithmetic means of selected (seasonally adjusted) balances on business and consumer tendency survey
questions. Balances are constructed as the difference between the percentages of respondents giving positive and
negative replies. Source: European Commission, last accessed on 11 January 2016.
Balance Balance
(Non-fin.)
services
Financial
services
Construction
Retail trade
Industry
Consumers
Figure 1.

-12
-8
-4
0
4
8
12
94
96
98
100
102
104
106
08 09 10 11 12 13 14 15 16
Annualised quarterly growth (right-hand scale)
Annual growth
GDP (left-hand scale)
Source: Eurostat; EEAG calculations and forecast.
Index (2007=100) %
Real GDP in the European Union
Seasonally adjusted data
1.4
-4.4
1.82.1
-0.5 0.2
Forecast
period
1.8
0.5
Figure 1. 34
-5
-4
-3
-2
-1
0
1
2
3
4
06 07 08 09 10 11 12 13 14 15 16-5
-4
-3
-2
-1
0
1
2
3
4
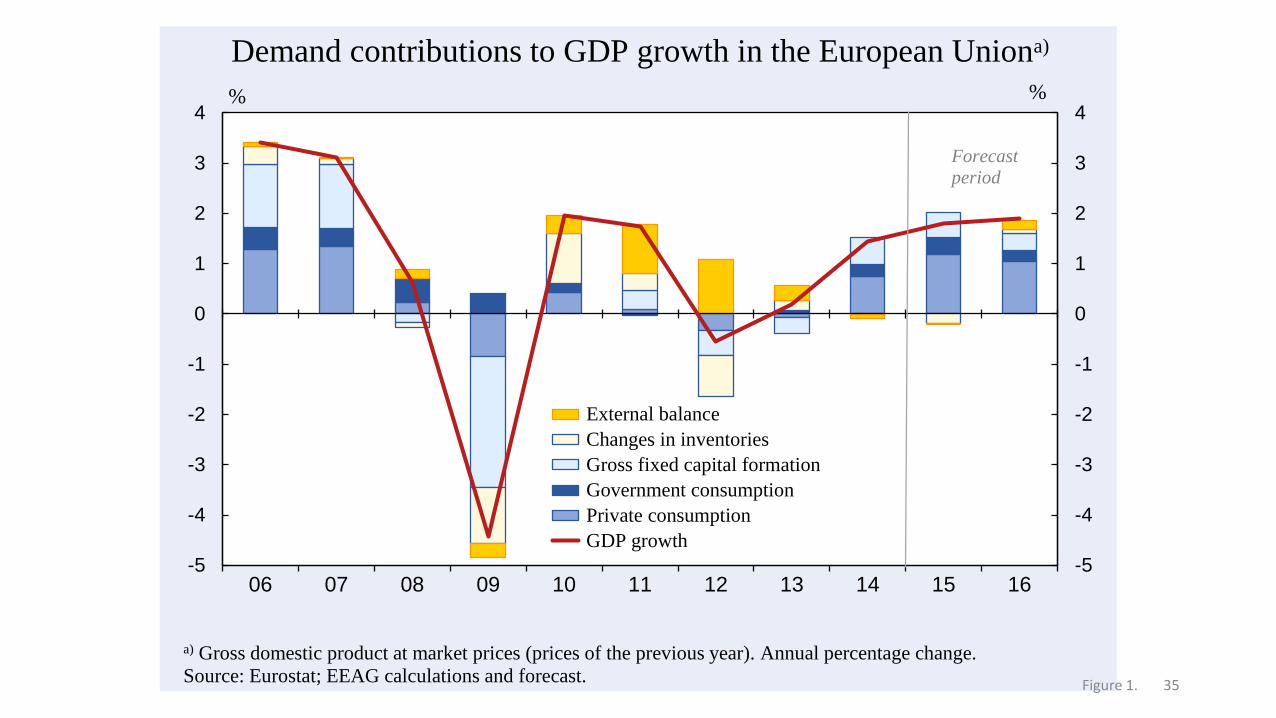
External balance
Changes in inventories
Gross fixed capital formation
Government consumption
Private consumption
GDP growth
Demand contributions to GDP growth in the European Uniona)
a) Gross domestic product at market prices (prices of the previous year). Annual percentage change.
Source: Eurostat; EEAG calculations and forecast.
%
Forecast
period
%
Figure 1. 35

-4
-2
0
2
4
101
103
105
107
109
111
05 06 07 08 09 10 11 12 13 14 15 16 17
Annualised quarterly growth (right-hand scale)
Annual growth
Employment (left-hand scale)
Employment in the European UnionSeasonally and work-day adjusted data
Index (2002=100) %
Source: Eurostat; EEAG calculations and forecast.
Forecast
period
-1.6
-0.7
1.3
1.0
1.7
1.91.1
0.2 -0.4-0.3
1.0
Figure 1. 36

6
7
8
9
10
11
12
13
6
7
8
9
10
11
12
13
06 07 08 09 10 11 12 13 14 15 16
%
Unemployment rates in the euro area and the European Union
Source: Eurostat; EEAG calculations and forecast.
Seasonally adjusted data
Forecast
period
European
Union
Euro area
%
Figure 1. 37

-3
-2
-1
0
1
2
3
4
Source: Eurostat, last accessed on 1 January 2016; 2015 and 2016: EEAG forecast.
-1
0
1
2
3
4
5
6
7
-1
0
1
2
3
4
Economic growth in the EU member countries
Average real GDP growth, 2005–2014
Real GDP growth, 2015
Real GDP growth, 2016
European Union
European Union
European Union
%
%
%
Figure 1. 38


![[XLS] · Web view26323002006 126000 27500 15240820005 6100 15000810001 1175 31285802004 2325 12390817303 39000 4250 3600 17610089008 5300 27395716012 10750 17610714008 12750 15240046008](https://static.documents.pub/doc/80x56/5aeb7cd47f8b9a66258d6e57/xls-view26323002006-126000-27500-15240820005-6100-15000810001-1175-31285802004.jpg)

