Page 1
• Managed Services • Cloud Services • Consul3ng Services • Licensing
Effec%ve SQL Tuning Using Oracle’s Real Time SQL Monitor Kasey Parker Enterprise Architect [email protected]
Managed Services
Cloud Services
Consul3ng Services
Licensing
Page 2
• Managed Services • Cloud Services • Consul3ng Services • Licensing
Who is Centroid?
§ Centroid is a leading provider of Oracle Technology, Applica8ons and Infrastructure/Hos8ng solu8ons
§ Oracle Pla8num Partner • Oracle’s 2015 Engineered Systems Partner of the Year for North America • Selected to Oracle’s Top 25 Strategic Partner Program • Top 5 Oracle Partner for Hardware/Storage
§ Established in 1997
§ Office loca8ons: Troy, MI (HQ); San Francisco, CA; Los Angeles, CA; Dallas, TX
§ 200+ Consultants
§ “Clients for life” approach to customer rela8onships
§ Oracle Exadata Center of Excellence established in 2011 • Centroid Authored -‐ Oracle Exadata Recipes (Published Feb-‐2013)
QUICK FACTS
Page 3
• Managed Services • Cloud Services • Consul3ng Services • Licensing
Agenda § Why Real-‐Time SQL Monitor (RSM)? § What is it? § How do I access it? § What can I get from it and how do I interpret? § What’s new for 12c? § Q&A
Page 4
• Managed Services • Cloud Services • Consul3ng Services • Licensing
Too many different traces to get what
I’m looking for
I want a tracing tool I can use without going to a DBA
What’s a good way to trace parallel processes?
I want a simpler way to trace my SQL
How do I see trace information while my statement is running?
How do I interpret execution plans that are
100+ lines long?
How’s your SQL tuning going?
Is there an easy way to see if I got a
Smart Scan?
Page 5
• Managed Services • Cloud Services • Consul3ng Services • Licensing
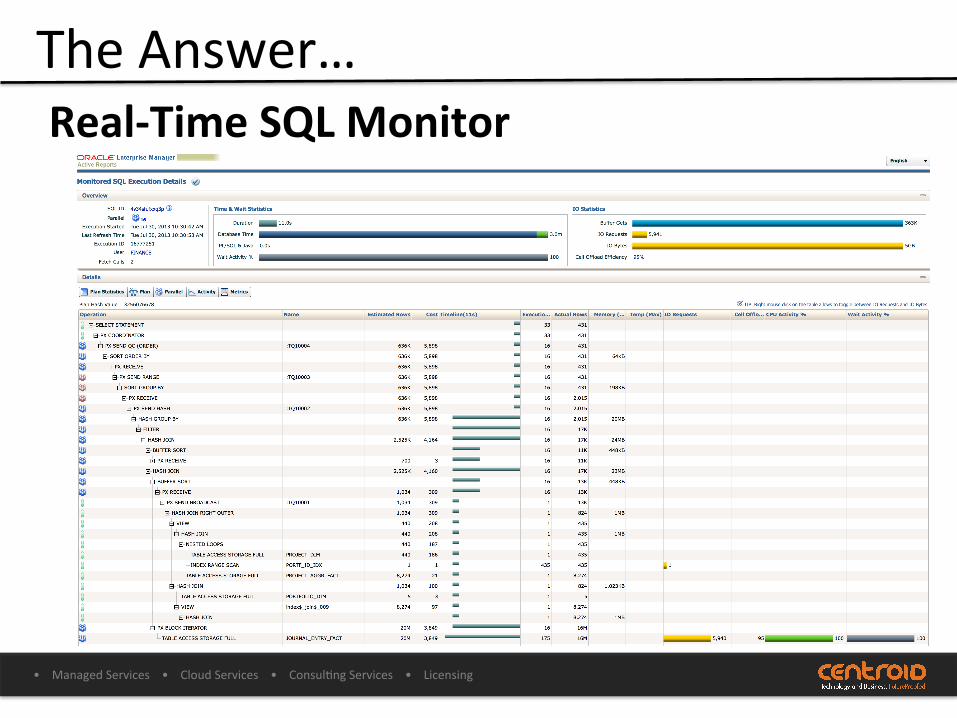
The Answer… Real-‐Time SQL Monitor
Page 6
• Managed Services • Cloud Services • Consul3ng Services • Licensing
Real-‐Time SQL Monitor Overview • Introduced in 11G
– Ac3ve Report Introduced in 11GR2 – New 12c wait and plan step informa3on available
• Feature includes new views, hints, func3ons and reports
• Most value available in the Ac3ve XML version of the SQL Monitor Report
• My opinion: Best tool ever created by Oracle to tune and troubleshoot SQL on Oracle database
Page 7
• Managed Services • Cloud Services • Consul3ng Services • Licensing
Real-‐Time SQL Monitor Basics • Allows detailed monitoring of SQL Statements while they are execu3ng
• No Performance Penalty – Similar to AWR and ASH, informa3on efficiently captured by background processes
• Statements consuming >5 seconds of DB 3me or executed in parallel monitored by default
Use /*+ MONITOR */ hint to force
Page 8
• Managed Services • Cloud Services • Consul3ng Services • Licensing
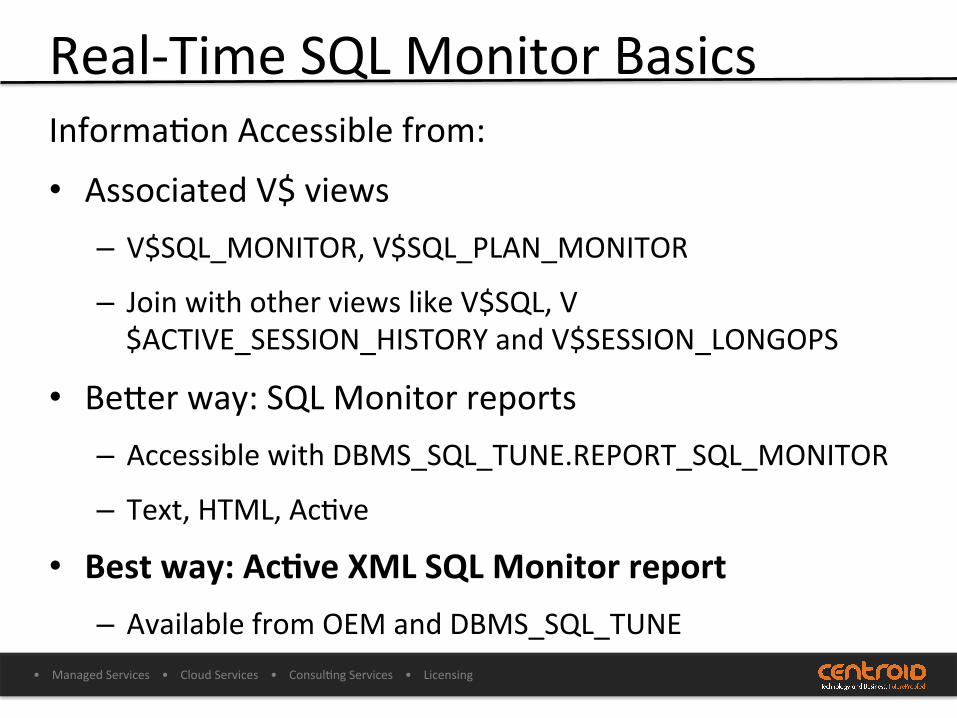
Real-‐Time SQL Monitor Basics Informa3on Accessible from:
• Associated V$ views – V$SQL_MONITOR, V$SQL_PLAN_MONITOR
– Join with other views like V$SQL, V$ACTIVE_SESSION_HISTORY and V$SESSION_LONGOPS
• Befer way: SQL Monitor reports – Accessible with DBMS_SQL_TUNE.REPORT_SQL_MONITOR
– Text, HTML, Ac3ve
• Best way: Ac%ve XML SQL Monitor report – Available from OEM and DBMS_SQL_TUNE
Page 9
• Managed Services • Cloud Services • Consul3ng Services • Licensing
Accessing SQL Monitor Using Enterprise Manager • Access from the Performance home by clicking on
the SQL Monitoring link at the bofom of the page
• Or in 12c there is now a direct link from the Performance Menu
Page 10
• Managed Services • Cloud Services • Consul3ng Services • Licensing
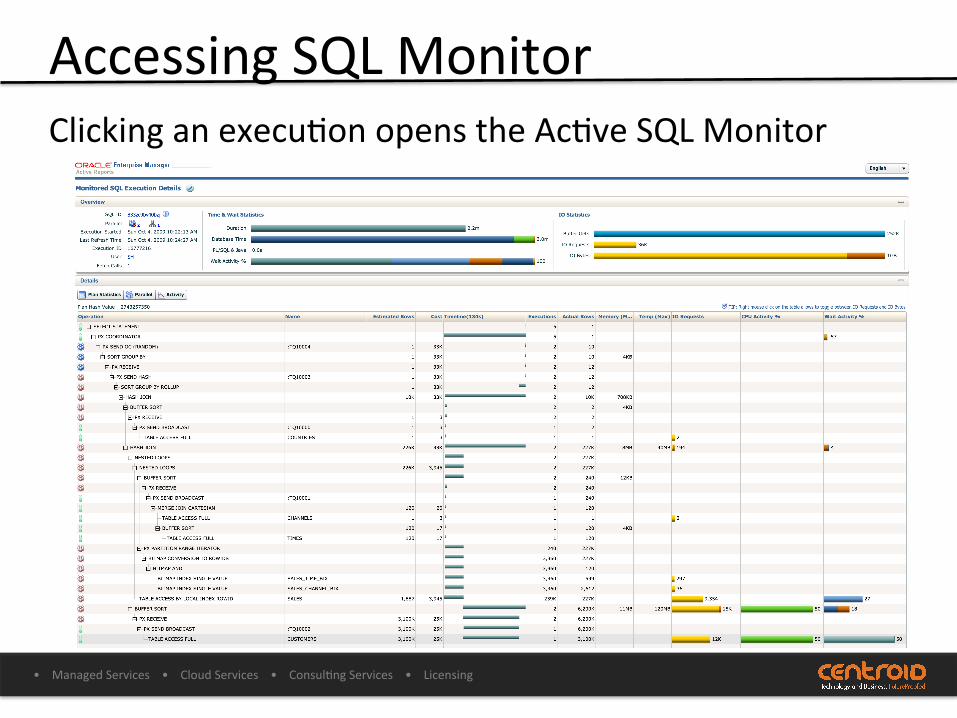
Accessing SQL Monitor SQL Monitoring link opens Monitored SQL Execu3ons
Page 11
• Managed Services • Cloud Services • Consul3ng Services • Licensing
Accessing SQL Monitor Clicking an execu3on opens the Ac3ve SQL Monitor
Page 12
• Managed Services • Cloud Services • Consul3ng Services • Licensing
Accessing SQL Monitor Using DBMS_SQLTUNE package • Generate using
DBMS_SQLTUNE.REPORT_SQL_MONITOR func3on
• Requires many “DBA” type permissions including: – ADMINISTER SQL MANAGEMENT OBJECT
– ADMINISTER ANY SQL TUNING SET
– ADVISOR
– Select rights on many performance views: • V$SQL*, V$ACTIVE_SESSION_HISTORY, V$SESSION_LONGOPS and
most DBA_HIST* views
Page 13
• Managed Services • Cloud Services • Consul3ng Services • Licensing
Accessing SQL Monitor SET LONG 1000000 SET LONGCHUNKSIZE 1000000 SET LINESIZE 1000 SET PAGESIZE 0 SET TRIM ON SET TRIMSPOOL ON SET ECHO OFF SET FEEDBACK OFF SET HEADING OFF SET SHOW OFF SET VERIFY OFF SPOOL report_sql_monitor_acIve.htm SELECT DBMS_SQLTUNE.report_sql_monitor( sql_id => '1kf86hqsyvddb’, type => 'ACTIVE', report_level => 'ALL') AS report FROM dual; SPOOL OFF
Example:
Page 14
• Managed Services • Cloud Services • Consul3ng Services • Licensing
Access by Developers If concerned about level of privileges, put a wrapper func3on, owned by a privileged user, around the DBMS_SQLTUNE.REPORT_SQL_MONITOR func3on. Then grant execute on the func3on to your developers.
CREATE OR REPLACE FUNCTION EXEC_REPORT_SQL_MONITOR( p_sql_id in varchar2
) RETURN clob IS v_report_clob clob; BEGIN v_report_clob := dbms_sqltune.report_sql_monitor(SQL_ID => p_sql_id); RETURN v_report_clob; END;
Page 15
• Managed Services • Cloud Services • Consul3ng Services • Licensing
Access by Developers A developer can then generate the report using a script:
set long 1000000 set longchunksize 1000000 … column spoolfilename new_value splfile accept sql_id prompt 'Enter value for sql_id: ‘ select 'sqlmon_' || '&&sql_id' || '.html' as spoolfilename from dual ; spool &splfile SELECT EXEC_REPORT_SQL_MONITOR( p_sql_id => '&&sql_id', p_type => 'ACTIVE') AS monitor_report FROM dual; spool off undef sql_id undef spoolfilename undef splfile
Page 16
• Managed Services • Cloud Services • Consul3ng Services • Licensing
Access by Developers How to find the SQL ID? Use V$SQL…
set lines 200 pages 60 set feedback off echo off set verify off set pagesize 999 variable sql_id varchar2(30) variable sql_text varchar2(80) set feedback on select /* NORESULT */ sql_id from gv$sql s where sql_text like '%&sql_txt%'
and sql_text not like '%NORESULT%' and sql_text not like 'BEGIN :sql_%’
order by 1 desc / undef sql_id undef sql_text
Page 17
• Managed Services • Cloud Services • Consul3ng Services • Licensing
What’s in a SQL Monitor Report A wealth of informa3on including: • Execu3on Plan • Plan sta3s3cs
– Es3mated vs. actual row counts – a key indicator for sta3s3c problems • DB Time break down and wait sta3s3cs
– Execu3on’s overall dura3on vs. DB 3me – CPU and wait events for each execu3on step and the 3me spent on each
• Bind Variable Values • IO Sta3s3cs • Memory sta3s3cs • Temp space sta3s3cs • Parallel ac3vity detail • CPU, IO, Memory and Wait ac3vity mapped over the statement run 3me • Exadata cell offload (smart scan) efficiency
Page 18
• Managed Services • Cloud Services • Consul3ng Services • Licensing
DEMO
Page 19
• Managed Services • Cloud Services • Consul3ng Services • Licensing
SQL Monitor Use Cases SQL Monitor can help with things like: • Breaking down, understanding and quickly iden3fying problem
areas of large execu3on plans • Op3mal use of indexes • Par3ally parallelized SQL • Verifying parallel DML/DDL • Detec3ng skew between parallel processes • Iden3fying network, applica3on or other latency outside of
database processing • Cause of high temp usage • Verifying Exadata Smart Scans and cell offload efficiency • And many more!
Page 20
• Managed Services • Cloud Services • Consul3ng Services • Licensing
SQL Monitor Use Case
Breaking down, understanding and quickly iden3fying problem areas of large execu3on plans
Page 21
• Managed Services • Cloud Services • Consul3ng Services • Licensing
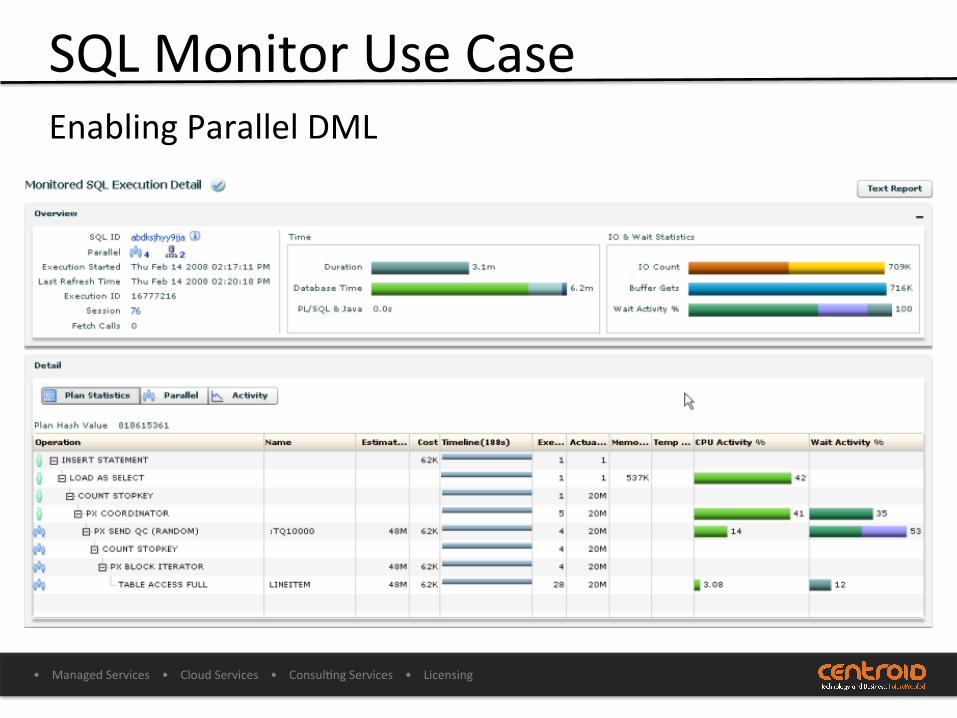
SQL Monitor Use Case Enabling Parallel DML
Page 22
• Managed Services • Cloud Services • Consul3ng Services • Licensing
SQL Monitor Use Case Par3ally Parallelized SQL
Page 23
• Managed Services • Cloud Services • Consul3ng Services • Licensing
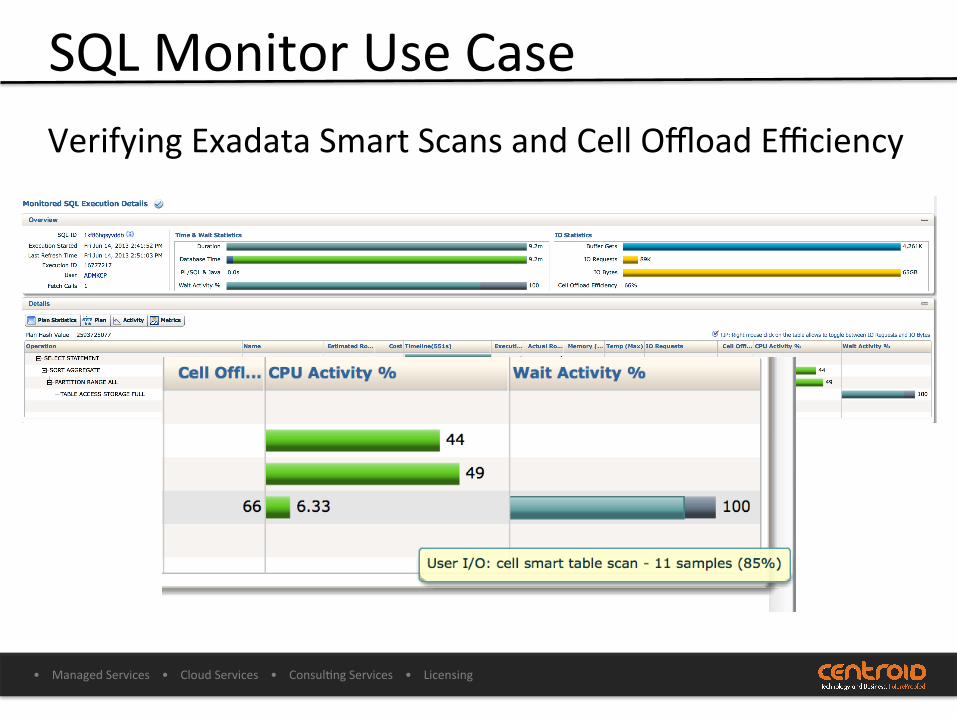
SQL Monitor Use Case Verifying Exadata Smart Scans and Cell Offload Efficiency
Page 24
• Managed Services • Cloud Services • Consul3ng Services • Licensing
WHAT’S NEW FOR SQL MONITOR IN 12C?
Page 25
• Managed Services • Cloud Services • Consul3ng Services • Licensing
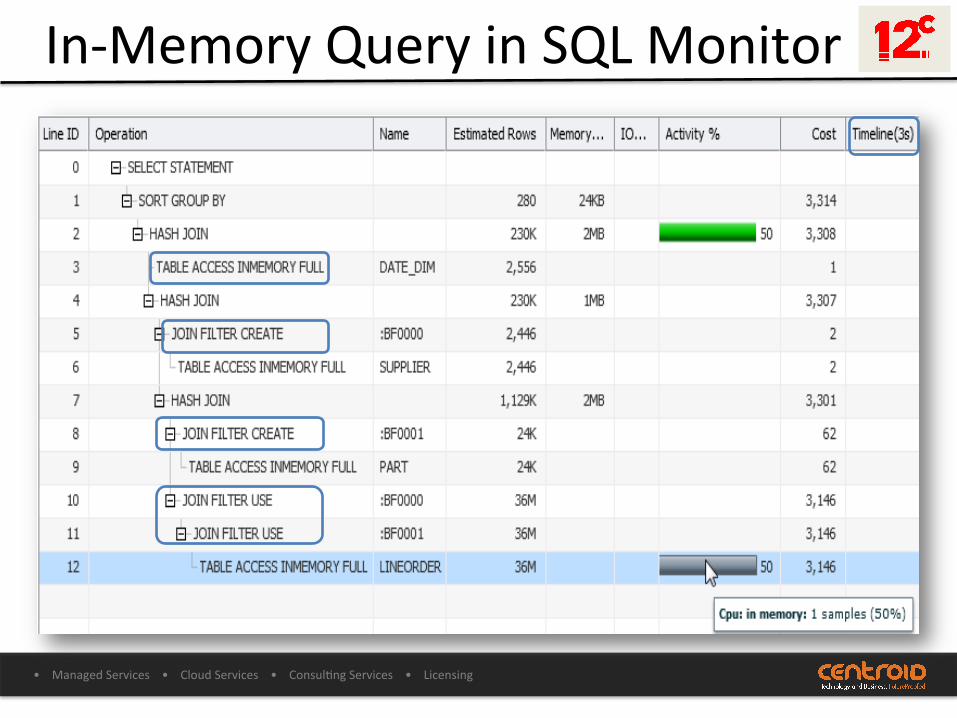
In-‐Memory Query in SQL Monitor
Page 26
• Managed Services • Cloud Services • Consul3ng Services • Licensing
Real-‐Time DB Opera3on Monitor Expand SQL Monitor to defined Database Opera3ons • Iden3fy and Execute a Database Opera3on by:
– Iden3fy the database opera3on • Opera3on Name • Execu3on ID
– Start and end the database opera3on • DBMS_SQL_MONITOR.BEGIN_OPERATION • DBMS_SQL_MONITOR.END_OPERATION.
SQL> VAR dbop_eid NUMBER; SQL> EXEC :dbop_eid := DBMS_SQL_MONITOR.BEGIN_OPERATION
('ORA.ETLLOAD.FINANCE', FORCED_TRACKING => 'Y') SQL> INSERT /*+ APPEND */ * INTO tab1 SELECT ...; SQL> INSERT /*+ APPEND */ * INTO tab2 SELECT ...; SQL> EXEC DBMS_SQL_MONITOR.END_OPERATION
('ORA.ETLLOAD.FINANCE’, :dbop_eid)
Page 27
• Managed Services • Cloud Services • Consul3ng Services • Licensing
Runaway Query Logging Resource Manager can now log to SQL Monitor
– Based on certain thresholds: • Es3mated Execu3on Time • Elapsed Time (new in 12c) • CPU 3me • IO requests or IO Bytes • Logical IOs (new in 12c)
– New columns in V$SQL_MONITOR • RM_LAST_ACTION • RM_LAST_ACTION_REASON • RM_LAST_ACTION_TIME
– Can also s3ll switch consumer group, Abort Call or Kill Session
Page 28
• Managed Services • Cloud Services • Consul3ng Services • Licensing
Summary • SQL Monitor may be the best tool ever created by Oracle to tune and troubleshoot SQL on Oracle databases
• Use the Ac3ve SQL Monitor Report – Access through OEM or DBMS_SQLTUNE
• Contains a wealth of informa3on about the SQL Execu3on
• Can help iden3fy and resolve most of the issues found with SQL Statements
• New Features from 12c expand its capability
Page 29
• Managed Services • Cloud Services • Consul3ng Services • Licensing
Ques3ons?