20
Breede Valley Local Municipality IDP 2007 - 2012 E E L L E E C C T T R R I I C C I I T T Y Y M M A A S S T T E E R R P P L L A A N N 110

Breede Valley Local Municipality IDP 2007 - 2012
EEE LLL EEE CCC TTT RRR III CCC III TTT YYY MMM AAA SSS TTT EEE RRR PPP LLL AAA NNN
110
Breede Valley Local Municipality IDP 2007 - 2012
111
EEE LLL EEE CCC TTT RRR III CCC III TTT YYY MMM AAA SSS TTT EEE RRR PPP LLL AAA NNN
777 ... 000 EEE LLL EEE CCC TTT RRR III CCC III TTT YYY MMM AAA SSS TTT EEE RRR PPP LLL AAA NNN
7.1 BACKGROUND Consultants were appointed by Breede Valley Local Municipality to develop a master plan to facilitate the future growth and upgrading needs of the Municipality’s 66/11kV electricity distribution network.
The Main objective of the study was to:
Produce an electrical network master plan for the distribution networks for the Breede Valley Local Municipality.
Sub-objectives included:
Have the distribution and reticulation networks assessed through a physical audit and data gathering exercise,
Update all existing single line and lay-out drawings and provide detail electronic lay-out drawings,
Build a network model for the distribution networks using NETGroup’s PowerBase,
Do a 20 year Geographical load forecast, based on structure plans, existing customer base and load characteristics,
Analyse the existing networks and determine optimal switching arrangements,
Develop the associated network strengthening and improvement programs and provide an associated capital plan (CAPEX),
Provide all necessary documentation and processes used and results obtained, and
Install the necessary software and data on the customer’s computers and provide training as required.
The Electricity Master Plan reports on the above project objectives. The complete report is included in the accompanying CD.
7.2 LOAD FORECAST
7.2.1 DEMAND FORECAST
7.2.1.1 BACKGROUND
A comprehensive Demand - and Energy forecast was required to establish:
The basis for the distribution system expansion plan.
A basis for the future forecast purchases, and sales of Energy, and Maximum Demand per customer category.
A 20 year Demand and Energy forecast was developed based on international best practice techniques.
7.2.1.2 RESULTS
Data from the Eskom billing spreadsheet were used to calculate the historical growth. The 2024 load values are the calculated forecast value due to the land

Breede Valley Local Municipality IDP 2007 - 2012
112
use change forecast. The calculated value corresponds to an average yearly growth of 4.0% from year 2003 to 2023 for all three regions. Graphs showing the yearly demand growth are shown below, note that demand values are given in kW and MW.
FIGURE 46: WORCESTER EXPECTED YEARLY DEMAND GROWTH
FIGURE 47: DE DOORNS & TOUWS RIVER EXPECTED YEARLY DEMAND GROWTH
0
10
20
30
40
50
60
70
80
90
100
MW
2004 2005 2006 2007 2008 2009 2010 2011 2012 2013 2014 2015 2016 2017 2018 2019 2020 2021 2022 2023 2024
Year
0
500
1000
1500
2000
2500
3000
3500
4000
4500
kW
2004 2005 2006 2007 2008 2009 2010 2011 2012 2013 2014 2015 2016 2017 2018 2019 2020 2021 2022 2023 2024Year
De Doorns Touwsrivier
Breede Valley Local Municipality IDP 2007 - 2012
113
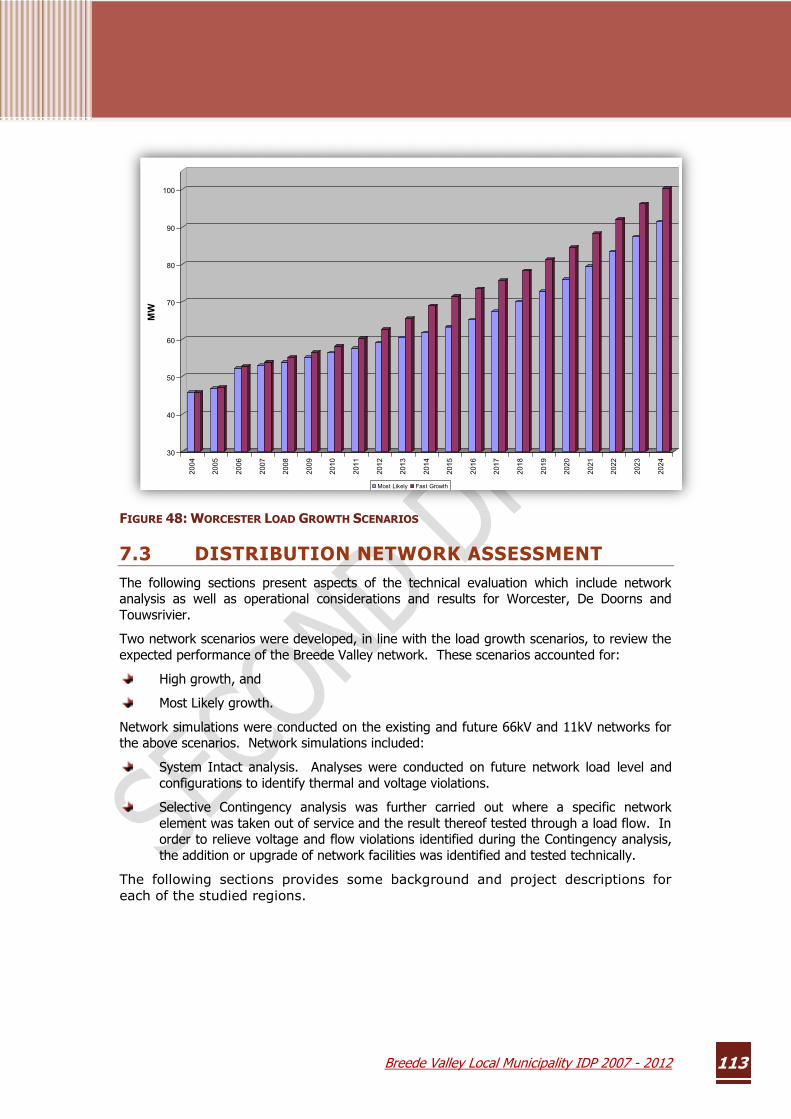
FIGURE 48: WORCESTER LOAD GROWTH SCENARIOS
7.3 DISTRIBUTION NETWORK ASSESSMENT The following sections present aspects of the technical evaluation which include network analysis as well as operational considerations and results for Worcester, De Doorns and Touwsrivier.
Two network scenarios were developed, in line with the load growth scenarios, to review the expected performance of the Breede Valley network. These scenarios accounted for:
High growth, and
Most Likely growth.
Network simulations were conducted on the existing and future 66kV and 11kV networks for the above scenarios. Network simulations included:
System Intact analysis. Analyses were conducted on future network load level and configurations to identify thermal and voltage violations.
Selective Contingency analysis was further carried out where a specific network element was taken out of service and the result thereof tested through a load flow. In order to relieve voltage and flow violations identified during the Contingency analysis, the addition or upgrade of network facilities was identified and tested technically.
The following sections provides some background and project descriptions for each of the studied regions.
30
40
50
60
70
80
90
100
MW
2004
2005
2006
2007
2008
2009
2010
2011
2012
2013
2014
2015
2016
2017
2018
2019
2020
2021
2022
2023
2024
Most Likely Fast Growth

Breede Valley Local Municipality IDP 2007 - 2012
114
7.3.1 WORCESTER DISTRIBUTION REGION
Figure 49 provides an aerial view of the distribution network as well as development initiatives within Worcester.
FIGURE 49: WORCESTER SUPPLY AREA AND DISTRIBUTION NETWORK
7.3.1.1 DISTRIBUTION NETWORK
The main electricity supply to Worcester is through two 66/11kV, 40MVA (Firm) substations; Industrial and Russel. The Industrial 66/11kV substation is being supplied from Eskom at 66kV which in turn supplies the Russel substation via two 66kV cables. The majority of the distribution networks consist of 11kV underground cable networks with some network on the outskirts of the town being overhead lines.
7.3.1.2 LOAD GROWTH
The existing load on the Worcester network is in the order of 45MW and is expected to grow to between 90 and 100MW by 2024.
The expected load growth is shown in Figure 50.

Breede Valley Local Municipality IDP 2007 - 2012
115
FIGURE 50: WORCHESTER EXPECTED LOAD GROWTH
The most prominent development initiatives within Worcester are shown in Figure 49 and include:
The Trans-Hex Housing development to the North-East of Worcester,
The industrial development near the Airport,
The new Dam development consisting of large commercial and residential development. Construction on this development has started during the course of this study, and
7.3.1.3 DISTRIBUTION NETWORK DEFICIENCIES
Analysis of the Worcester distribution network has shown the following:
7.3.1.3.1 Short-term Deficiencies
In the short-term, with the existing network configuration, the Worcester distribution network experiences thermal overloads between Mc Allister and Field, Russell and Civic as well as Russell and Somerset.
The network further requires strengthening to improve adequacy during contingency conditions. The main concern lies with networks between Roodewal and Merindal, supply to Somerset and between Industrial and Zwellentemba.
7.3.1.3.2 Longer-term Deficiencies
With the expected load growth in the future, the above deficiencies will be more prominent. Voltages, just below steady-state criteria are also expected within the Avion Park as well as the Roodewal networks.
These are further worsened by the large development expected at the dam as well as the additional growth in the Somerset and Avion Park areas.
0
10
20
30
40
50
60
70
80
90
100
MW
2004 2005 2006 2007 2008 2009 2010 2011 2012 2013 2014 2015 2016 2017 2018 2019 2020 2021 2022 2023 2024
Year
Breede Valley Local Municipality IDP 2007 - 2012
116
7.3.1.4 WORCESTER PROJECTS
7.3.1.4.1 Central Network Development and Strengthening
The following projects are required to develop and strengthen the central Worcester networks. (The progressive development of these projects is shown geographically in Volume B of the report);
2006: Russell Substation,
2006: Russell – Worcester Dam 66kV Feeders,
2007: SAD 1 – KWV 2 11kV Feeder,
2008: Russell – Santam 11kV Feeder,
2010: T Point – Somerset 66kV Feeders,
2010: Worcester Dam – Klue 11kV Feeder,
2010: Klue – Roux 11kV Feeder,
2010: Roux Substation,
2010: Roux – Rose Gardens 11kV Feeder, and
2010: Rose Gardens Substation.
7.3.1.5 WORCESTER DAM NETWORK DEVELOPMENT AND STRENGTHENING
The following projects relate to the New Worcester Dam and Casino development.
2006: Worcester Dam Distribution,
2007: Worcester Dam Substation,
2007: Worcester Dam – Monta Vista 11kV Feeders,
2007: New Casino Substation and 11kV Incomers,
2008: Worcester Dam HV Substation,
2009: Casino – Golf Estate 11kV Feeder, and
2009: Worcester Dam – Springbok T 11kV Feeder.
7.3.1.6 SOMERSET NETWORK DEVELOPMENT AND STRENGTHENING
The following projects relate to the network strengthening and development around the existing Somerset substation.
2007: Somerset – De Wet 11kV Feeder,
2008: Villiers Dorp Road Substation,
2008: Villiers Dorp Road – Boland College 11kV Feeder,
2008: T 18 – T 20 11kV Feeder,
2009: Villiers Dorp Road – J 5025 11kV Feeder,
2009: Villiers Dorp Road – Albetros 11kV Feeder,
2009: Somerset – Villiers Dorp Road 11kV Feeder,
2010: New Somerset Substation,
2010: Somerset Substation, and
Breede Valley Local Municipality IDP 2007 - 2012
117
2011: New Somerset Distribution.
7.3.1.7 FIELD NETWORK DEVELOPMENT AND STRENGTHENING
The following projects are required for strengthening and development of the networks in the Field – Mc Allister region.
2006: Field 11kV Substation,
2007: Roodewal 11kV Substation,
2007: Russell – Roodewal 11kV Feeder,
2008: Mc Allister – Field via N Yard 11kV Feeder,
2008: Mc Allister – Field via GRW 11kV Feeder,
2008: Smith – Escom 11kV Feeder,
2009: Escom – Mc Allister 11kV Feeder,
2010: Mc Allister – Protea via RUM 11kV Feeder,
2010: Protea 11kV Substation, and
2020: Mc Allister – APLC 11kV Feeder.
7.3.1.8 INDUSTRIAL NETWORK DEVELOPMENT
The following projects relate to development and strengthening in the vicinity of the existing Industrial substation.
2007: Industrial – Roodewal 11kV Feeder, and
2011: Industrial Development.
7.3.1.9 ZWELETHEMBA NETWORK DEVELOPMENT
The following projects will strengthen and support the Zwelethemba and Trans-Hex housing developments.
2006: Zwelethemba – T37 11kV Feeder,
2008: Zwelethemba T18 – T34 11kV Feeder,
2020: Trans Hex 11kV Substation,
2020: Roodewal – Trans Hex 11kV Feeder, and
2020: Trans Hex – Zwelethemba 11kV Feeder.
7.3.1.10 OTHER NETWORK DEVELOPMENT
The following projects are required to support new developments.
2007: Eagle – De Koppen T 11kV Feeder,
2015: VC – ARUM 11kV Feeder, and
2015: WD House – R Village 11kV Feeder.
7.3.2 DE DOORNS DISTRIBUTION REGION
Figure 51 provides a geographical view of the De Doorns supply area and Distribution network.
Breede Valley Local Municipality IDP 2007 - 2012
118
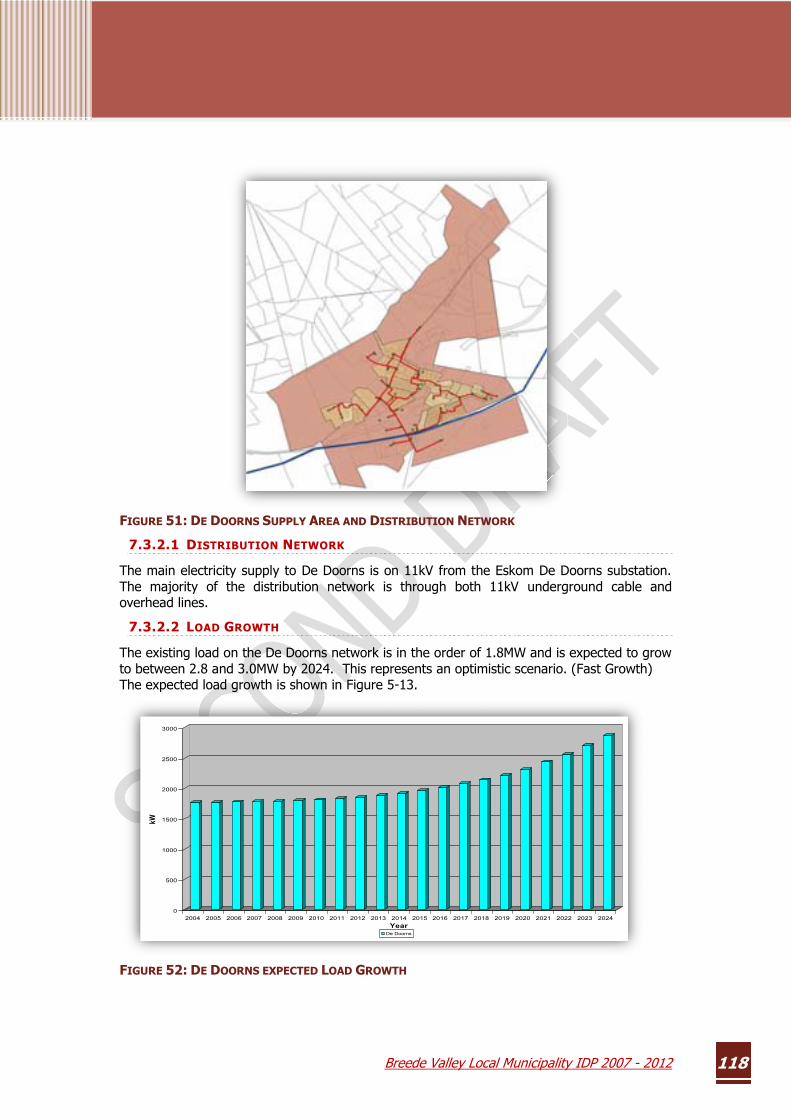
FIGURE 51: DE DOORNS SUPPLY AREA AND DISTRIBUTION NETWORK
7.3.2.1 DISTRIBUTION NETWORK
The main electricity supply to De Doorns is on 11kV from the Eskom De Doorns substation. The majority of the distribution network is through both 11kV underground cable and overhead lines.
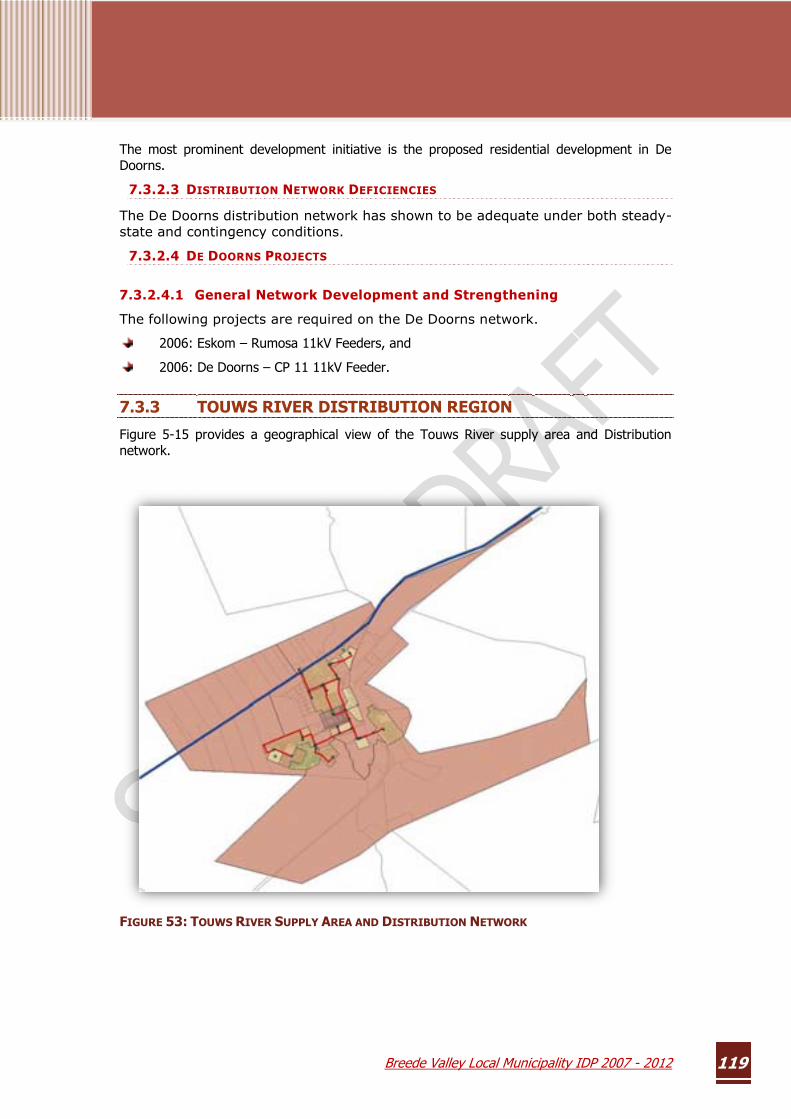
7.3.2.2 LOAD GROWTH
The existing load on the De Doorns network is in the order of 1.8MW and is expected to grow to between 2.8 and 3.0MW by 2024. This represents an optimistic scenario. (Fast Growth) The expected load growth is shown in Figure 5-13.
FIGURE 52: DE DOORNS EXPECTED LOAD GROWTH
0
500
1000
1500
2000
2500
3000
kW
2004 2005 2006 2007 2008 2009 2010 2011 2012 2013 2014 2015 2016 2017 2018 2019 2020 2021 2022 2023 2024Year
De Doorns
Breede Valley Local Municipality IDP 2007 - 2012
119
The most prominent development initiative is the proposed residential development in De Doorns.
7.3.2.3 DISTRIBUTION NETWORK DEFICIENCIES
The De Doorns distribution network has shown to be adequate under both steady-state and contingency conditions.
7.3.2.4 DE DOORNS PROJECTS
7.3.2.4.1 General Network Development and Strengthening
The following projects are required on the De Doorns network.
2006: Eskom – Rumosa 11kV Feeders, and
2006: De Doorns – CP 11 11kV Feeder.
7.3.3 TOUWS RIVER DISTRIBUTION REGION
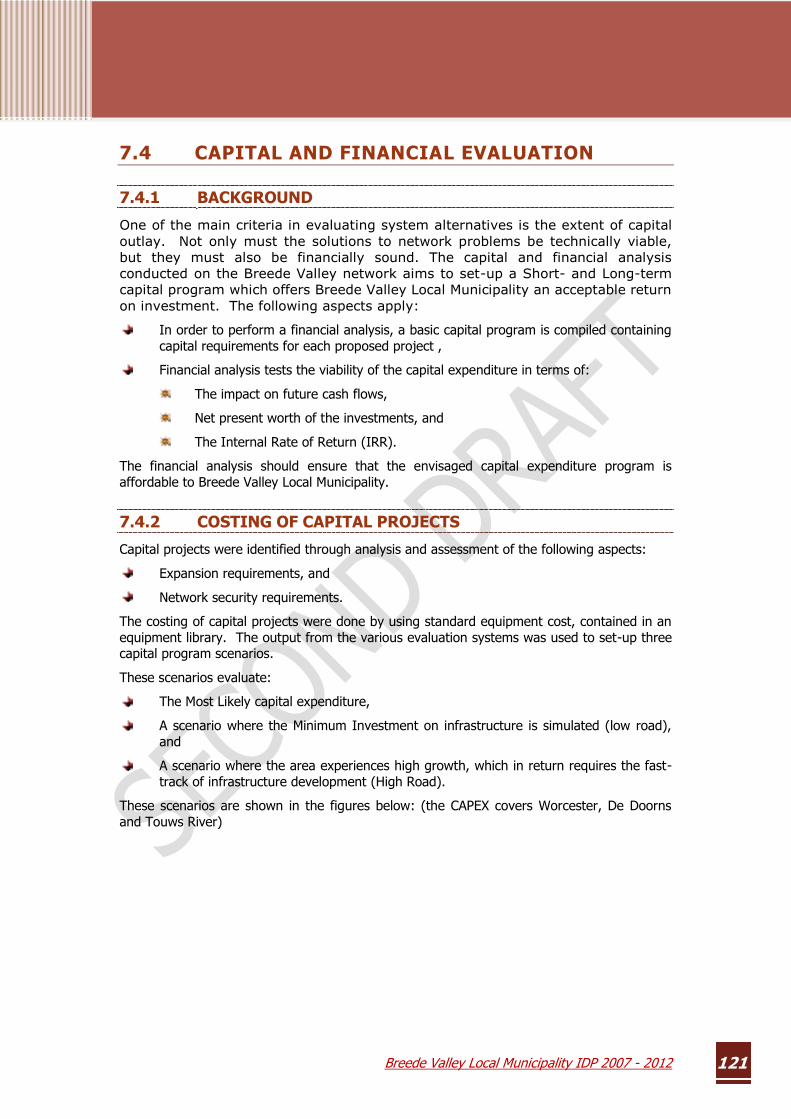
Figure 5-15 provides a geographical view of the Touws River supply area and Distribution network.
FIGURE 53: TOUWS RIVER SUPPLY AREA AND DISTRIBUTION NETWORK

Breede Valley Local Municipality IDP 2007 - 2012
120
7.3.3.1 DISTRIBUTION NETWORK
The main electricity supply to Touws River is on 11kV from Eskom. The majority of the distribution network is through 11kV underground cable with some network on the outskirts of the town being overhead lines.
7.3.3.2 LOAD GROWTH
The existing load on the Touws River network is in the order of 1.8MW and is expected to grow to between 4.5 and 3.0MW by 2024. This represents an optimistic scenario (Fast Growth).
The expected load growth is shown in Figure 54.
FIGURE 54: TOUWS RIVER EXPECTED LOAD GROWTH
7.3.3.3 DISTRIBUTION NETWORK DEFICIENCIES
The Touws River distribution network has shown to be adequate under both steady-state and contingency conditions.
7.3.3.4 TOUWS RIVER PROJECTS
7.3.3.4.1 General Network Development and Strengthening
The following projects are required on the Touws River network.
2009: Steenvliedt – Skool straat 11kV Feeder, and
2010: Crescent – Industrial 11kV Feeder.
0
500
1000
1500
2000
2500
3000
3500
4000
4500
kW
1 2 3 4 5 6 7 8 9 10 11 12 13 14 15 16 17 18 19 20 21Year
Touwsrivier
Breede Valley Local Municipality IDP 2007 - 2012
121
7.4 CAPITAL AND FINANCIAL EVALUATION
7.4.1 BACKGROUND
One of the main criteria in evaluating system alternatives is the extent of capital outlay. Not only must the solutions to network problems be technically viable, but they must also be financially sound. The capital and financial analysis conducted on the Breede Valley network aims to set-up a Short- and Long-term capital program which offers Breede Valley Local Municipality an acceptable return on investment. The following aspects apply:
In order to perform a financial analysis, a basic capital program is compiled containing capital requirements for each proposed project ,
Financial analysis tests the viability of the capital expenditure in terms of:
The impact on future cash flows,
Net present worth of the investments, and
The Internal Rate of Return (IRR).
The financial analysis should ensure that the envisaged capital expenditure program is affordable to Breede Valley Local Municipality.
7.4.2 COSTING OF CAPITAL PROJECTS
Capital projects were identified through analysis and assessment of the following aspects:
Expansion requirements, and
Network security requirements.
The costing of capital projects were done by using standard equipment cost, contained in an equipment library. The output from the various evaluation systems was used to set-up three capital program scenarios.
These scenarios evaluate:
The Most Likely capital expenditure,
A scenario where the Minimum Investment on infrastructure is simulated (low road), and
A scenario where the area experiences high growth, which in return requires the fast-track of infrastructure development (High Road).
These scenarios are shown in the figures below: (the CAPEX covers Worcester, De Doorns and Touws River)

Breede Valley Local Municipality IDP 2007 - 2012
122
FIGURE 55: MINIMUM INVESTMENT CAPITAL FORECAST
FIGURE 56: HIGH INVESTMENT CAPITAL FORECAST
0
2
4
6
8
10
12
14
16
18
Millions
2006 2007 2008 2009 2010 2011 2012 2015 2018 2020 2024Year
Total Investment by 2010= R 30,643,000
0
5
10
15
20
25
Millions
2006 2007 2008 2010 2012 2015Year
Total Investment by 2010= R 64,998,000

Breede Valley Local Municipality IDP 2007 - 2012
123
7.4.3 LINKING WITH LOAD FORECAST MODEL
The load forecast model developed during this study provides vital input for the financial evaluation. Per unit purchase and selling rates are calculated and extrapolated according to the load growth of the study area. The load zones and their corresponding load parameters as defined in the Load Forecast model are used to calculate expected energy consumption and subsequent revenue.
7.4.4 FINANCIAL PARAMETERS
The financial parameters used for the financial analysis are shown below. Average purchase and selling rates where determined from account information.
TABLE 9: FINANCIAL PARAMETERS
PARAMETER SHORT TERM
LONG TERM
Escalation rate (%) 6.0% 8.0%
Interest rate on capital (Discount Rate) (%)
10% 10%
% Distribution Losses 7% 7%
% Operating and Maintenance Cost 5% 5%
Average PF 0.7 0.7
System Load Factor 0.65 0.65
Purchase Rate c/kWh 13 15
Selling Rate c/kWh 26 30
% Non payment 5% 5%
7.4.4.1 ESCALATION RATE
The escalation rate has been chosen as 6% that is comparable to the current inflation rate. This parameter is highly dependent on economic prosperity and the South African exchange rate to stronger currencies.
7.4.4.2 INTEREST RATE
This parameter has been fixed at the current interest rate but in real terms is dependent on economic factors.
7.4.4.3 % LOSSES
Losses for Distribution have been set at 7%. This value is representative of similar networks and can be modified should better information become available.
Breede Valley Local Municipality IDP 2007 - 2012
124
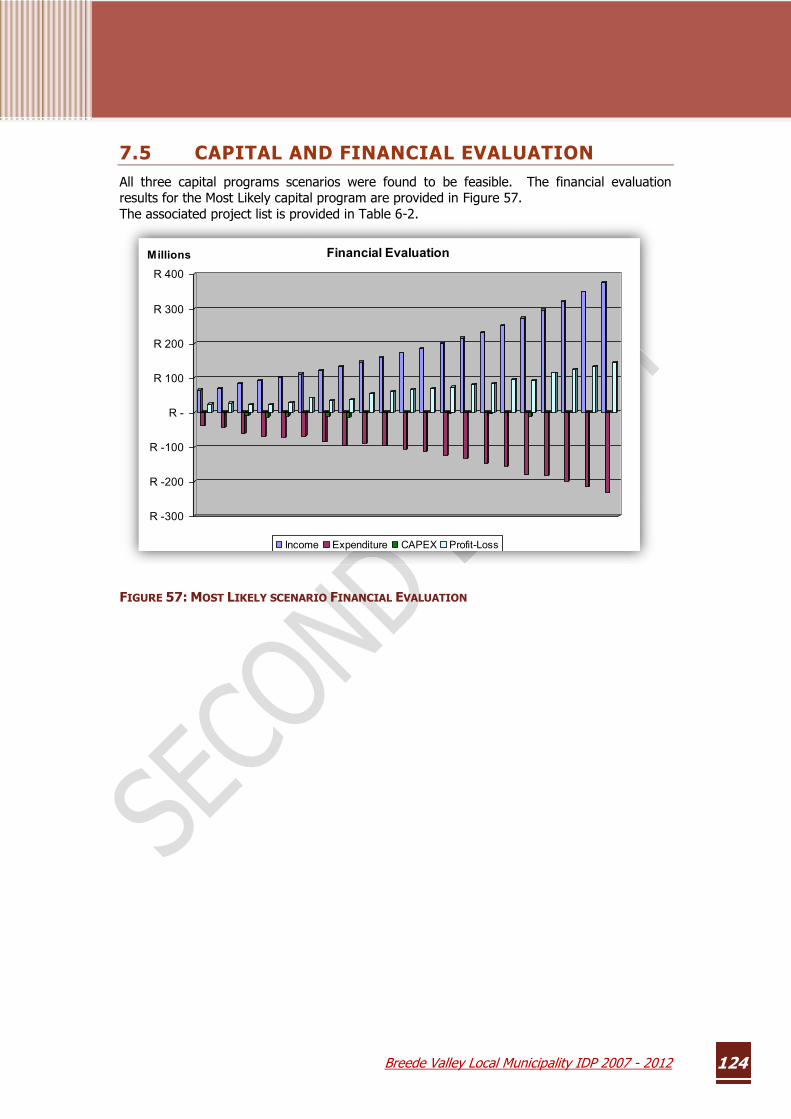
7.5 CAPITAL AND FINANCIAL EVALUATION All three capital programs scenarios were found to be feasible. The financial evaluation results for the Most Likely capital program are provided in Figure 57. The associated project list is provided in Table 6-2.
FIGURE 57: MOST LIKELY SCENARIO FINANCIAL EVALUATION
j
R -300
R -200
R -100
R -
R 100
R 200
R 300
R 400
Millions Financial Evaluation
Income Expenditure CAPEX Profit-Loss

Bree
de V
alle
y Lo
cal M
unic
ipal
ity I
DP
2007
-20
12
12
5
TAB
LE 1
0: M
OST
LIK
ELY
PR
OJE
CT
LIST
AN
D C
OST
ING
Y
ea
rL
oa
d C
en
tre
Typ
eP
roje
ct
Nam
eP
roje
ct
descri
pti
on
Pro
ject
Co
st
20
06
Wo
rce
ste
rE
xpa
nsi
on
Fie
ld 1
1kV
Su
bst
atio
nA
dd
1 x
11
kV C
B p
an
el,
mo
ve C
ab
le.
18
6,3
40
.00
R
20
06
Wo
rce
ste
rE
xpa
nsi
on
Ru
sse
ll -
Wo
rce
ste
r D
am
66
kV F
ee
de
rA
dd
2 x
3.5
km, 3
00
mm
² 1
C C
u X
LP
E 6
6kV
Ca
ble
s.-
R
20
06
Wo
rce
ste
rE
xpa
nsi
on
Ru
sse
ll S
ub
sta
tion
2 x
66
kV F
ee
de
r B
ays
an
d B
usb
ar
Ext
en
sio
n.
2,7
40
,24
9.7
7R
20
06
Wo
rce
ste
rE
xpa
nsi
on
Wo
rce
ste
r D
am
Dis
trib
utio
nN
ew
Dis
trib
utio
n N
etw
ork
De
velo
pm
en
t -
Wo
rce
ste
r D
am
.-
R
20
06
Wo
rce
ste
rE
xpa
nsi
on
Zw
ele
the
mb
a -
T3
7 1
1kV
Fe
ed
er
Ad
d 1
x 1
1kV
CB
pa
ne
l, a
dd
2.0
km 3
5A
BC
OH
11
kV A
l Lin
e a
nd
1 x
31
5kV
A M
/S9
67
,84
0.0
0R
20
07
Wo
rce
ste
rE
xpa
nsi
on
Ea
gle
- D
e k
op
pe
n T
11
kV F
ee
de
rA
dd
0.4
km 7
0m
m²
Cu
XL
PE
11
kV C
ab
le.
16
0,0
00
.00
R
20
07
Wo
rce
ste
rE
xpa
nsi
on
Ind
ust
ria
l - R
oo
de
wa
l 11
kV F
ee
de
rA
dd
2.2
km 2
40
mm
² C
u X
LP
E 1
1kV
Ca
ble
.1
,26
2,8
00
.00
R
20
07
Wo
rce
ste
rE
xpa
nsi
on
Ne
w C
asi
no
Su
bst
atio
n a
nd
11
kV In
com
ers
Ne
w 1
1kV
Su
bst
atio
n a
nd
9 x
11
kV C
B p
an
els
.-
R
20
07
Wo
rce
ste
rE
xpa
nsi
on
Ro
od
ew
al 1
1kV
Su
bst
atio
nA
dd
2 x
11
kV C
B p
an
els
at R
oo
de
wa
l Su
bst
atio
n.
48
0,6
80
.00
R
20
07
Wo
rce
ste
rE
xpa
nsi
on
Ru
sse
ll -
Ro
od
ew
al 1
1kV
Fe
ed
er
Ad
d 1
.8km
24
0m
m²
Cu
XL
PE
11
kV C
ab
le.
1,0
33
,20
0.0
0R
20
07
Wo
rce
ste
rE
xpa
nsi
on
SA
D 1
- K
WV
2 1
1kV
Fe
ed
er
Up
gra
de
0.7
7km
to
18
5m
m²
Al X
LP
E 1
1kV
Ca
ble
. 3
44
,19
0.0
0R
20
07
Wo
rce
ste
rE
xpa
nsi
on
So
me
rse
t -
De
We
t 1
1kV
Fe
ed
er
Ad
d 1
.5km
24
0m
m²
Cu
XL
PE
11
kV C
ab
le.
86
1,0
00
.00
R
20
07
Wo
rce
ste
rE
xpa
nsi
on
Wo
rce
ste
r D
am
- M
on
ta V
ista
11
kV F
ee
de
rA
dd
2 x
0.5
5km
24
0m
m²
Cu
XL
PE
11
kV C
ab
les.
63
1,4
00
.00
R
20
07
Wo
rce
ste
rE
xpa
nsi
on
Wo
rce
ste
r D
am
Su
bst
atio
nN
ew
11
kV S
ubst
atio
n a
nd 1
3 x
11kV
CB
panels
.-
R
20
08
Wo
rce
ste
rC
on
ting
en
cyM
c A
llist
er
- F
ield
via
GR
W 1
1kV
Fe
ed
er
Up
gra
de
1.4
8km
to
18
5m
m²
Cu
XL
PE
11
kV C
ab
le.
77
8,4
80
.00
R
20
08
Wo
rce
ste
rC
on
ting
en
cyM
c A
llist
er
- F
ield
via
N Y
ard
11
kV F
ee
de
rU
pg
rad
e 1
.84
km to
18
5m
m²
Cu
XL
PE
11
kV C
ab
le.
96
7,8
40
.00
R
20
08
Wo
rce
ste
rE
xpa
nsi
on
Ru
sse
ll -
Sa
nta
m 1
1kV
Fe
ed
er
Up
gra
de
1.0
5km
to 2
40m
m²
Cu X
LP
E 1
1kV
Cable
. 598,1
08.0
0R
20
08
Wo
rce
ste
rC
on
ting
en
cyS
mith
- E
sco
m 1
1kV
Fe
ed
er
Up
gra
de 1
.1km
to 1
85m
m²
Al
XLP
E 1
1kV
Cable
.491,7
00.0
0R
20
08
Wo
rce
ste
rE
xpa
nsi
on
T 1
8 -
T 2
0 1
1kV
Fe
ed
er
Ad
d 0
.2km
35
mm
OH
11
kV L
ine
.6
0,0
00
.00
R
20
08
Wo
rce
ste
rE
xpa
nsi
on
Vill
iers
Do
rp R
oa
d -
Bo
lan
d C
olle
ge
11
kV F
ee
Add 1
.5km
185m
m²
Cu X
LP
E 1
1kV
Cable
.789,0
00.0
0R
20
08
Wo
rce
ste
rE
xpa
nsi
on
Vill
iers
Do
rp R
oa
d S
ub
sta
tion
Ne
w 1
1kV
Su
bst
atio
n a
nd
8 x
11
kV C
B p
an
els
.2
,78
7,0
60
.00
R
20
08
Wo
rce
ste
rE
xpa
nsi
on
Wo
rce
ste
r D
am
HV
Su
bst
atio
nN
ew
66
/11
kV, 2
x 2
0M
VA
Su
bst
atio
n.
-R
20
08
Wo
rce
ste
rE
xpa
nsi
on
Zw
elt
T1
8 -
T3
4 1
1kV
Fe
ed
er
Ad
d 1
.1km
35
AB
C O
H 1
1kV
Al L
ine
an
d 1
x 3
15
kVA
M/S
.5
11
,50
0.0
0R
20
09
Wo
rce
ste
rE
xpa
nsi
on
Ca
sin
o -
Go
lf E
sta
te 1
1kV
Fe
ed
er
Ad
d 1
.1km
18
5m
m²
Cu
XL
PE
11
kV C
ab
le.
57
8,6
00
.00
R
20
09
Wo
rce
ste
rC
on
ting
en
cyE
sco
m -
Mc
Alli
ste
r 1
1kV
Fe
ed
er
Up
gra
de
0.6
7km
to
18
5m
m²
Al
XL
PE
11
kV C
ab
le.
29
9,4
90
.00
R
20
09
Wo
rce
ste
rE
xpa
nsi
on
So
me
rse
t -
Vill
iers
Do
rp R
oa
d 1
1kV
Fe
ed
er
Ad
d 1
.25
km 2
40
mm
² C
u X
LP
E 1
1kV
Ca
ble
.7
17
,50
0.0
0R
20
09
Wo
rce
ste
rE
xpa
nsi
on
Vill
iers
Do
rp R
oa
d -
Alb
etr
os
11
kV F
ee
de
rA
dd
0.7
4km
18
5m
m²
Cu
XL
PE
11
kV C
ab
le.
38
9,2
40
.00
R
20
09
Wo
rce
ste
rE
xpa
nsi
on
Vill
iers
Do
rp R
oa
d -
J 5
02
5 1
1kV
Fe
ed
er
Ad
d 0
.76
km 1
85
mm
² C
u X
LP
E 1
1kV
Ca
ble
.3
99
,76
0.0
0R
20
09
Wo
rce
ste
rE
xpa
nsi
on
Wo
rce
ste
r D
am
- S
pri
ng
bo
k T
11
kV F
ee
de
rA
dd
0.7
8km
24
0m
m²
Cu
XL
PE
11
kV C
ab
le.
44
7,7
20
.00
R
20
10
Wo
rce
ste
rE
xpa
nsi
on
Klu
e -
Ro
ux
11
kV F
ee
de
rA
dd 0
.69km
240m
m²
Cu X
LP
E 1
1kV
Cable
.396,0
60.0
0R
20
10
Wo
rce
ste
rE
xpa
nsi
on
Mc
Alli
ste
r -
Pro
tea
via
RM
U 1
1kV
Fe
ed
er
Up
gra
de
1.8
5km
to
24
0m
m²
Cu
XL
PE
11
kV C
ab
le.
1,0
59
,03
0.0
0R
20
10
Wo
rce
ste
rE
xpa
nsi
on
Ne
w S
om
ers
et S
ub
sta
tion
Ne
w 6
6/1
1kV
, 2
x 2
0M
VA
Su
bst
atio
n a
nd
11
x 1
1kV
CB
pa
ne
ls.
11
,72
0,1
22
.27
R
20
10
Wo
rce
ste
rE
xpa
nsi
on
Pro
tea
Su
bst
atio
nA
dd
5 x
11
kV C
B p
an
els
at P
rote
a S
ub
sta
tion
.1
,03
9,7
00
.00
R
20
10
Wo
rce
ste
rE
xpa
nsi
on
Ro
se G
ard
en
s S
ub
sta
tion
Ne
w 1
1kV
Su
bst
atio
n a
nd
10
x 1
1kV
CB
pa
ne
ls.
2,9
73
,40
0.0
0R
20
10
Wo
rce
ste
rE
xpa
nsi
on
Ro
ux
- R
ose
Ga
rde
ns
11
kV F
ee
de
rA
dd
0.5
8km
240m
m²
Cu X
LP
E 1
1kV
Cable
.332,9
20.0
0R
20
10
Wo
rce
ste
rE
xpa
nsi
on
Ro
ux
Su
bst
atio
nN
ew
11
kV S
ub
sta
tion
an
d 9
x 1
1kV
CB
pa
ne
ls.
2,7
87
,06
0.0
0R
20
10
Wo
rce
ste
rE
xpa
nsi
on
So
me
rse
t S
ub
sta
tion
Ad
d 2
x 1
1kV
CB
pa
ne
ls a
t S
om
ers
et S
ub
sta
tion
s a
nd
0.4
km 2
40
mm
² C
u X
LP
E 1
1kV
C7
10
,28
0.0
0R
20
10
Wo
rce
ste
rE
xpa
nsi
on
T P
oin
t -
So
me
rse
t 6
6kV
Fe
ed
er
Ad
d 2
x 1
.5km
, 3
00
mm
² 1
C C
u X
LP
E 6
6kV
Ca
ble
s.6
,00
0,0
00
.00
R
20
10
Wo
rce
ste
rE
xpa
nsi
on
Wo
rce
ste
r D
am
- K
lue
11
kV F
ee
de
rA
dd
2.0
5km
24
0m
m²
Cu
XL
PE
11
kV C
ab
le.
1,1
76
,70
0.0
0R
20
11
Wo
rce
ste
rE
xpa
nsi
on
Ind
ust
ria
l De
velo
pm
en
tA
dd
2 x
11
kV C
B p
an
els
at In
du
stria
l Su
bst
atio
n, a
dd
3.5
km 2
40
mm
² C
u X
LP
E 1
1kV
Ca
3,4
07
,68
0.0
0R
20
11
Wo
rce
ste
rE
xpa
nsi
on
Ne
w S
om
ers
et S
ub
sta
tion
Dis
trib
utio
nN
ew
Dis
trib
utio
n N
etw
ork
De
velo
pm
en
t -
So
me
rse
t.2
,78
8,3
82
.00
R
20
15
Wo
rce
ste
rE
xpa
nsi
on
VC
- A
RU
M 1
1kV
Fe
ed
er
Ad
d 1
.2km
18
5m
m²
Cu
XL
PE
11
kV C
ab
le a
nd
3 x
31
5kV
A M
/S.
1,1
75
,70
0.0
0R
20
15
Wo
rce
ste
rE
xpa
nsi
on
WD
Ho
use
- R
Vill
ag
e 1
1kV
Fe
ed
er
Ad
d 1
.6km
18
5m
m²
Cu
XL
PE
11
kV C
ab
le a
nd
3 x
31
5kV
A M
/S.
1,3
86
,10
0.0
0R
20
20
Wo
rce
ste
rC
on
ting
en
cyM
c A
llist
er
- A
PL
C 1
1kV
Fe
ed
er
Ad
d 1
x 1
1kV
CB
pa
ne
l at M
c A
llist
er
an
d 0
.54
km 2
40
mm
² C
u X
LP
E 1
1kV
Ca
ble
.4
96
,30
0.0
0R
20
20
Wo
rce
ste
rE
xpa
nsi
on
Ro
od
ew
al -
Tra
ns
He
x 1
1kV
Fe
ed
er
Ad
d 2
.1km
24
0m
m²
Cu
XL
PE
11
kV C
ab
le.
1,2
05
,40
0.0
0R
20
20
Wo
rce
ste
rE
xpa
nsi
on
Tra
ns
He
x -
Zw
ele
the
mb
a 1
1kV
Fe
ed
er
Ad
d 2
.6km
24
0m
m²
Cu
XL
PE
11
kV C
ab
le.
1,4
92
,40
0.0
0R
20
20
Wo
rce
ste
rE
xpa
nsi
on
Tra
ns
He
x S
ub
sta
tion
Ne
w 1
1kV
Su
bst
atio
n a
nd
9 x
11
kV C
B p
an
els
.2
,57
1,0
60
.00
R
20
09
To
uw
s R
ive
rE
xpa
nsi
on
Ste
en
vlie
dt -
Sko
ol s
tra
at 1
1kV
Fe
ed
er
Ad
d 0
.43
km 3
5A
BC
OH
11
kV A
l Lin
e.
12
9,0
00
.00
R
20
10
To
uw
s R
ive
rE
xpa
nsi
on
Cre
sce
nt -
Ind
ust
ria
l 11
kV F
ee
de
rA
dd
2.0
km 3
5A
BC
OH
11
kV A
l Lin
e a
nd
2 x
31
5kV
A M
/S.
96
3,0
00
.00
R
20
06
De
Do
orn
sE
xpa
nsi
on
De
Do
orn
s -
CP
11
11
kV F
ee
de
rA
dd
1 x
11
kV C
B p
an
el a
t D
e D
oo
rns
Su
bst
atio
n, a
dd
1 x
1.6
km 9
5m
m²
Cu X
LP
E 1
1kV
1
,48
4,4
40
.00
R
20
06
De
Do
orn
sE
xpa
nsi
on
Esk
om
- R
um
osa
11
kV F
ee
de
rA
dd
2 x
11
kV C
B p
an
els
at E
sko
m a
nd
Ru
mo
sa S
ub
sta
tion
s, a
dd
2 x
2.5
km 9
5m
m²
Cu
X3
,20
8,3
60
.00
R

Breede Valley Local Municipality IDP 2007 - 2012 126
7.6 CONCLUSIONS AND RECOMMENDATIONS All network projects were evaluated considering expansion due to anticipated load growth and network performance improvement.
The evaluation of the existing and future networks assumed specific network improvements that were performed through standard engineering practice. Network studies were performed for distinct system loads, developed from the geographical load forecast.
The time frames and load representation were for:
Base year (2004),
Short-term (2005, 2006 and 2007), and
Longer-term (2009, 2010, 2011, 2014, 2019 and 2024).
7.6.1 NETWORK EXPANSION RECOMMENDATIONS
The study has identified and documented expansion and strengthening projects to ensure the adequate performance of the network within the Short- and Longer-term. These projects are documented in Section 5, and are shown geographically in Volume B of the main report. It is recommended that these projects be implemented in the phased manner as indicated in the project list.
The following sections provide an objective view of the priority of each project, should project funding be of concern.
7.6.1.1 PRIORITY PROJECTS
Priority projects are defined as projects, if not developed, will lead to the deterioration of the network.
Projects under this category are shown in Table 11.
TABLE 11: PRIORITY PROJECTS
Project Name Description
Field 11kV Substation Add 1 x 11kV CB panel, move Cable.
Eagle – De koppen T 11kV Feeder Add 0.4km 70mm² Cu XLPE 11kV Cable.
Industrial - Roodewal 11kV Feeder Add 2.2km 240mm² Cu XLPE 11kV Cable.
Roodewal 11kV Substation Add 2 x 11kV CB panels at Roodewal Substation.
Russell - Roodewal 11kV Feeder Add 1.8km 240mm² Cu XLPE 11kV Cable.
SAD 1 - KWV 2 11kV Feeder Upgrade 0.77km to 185mm² Al XLPE 11kV Cable.
Worcester Dam - Monta Vista 11kV Feeder
Add 2 x 0.55km 240mm² Cu XLPE 11kV Cables.
Russell - Santam 11kV Feeder Upgrade 1.05km to 240mm² Cu XLPE 11kV Cable.
Klue - Roux 11kV Feeder Add 0.69km 240mm² Cu XLPE 11kV Cable.
Mc Allister - Protea via RMU 11kV Feeder
Upgrade 1.85km to 240mm² Cu XLPE 11kV Cable.
Breede Valley Local Municipality IDP 2007 - 2012 127
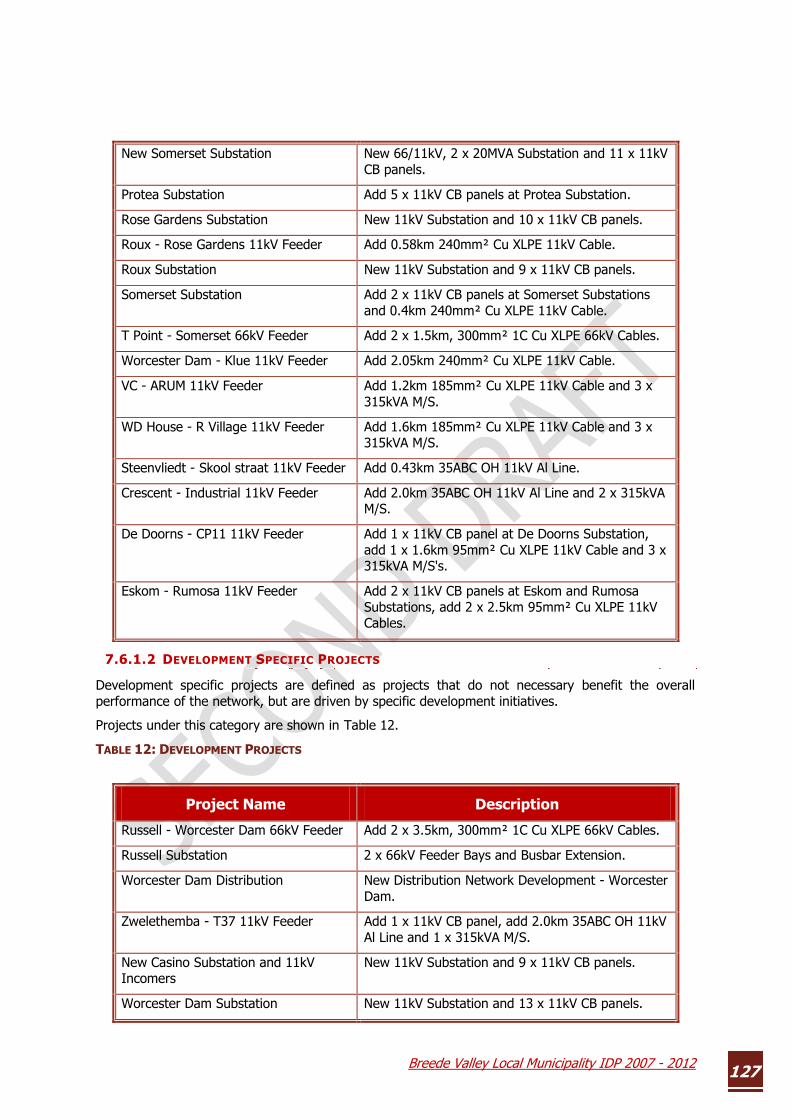
7.6.1.2 DEVELOPMENT SPECIFIC PROJECTS
Development specific projects are defined as projects that do not necessary benefit the overall performance of the network, but are driven by specific development initiatives.
Projects under this category are shown in Table 12.
TABLE 12: DEVELOPMENT PROJECTS
New Somerset Substation New 66/11kV, 2 x 20MVA Substation and 11 x 11kV CB panels.
Protea Substation Add 5 x 11kV CB panels at Protea Substation.
Rose Gardens Substation New 11kV Substation and 10 x 11kV CB panels.
Roux - Rose Gardens 11kV Feeder Add 0.58km 240mm² Cu XLPE 11kV Cable.
Roux Substation New 11kV Substation and 9 x 11kV CB panels.
Somerset Substation Add 2 x 11kV CB panels at Somerset Substations and 0.4km 240mm² Cu XLPE 11kV Cable.
T Point - Somerset 66kV Feeder Add 2 x 1.5km, 300mm² 1C Cu XLPE 66kV Cables.
Worcester Dam - Klue 11kV Feeder Add 2.05km 240mm² Cu XLPE 11kV Cable.
VC - ARUM 11kV Feeder Add 1.2km 185mm² Cu XLPE 11kV Cable and 3 x 315kVA M/S.
WD House - R Village 11kV Feeder Add 1.6km 185mm² Cu XLPE 11kV Cable and 3 x 315kVA M/S.
Steenvliedt - Skool straat 11kV Feeder Add 0.43km 35ABC OH 11kV Al Line.
Crescent - Industrial 11kV Feeder Add 2.0km 35ABC OH 11kV Al Line and 2 x 315kVA M/S.
De Doorns - CP11 11kV Feeder Add 1 x 11kV CB panel at De Doorns Substation, add 1 x 1.6km 95mm² Cu XLPE 11kV Cable and 3 x 315kVA M/S's.
Eskom - Rumosa 11kV Feeder Add 2 x 11kV CB panels at Eskom and Rumosa Substations, add 2 x 2.5km 95mm² Cu XLPE 11kV Cables.
Project Name Description
Russell - Worcester Dam 66kV Feeder Add 2 x 3.5km, 300mm² 1C Cu XLPE 66kV Cables.
Russell Substation 2 x 66kV Feeder Bays and Busbar Extension.
Worcester Dam Distribution New Distribution Network Development - Worcester Dam.
Zwelethemba - T37 11kV Feeder Add 1 x 11kV CB panel, add 2.0km 35ABC OH 11kV Al Line and 1 x 315kVA M/S.
New Casino Substation and 11kV Incomers
New 11kV Substation and 9 x 11kV CB panels.
Worcester Dam Substation New 11kV Substation and 13 x 11kV CB panels.

Breede Valley Local Municipality IDP 2007 - 2012 128
7.6.1.3 CONTINGENCY PROJECTS
Contingency related projects are defined as those strengthening projects that do benefit the steady-state operation of the distribution network but provide back-up to specific areas of the network during contingency conditions.
Projects under this category are shown in Table 13.
TABLE 13: CONTINGENCY PROJECTS
T 18 - T 20 11kV Feeder Add 0.2km 35mm OH 11kV Line.
Villiers Dorp Road - Boland College 11kV Feeder
Add 1.5km 185mm² Cu XLPE 11kV Cable.
Villiers Dorp Road Substation New 11kV Substation and 8 x 11kV CB panels.
Worcester Dam HV Substation New 66/11kV, 2 x 20MVA Substation.
Zwelt T18 - T34 11kV Feeder Add 1.1km 35ABC OH 11kV Al Line and 1 x 315kVA M/S.
Casino - Golf Estate 11kV Feeder Add 1.1km 185mm² Cu XLPE 11kV Cable.
Somerset - Villiers Dorp Road 11kV Feeder
Add 1.25km 240mm² Cu XLPE 11kV Cable.
Villiers Dorp Road - Albetros 11kV Feeder
Add 0.74km 185mm² Cu XLPE 11kV Cable.
Villiers Dorp Road - J 5025 11kV Feeder
Add 0.76km 185mm² Cu XLPE 11kV Cable.
Worcester Dam - Springbok T 11kV Feeder
Add 0.78km 240mm² Cu XLPE 11kV Cable.
Industrial Development Add 2 x 11kV CB panels at Industrial Substation, add 3.5km 240mm² Cu XLPE 11kV Cable and 4 x 315kVA M/S.
New Somerset Substation Distribution New Distribution Network Development - Somerset.
Roodewal - Trans Hex 11kV Feeder Add 2.1km 240mm² Cu XLPE 11kV Cable.
Trans Hex - Zwelethemba 11kV Feeder
Add 2.6km 240mm² Cu XLPE 11kV Cable.
Trans Hex Substation New 11kV Substation and 9 x 11kV CB panels.
Project Name Description
Somerset - De Wet 11kV Feeder Add 1.5km 240mm² Cu XLPE 11kV Cable
Mc Allister - Field via N Yard 11kV Feeder
Upgrade 1.84km to 185mm² Cu XLPE 11kV Cable
Mc Allister - Field via GRW 11kV Feeder
Upgrade 1.48km to 185mm² Cu XLPE 11kV Cable
Smith - Escom 11kV Feeder Upgrade 1.1km to 185mm² Al XLPE 11kV Cable.
Escom - Mc Allister 11kV Feeder Upgrade 0.67km to 185mm² Al XLPE 11kV Cable.

Breede Valley Local Municipality IDP 2007 - 2012 129
The above project scenarios and priorities were used as basis to develop the three capital program scenarios.
These scenarios are:
The Most Likely capital expenditure,
A scenario where the Minimum Investment on infrastructure is simulated (Low Road), and
A scenario where the area experiences high growth, which in return requires the fast-track of infrastructure development (High Road).
Mc Allister - APLC 11kV Feeder Add 1 x 11kV CB panel at Mc Allister and 0.54km 240mm² Cu XLPE 11kV Cable


