98
Decarbonization and Montana— Insights from the Northwest Deep Decarbonization Pathways Study Prepared For: Montana Climate Solutions Council July 28, 2020
Decarbonization and Montana—Insights from the Northwest Deep Decarbonization Pathways Study
Prepared For:Montana Climate Solutions Council
July 28, 2020

How to Use this Report and Information
page 2
• At the request of the Montana Department of Environmental Quality, the Clean Energy Transition Institute and Evolved Energy Research have provided this summary of analysis relevant to Montana from the Institute’s June 2019 report: Meeting the Challenge of Our Time: Pathways to a Clean Energy Future for the Northwest, which describes the results of the Northwest Deep Decarbonization Pathways Study (NWDDP) conducted in the winter 2018.
• Data specific to Montana is shared here to help members of the public understand some of the emissions reductions pathways and tradeoffs facing Montana, as well as the ways in which Montana’s energy system and unique assets may be able to serve regional needs in the future.
• Caution should be used in interpreting and applying the specific results presented here. As the Montana Climate Solutions Council report highlights, there is a need for a stakeholder process to support future study and investigation that tailors assumptions to Montana’s specific state objectives and context, and more fully considers the implications of proposed projects, policies, and the timing of resource retirements.

Contents
page 3
• Background
• The Demand Side‒ Final energy demand‒ Electrification assumptions
• The Supply Side‒ Electricity sector‒ Fuels supply
• Summary‒ Key results and takeaways
• Planning Framework for Decarbonization‒ Designing a state driven process to achieve climate goals most effectively
• Planning Process‒ Steps to follow through a stakeholder process
• Appendices‒ A: NWDDP Scenario Definitions‒ B: Model Overview

Executive Summary -1-
page 4
• To meet future energy needs at least cost, the study finds that decarbonization can be achieved through a combination of five key strategies (energy efficiency, decarbonized electricity, decarbonized fuels, electrification, and carbon capture) along with the continued use of very limited natural gas resources to address peaking capacity needs.
• The study finds that Montana utilizes its geographic strengths on the supply side to meet these shifting demands across the NW region: ‒ A large wind sector is established, supplying clean energy to Montana and surrounding
regions‒ Carbon is sequestered in saline aquifers in the production of liquid fuels from biomass,
offsetting emissions from other sources‒ Policy actions taken in the rest of the West could impact Montana’s investments in
significant ways, with opportunities to play a major export role in a decarbonized Western system
• The NWDDP assumptions drive decreased total energy demand as a result of efficiency gains, much of which comes from electrification in transportation and buildings. As a result, electricity demand grows by approximately 70%.

Executive Summary -2-
page 5
• Decarbonization costs are 1 to 1.5% of Montana GDP in the NWDDP using 2018 technology price forecasts, though likely a net benefit to the state when factoring in externalities.
‒ Fossil fuel and electric vehicle price uncertainties have a major impact on total costs. Price declines in electric vehicle forecasts since 2018 may make decarbonization a net benefit to the state before factoring in externalities
• Stakeholder-driven, energy system planning specific to Montana can help further determine investments necessary to minimize total cost of achieving targets for different future scenarios and can inform subsequent policy analysis of how best to achieve those investments and allocate costs.
• Background on a modeling approach for the state is included to inform next steps.

Background
page 6

• The following report shows Montana-specific results generated from analysis done for the Northwest Deep Decarbonization Pathways Study (NWDDP) released in June 2019
• Results include:‒ The demand side transformation – what types of investments were assumed across energy-
consuming sectors of the economy over the next 30 years?‒ Supply side optimization – how best can we serve the energy needs of the economy while
adhering to limits on total emissions?‒ Summary of high-level findings – what do they mean for Montana?‒ Caveats to the results – what has changed since this study took place?
• The report concludes with a high-level approach to studying Montana’s specific decarbonization needs, incorporating the interests of stakeholders in the state
Introduction
page 7
Supporting Montana: Summarizing Pathways Analysis for Future Decarbonization

• The Northwest Deep Decarbonization Pathways (NW DDP) analysis was conducted using state-level granularity to determine least-cost pathways
• The study released in June 2019 summarized results for the region, including Idaho, Montana, Oregon, and Washington
• This report presents results and insights specific to the state of Montana‒ The exception is the electricity sector, where operations and planning are already
integrated regionally, and investments in resources benefit multiple states‒ We show resource decisions in Montana as part of the larger regional system
• Our analytical approach, assumptions and scenario design are not described in this document since they are extensively detailed in our technical reportand do not vary by state
Analytical Context
page 8
Historical Montana Energy-Related CO2 Emissions
page 9
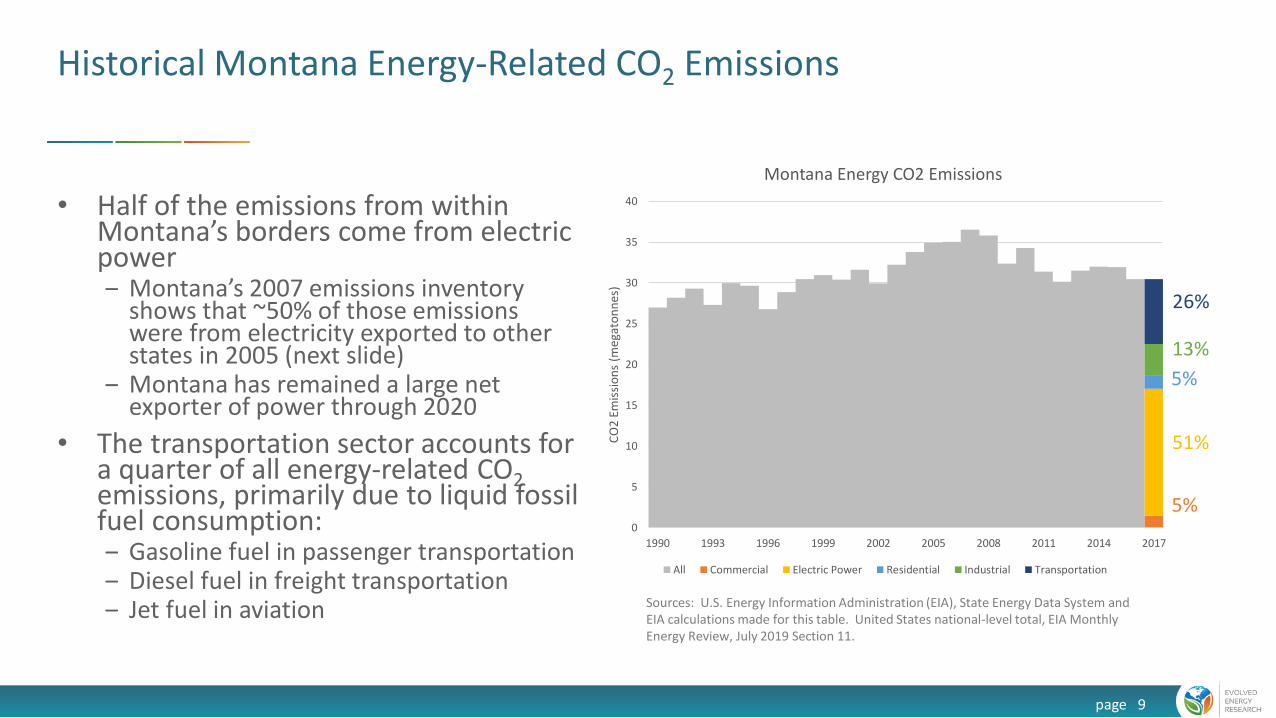
• Half of the emissions from within Montana’s borders come from electric power‒ Montana’s 2007 emissions inventory
shows that ~50% of those emissions were from electricity exported to other states in 2005 (next slide)
‒ Montana has remained a large net exporter of power through 2020
• The transportation sector accounts for a quarter of all energy-related CO2emissions, primarily due to liquid fossil fuel consumption:‒ Gasoline fuel in passenger transportation‒ Diesel fuel in freight transportation‒ Jet fuel in aviation
0
5
10
15
20
25
30
35
40
1990 1993 1996 1999 2002 2005 2008 2011 2014 2017
CO
2 Em
issi
on
s (m
egat
on
nes
)
Montana Energy CO2 Emissions
All Commercial Electric Power Residential Industrial Transportation
26%
13%
5%
51%
5%
Sources: U.S. Energy Information Administration (EIA), State Energy Data System and EIA calculations made for this table. United States national-level total, EIA Monthly Energy Review, July 2019 Section 11.

Montana GHG Inventory
page 10
• Net emissions from exports to other states, Montana emitted 19.2 MMT CO2 from energy in 1990
• 12.9 MMT came from non-energy sources
• While there is a clear technological path to reducing energy-related emissions, measures for non-energy emissions reductions are less well developed
Table ES-1. Montana Historical and Reference Case GHG Emissions, Consumption-based, by SectorHistoric Projection
Million Metric Tons CO2e 1990 2000 2005 2010 2020
Electric Sector 8.9 9.5 10 10 11Coal 15.8 16.2 18.5 20.2 22.5Natural Gas 0 0 0 0.4 0.4Petroleum Coke 0 0.8 0.8 0.8 0.8Net Exported Electricity -7 -7.6 -9.4 -11.3 -12.8
Res/Comm/Non-Fossil Ind (RCI) 4.5 4.5 4.8 5.2 5.3Coal 0.5 0.3 0.3 0.3 0.3Natural Gas 2.1 3.1 2.9 3.2 3.3Oil 1.9 1.1 1.6 1.7 1.7Wood (CH4 and N2O) 0 0 0 0 0
Transportation 5.9 7.3 8 8.8 10.4Motor Gasoline 3.8 4.4 4.4 4.8 5.7Dieselb 1.7 2.5 3.1 3.4 3.9Natural Gas, LPG, other 0.1 0.1 0.1 0.1 0.1Jet Fuel, Aviation Gasoline 0.3 0.3 0.5 0.5 0.6
Fossil Fuel Industry 3.5 4.1 5 5.2 5.3Natural Gas Industry 1.4 1.7 2 2.3 2.4Oil Industry 2 2.2 2.7 2.8 2.8Coal Mining (Methane) 0.2 0.2 0.2 0.2 0.2Coal to Liquids
Industrial Processes 1.2 1 0.9 1.1 1.5ODS Substitutes 0 0.2 0.4 0.5 0.9SF6 from Electric Utilities 0.1 0.1 0 0 0Cement & Other Industry 0.4 0.4 0.5 0.5 0.5Aluminum Industry 0.7 0.3 0.1 0.1 0.1
Waste Management 0.2 0.2 0.3 0.3 0.4Solid Waste Management 0.1 0.2 0.2 0.2 0.2Wastewater Management 0.1 0.1 0.1 0.1 0.1
Agriculture 7.9 9.5 7.9 7.9 7.9Livestock Management 3.2 3.7 3.6 3.6 3.6Ag. Soils and Residue Burning 4.7 5.8 4.2 4.2 4.2
Total Gross Emissions 32.2 36.1 36.8 38.5 41.7
Forestry and Land Use -23.1 -23.1 -23.1 -23.1 -23.1Agricultural Soils Sink -2.3 -2.3 -2.3 -2.3 -2.3Net Emissions (including sinks) 6.8 10.7 11.4 13.1 16.3
Energy-related CO2 emissions 19.2 21.2 22.8 24.1 26.5Non-energy GHG emissions 12.9 14.9 14 14.5 15
Total Gross emissions 32.1 36.1 36.8 38.6 41.5
Source: Montana Greenhouse Gas Inventory and Reference Case Projections 1990-2020. Center for Climate Strategies. September 2007
NWDDP Deep Decarbonization Target
page 11
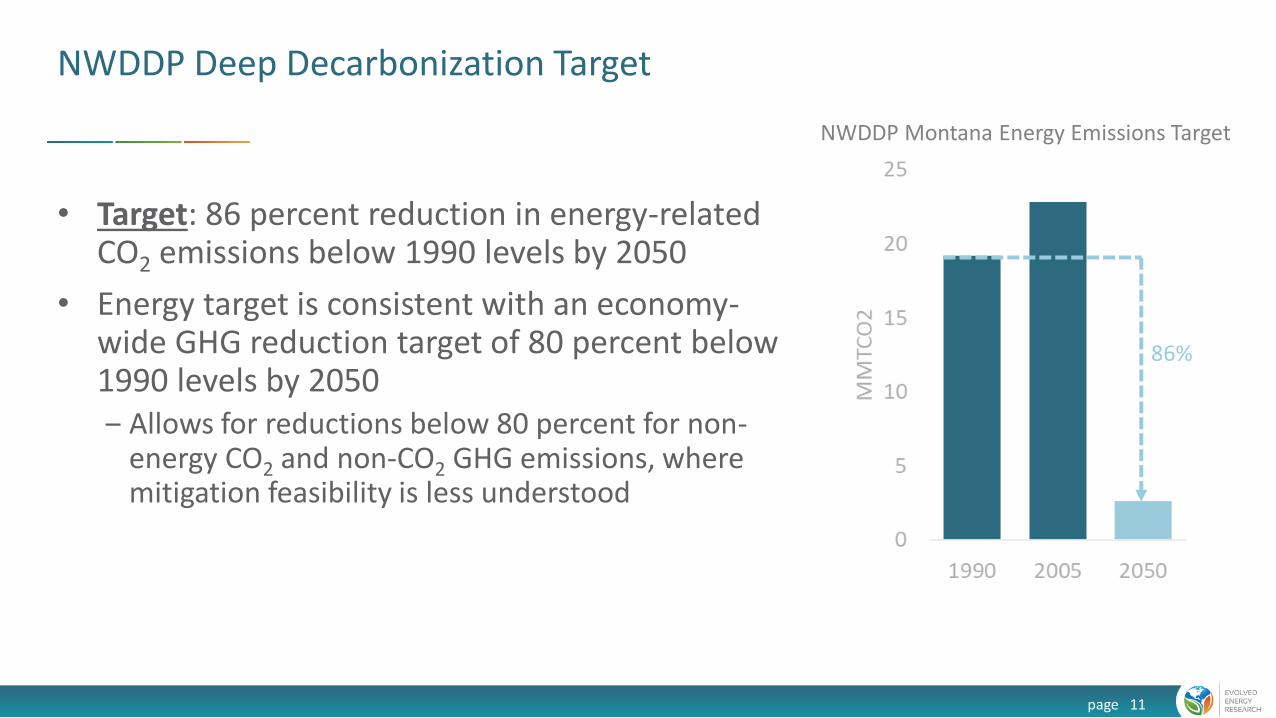
• Target: 86 percent reduction in energy-related CO2 emissions below 1990 levels by 2050
• Energy target is consistent with an economy-wide GHG reduction target of 80 percent below 1990 levels by 2050 ‒ Allows for reductions below 80 percent for non-
energy CO2 and non-CO2 GHG emissions, where mitigation feasibility is less understood
86%
NWDDP Montana Energy Emissions Target

The Demand Side
How was Montana forecast to consume energy in the NWDDP?
page 12
Montana Energy Demand: End-Use Consumption
page 13
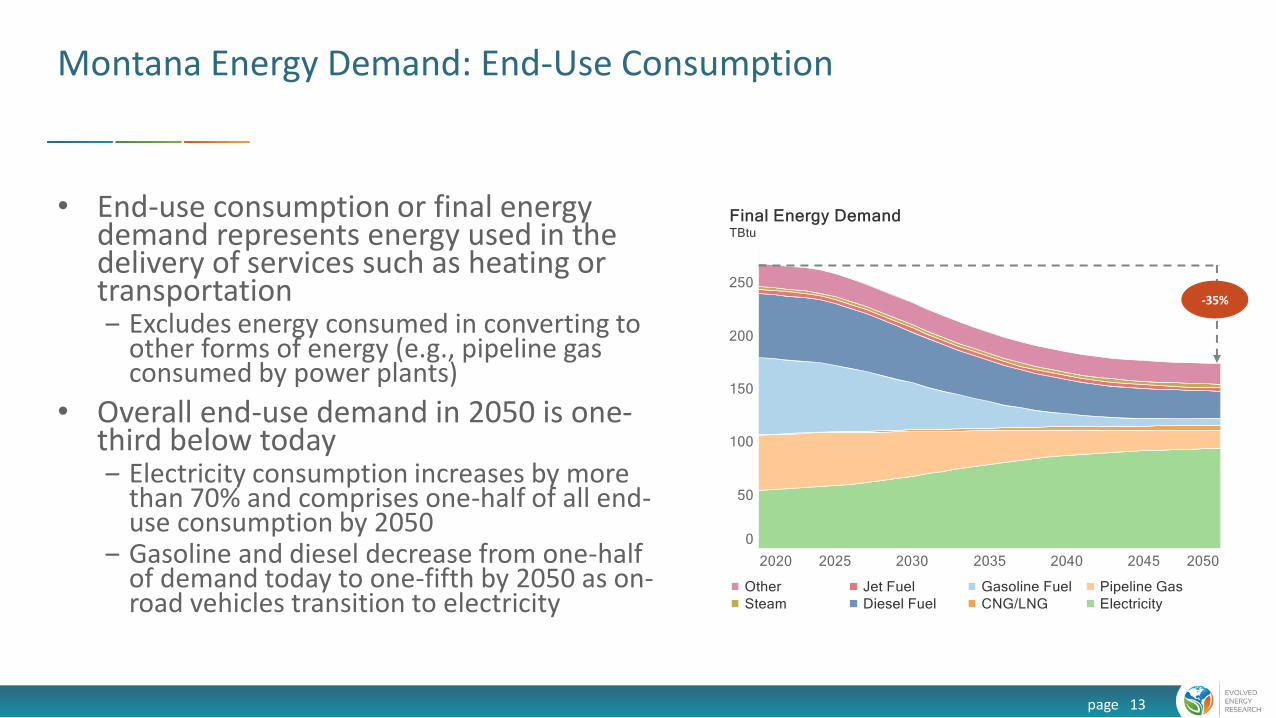
• End-use consumption or final energy demand represents energy used in the delivery of services such as heating or transportation‒ Excludes energy consumed in converting to
other forms of energy (e.g., pipeline gas consumed by power plants)
• Overall end-use demand in 2050 is one-third below today‒ Electricity consumption increases by more
than 70% and comprises one-half of all end-use consumption by 2050
‒ Gasoline and diesel decrease from one-half of demand today to one-fifth by 2050 as on-road vehicles transition to electricity
-35%

Montana Energy Demand: Retail Electricity Sales by End-Use
page 14
• Net increase in end-use electricity consumption is primarily related to electrifying passenger and freight transportation
• By 2050, all passenger vehicles on the road are electric, whereas about half of freight trucks are‒ Freight trucks that continue to use
liquid fuels primarily consume renewable diesel in the 2050 timeframe
+71%

Montana Transportation Electrification
page 15
• Vehicles on the road rapidly transition from liquid fuels to electric‒ Aggressive adoption over the
next three decades is necessary
• This results in an overall decrease in final energy demand due to the efficiency of an electric powertrain relative to an internal combustion engine

Montana Building Electrification
page 16
Example: Residential Buildings
• Energy consumption from buildings decreases significantly over time despite the growth of households and floorspace
• Electrification of space and water heating translates into deep energy use reductions due to the efficiency of heat pump technology relative to the best in-class combustion equipment
• This same trend is observed in commercial building stocks, as well as other end uses such as cooling and water heating

The Supply Side
Electricity Sector and Fuel Supply
page 17

Capacity Expansion
page 18
Northwest-Wide
• Northwest electricity sector adds nearly 100 GW of new electricity supply resources by 2050
• Renewable resources dominate capacity additions, with more than 40 GW of new onshore wind developed and 35 GW of solar PV
• Gas and storage resources are added primarily to provide resource adequacy and balancing‒ The capacity factor (utilization) of
the gas-fired fleet is below 10% in 2050

Electricity Generation
page 19
Northwest-Wide
• Incremental wind and solar PV are the principal sources of supply to both decarbonize electricity generation and meet growing electricity consumption‒ Wind generation is nearly the same size as
hydro generation by 2050
• Gas-fired generation share is 4% in 2050, while coal-fired generation is eliminated
• Columbia Generating Station is extended after 2043 and operates through the study horizon (2050)
Hourly Operations
page 20
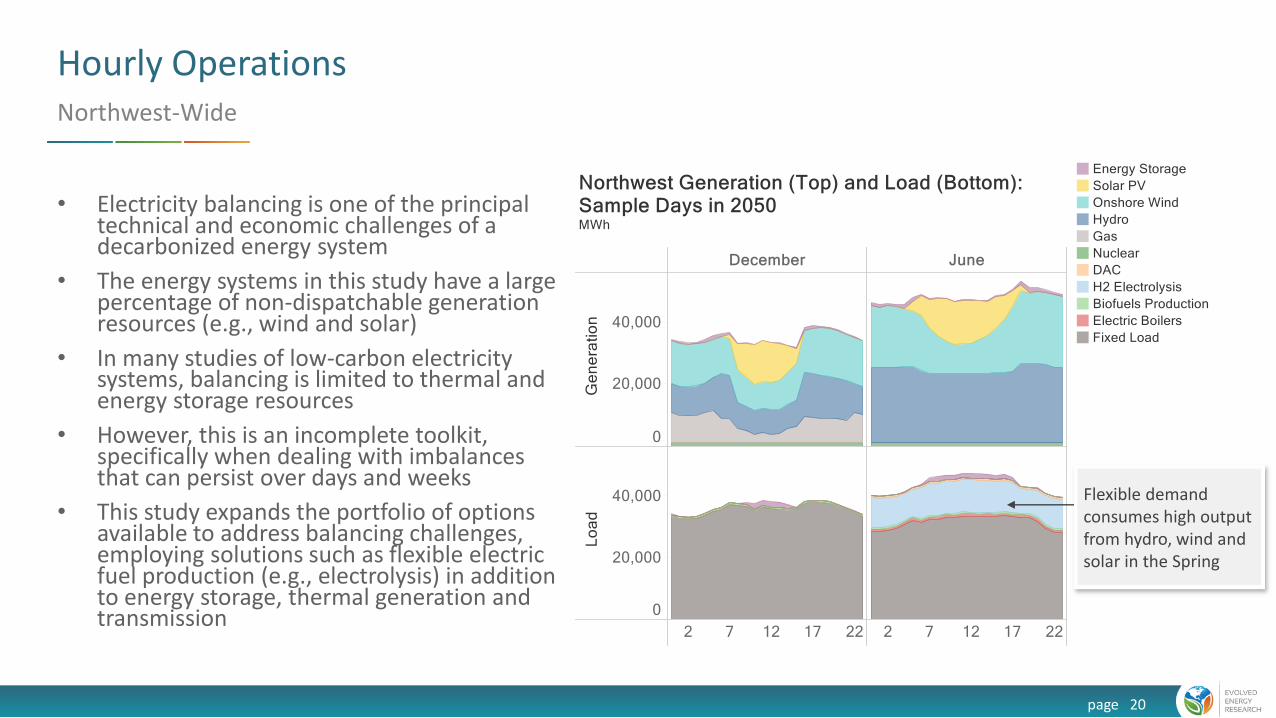
Northwest-Wide
Flexible demand consumes high output from hydro, wind and solar in the Spring
• Electricity balancing is one of the principal technical and economic challenges of a decarbonized energy system
• The energy systems in this study have a large percentage of non-dispatchable generation resources (e.g., wind and solar)
• In many studies of low-carbon electricity systems, balancing is limited to thermal and energy storage resources
• However, this is an incomplete toolkit, specifically when dealing with imbalances that can persist over days and weeks
• This study expands the portfolio of options available to address balancing challenges, employing solutions such as flexible electric fuel production (e.g., electrolysis) in addition to energy storage, thermal generation and transmission
Energy Demand: Transmission-Level Electric Load
page 21
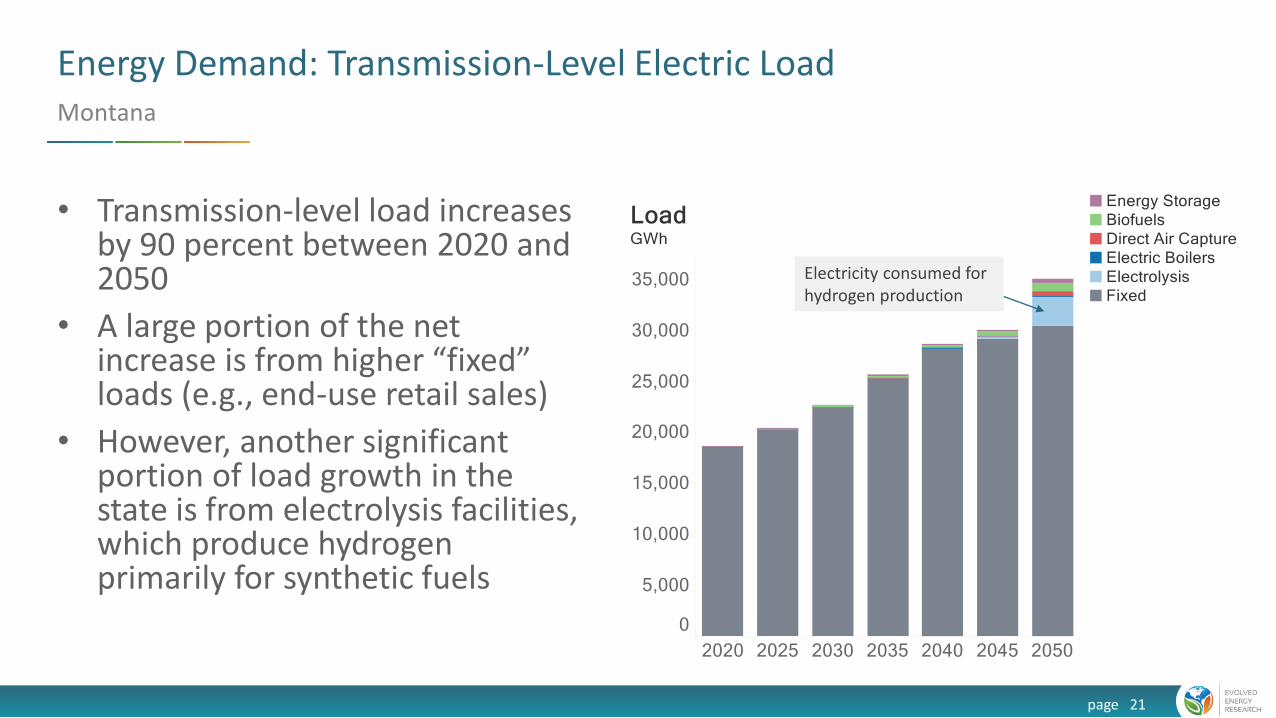
Montana
• Transmission-level load increases by 90 percent between 2020 and 2050
• A large portion of the net increase is from higher “fixed” loads (e.g., end-use retail sales)
• However, another significant portion of load growth in the state is from electrolysis facilities, which produce hydrogen primarily for synthetic fuels
Electricity consumed for hydrogen production
New Sources of Electric Load
page 22
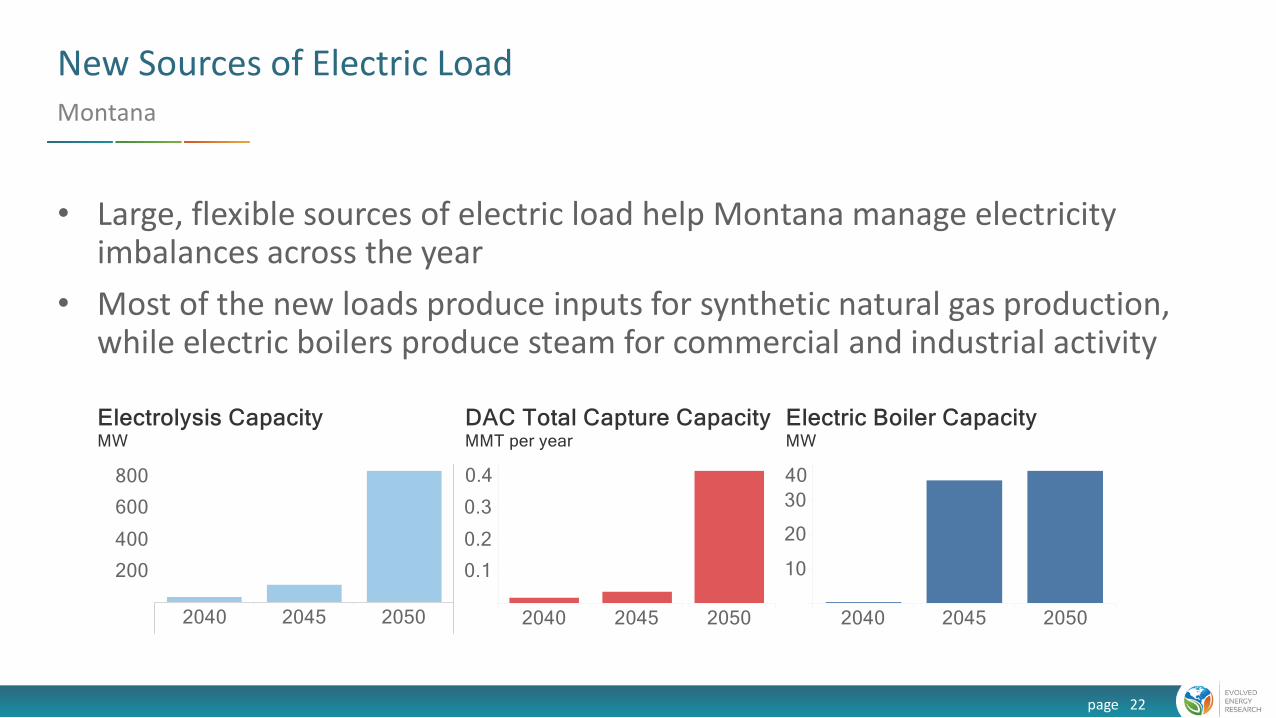
Montana
• Large, flexible sources of electric load help Montana manage electricity imbalances across the year
• Most of the new loads produce inputs for synthetic natural gas production, while electric boilers produce steam for commercial and industrial activity

Montana’s Electricity Export Market
page 23
Montana
• In all cases, Montana is a significant net exporter of electricity to other states by 2050
• Total exports are limited by the available transmission‒ 2.2 GW to Washington‒ 0.34 GW to Idaho‒ 0.6 GW to the rest of the West
• Expanding transmission to surrounding regions would increase the export market potential for Montana‒ Key opportunity to investigate in
future state planning efforts

Exports Increase with Development of Montana Wind Sector
page 24
Montana Net Exports in the Central Case
• A close to doubling of wind from 2035 to 2040 supplies out of state demand for clean energy‒ Washington State is the main export
market, driven by larger transmission ties to the state
• Montana energy is majority wind by 2050
• New, tighter emissions targets proposed in Washington and other Western states since the NWDDP was conducted will drive further demand for low cost and clean Montana wind exports

Montana Energy Supply: Fuels
page 25
Biofuels with CCS are the primary source of diesel and jet fuel in 2050
While other states decarbonize a fraction of pipeline gas with synthetic electric fuels, Montana retains fossil gas, choosing instead to offset emissions with CCS

Caveats
page 26

Caveats
page 27
There are several ways in which the NWDDP analysis cannot be directly applied to Montana
• Scenario definitions and assumptions are not tailored to Montana interests or to represent the Montana policies and uncertainties most valuable to investigate to inform policy development‒ Tailored analysis supporting State and stakeholder driven questions will best serve State climate policy action
• Targets have since been proposed for Montana‒ Carbon neutral electricity by 2035 and net zero emissions by 2050‒ These will drive more clean energy investment in the state than in the NWDDP
• Targets have changed for other Western states‒ Since the NWDDP was conducted, Western states including Washington, Colorado, and Nevada have set more stringent
emissions and clean energy standards‒ These will drive more clean energy investment, and potentially greater demand for Montana resources
• Prices are out of date‒ Forecasted prices have been lowered for many clean energy technologies, in some cases substantially, since the
NWDDP analysis was conducted in 2018. This includes for electric vehicles – one of the largest drivers of decarbonization cost reductions
• Covid-19 has impacted demand and fuel prices‒ Short-term market price impacts, and longer term demand impacts and structural changes may revise the outlook for
demand and prices over the coming years

Caveats
page 28
Continued
• No transmission expansion and limited interstate representation‒ The NWDDP did not simulate the opportunity of expanding transmission and thus expanding the market
for Montana clean energy to other regions‒ Investigating this becomes more important with the move of other states towards stringent clean energy
and emissions goals
• Lack of detailed consideration of Montana’s coal generators‒ Policy options surrounding Montana’s coal industry, including retirement schedules, were not investigated
in the NWDDP
• Fuels trading limitations‒ The NWDDP did not allow states to trade clean fuels and build supply routes for clean fuel exports. This is
an important pathway towards more realistic and lower cost regional decarbonization solutions
• Outdated assumptions about vehicle stock rollover‒ Assumed levels of electrification and remaining internal combustion energy stocks in the economy may
not be appropriate for Montana‒ Options for trucking using fuel cells have become more viable since the NWDDP analysis was conducted.
Fuel cells may play an important role in the future, particularly in long-distance trucking

Summary
page 29

Source: Northwest Deep Decarbonization Pathways Study, June 2019, Evolved Energy Research
What Are the Least Cost Strategies that Policy Should Target?
Figure for illustration purposes only
30
Northwest-wide

Montana Energy CO2 Emissions By Fossil Fuel Type 2020-2050
page 31
• The five decarbonization strategies reduce Montana’s emissions over the next three decades
• The largest remaining source of emissions is natural gas‒ Natural gas is the cheapest fossil fuel,
therefore it is the last to be decarbonized
• Montana offsets remaining emissions with carbon sequestration in saline aquifers to reach the 2050 target

Montana Energy CO2 Emissions By Sector
page 32
• Overall emissions decrease across all sectors of the state’s economy
• Transportation emissions decline significantly with on-road (LDV, MDV, and HDV) significantly reduced‒ In 2050, biofuels with CCS are the
dominant source of diesel and jet fuel, resulting in negative emissions
• Building emissions are reduced to ~1MMT by 2050 as heating services are electrified
Load
page 33
Northwest-Wide
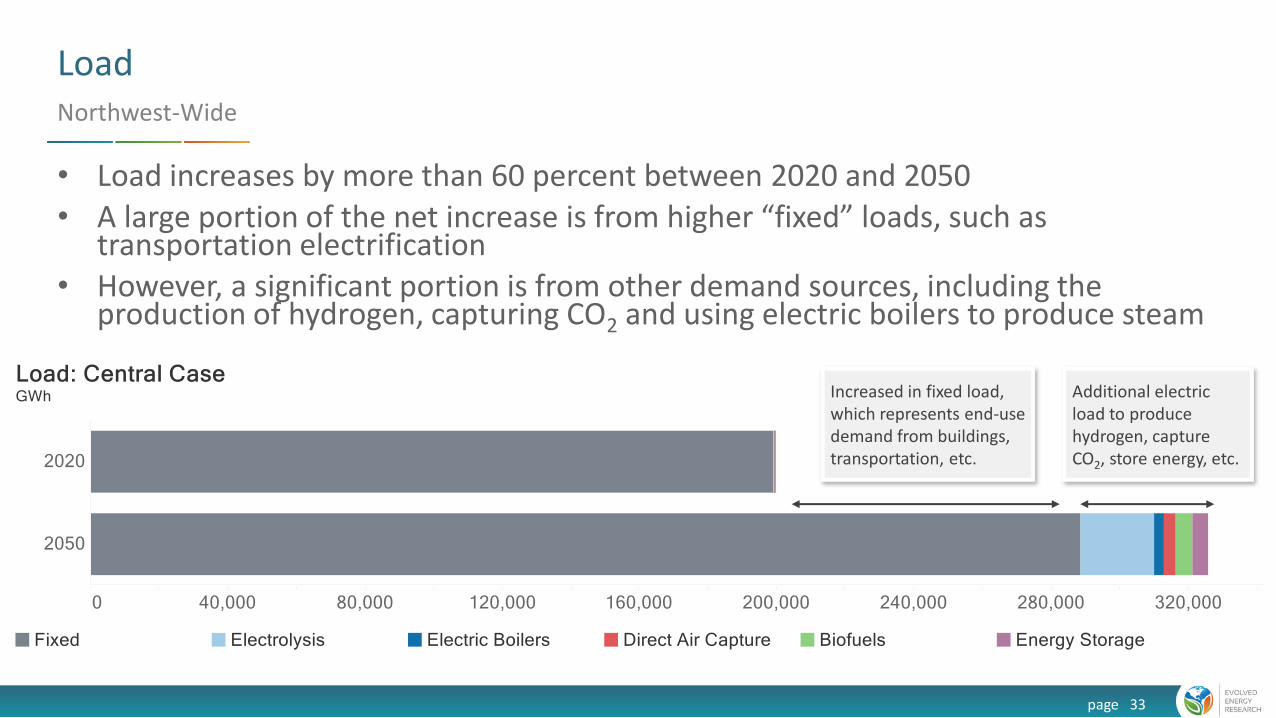
• Load increases by more than 60 percent between 2020 and 2050• A large portion of the net increase is from higher “fixed” loads, such as
transportation electrification• However, a significant portion is from other demand sources, including the
production of hydrogen, capturing CO2 and using electric boilers to produce steam
Increased in fixed load, which represents end-use demand from buildings, transportation, etc.
Additional electric load to produce hydrogen, capture CO2, store energy, etc.

State-level Energy CO2 Emissions in 2050
page 34
Northwest Wide
• In most states, the majority of remaining emissions are from natural gas combustion
• The exception is Washington State, where residual fuel oil used in shipping is the largest remaining source of emissions‒ The NWDDP did not include
options for decarbonizing this sector. Future studies will, impacting regional investments
• Montana has geological CO2sequestration potential, which allows for the capture of CO2and storage in saline aquifers

Montana Net Costs
page 35
Estimated as the difference between the Central Case and Reference Case
• Net costs for the state primarily represent incremental:‒ Biofuel feedstocks and infrastructure;‒ Demand-side electrification and
efficiency investments; and‒ Renewable power plants and
supporting electricity infrastructure
• These incremental costs are mitigated by savings from avoided fossil fuel expenditures
• Net costs peak around 2040 as costs of key decarbonization technologies are still declining and the alternative cost of fossil fuels continues an upward trajectory
Net Costs Relative to Montana’s Economy
page 36
Share of GDP
• Magnitude of net costs are small relative to the size of the state’s economy‒ Montana’s gross domestic product in 2019 was $52.2 billion
• Between 2030 and 2050, incremental net costs of the Central Case are between 1% and 1.5% of today’s economy for Montana
• Since this study was conducted, the forecasts for renewables and electric vehicle prices have dropped so decarbonization costs are lower
• These costs would be even smaller if future economic growth and benefits from avoided climate change and pollution were considered‒ Factoring in carbon and health externalities in other studies resulted in a net benefit from
decarbonization‒ An example of these net benefits are shown on the next slide from the New Jersey Energy
Master Plan

Example: New Jersey Energy Master Plan
page 37
Costs and benefits of decarbonizing in 2050
Source: New Jersey Energy Master Plan, analysis conducted by Evolved Energy Research and Rocky Mountain Institute
• New Jersey targeted an 80% emissions reduction and 100% clean electricity by 2050
• The chart opposite shows annual costs and benefits in 2050 of achieving that target relative to a reference case
• While decarbonization is a net cost when considering incremental costs and avoided costs, factoring in externalities would drive New Jersey to net benefits
• A future decarbonization study for Montana may find that net costs are close to zero, or a net benefit, while considering only incremental energy and avoided costs given price declines since the NWDDP‒ Adding additional accounting for externalities including
health and climate change impacts is highly likely to result in a net benefit to the state

0%
1%
2%
3%
4%
5%
6%
7%
8%
9%
10%
1995 2005 2015 2025 2035 2045
% o
f GD
P
Total Energy System Costs as Percentage of GDP
All Options
Reference 1
Historical
Total Spending on the Energy System as Share of GDP
Confidential and Deliberative Draft page 38
New Jersey Example
• While Montana’s incremental spending to decarbonize the economy is 1 to 1.5% of today’s economy in the NWDDP, this is worth thinking about in context
• Energy spending in general across the US is set to decrease as economic growth is further decoupled from energy consumption
• Contextualizing spending in a future study of Montana decarbonization is likely to show the decreasing percentage spending in GDP terms, and lower spending compared to historical precedent
Crude oil price over $100 per barrel
Sources and notes: New Jersey, Energy Master Plan. Historical state GDP from the U.S. Bureau of Economy Analysis; historical energy spending from U.S. Energy Information Administration.

$(2)
$(1)
$-
$1
$2
$3
$4
$5
$6
2030 2050
20
18
$b
il/yr
BEV Cost Uncertainty
Uncertainty in Cost Inputs
Confidential and Deliberative Draft page 39
New Jersey Example: Sensitivity to fuel prices in 2050
• Decarbonization costs are uncertain, and this uncertainty increases with time
• Uncertainty is illustrated through ranges in net cost for the New Jersey example, with alternative fossil fuel prices and battery electric vehicle costs‒ Range of fossil fuel price projections are from EIA’s
AEO 2019• Oil price ~+/-10% in 2050• Gas price +70%/-30% in 2050
‒ Range of BEV cost projections is +/-10% of the baseline assumption
• Deep decarbonization will reduce Montana’s exposure to uncertain and volatile fossil fuel prices ‒ Hedge against fuel prices dictated by international
markets, increasing energy security
• Electric vehicle price forecasts have been trending downwards. They are an important driver of total decarbonization costs, with a 10% decrease in forecasted prices resulting in net benefits of decarbonization for New Jersey $(2)
$(1)
$-
$1
$2
$3
$4
$5
$6
2030 20502
01
8$
bil/
yr
Fossil Fuel Cost Uncertainty
Avoided costs
Incremental costs

Key Takeaways
page 40
• The NWDDP assumptions drive final energy demand to fall by 35% through greater efficiency, much of which comes from a transition to electrified transportation and electrified end uses in buildings
‒ As a result electricity demand rises 71%. Whether this result is best for Montana was not investigated in the NWDDP, and any future decarbonization study should include weighing the costs and benefits of electrification policy with assumptions tailored to Montana
• Montana utilizes its geographic strengths on the supply side in the NWDDP‒ A large wind sector is established, supplying clean energy to Montana and surrounding regions‒ Carbon is sequestered in saline aquifers in the production of liquid fuels from biomass, offsetting emissions from other sources
• Policy actions taken in the rest of the West could impact Montana’s investments in significant ways, with opportunities to play a major export role in a decarbonized Western system
‒ Low cost and complementary wind resource• Coastal states have a relatively poor wind resource and import significant quantities of wind from Montana and Wyoming. Transmission between Montana and Washington was
fully utilized to export clean energy in the NWDDP
‒ Transmission expansion• The NWDDP did not allow transmission expansion between Montana and neighbors. However, transmission expansion is likely cost effective and would open up greater
opportunity for exports for Montana. This would be a valuable avenue of investigation for a future decarbonization study
‒ Decarbonized fuels• Decarbonized fuels from biomass and hydrogen play a major role in Montana’s transportation sector by 2050. Other Western states also rely on decarbonized fuels to reach
their own targets. Montana has low cost resources to produce fuels and could export fuels to other states – another opportunity to investigate
• Fuels export can also take the pressure off expansion of transmission lines, by exporting clean energy through pipelines or other forms of transport instead
• Decarbonization costs are 1 to 1.5% of Montana GDP in the NWDDP. This estimate will have decreased with falling price forecasts for clean energy technology
‒ Decarbonization is likely to be a net benefit to the state when factoring in externalities‒ Fossil fuel and electric vehicle price uncertainties have a major impact on total costs. Further price forecast declines in electric vehicles could result in net
benefits for Montana
Planning Framework for Decarbonization
Designing a state-driven process to achieve climate goals most effectively
41
What is Success when Planning State Climate Policy?
• Policy and near-term action development that:‒ Achieve “best” balance of state objectives – what outcomes would best satisfy
Montana’s many, sometimes competing, objectives?‒ Are actually implemented through collective action across state agencies, utilities,
and other participants
• Multiple objectives including reaching climate targets, but also labor, productivity, equity, environmental, environmental justice, etc.
• Effective planning includes:‒ Representative stakeholder participation for all interests in the state‒ Providing as much information to policymakers as possible, economic and
otherwise, to weigh the options

Tailored Analytical Approach
• Least-cost energy system planning, and policy/action design complement one another‒ Process to determine Montana’s best path forward‒ Least cost energy system planning determines investments necessary to minimize total cost
of achieving targets for different future scenarios ‒ Policy and action design determine how best to achieve those investments and allocate
those costs
• The best path is a balance of different, often competing objectives‒ Not all objectives can be quantified in economic terms‒ Analysis provides more information to allow decisionmakers to weigh one option against
another
• Stakeholder input essential to define the options and evaluate policies and actions
43
Three Framing Questions
• Where are we now?‒ What is the current state of Montana’s energy system?
• Where do we want to go?‒ What are Montana’s most desirable pathways to meeting emissions goals?
• How should we get there?‒ What policies and actions get us to where we want to go?
44

Where Are We Now?
45
• Present day
‒ What do Montana’s energy technologies/systems and consumption patterns look
like on the demand and supply side?
• e.g., what types of appliances are homes and businesses currently using? What are
transportation energy consumption patterns? How does the state generate electricity?
What do imports and exports look like? What are industrial process emissions?
‒ What policies presently drive investments and behavior?
‒ What behaviors are markets incentivizing?
‒ What do technologies and fuels presently cost?
• Building the full picture of what Montana’s energy consumption and
emissions profile looks like today

• What is the best future we can envision for
the state?‒ Balance of different, often competing objectives
‒ Alternative least cost pathways examining different priorities
• Understanding the tradeoffs‒ How much does one pathway cost versus another?
• Counterpoint for policymakers and stakeholders
‒ Provides a target for near-term policy and action design to hit
• Understanding the uncertainties‒ How does an uncertain future impact our decisions?
Where Do We Want to Go?
100% Clean Electricity Grid
Limited Electrification & Efficiency
Limited New Thermal Plant Development
Limited Biomass for Liquid Fuels
Evaluating uncertainties
Investigating policies
Examples for illustration only
46
How Should We Get There?
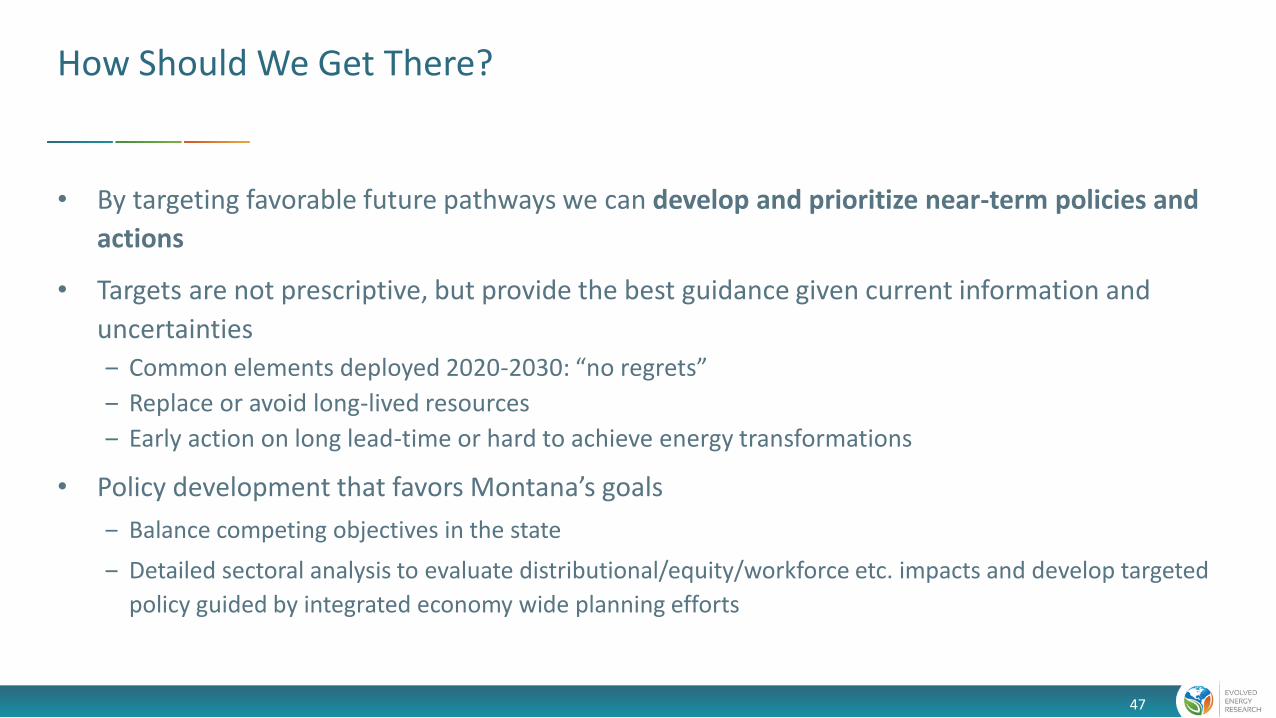
• By targeting favorable future pathways we can develop and prioritize near-term policies and
actions
• Targets are not prescriptive, but provide the best guidance given current information and
uncertainties
‒ Common elements deployed 2020-2030: “no regrets”
‒ Replace or avoid long-lived resources
‒ Early action on long lead-time or hard to achieve energy transformations
• Policy development that favors Montana’s goals
‒ Balance competing objectives in the state
‒ Detailed sectoral analysis to evaluate distributional/equity/workforce etc. impacts and develop targeted
policy guided by integrated economy wide planning efforts
47

Near-Term Focus on Long-Lived Assets
page 48
Early action needed to avoid carbon lock-in or stranded assets
0
1,000
2,000
3,000
4,000
5,000
6,000
7,000
1990 2000 2010 2020 2030 2040 2050
MM
t C
O2
<-Historical Projection->
U.S. Energy-related CO2 Emissions
Reference
2050 Target
Dead-end pathway
205020302020 2040
Power plant
Vehicles
Pipelines
Commercial boilers
AC & Furnace
Appliances
Bulb
Stock replacement count before mid-century
48

Planning Process
Steps followed through stakeholder process
49

Scenario Development: Investigate State Objectives
• Translate State objectives and potential policy
pathways into constrained scenarios
‒ What are state and stakeholder policy goals?
‒ How hard should the state prioritize particular actions or
strategies?
• Understanding the tradeoffs
‒ How much does one pathway cost versus another?
• Counterpoint for policymakers and stakeholders
‒ Provides a target for near-term policy and action design
to hit
• Understanding the uncertainties
‒ How does an uncertain future impact State decisions?
50
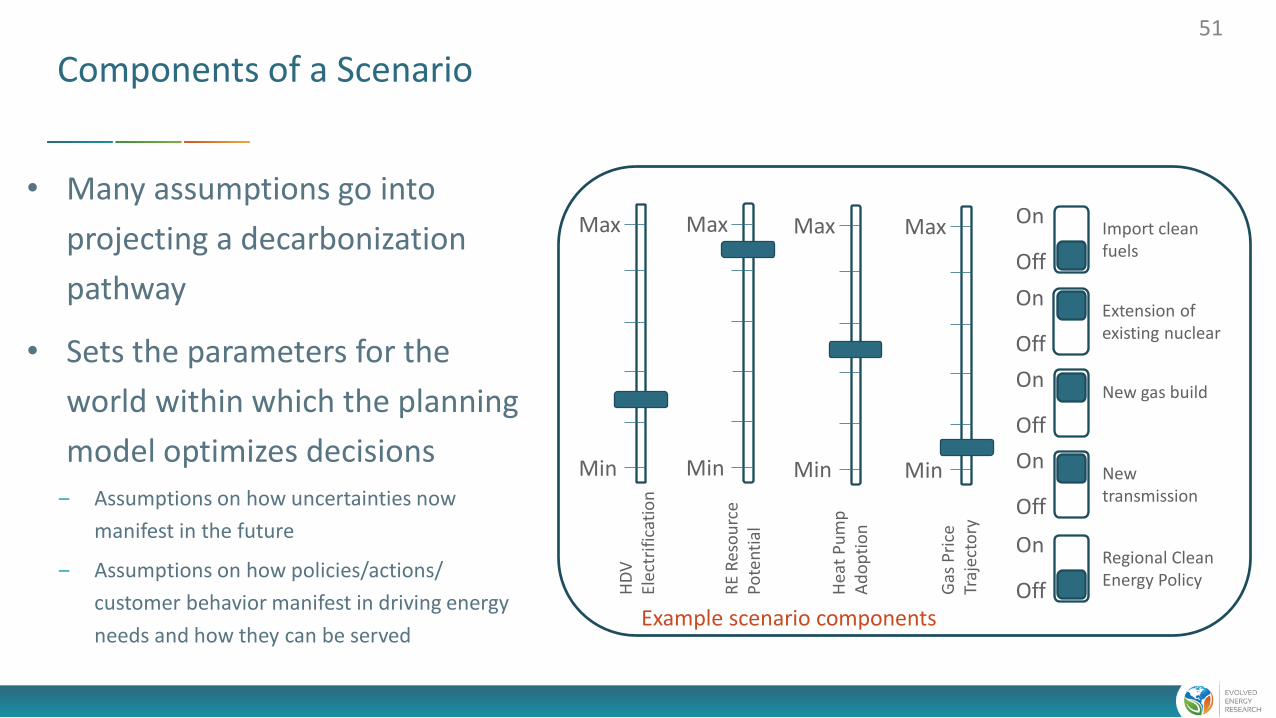
Components of a Scenario
Min
Max
Min
Max
Min
Max
Min
Max
HD
V
Elec
trif
icat
ion
RE
Res
ou
rce
Pote
nti
al
Hea
t P
um
p
Ad
op
tio
n
Gas
Pri
ce
Traj
ecto
ry
On
Off
Import clean fuels
On
Off
Extension of existing nuclear
On
Off
New gas build
On
Off
New transmission
On
Off
Regional Clean Energy Policy
Example scenario components
• Many assumptions go into
projecting a decarbonization
pathway
• Sets the parameters for the
world within which the planning
model optimizes decisions
‒ Assumptions on how uncertainties now
manifest in the future
‒ Assumptions on how policies/actions/
customer behavior manifest in driving energy
needs and how they can be served
51

Connect Scenarios to Important Outcomes for the State
• Develop with the feedback from the State and stakeholder process
• Provides valuable information for the policy development process
‒ What outcomes should be targeted through near-term policy and action development?
52
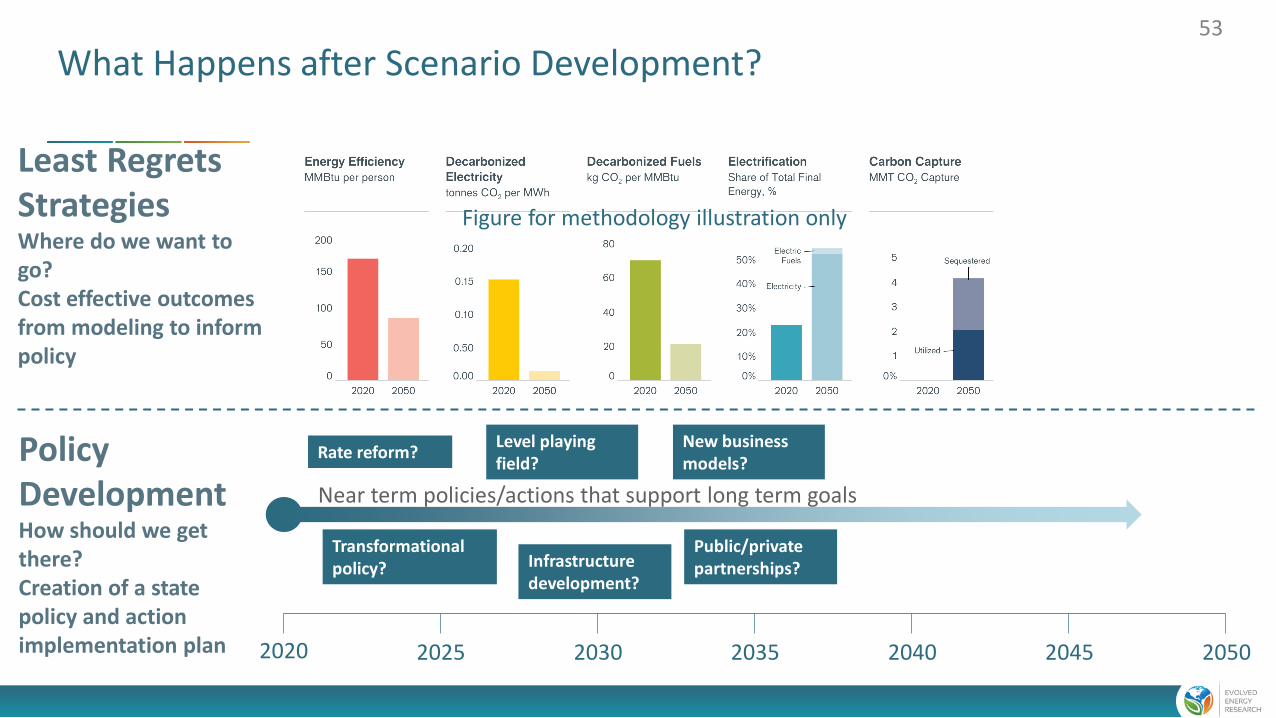
What Happens after Scenario Development?
Least Regrets Strategies Where do we want to go?Cost effective outcomes from modeling to inform policy
Policy DevelopmentHow should we get there?Creation of a state policy and action implementation plan 2025 2030 2035 2040 2045 20502020
Near term policies/actions that support long term goals
Level playing field?
Rate reform?
Transformational policy? Infrastructure
development?
New business models?
53
Figure for methodology illustration only
Public/private partnerships?

THANK YOU
2443 Fillmore Street, No. 380‐5034San Francisco, CA, 94115
(415) 580‐1804 [email protected] www.evolved.energy
54

Appendix A
Deep Decarbonization Scenario Definitions from Northwest Deep Decarbonization Pathways Study
page 55

Summary of Alternative Deep Decarbonization Pathways
page 56
Case Description
Limited Demand Transformation
• Increased fuel demand from lower electrification requires significant volumes of synthetic fuel
production
• Raises net costs by $15 billion in 2050
Constrained Biomass
• Similar impacts as the “Limited Demand Transformation”, where additional synthetic fuels are
needed to meet the carbon constraint
• Raises net costs by $3 billion in 2050
Increased Gas in Transportation• Biofuels are primarily allocated to pipeline gas rather than liquid fuels
100% Clean Electricity• State can achieve a 100% clean electricity standard with a small increase in synthetic natural gas
production for gas-fired power plants
No New Gas Plants• Additional energy storage and renewables are required across the region for balancing
• This incentivizes additional synthetic fuels and avoids some biofuels consumption
Increased NW-CA Transmission
• Northwest avoids developing low-quality solar and increases wind development
• California avoids procurement of remote wind generation from other Western states (NM and
WY) and develops additional high-quality solar which is exported to the Northwest

Appendix B
Evolved Energy Research Modeling Overview
page 57

Model OverviewHigh level description of our approach
58

High-Level Description of Modeling Approach
• Model calculates the energy needed to power the Montana economy, and the least-cost way to provide that energy under clean energy goals
59
Montana’s energy needs
Electricity
Liquid Fuels
Gaseous Fuels
Model of
Montana’s economy
Residential
Commercial
Industrial
Transportation
1: Model
calculates
energy
needs
2: Model
calculates
energy
supply
Supply energy
reliably at least cost
Generation
Transmission
Storage
Fuel supply
Carbon
Constrained by clean
energy goals

1. The model calculates energy demand by assuming population growth, economic growth, and adoption of new technologies
This ‘stock rollover’ analysis is repeated for ~30 end-uses across the economy
Example: Water heaters
Model estimates how many water heaters of each type are purchased each year
Model calculates the changing stock of hot water heaters by year
Model calculates the gas and electricity required for water heaters
Electric Resistance
Gas
Heat Pump
Pipeline Gas
Electricity
Gas
Electric Resistance
Heat Pump
Wat
er H
eate
r St
ock
Ener
gy D
eman
d
Pu
rch
ased
Ho
t W
ater
Hea
ters
20
45
20
15
20
20
20
25
20
30
20
35
20
40
20
50
20
45
20
15
20
20
20
25
20
30
20
35
20
40
20
50
20
45
20
15
20
20
20
25
20
30
20
35
20
40
20
50
Figure for methodology illustration only
60

2. The model optimizes investments in energy infrastructure to meet energy demands and satisfy emissions constraints
Example: Electricity
Electricity includes all economic sectors
Elec
tric
ity
Dem
and
(Q
uad
s)
Elec
tric
ity
Sup
ply
(Q
uad
s)
2020 2030 2040 2050 2020 2030 2040 2050
Model optimizes investments to meet demand, reliability, and emission targets
Reliability: Model requires
supply is met during rare,
severe weather events,
while maintaining reserve
margin
Fuel and electricity supply
are optimized together
Model uses best available
public data
Figure for methodology illustration only
61
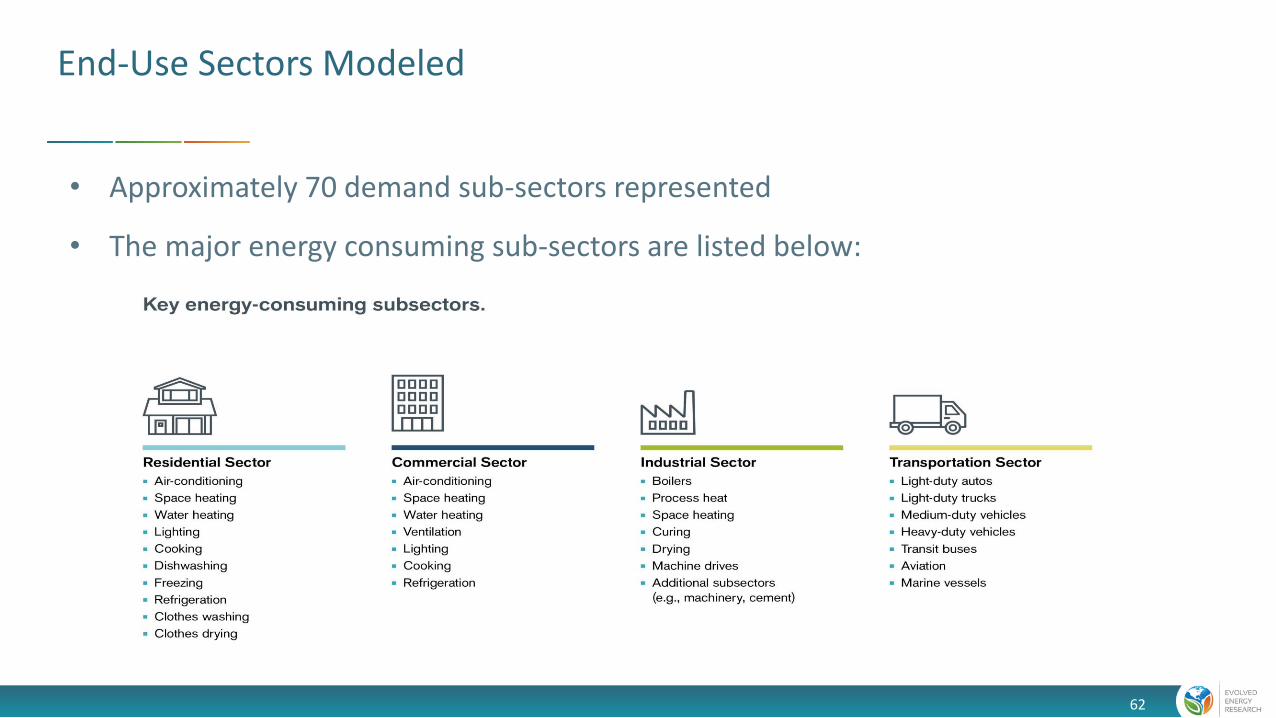
End-Use Sectors Modeled
• Approximately 70 demand sub-sectors represented
• The major energy consuming sub-sectors are listed below:
62

New Electric Sector Resource Options
Model invests across a range of thermal, renewable and energy storage technologies
to satisfy energy, capacity, balancing, and environmental needs
Thermal
Gas Combustion Turbine (CT)
Gas Combined Cycle (CC)
Gas CC with Carbon Capture and Sequestration (CC w/ CCS)
Onshore/Offshore Wind
Solar PV
Geothermal
Pumped Hydro
Lithium-ion
Vanadium Flow
Renewable Energy Storage
63
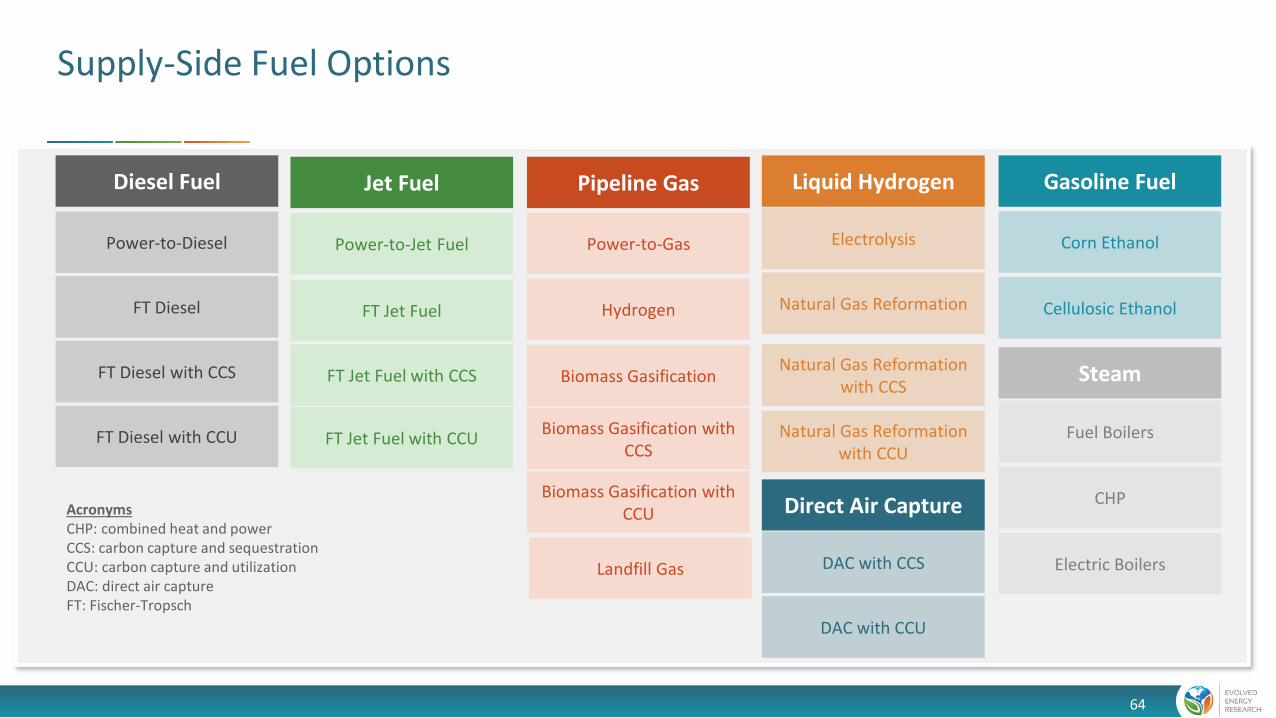
Supply-Side Fuel Options
Diesel Fuel
Power-to-Diesel
FT Diesel
FT Diesel with CCS
Power-to-Jet Fuel
FT Jet Fuel
FT Jet Fuel with CCS
Power-to-Gas
Hydrogen
Biomass Gasification
Jet Fuel Pipeline Gas
FT Diesel with CCU FT Jet Fuel with CCUBiomass Gasification with
CCS
Biomass Gasification with CCU
Corn Ethanol
Cellulosic Ethanol
Gasoline Fuel
Steam
Fuel Boilers
CHP
Electric Boilers
Direct Air Capture
DAC with CCS
DAC with CCU
Liquid Hydrogen
Electrolysis
Natural Gas Reformation
Natural Gas Reformation with CCS
Natural Gas Reformation with CCU
Landfill Gas
AcronymsCHP: combined heat and powerCCS: carbon capture and sequestrationCCU: carbon capture and utilizationDAC: direct air captureFT: Fischer-Tropsch
64

Model Structure and Operations
65

EnergyPATHWAYS and RIO
Scenario analysis tool that is used to develop economy-wide energy demand scenarios
Optimization tool to develop portfolios of low-carbon technology deployment for electricity generation and balancing, alternative fuel production, and direct air capture
Description
Application
EnergyPATHWAYS (EP) scenario design produces parameters for RIO’s supply-side optimization:
• Demand for fuels (electricity, pipeline gas, diesel, etc.) over time
• Hourly electricity load shape
• Demand-side equipment cost
RIO returns optimized supply-side decisions to EP:
• Electricity sector portfolios, including renewable mix, energy storage capacity & duration, capacity for reliability, transmission investments, etc.
• Biomass allocation across fuels
66

RIO & EP Data and Methods have Improved across many Past Studies
page 67
Project Geography EP RIORisky Business Project From Risk to Return National U.S./Census Division
National Renewable Energy Laboratory Electrification Futures Study National U.S./50 states
National Renewable Energy Laboratory North American Renewable Integration Study National Canada/Mexico
Our Children’s Trust 350 PPM Pathways for the United States National U.S./12 regions
Hydro Québec Deep Decarbonization in the Northeastern U.S. Regional Northeast
State of Washington: Office of the Governor Deep Decarbonization Pathways Analysis State WA
Confidential California utility Economy-wide GHG policy analysis State/Utility Service Territory CA
Clean Energy Transition Institute Northwest DDP Study Regional ID, MT, OR, WA
New Jersey Board of Public Utilities Integrated Energy Plan State NJ
Portland General Electric Deep Decarbonization Pathways Analysis Utility territory PGE
Inter-American Development Bank Deep Decarbonization of Mexico National Mexico/5 Regions
Confidential Client Zero Carbon European Power Grid Regional EU/8 Regions
Confidential Client Low Carbon Electricity in Japan National Japan/5 Regions
Natural Resource Defense Council, Inc Deep Decarbonization Pathways Analysis
(ongoing)
National US/14 Regions
Princeton University Low-Carbon Infrastructure Project (ongoing) National US/16 Regions
Pathways for Florida (ongoing) State U.S./16 regions
Massachusetts State Energy Plan (ongoing) State Northeast & Canada (11 states
and provinces)
State of Washington: State Energy Strategy (ongoing) Regional U.S. West (11 states)
67
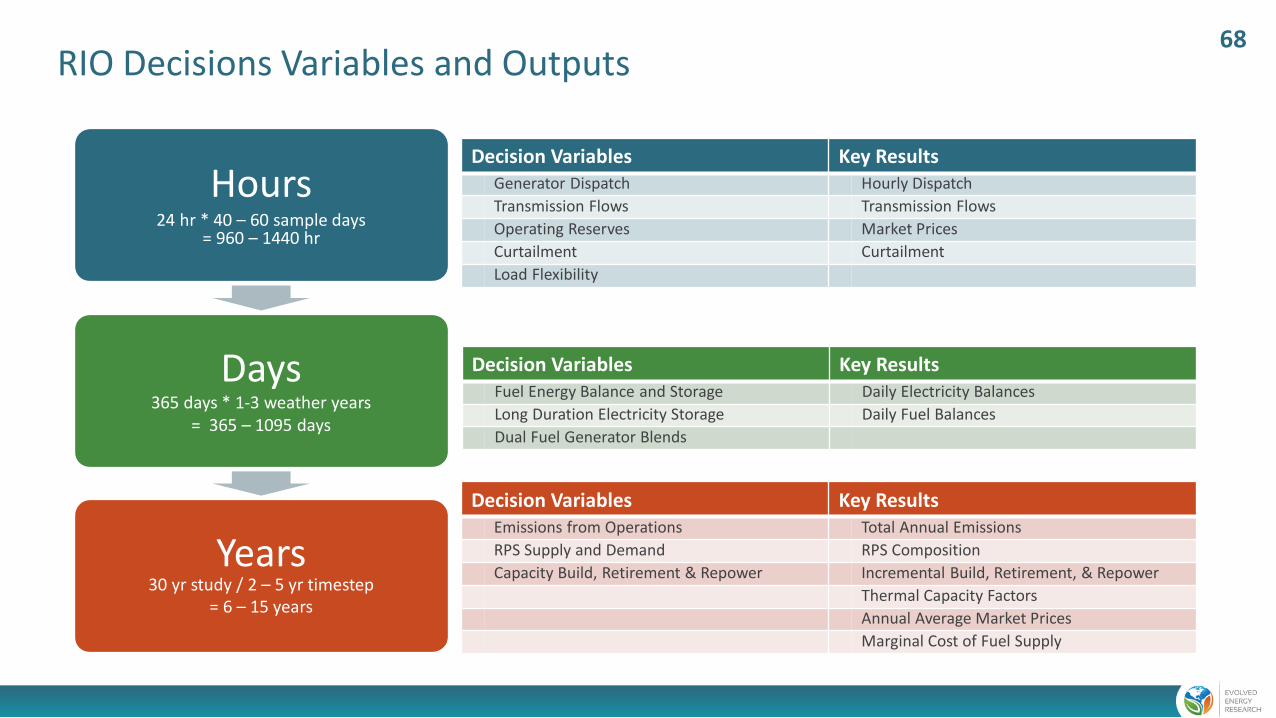
RIO Decisions Variables and Outputs
page 68
Hours24 hr * 40 – 60 sample days
= 960 – 1440 hr
Days365 days * 1-3 weather years
= 365 – 1095 days
Years30 yr study / 2 – 5 yr timestep
= 6 – 15 years
Decision Variables Key ResultsGenerator Dispatch Hourly Dispatch
Transmission Flows Transmission Flows
Operating Reserves Market Prices
Curtailment Curtailment
Load Flexibility
Decision Variables Key ResultsFuel Energy Balance and Storage Daily Electricity Balances
Long Duration Electricity Storage Daily Fuel Balances
Dual Fuel Generator Blends
Decision Variables Key ResultsEmissions from Operations Total Annual Emissions
RPS Supply and Demand RPS Composition
Capacity Build, Retirement & Repower Incremental Build, Retirement, & Repower
Thermal Capacity Factors
Annual Average Market Prices
Marginal Cost of Fuel Supply
68
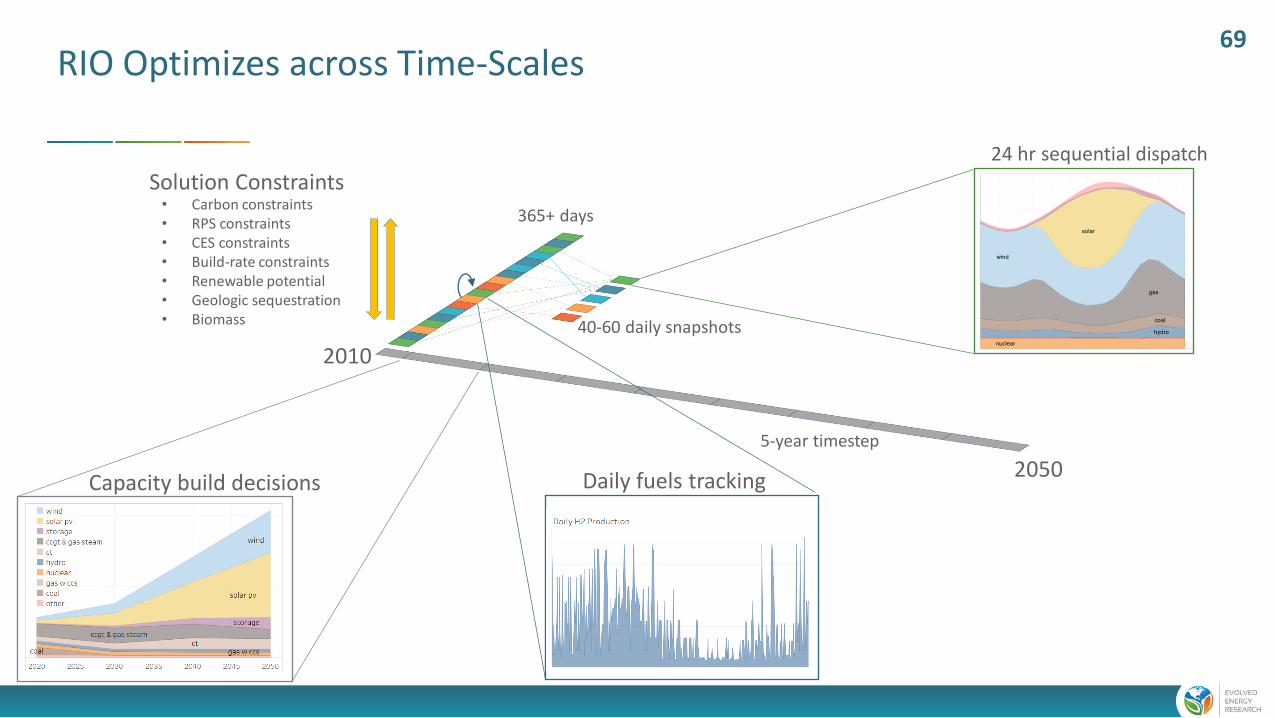
RIO Optimizes across Time-Scales
page 69
24 hr sequential dispatch
40-60 daily snapshots
365+ days
5-year timestep
2010
2050Capacity build decisions Daily fuels tracking
• Carbon constraints• RPS constraints• CES constraints• Build-rate constraints• Renewable potential• Geologic sequestration• Biomass
Solution Constraints
69

RIO optimizes across Geographic Constraints
Transmission constraints and potential between
states
‒ Model can optimally expand interties and fuels delivery infrastructure
Loads, resources, and new resource potentials
by state
‒ Captures unique geographic advantages and local conditions by state
70
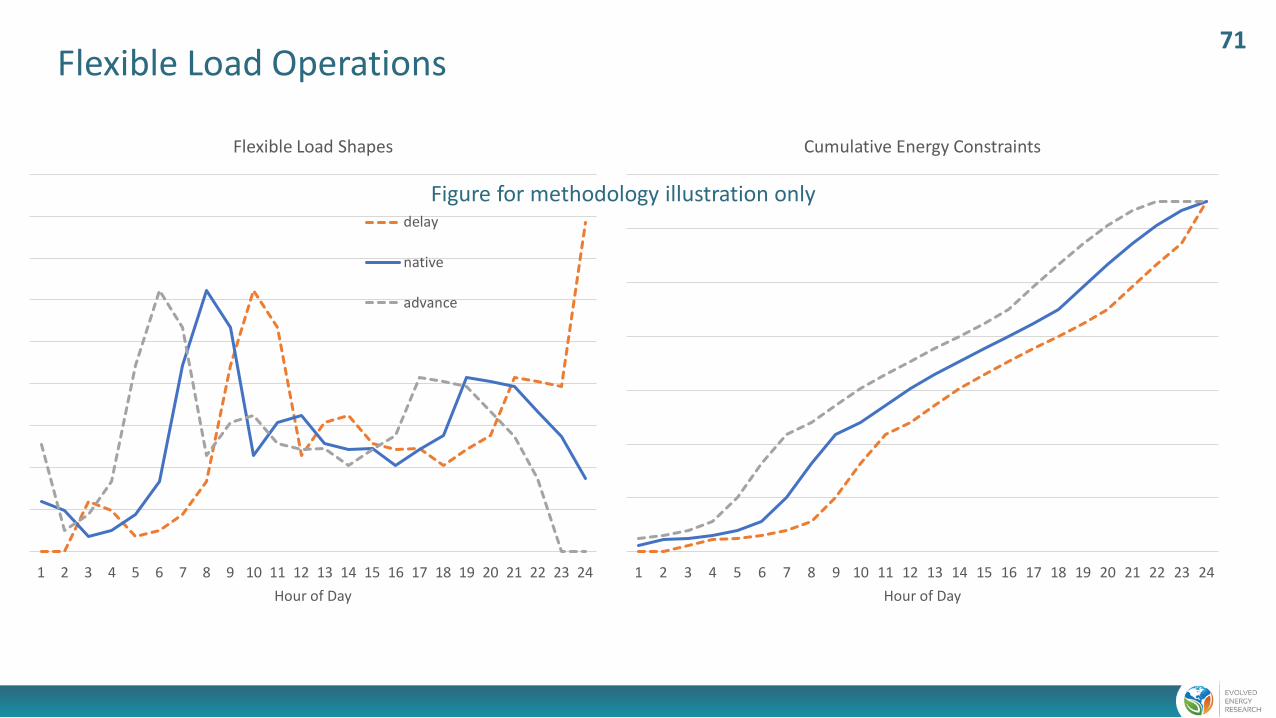
Flexible Load Operations
page 71
1 2 3 4 5 6 7 8 9 10 11 12 13 14 15 16 17 18 19 20 21 22 23 24
Hour of Day
Flexible Load Shapes
delay
native
advance
1 2 3 4 5 6 7 8 9 10 11 12 13 14 15 16 17 18 19 20 21 22 23 24
Hour of Day
Cumulative Energy Constraints
Figure for methodology illustration only
Cumulative energy constraints
71

Economic Generator Lifecycles
$-
$20.00
$40.00
$60.00
$80.00
$100.00
$120.00
2020 2021 2022 2023 2024 2025 2026 2027 2028 2029 2030 2031 2032 2033 2034 2035 2036 2037 2038 2039 2040 2041 2042 2043 2044 2045 2046 2047 2048 2049 2050
$/kW
-yea
r
New Plant Costs + Fixed OM Life Extension + Fixed OM Repower + Fixed OM Energy/Capacity/AS Value
page 72
Life Extension
Repowering
Retirement
RIO optimizes plant investment decisions including life extensions, repowering, and retirements based on system value and ongoing costs
Figure for methodology illustration only
72

Electricity and Fuels Sector Integration
page 73
Traditional capacity expansion approaches have narrowly defined their problem in
terms of the electric sector
Decarbonization and pushes towards 100% renewables has revealed the inadequacy of
that approach as both will require sectoral integration
A key opportunity for sectoral integration is in the fuel-supply sector, as it may be
counted on to provide low-carbon fuels for thermal generation/primary end uses and
provide electricity balancing services to the grid
Endogenizing decisions in both allows us to explore opportunities for sectoral
integration that have escaped other modeling frameworks
73

Daily Energy Imbalances
Renewable energy produced when the sun shines and
the wind blows
Inconvenient because it does not match production
exactly with load
Already happening in regions with significant renewable
penetration
Need to disconnect instantaneous load and supply
‒ Overgeneration conditions
‒ Diurnal energy storage opportunities
Load
0h 12h 24h
Renewable Energy
74
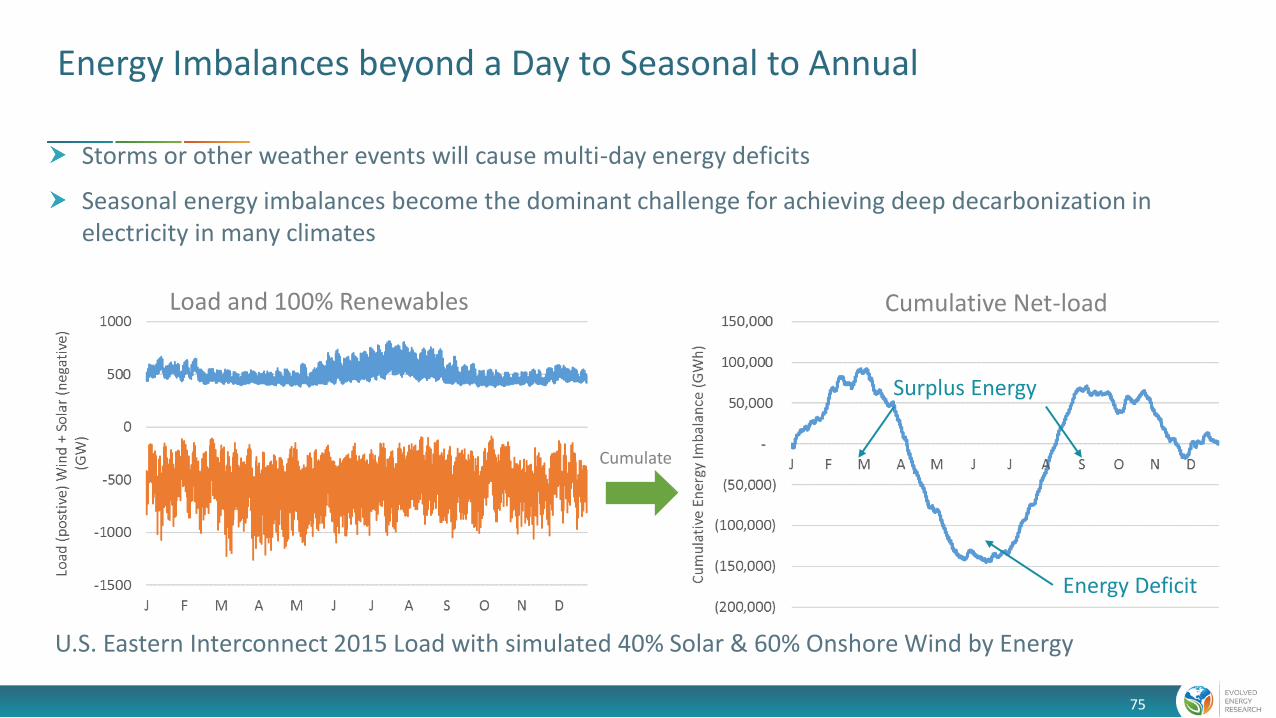
Energy Imbalances beyond a Day to Seasonal to Annual
Storms or other weather events will cause multi-day energy deficits
Seasonal energy imbalances become the dominant challenge for achieving deep decarbonization in electricity in many climates
U.S. Eastern Interconnect 2015 Load with simulated 40% Solar & 60% Onshore Wind by Energy
Surplus Energy
Energy Deficit
Cumulate
Cumulative Net-loadLoad and 100% Renewables
75

page 76
Storage
Transmission
Dispatchable Generation
Flexible Loads
Clean Energy Mix
Balancing Load and Supply in a Decarbonized System?76
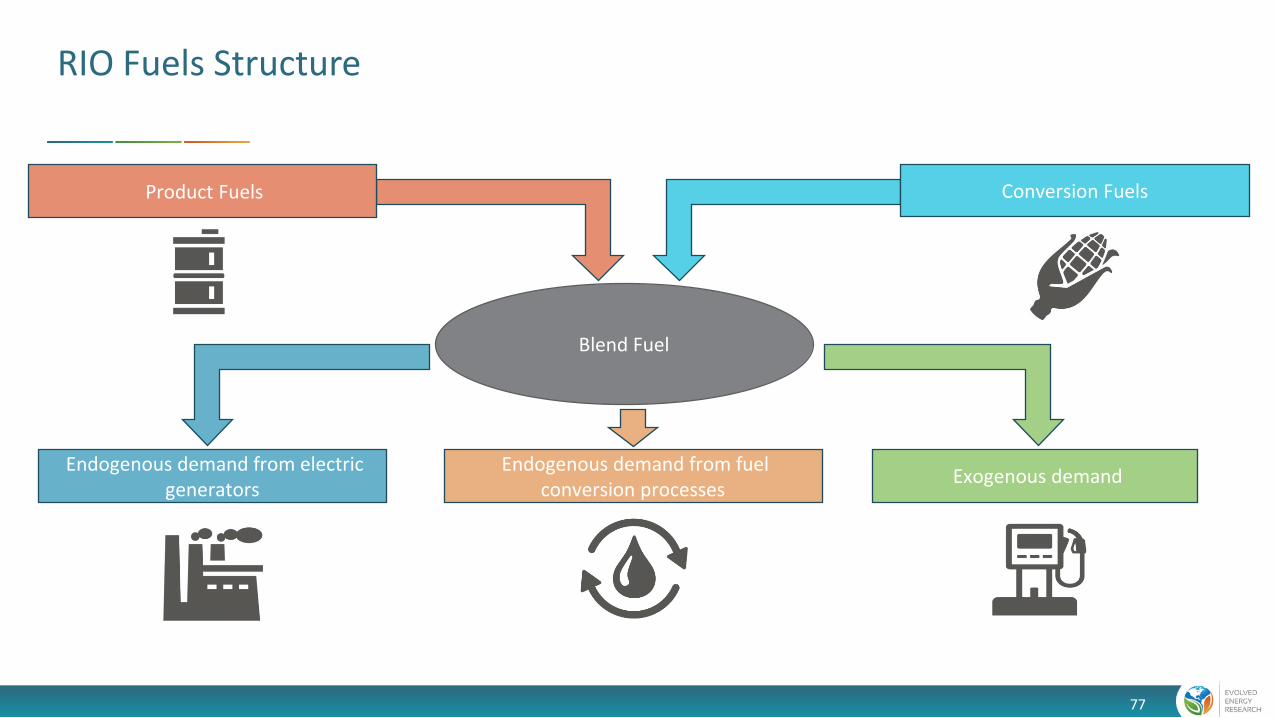
RIO Fuels Structure
Endogenous demand from electric generators
Endogenous demand from fuel conversion processes
Exogenous demand
Blend Fuel
Product Fuels Conversion Fuels
Optimally invest in fuels transportation, storage, and conversion infrastructure
77

Conventional means of “balancing” may not be
the most economic or meet clean energy goals
New opportunities: Storage and flexible loads
Fuels are another form of energy storage
Large flexible loads from producing
decarbonized fuels:
‒ Electrolysis, synthetic fuels production
Integrated Supply Side: Electricity and Fuels
Clean Energy
Source: CETI, NWDDP, 2019
78

ReliabilityReliable operations in a rapidly changing electricity system
79

Hourly Reserve Margin Constraints by Zone
page 80
Assessing Reliability Becomes Challenging in Low-Carbon Electricity Systems
Nameplate
15% PRM
Traditional Reserve Margin
Outage
1-in-2 Peak
1-in-10
Nameplate
Future System Reliability Assessment
Non-dispatchableresource availability
1-in-2 Peak
1-in-10DERs?
Dependency between timing of peak load and dispatchable resource
availability
Which DERs will be adopted and how will they be controlled?
Electrification leads to rapid load growth and changes in timing of
peak load
Installed renewable capacity is no longer a
good measure of dependability
Renewable ELCC is uncertain
Dynamic based on renewable build, DER adoption, and load growth patterns
Availability of energy limited
resources?
80
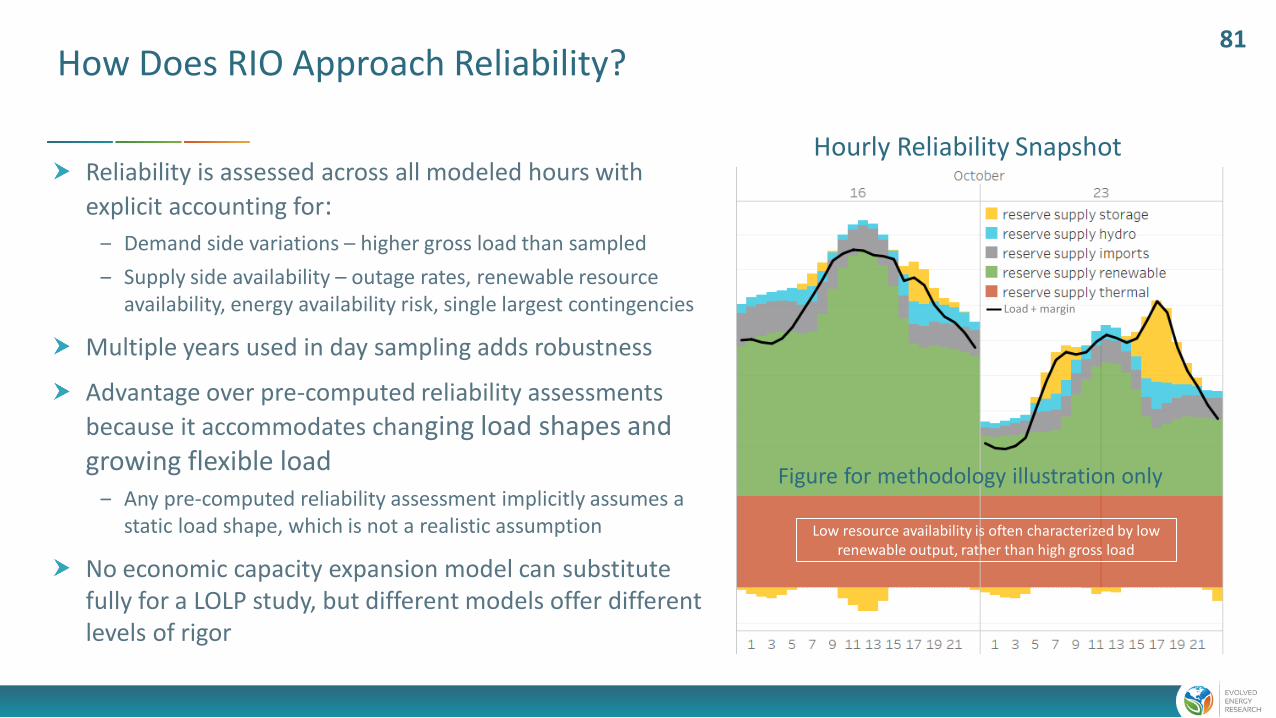
How Does RIO Approach Reliability?
page 81
Reliability is assessed across all modeled hours with
explicit accounting for:‒ Demand side variations – higher gross load than sampled
‒ Supply side availability – outage rates, renewable resource availability, energy availability risk, single largest contingencies
Multiple years used in day sampling adds robustness
Advantage over pre-computed reliability assessments
because it accommodates changing load shapes and growing flexible load
‒ Any pre-computed reliability assessment implicitly assumes a static load shape, which is not a realistic assumption
No economic capacity expansion model can substitute fully for a LOLP study, but different models offer different levels of rigor
Low resource availability is often characterized by low renewable output, rather than high gross load
Load + margin
Hourly Reliability Snapshot
Figure for methodology illustration only
81

Example Derates for Resources
page 82
Load/Resource Reliability contribution Description
Loads 106% Represents weather related risk of load exceeding that sampled
Thermal resources 80-95% Derated by generator forced outage rates
Renewable resources 70-90% of hourly production Additional 10-30% derate from hourly profiles comes from weather related risk and is informed by statistical analysis of multiple weather years
Hydro 95% of hourly production For energy limited resources, hourly production is used to ensure sustained peaking capability
Energy storage 95% of hourly production Similar to hydro, energy storage must demonstrate reliability through dispatch
Imports/Exports 0-100% of hourly interchange Depends on contractual arrangements and N-1 contingencies. By dispatching neighboring regions we ensure external resources will be available and still maintain reliability regionally.
82

Sourcing the data
83

Demand-subsectors
page 84
EnergyPATHWAYS database includes 67 subsectors
‒ Primary data-sources include:• Annual Energy Outlook 2020
inputs/outputs (AEO; EIA)
• Residential/Commercial Buildings/Manufacturing Energy Consumption Surveys (RECS/CBECS/MECS; EIA)
• State Energy Data System (SEDS; DOE)
• NREL
‒ 8 industrial process categories, 11 commercial building types, 3 residential building types
‒ 363 demand-side technologies w/ projections of cost (capital, installation, fuel-switching, O&M) and service efficiency
commercial air conditioningcommercial cookingcommercial lightingcommercial othercommercial refrigerationcommercial space heatingcommercial ventilationcommercial water heatingdistrict servicesoffice equipment (non-p.c.)office equipment (p.c.)aviationdomestic shippingfreight railheavy duty trucksinternational shippinglight duty autoslight duty truckslubricantsmedium duty trucksmilitary usemotorcycles
residential clothes washing
residential computers and relatedresidential cookingresidential dishwashingresidential freezingresidential furnace fansresidential lightingresidential other uses
residential refrigerationresidential secondary heating
residential space heatingresidential televisions and related
residential water heating
Cement and Lime CO2 Capture
Cement and Lime Non-Energy CO2Iron and Steel CO2 Capture
Other Non-Energy CO2Petrochemical CO2 Capture
agriculture-cropsagriculture-otheraluminum industrybalance of manufacturing other
food and kindred productsglass and glass products
iron and steelmachinery
metal and other non-metallic miningpaper and allied products
plastic and rubber productstransportation equipment
wood productsbulk chemicalscementcomputer and electronic productsconstructionelectrical equip., appliances, and components
passenger railrecreational boats
school and intercity buses
transit busesresidential air conditioningresidential building shellresidential clothes drying
84

Load Shape Sources
page 85
85
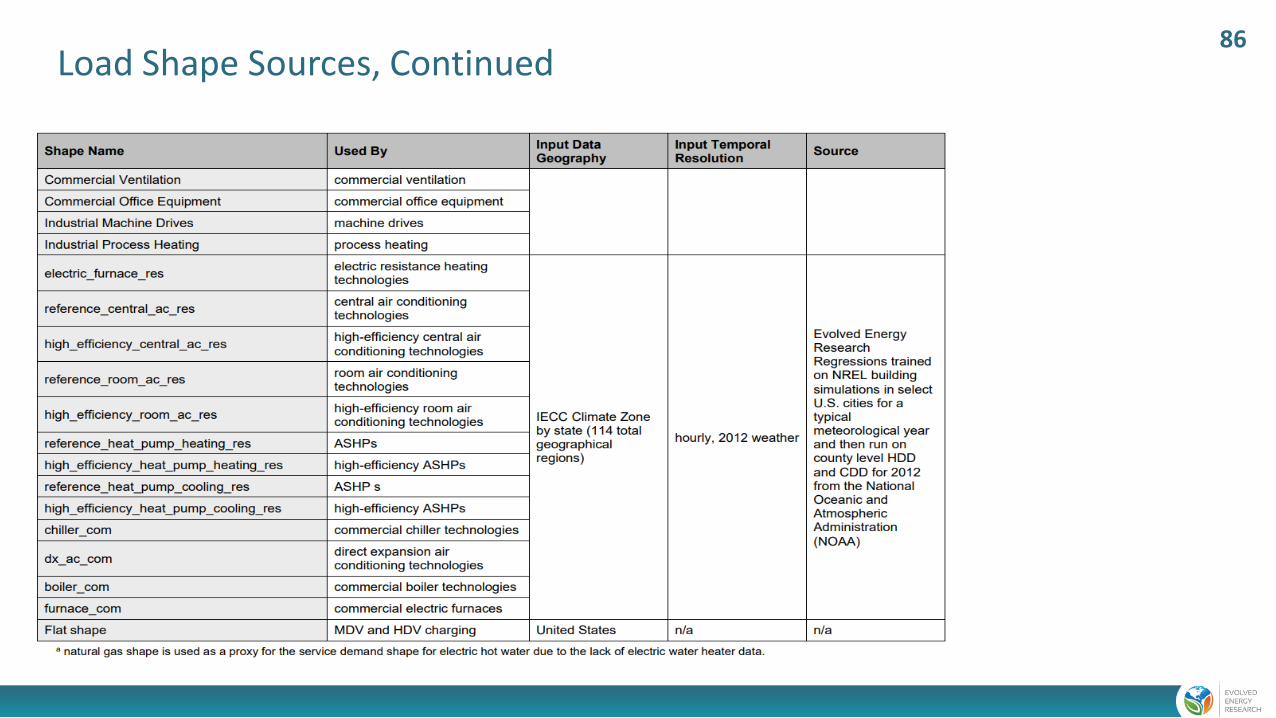
Load Shape Sources, Continued
page 86
86

Supply-Side Data
page 87
Data Category Data Description Supply Node SourceResource Potential Binned resource potential (GWh) by state
with associated resource performance (capacity factors) and transmission costs to reach load
Transmission – sited Solar PV; Onshore Wind; Offshore Wind; Geothermal
(Eurek et al. 2017)
Resource Potential Binned resource potential of biomass resources by state with associated costs
Biomass Primary – Herbaceous; Biomass Primary –Wood; Biomass Primary – Waste; Biomass Primary –Corn
(Langholtz, Stokes, and Eaton 2016)
Resource Potential Binned annual carbon sequestration injection potential by state with associated costs
Carbon Sequestration (U.S. Department of Energy: National Energy Technology Laboratory 2017)
Resource Potential Domestic production potential of natural gas Natural Gas Primary – Domestic (U.S. Energy Information Administration 2020)
Resource Potential Domestic production potential of oil Oil Primary – Domestic (U.S. Energy Information Administration 2020)
Product Costs Commodity cost of natural gas at Henry Hub Natural Gas Primary – Domestic (U.S. Energy Information Administration 2020)
Product Costs Undelivered costs of refined fossil products Refined Fossil Diesel; Refined Fossil Jet Fuel; Refined Fossil Kerosene; Refined Fossil Gasoline; Refined Fossil LPG
(U.S. Energy Information Administration 2020)
Product Costs Commodity cost of Brent oil Oil Primary – Domestic; Oil Primary - International (U.S. Energy Information Administration 2020)
Delivery Infrastructure Costs AEO transmission and delivery costs by EMM region
Electricity Transmission Grid; Electricity Distribution Grid
(U.S. Energy Information Administration 2020)
Delivery Infrastructure Costs AEO transmission and delivery costs by census division and sector
Gas Transmission Pipeline; Gas Distribution Pipeline (U.S. Energy Information Administration 2020)
Delivery Infrastructure AEO delivery costs by fuel product Gasoline Delivery; Diesel Delivery; Jet Fuel; LPG Fuel Delivery; Kerosene Delivery
(U.S. Energy Information Administration 2020)
87

Supply-Side Data Continued
page 88
Data Category Data Description Supply Node SourceTechnology Cost and Performance Renewable and conventional electric
technology installed cost projectionsNuclear Power Plants; Onshore Wind Power Plants; Offshore Wind Power Plants; Transmission – Sited Solar PV Power Plants; Distribution – Sited Solar PV Power Plants; Rooftop PV Solar Power Plants; Combined –Cycle Gas Turbines; Coal Power Plants; Combined – Cycle Gas Power Plants with CCS; Coal Power Plants with CCS; Gas Combustion Turbines
(National Renewable Energy Laboratory 2020)
Technology Cost and Performance Electric fuel cost projections including electrolysis and fuel synthesis facilities
Central Hydrogen Grid Electrolysis; Power –To – Diesel; Power – To – Jet Fuel; Power – To – Gas Production Facilities
(Capros et al. 2018)
Technology Cost and Performance Hydrogen Gas Reformation costs with and without carbon capture
H2 Natural Gas Reformation; H2 Natural Gas Reformation w/CCS
(International Energy Agency GHG Programme 2017)
Technology Cost and Performance Nth plant Direct air capture costs for sequestration and utilization
Direct Air Capture with Sequestration; Direct Air Capture with Utilization
(Keith et al. 2018)
Technology Cost and Performance Gasification cost and efficiency of conversion including gas upgrading.
Biomass Gasification; Biomass Gasification with CCS
(G. del Alamo et al. 2015)
Technology Cost and Performance Cost and efficiency of renewable Fischer-Tropsch diesel production.
Renewable Diesel; Renewable Diesel with CCS
(G. del Alamo et al. 2015)
Technology Cost and Performance Cost and efficiency of industrial boilers Electric Boilers; Other Boilers (Capros et al. 2018)
Technology Cost and Performance Cost and efficiency of other, existing power plant types
Fossil Steam Turbines; Coal Power Plants (Johnson et al. 2006)
88

Impact of Covid-19
• None of the long-term forecasts include Covid impacts
• Long-term versus short-term
• Changes to near-term adoption rates of new technologies
‒ Impacts on consumer spending for new appliances, vehicles etc.?
‒ Accelerated action later? Delayed electrification?
‒ Opportunity for economic development in post-Covid environment?
• Impact on fuel prices
‒ Supply and demand imbalance
89

Key Results
Examples of how results are presented
90

Fuels and Infrastructure Investment vs. Business and Usual
• A reference scenario is needed
because business-as-usual is not zero-
cost.
• Total cost to meet clean energy goals
are offset by avoided BAU costs such
as fossil fuels
‒ Actual Montana avoided costs, not social cost of carbon
• Annual costs compare clean energy
policy versus the alternative
20
45
20
20
20
25
20
30
20
35
20
40
20
50
An
nu
al N
et C
ost
s $
Bill
ion
s
$0B
($XB)
$XB Biofuels plants
Demand-side equipment
Low Carbon Gen
Biomass
Electricity Grid
Electric Fuels
Other
Gas, Oil, and Refined Products
Cost increase over reference case
Avoided costs
Costs
Annual Net Energy Costs: Example Clean Energy Scenario
Figure for illustration purposes only
91
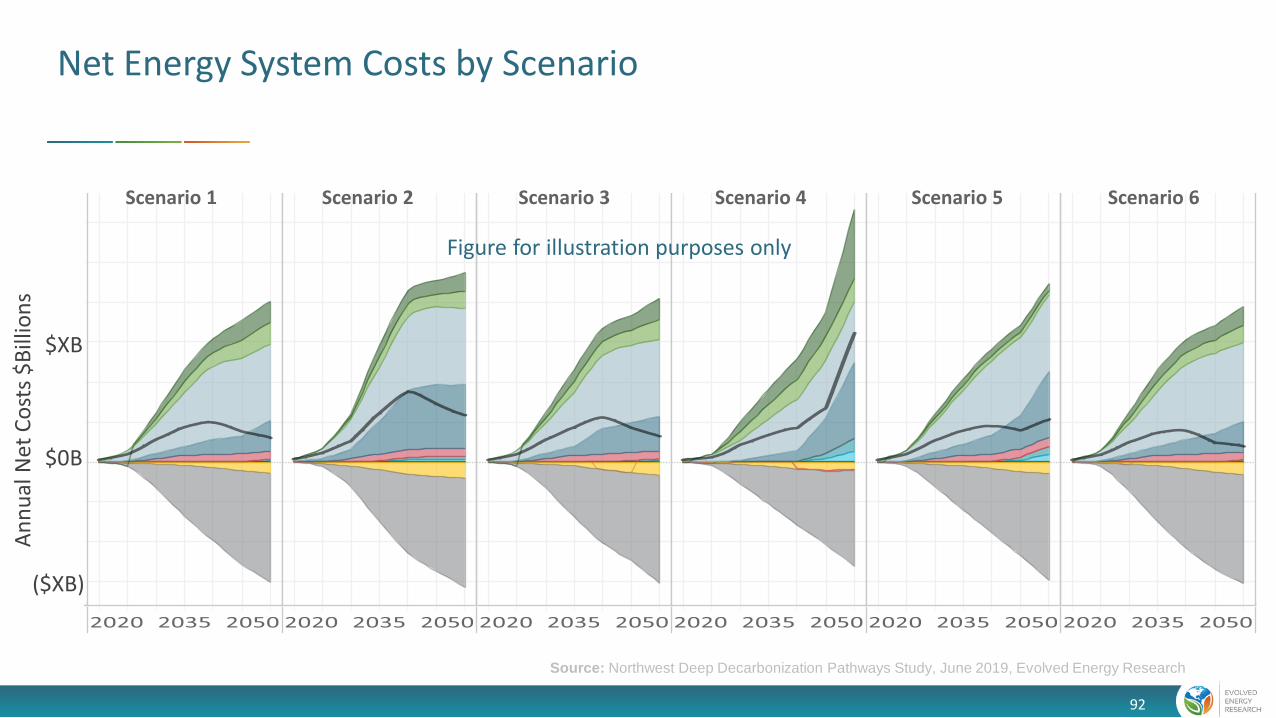
Net Energy System Costs by Scenario
Source: Northwest Deep Decarbonization Pathways Study, June 2019, Evolved Energy Research
An
nu
al N
et C
ost
s $
Bill
ion
s
$0B
($XB)
$XB
Scenario 1 Scenario 2 Scenario 3 Scenario 4 Scenario 5 Scenario 6
Figure for illustration purposes only
92

Source: Northwest Deep Decarbonization Pathways Study, June 2019, Evolved Energy Research
What Are the Least Cost Strategies that Policy Should Target?
Figure for illustration purposes only
93
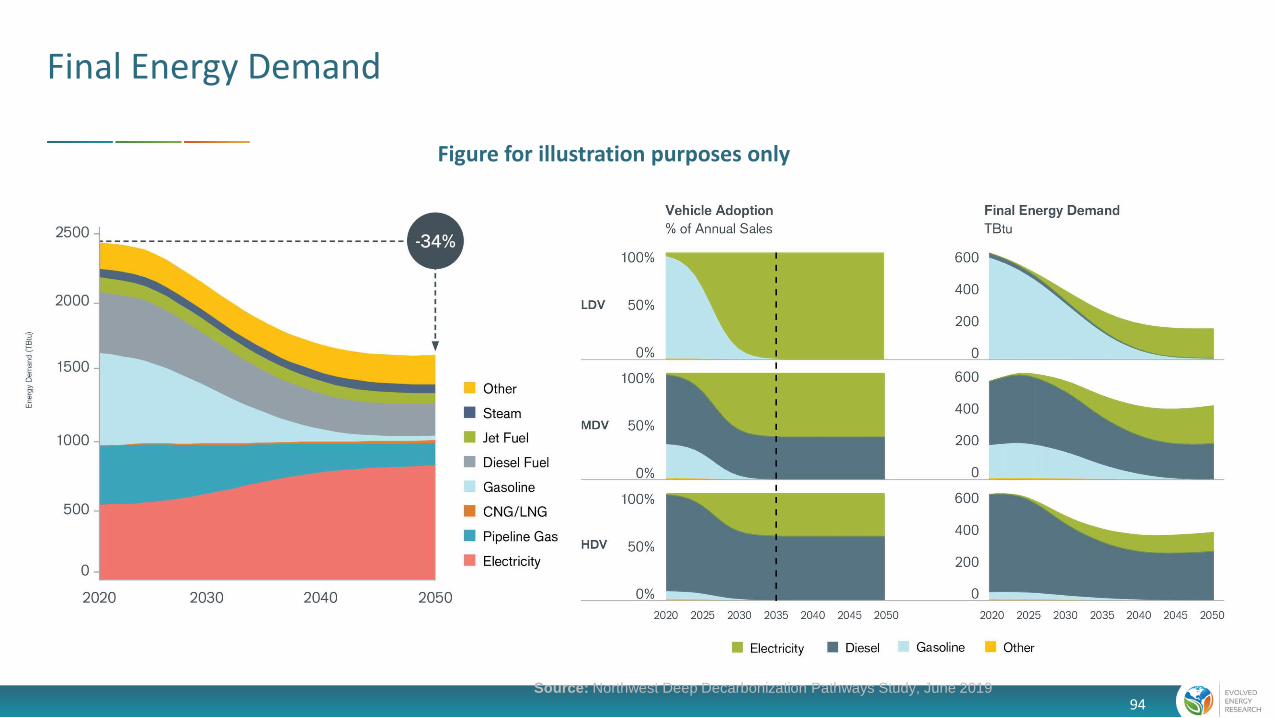
Final Energy Demand
Source: Northwest Deep Decarbonization Pathways Study, June 2019
Figure for illustration purposes only
94

Energy Supply: Electricity Generation
Source: Northwest Deep Decarbonization Pathways Study, June 2019
Figure for illustration purposes only
95

Energy Supply: Liquid and Gaseous Fuel Composition Over Time
Source: Northwest Deep Decarbonization Pathways Study, June 2019
96
Figure for illustration purposes only
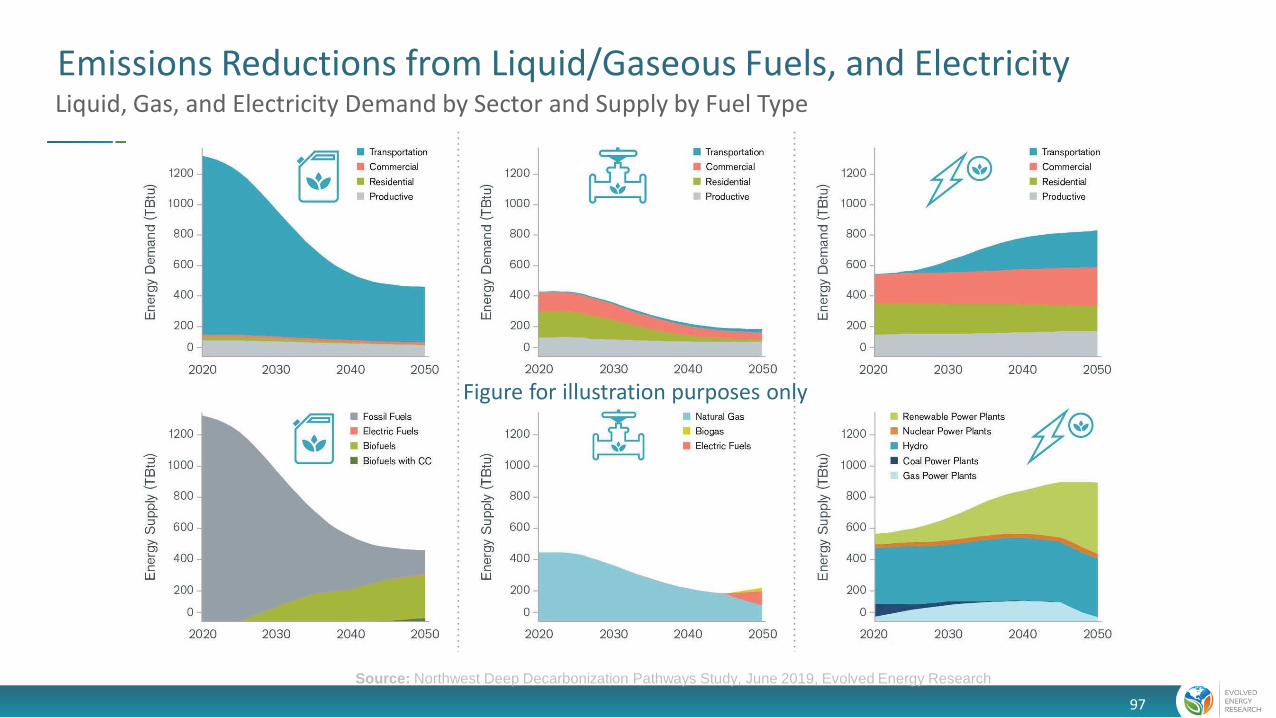
Emissions Reductions from Liquid/Gaseous Fuels, and ElectricityLiquid, Gas, and Electricity Demand by Sector and Supply by Fuel Type
Source: Northwest Deep Decarbonization Pathways Study, June 2019, Evolved Energy Research
Figure for illustration purposes only
97
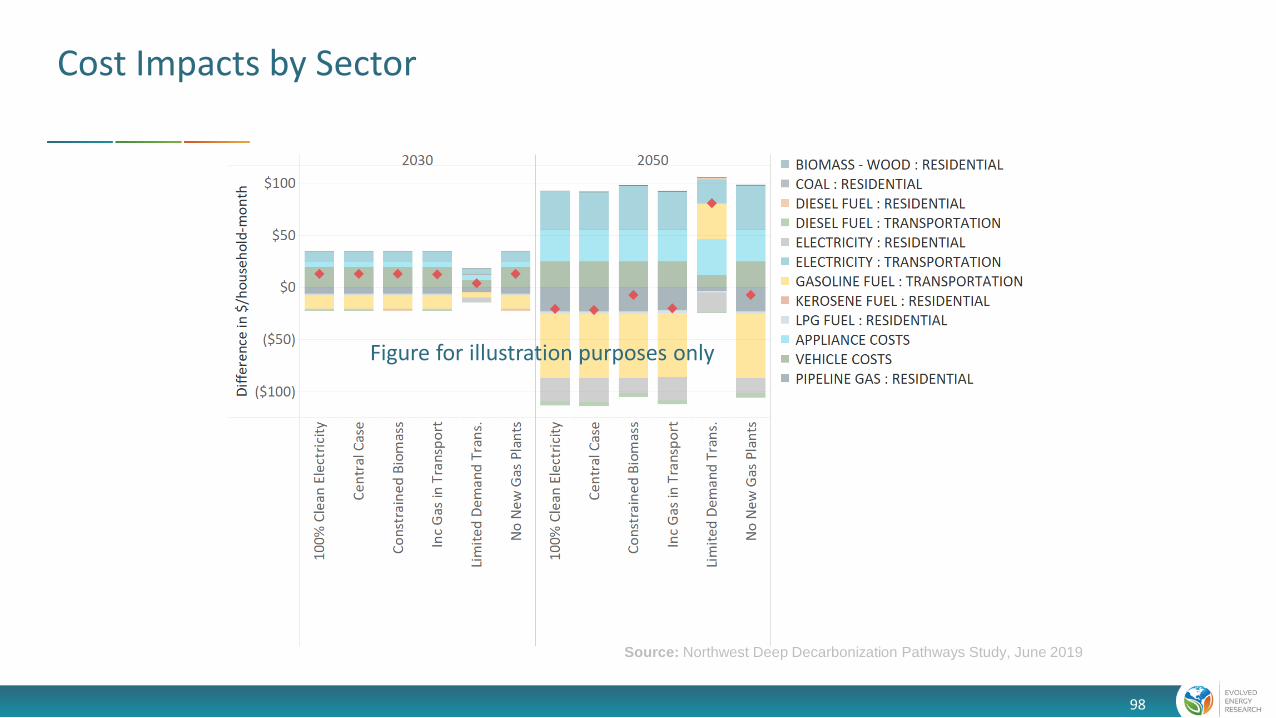
Cost Impacts by Sector
Source: Northwest Deep Decarbonization Pathways Study, June 2019
Figure for illustration purposes only
98


