141 30th WEDC International Conference, Vientiane, Lao PDR, 2004 PEOPLE-CENTRED APPROACHES TO WATER AND ENVIRONMENTAL SANITATION Effluent quality control in small Biological Process Treating Domestic Wastewater A.M. Shahalam, Kuwait The problem of fluctuating influent flow and pollution concentration is a serious concern in small wastewater treatment plants. In this study, a simple mathematical simulation of an activated sludge process has been utilized to derive opera- tional controls to stabilize process disturbance effects on effluent quality. The sensitivity of the model has been tested for several factors known to have significant variability with time and occasion. The variable factors were chosen from previ- ous operational records of a small-scale process. The model was tested on a small process serving a university campus through extreme flow and pollutant conditions. Data collected during the applications of the controls was used to test the effectiveness of the model. The results were encouraging. Small institutions, organization and towns very often use Activated Sludge Process (ASP) to treat wastewater, as the process is economical and easy to operate. Usually these biological systems operate as extended aeration process with treatment up to secondary level. Small treatment processes serving particularly university campuses, hospitals and oil fields are prone to shocks from large variations in influent flow rate and waste concentrations resulting from variations in number of users and organization activities (Shahalam and Abbassi, 1990). The effluent of many of such processes is very often used for irrigation purposes, which require reli- able and steady quality of the effluent water. Traditionally experienced operators of plants control the rate of recycle flow to the aerator to dampen the effect of inflow shocks on the effluent quality (Shahalam and Angelbeck, 1978). A built physical system has its limitations on microbial mass that it may effectively maintain in the aeration tank and the extent of solids compaction that it may achieve in the clarifier (Shahalam and Angelbeck, 1978). These limita- tions are mostly determined by the size of the aeration tank, aeration equipment, oxygen transfer capacity, pump capacity, and the size and shape of the clarifier. Solids compaction factor, which affects the amount of microorganism return to aerator by recycling, is directly a function of solids wast- age rate and the rate of recycle flow from the bottom of the clarifier. In the process, the operators often face decision problems of determining proper recycle and sludge wastage rates. Among many controls available, the controls of sludge recycle and wastage appear to be the most practical and easy-to-apply (Shahalam and Angelbeck, 1978; Shahalam and Abbassi, 1990). This paper deals with a methodology of determining the proper recycle and wastage rates when a system experiences inflow shocks. System control functions Figure 1 shows a conventional activated sludge process with sludge recycle and wastage from the bottom of the clarifier. Mathematical representation at steady state conditions were used to express the control factors of recycle and sludge wastage rate. Figure 1. Extended Aeration Activated Sludge System Substrate mass balance under steady state condition provides Equation 1. S = [ S o / ( 1 + R ) ] / [ 1 + {Kθ /K s } X ] [1] Equation [1] is derived with an assumption that the “S” is very small in comparison to K s . For a desired value of S, the equation may be used to determine X (Equation 2). X = [K s {( S o /((1+R) S) ) – 1}] / Kθ [2] where S o = Influent substrate concentration, mg/l BOD 5 , S = Effluent substrate concentration (mg/l BOD 5 ), K = Maximum substrate degradation rate constant (per day) in the degradation rate expression: (KS)/(K s + S), θ = Aera- tor hydraulic detention time (V/ ( Q + Q r )), V = Volume of the aerator (m 3 ), Q = Influent flow rate (m 3 /day), Q r = Recycle flow rate (m 3 /day), K s = Substrate concentra-
Transcript
SHAHALAM
141
30th WEDC International Conference, Vientiane, Lao PDR, 2004
PEOPLE-CENTRED APPROACHES TO WATER AND ENVIRONMENTAL SANITATION
Effl uent quality control in small Biological Process Treating Domestic Wastewater
A.M. Shahalam, Kuwait
The problem of fl uctuating infl uent fl ow and pollution concentration is a serious concern in small wastewater treatment plants. In this study, a simple mathematical simulation of an activated sludge process has been utilized to derive opera-tional controls to stabilize process disturbance effects on effl uent quality. The sensitivity of the model has been tested for several factors known to have signifi cant variability with time and occasion. The variable factors were chosen from previ-ous operational records of a small-scale process. The model was tested on a small process serving a university campus through extreme fl ow and pollutant conditions. Data collected during the applications of the controls was used to test the effectiveness of the model. The results were encouraging.
Small institutions, organization and towns very often use Activated Sludge Process (ASP) to treat wastewater, as the process is economical and easy to operate. Usually these biological systems operate as extended aeration process with treatment up to secondary level. Small treatment processes serving particularly university campuses, hospitals and oil fi elds are prone to shocks from large variations in infl uent fl ow rate and waste concentrations resulting from variations in number of users and organization activities (Shahalam and Abbassi, 1990). The effl uent of many of such processes is very often used for irrigation purposes, which require reli-able and steady quality of the effl uent water. Traditionally experienced operators of plants control the rate of recycle fl ow to the aerator to dampen the effect of infl ow shocks on the effl uent quality (Shahalam and Angelbeck, 1978).
A built physical system has its limitations on microbial mass that it may effectively maintain in the aeration tank and the extent of solids compaction that it may achieve in the clarifi er (Shahalam and Angelbeck, 1978). These limita-tions are mostly determined by the size of the aeration tank, aeration equipment, oxygen transfer capacity, pump capacity, and the size and shape of the clarifi er. Solids compaction factor, which affects the amount of microorganism return to aerator by recycling, is directly a function of solids wast-age rate and the rate of recycle fl ow from the bottom of the clarifi er. In the process, the operators often face decision problems of determining proper recycle and sludge wastage rates. Among many controls available, the controls of sludge recycle and wastage appear to be the most practical and easy-to-apply (Shahalam and Angelbeck, 1978; Shahalam and Abbassi, 1990).
This paper deals with a methodology of determining the proper recycle and wastage rates when a system experiences infl ow shocks.
System control functionsFigure 1 shows a conventional activated sludge process with sludge recycle and wastage from the bottom of the clarifi er. Mathematical representation at steady state conditions were used to express the control factors of recycle and sludge wastage rate.
Figure 1. Extended Aeration Activated Sludge System
Substrate mass balance under steady state condition provides Equation 1.S = [ S o / ( 1 + R ) ] / [ 1 + {Kθ /K s } X ] [1]Equation [1] is derived with an assumption that the “S” is very small in comparison to Ks. For a desired value of S, the equation may be used to determine X (Equation 2).
X = [K s {( S o /((1+R) S) ) – 1}] / Kθ [2]where S o = Infl uent substrate concentration, mg/l BOD5, S = Effl uent substrate concentration (mg/l BOD5), K = Maximum substrate degradation rate constant (per day) in the degradation rate expression: (KS)/(Ks + S), θ = Aera-tor hydraulic detention time (V/ ( Q + Q r )), V = Volume of the aerator (m3), Q = Infl uent fl ow rate (m3/day), Q r = Recycle fl ow rate (m3/day), Ks = Substrate concentra-
SHAHALAM
142
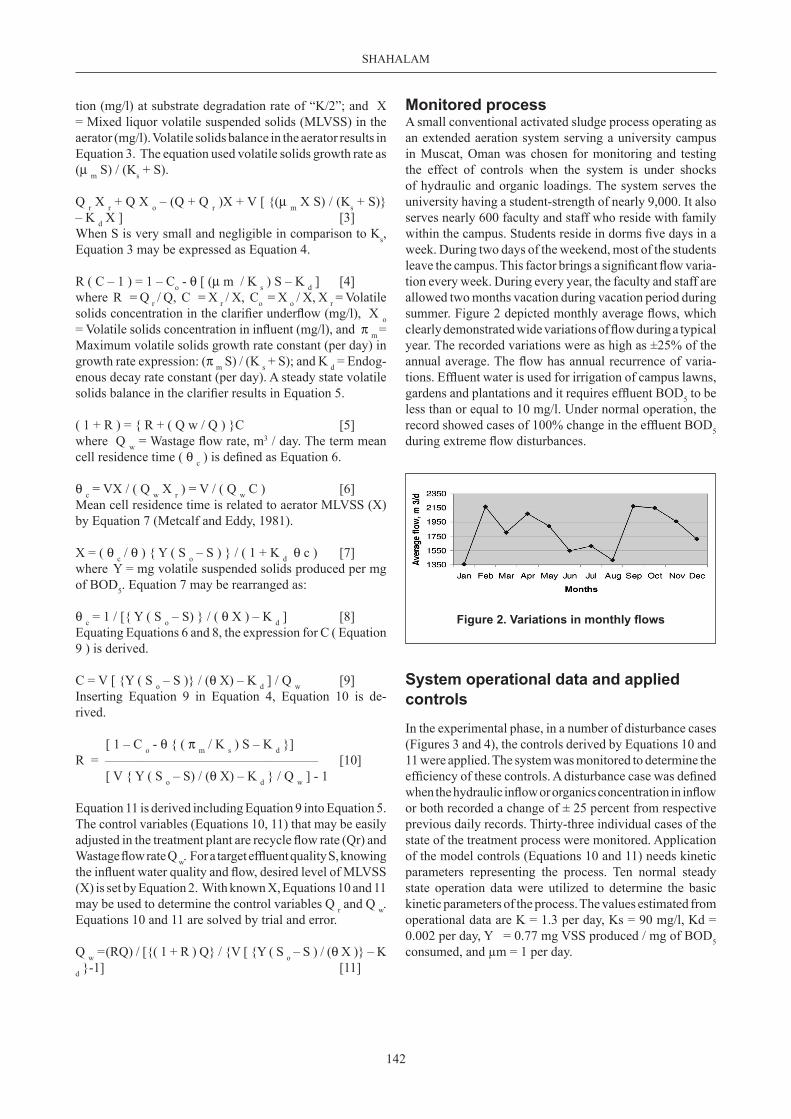
Figure 2. Variations in monthly fl ows
tion (mg/l) at substrate degradation rate of “K/2”; and X = Mixed liquor volatile suspended solids (MLVSS) in the aerator (mg/l). Volatile solids balance in the aerator results in Equation 3. The equation used volatile solids growth rate as (µ m S) / (Ks + S).
Q r X r + Q X o – (Q + Q r )X + V [ {(µ m X S) / (Ks + S)} – K d X ] [3]When S is very small and negligible in comparison to Ks, Equation 3 may be expressed as Equation 4.
R ( C – 1 ) = 1 – Co - θ [ (µ m / K s ) S – K d ] [4]where R = Q r / Q, C = X r / X, Co = X o / X, X r = Volatile solids concentration in the clarifi er underfl ow (mg/l), X o = Volatile solids concentration in infl uent (mg/l), and π m = Maximum volatile solids growth rate constant (per day) in growth rate expression: (π m S) / (K s + S); and K d = Endog-enous decay rate constant (per day). A steady state volatile solids balance in the clarifi er results in Equation 5.
( 1 + R ) = { R + ( Q w / Q ) }C [5]where Q w = Wastage fl ow rate, m3 / day. The term mean cell residence time ( θ c ) is defi ned as Equation 6.
θ c = VX / ( Q w X r ) = V / ( Q w C ) [6]Mean cell residence time is related to aerator MLVSS (X) by Equation 7 (Metcalf and Eddy, 1981).
X = ( θ c / θ ) { Y ( S o – S ) } / ( 1 + K d θ c ) [7]where Y = mg volatile suspended solids produced per mg of BOD5. Equation 7 may be rearranged as:
θ c = 1 / [{ Y ( S o – S) } / ( θ X ) – K d ] [8]Equating Equations 6 and 8, the expression for C ( Equation 9 ) is derived.
C = V [ {Y ( S o – S )} / (θ X) – K d ] / Q w [9]Inserting Equation 9 in Equation 4, Equation 10 is de-rived.
[ 1 – C o - θ { ( π m / K s ) S – K d }] R = _______________________________________________________ [10] [ V { Y ( S o – S) / (θ X) – K d } / Q w ] - 1
Equation 11 is derived including Equation 9 into Equation 5. The control variables (Equations 10, 11) that may be easily adjusted in the treatment plant are recycle fl ow rate (Qr) and Wastage fl ow rate Q w. For a target effl uent quality S, knowing the infl uent water quality and fl ow, desired level of MLVSS (X) is set by Equation 2. With known X, Equations 10 and 11 may be used to determine the control variables Q r and Q w. Equations 10 and 11 are solved by trial and error.
Q w = (RQ) / [{( 1 + R ) Q} / {V [ {Y ( S o – S ) / (θ X )} – K d }-1] [11]
Monitored processA small conventional activated sludge process operating as an extended aeration system serving a university campus in Muscat, Oman was chosen for monitoring and testing the effect of controls when the system is under shocks of hydraulic and organic loadings. The system serves the university having a student-strength of nearly 9,000. It also serves nearly 600 faculty and staff who reside with family within the campus. Students reside in dorms fi ve days in a week. During two days of the weekend, most of the students leave the campus. This factor brings a signifi cant fl ow varia-tion every week. During every year, the faculty and staff are allowed two months vacation during vacation period during summer. Figure 2 depicted monthly average fl ows, which clearly demonstrated wide variations of fl ow during a typical year. The recorded variations were as high as ±25% of the annual average. The fl ow has annual recurrence of varia-tions. Effl uent water is used for irrigation of campus lawns, gardens and plantations and it requires effl uent BOD5 to be less than or equal to 10 mg/l. Under normal operation, the record showed cases of 100% change in the effl uent BOD5 during extreme fl ow disturbances.
System operational data and applied controls
In the experimental phase, in a number of disturbance cases (Figures 3 and 4), the controls derived by Equations 10 and 11 were applied. The system was monitored to determine the effi ciency of these controls. A disturbance case was defi ned when the hydraulic infl ow or organics concentration in infl ow or both recorded a change of ± 25 percent from respective previous daily records. Thirty-three individual cases of the state of the treatment process were monitored. Application of the model controls (Equations 10 and 11) needs kinetic parameters representing the process. Ten normal steady state operation data were utilized to determine the basic kinetic parameters of the process. The values estimated from operational data are K = 1.3 per day, Ks = 90 mg/l, Kd = 0.002 per day, Y = 0.77 mg VSS produced / mg of BOD5 consumed, and µm = 1 per day.
SHAHALAM
143
The aerator has a volume of 1654 cubic meter. One-year data of 2001 indicated an average hydraulic detention time of 0.55 days with the maximum of 0.973 day and minimum of 0.33 days. The standard deviation is 0.22 day. The recycle average was 75 percent of plant infl ow while the maximum and minimum were 100 and 25 respectively. During a disturbance, infl uent fl ow and BOD5 along with normal kinetic parameters were utilized in Equations 10 and 11 to determine appropriate controls of recycle and sludge wastage. Operators applied the controls adjusting the recycle and wastage pumping rates. Control effectiveness was measured comparing predicted and measured values of effl uent BOD5 (S), aerator biomass (X in Equation 7) and clarifi er compaction factor (C in Equation 9). The predicted and observed values of S, X and C appeared in Figures 5, 6 and 7 respectively.
DiscussionAnnual average infl ow of past one year was 1823 m3/day. The maximum and minimum of the disturbance cases were 2512 and 1161 m3/day respectively. The variation cases
Figure 3. Infl ow in selected disturbance cases
Figure 4. Infl ow BOD5 in selected disturbance cases
Figure 5. Predicted vs. Measured effl uent BOD5 (S)
Figure 6. Targetted vs. measured
cover one-year operation of the plant. Annual average in-fl ow-BOD5 of past one year was 262 mg/l. The maximum and minimum of the disturbance cases were 298 and 220 mg/l respectively.
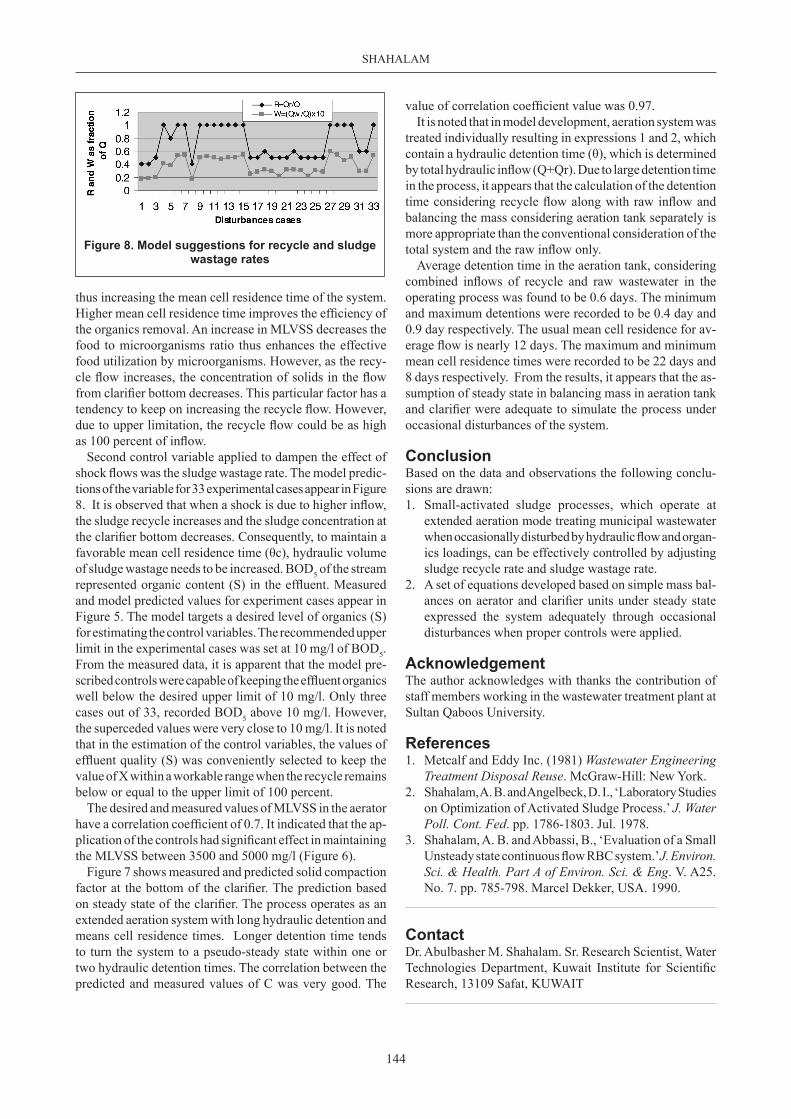
Figure 8 contains the values of model predictions of control variable sludge-recycle for experimental cases. The return rate of pumping for each case was adjusted to the model prediction value and was maintained at that stage until at least a change of 25 percent of the initial infl ow rate is recorded. A change of 25 percent in an existing fl ow within 24 hours prompts for calculating a new set of control variables. The “25 percent” was selected for this purpose somewhat arbitrarily with some rational of standard devia-tion and average infl ow rate of past fl ow records. Standard deviation and the average of past year infl ow were 431 and 1823 m3/day respectively.
Maximum allowable value of recycle was 100 percent of the infl uent fl ow rate determined from the existing sludge pumping capacity. System functions predicted an increase in the recycle when the infl ow increased. Due to the physical limitation of the concentration of mixed liquor suspended solids (X) in the aerator to be within a range of 4000-5000 mg/l, the values of control variables of sludge recycle and wastage were also constrained for satisfying the requirement. The range of X was determined from previous records of MLVSS level in the aerator. Air pump capacity and limitation of oxygen transfer constraint MLVSS level in the aerator.
An increase in the recycle fl ow tends to retain higher concentration of MLVSS in the aerator and total system
Figure 7. Predicted vs. Measured values of solids compaction factor in the clarifi er, C=(Xr/X)
SHAHALAM
144
thus increasing the mean cell residence time of the system. Higher mean cell residence time improves the effi ciency of the organics removal. An increase in MLVSS decreases the food to microorganisms ratio thus enhances the effective food utilization by microorganisms. However, as the recy-cle fl ow increases, the concentration of solids in the fl ow from clarifi er bottom decreases. This particular factor has a tendency to keep on increasing the recycle fl ow. However, due to upper limitation, the recycle fl ow could be as high as 100 percent of infl ow.
Second control variable applied to dampen the effect of shock fl ows was the sludge wastage rate. The model predic-tions of the variable for 33 experimental cases appear in Figure 8. It is observed that when a shock is due to higher infl ow, the sludge recycle increases and the sludge concentration at the clarifi er bottom decreases. Consequently, to maintain a favorable mean cell residence time (θc), hydraulic volume of sludge wastage needs to be increased. BOD5 of the stream represented organic content (S) in the effl uent. Measured and model predicted values for experiment cases appear in Figure 5. The model targets a desired level of organics (S) for estimating the control variables. The recommended upper limit in the experimental cases was set at 10 mg/l of BOD5. From the measured data, it is apparent that the model pre-scribed controls were capable of keeping the effl uent organics well below the desired upper limit of 10 mg/l. Only three cases out of 33, recorded BOD5 above 10 mg/l. However, the superceded values were very close to 10 mg/l. It is noted that in the estimation of the control variables, the values of effl uent quality (S) was conveniently selected to keep the value of X within a workable range when the recycle remains below or equal to the upper limit of 100 percent.
The desired and measured values of MLVSS in the aerator have a correlation coeffi cient of 0.7. It indicated that the ap-plication of the controls had signifi cant effect in maintaining the MLVSS between 3500 and 5000 mg/l (Figure 6).
Figure 7 shows measured and predicted solid compaction factor at the bottom of the clarifi er. The prediction based on steady state of the clarifi er. The process operates as an extended aeration system with long hydraulic detention and means cell residence times. Longer detention time tends to turn the system to a pseudo-steady state within one or two hydraulic detention times. The correlation between the predicted and measured values of C was very good. The
value of correlation coeffi cient value was 0.97. It is noted that in model development, aeration system was
treated individually resulting in expressions 1 and 2, which contain a hydraulic detention time (θ), which is determined by total hydraulic infl ow (Q+Qr). Due to large detention time in the process, it appears that the calculation of the detention time considering recycle fl ow along with raw infl ow and balancing the mass considering aeration tank separately is more appropriate than the conventional consideration of the total system and the raw infl ow only.
Average detention time in the aeration tank, considering combined infl ows of recycle and raw wastewater in the operating process was found to be 0.6 days. The minimum and maximum detentions were recorded to be 0.4 day and 0.9 day respectively. The usual mean cell residence for av-erage fl ow is nearly 12 days. The maximum and minimum mean cell residence times were recorded to be 22 days and 8 days respectively. From the results, it appears that the as-sumption of steady state in balancing mass in aeration tank and clarifi er were adequate to simulate the process under occasional disturbances of the system.
ConclusionBased on the data and observations the following conclu-sions are drawn:1. Small-activated sludge processes, which operate at
extended aeration mode treating municipal wastewater when occasionally disturbed by hydraulic fl ow and organ-ics loadings, can be effectively controlled by adjusting sludge recycle rate and sludge wastage rate.
2. A set of equations developed based on simple mass bal-ances on aerator and clarifi er units under steady state expressed the system adequately through occasional disturbances when proper controls were applied.
AcknowledgementThe author acknowledges with thanks the contribution of staff members working in the wastewater treatment plant at Sultan Qaboos University.
References1. Metcalf and Eddy Inc. (1981) Wastewater Engineering
Treatment Disposal Reuse. McGraw-Hill: New York.2. Shahalam, A. B. and Angelbeck, D. I., ‘Laboratory Studies
on Optimization of Activated Sludge Process.’ J. Water Poll. Cont. Fed. pp. 1786-1803. Jul. 1978.
3. Shahalam, A. B. and Abbassi, B., ‘Evaluation of a Small Unsteady state continuous fl ow RBC system.’ J. Environ. Sci. & Health. Part A of Environ. Sci. & Eng. V. A25. No. 7. pp. 785-798. Marcel Dekker, USA. 1990.
ContactDr. Abulbasher M. Shahalam. Sr. Research Scientist, Water Technologies Department, Kuwait Institute for Scientifi c Research, 13109 Safat, KUWAIT
Figure 8. Model suggestions for recycle and sludge wastage rates


![Generating Visual Explanations...Recent deep models [37,7,18,40,19,9,28] outperform such systems and produce uent, accu-rate descriptions. Though most description models condition](https://static.documents.pub/doc/80x56/5f6723ffaa524a63637f7763/generating-visual-explanations-recent-deep-models-377184019928-outperform.jpg)


![DOC UENT RESU E - Government Accountability Office · DOC UENT RESU E 05721 - Bl1025969] Questionable leed for Some Department of Labor Training Proqrams. HRD-78-4; B-163922. April](https://static.documents.pub/doc/80x56/5fbd7472380be40a781bea8a/doc-uent-resu-e-government-accountability-office-doc-uent-resu-e-05721-bl1025969.jpg)


