9
In the future it is more important WHEN you use electricity than how much Heli Antila, Chief Technology Officer
| Date post: | 08-Jan-2017 |
| Category: |
Technology |
| Upload: | clic-innovation-ltd |
| View: | 98 times |
| Download: | 0 times |
In the future it is more important WHEN you use electricity than how much Heli Antila, Chief Technology Officer
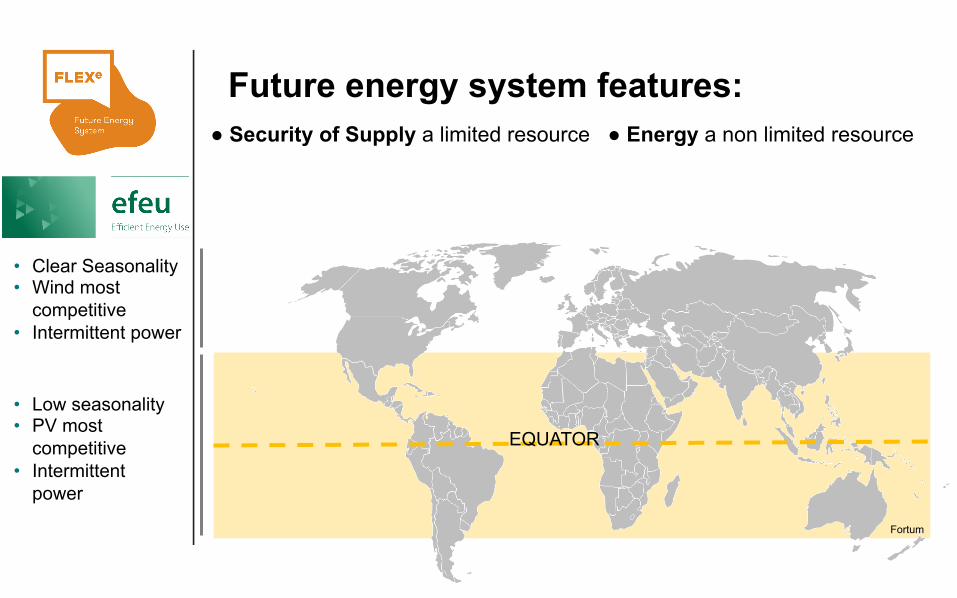
Future energy system features:
• Clear Seasonality • Wind most
competitive • Intermittent power
● Security of Supply a limited resource ● Energy a non limited resource
• Low seasonality • PV most
competitive • Intermittent
power
EQUATOR
Fortum
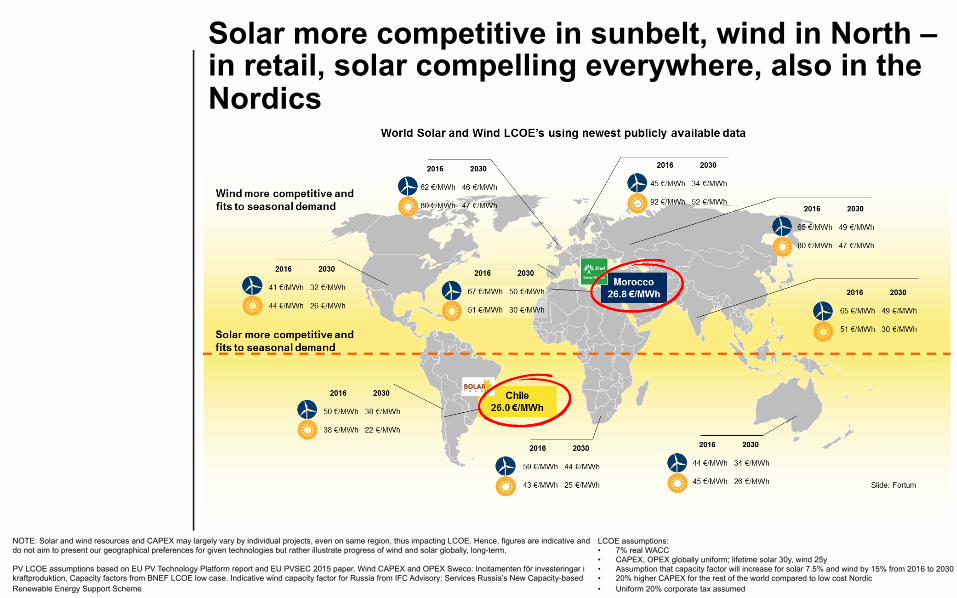
Solar more competitive in sunbelt, wind in North – in retail, solar compelling everywhere, also in the Nordics
NOTE: Solar and wind resources and CAPEX may largely vary by individual projects, even on same region, thus impacting LCOE. Hence, figures are indicative and do not aim to present our geographical preferences for given technologies but rather illustrate progress of wind and solar globally, long-term. PV LCOE assumptions based on EU PV Technology Platform report and EU PVSEC 2015 paper. Wind CAPEX and OPEX Sweco: Incitamenten för investeringar i kraftproduktion, Capacity factors from BNEF LCOE low case. Indicative wind capacity factor for Russia from IFC Advisory: Services Russia’s New Capacity-based Renewable Energy Support Scheme
LCOE assumptions: • 7% real WACC • CAPEX, OPEX globally uniform; lifetime solar 30y, wind 25y • Assumption that capacity factor will increase for solar 7.5% and wind by 15% from 2016 to 2030 • 20% higher CAPEX for the rest of the world compared to low cost Nordic • Uniform 20% corporate tax assumed
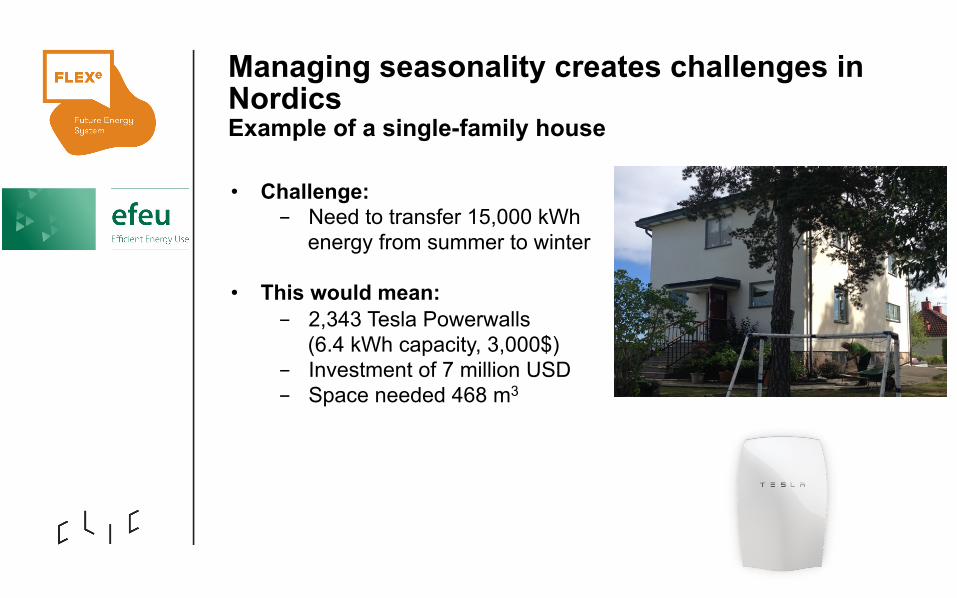
Managing seasonality creates challenges in Nordics Example of a single-family house
• Challenge: - Need to transfer 15,000 kWh
energy from summer to winter
• This would mean: - 2,343 Tesla Powerwalls
(6.4 kWh capacity, 3,000$) - Investment of 7 million USD - Space needed 468 m3

Energy and capacity balance in Germany 2015
, Fortum

Average power prices in Nordics and Germany were very close in December 2014 …
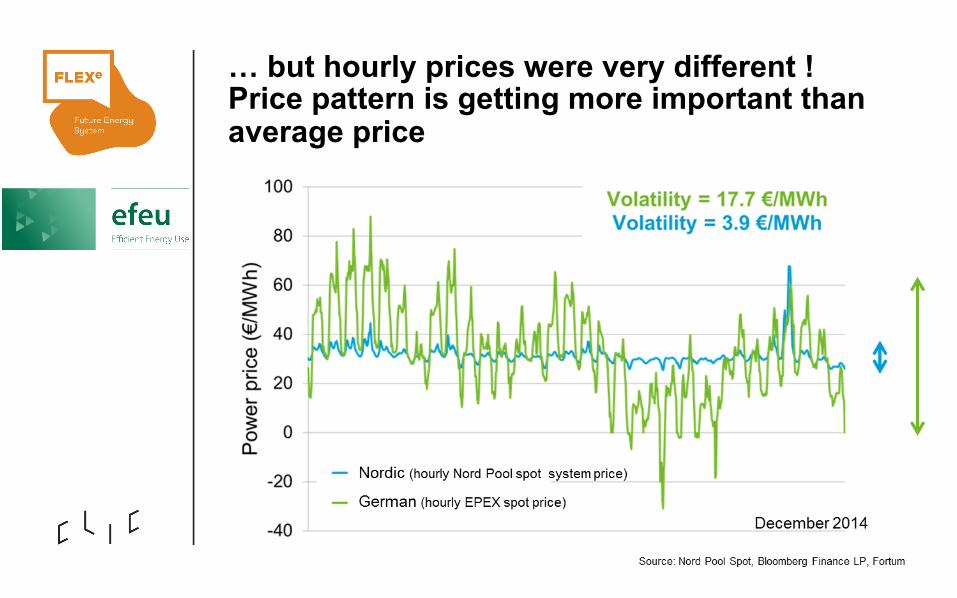
… but hourly prices were very different ! Price pattern is getting more important than average price
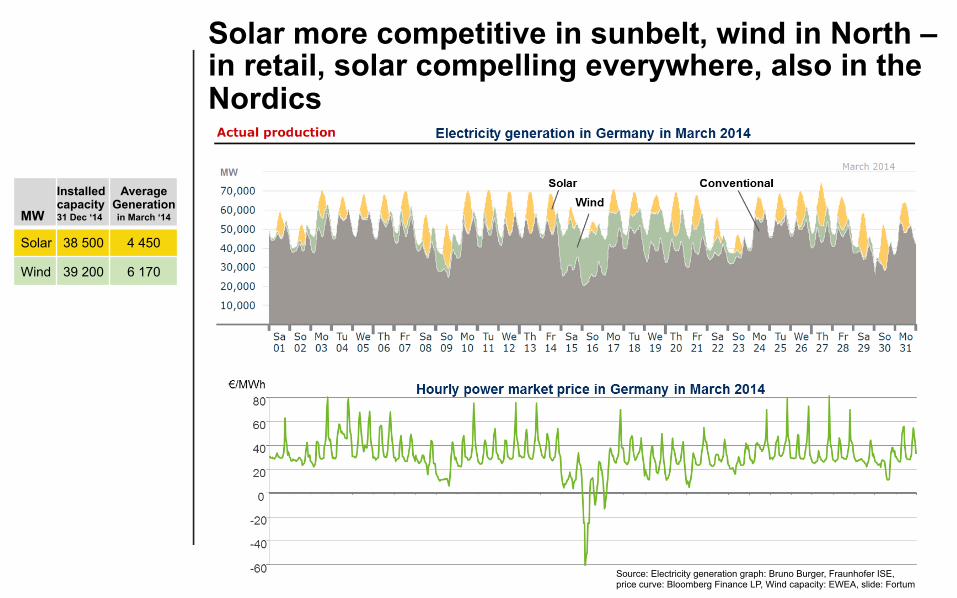
Solar more competitive in sunbelt, wind in North – in retail, solar compelling everywhere, also in the Nordics
MW
Installed capacity 31 Dec ‘14
Average Generation in March ‘14
Solar 38 500 4 450
Wind 39 200 6 170
Source: Electricity generation graph: Bruno Burger, Fraunhofer ISE, price curve: Bloomberg Finance LP, Wind capacity: EWEA, slide: Fortum
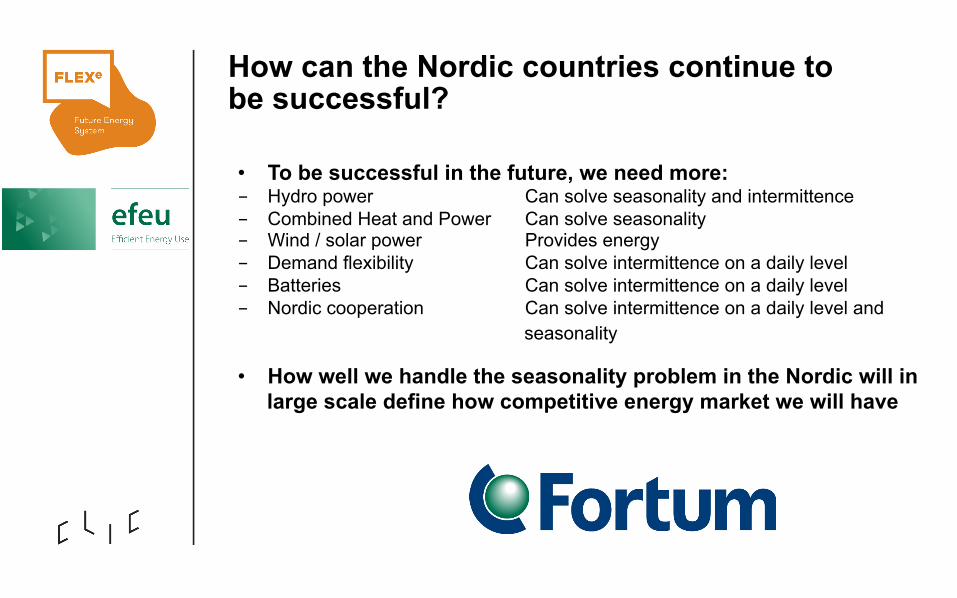
How can the Nordic countries continue to be successful?
• To be successful in the future, we need more: - Hydro power Can solve seasonality and intermittence - Combined Heat and Power Can solve seasonality - Wind / solar power Provides energy - Demand flexibility Can solve intermittence on a daily level - Batteries Can solve intermittence on a daily level - Nordic cooperation Can solve intermittence on a daily level and
seasonality
• How well we handle the seasonality problem in the Nordic will in large scale define how competitive energy market we will have


