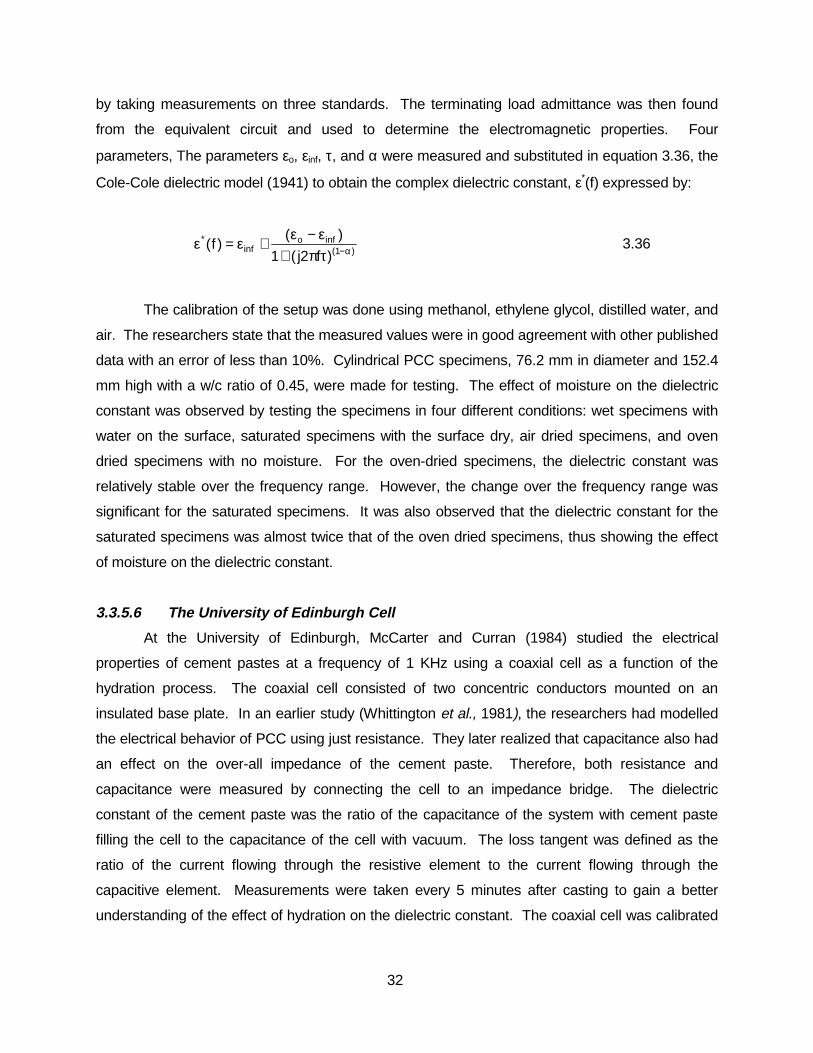
EFFECT OF ADMIXTURES, CHLORIDES, AND MOISTURE ON DIELECTRIC PROPERTIES OF PORTLAND CEMENT CONCRETE IN THE LOW MICROWAVE FREQUENCY RANGE By Kiran Pokkuluri Thesis submitted to the Faculty of the Virginia Polytechnic Institute and State University In partial fulfillment of the requirements for the degree of MASTER OF SCIENCE In Civil Engineering APPROVED Dr. Imad L. Al-Qadi, Chairman Professor of Civil Engineering Dr. Sedki M. Riad Dr. Gerardo W. Flintsch Professor of Electrical Engineering Assistant Professor of Civil Engineering October, 1998 Keywords: Nondestructive Evaluation, Portland Cement Concrete, Electromagnetic waves, Transmission lines, Dielectric properties
Transcript
EFFECT OF ADMIXTURES, CHLORIDES, AND MOISTURE ON
DIELECTRIC PROPERTIES OF PORTLAND CEMENT CONCRETE IN
THE LOW MICROWAVE FREQUENCY RANGE
By
Kiran Pokkuluri
Thesis submitted to the Faculty of the
Virginia Polytechnic Institute and State University
In partial fulfillment of the requirements for the degree of
MASTER OF SCIENCE
In
Civil Engineering
APPROVED
Dr. Imad L. Al-Qadi, Chairman
Professor of Civil Engineering
Dr. Sedki M. Riad Dr. Gerardo W. Flintsch
Professor of Electrical Engineering Assistant Professor of Civil Engineering
3.3.2 Modes of propagation 233.3.3 The Virginia Tech transmission line 253.3.4 Electrical parameters of the Virginia Tech coaxial line 263.3.5 Other coaxial transmission lines and probes 27
3.3.5.1 The University of Liverpool line 273.3.5.2 The University of Illinois line 283.3.5.3 The EPFL LMC line 29
v
3.3.5.4 The Voss Scientific Line 303.3.5.5 The MIT Coaxial Probe 313.3.5.6 The University of Edinburgh Cell
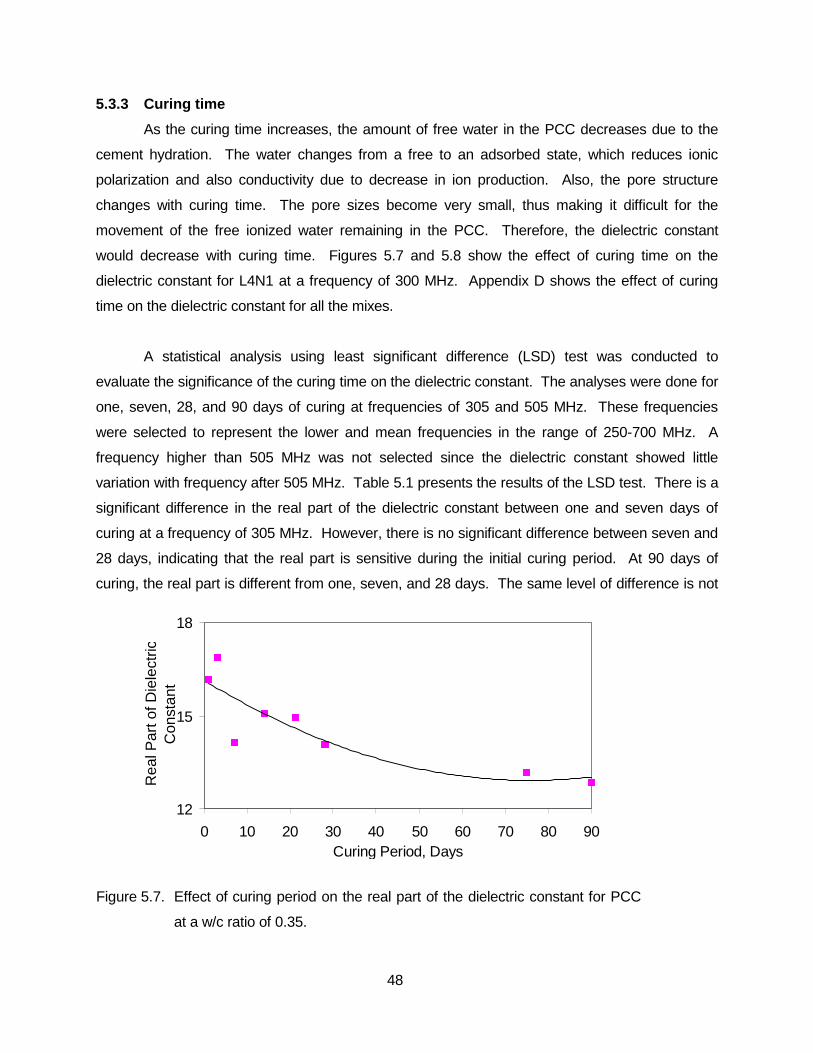
5.3 Parameters Affecting Measured Dielectric Properties 445.3.1 Frequency 445.3.2 Aggregate type 465.3.3 Curing time 485.3.4 Water/cement ratio 495.3.5 Admixtures 525.3.6 Chlorides 565.3.7 Water content
5.5 Results From Permeability Testing 63
5.6 Correlation between the Permeability and Measured Dielectric Properties 63
CHAPTER 6. SUMMARY, FINDINGS, AND CONCLUSIONS 66
6.1 Findings 66
6.2 Conclusions 67
7 REFERENCES 68
vi
LIST OF FIGURES
Figure 2.1(a) Cement particles before the addition of super plasticizers 10
Figure 2.1(b) Cement particles after the addition of super plasticizers 10
Figure 3.1 Charge on capacitor plates with vacuum between them 15
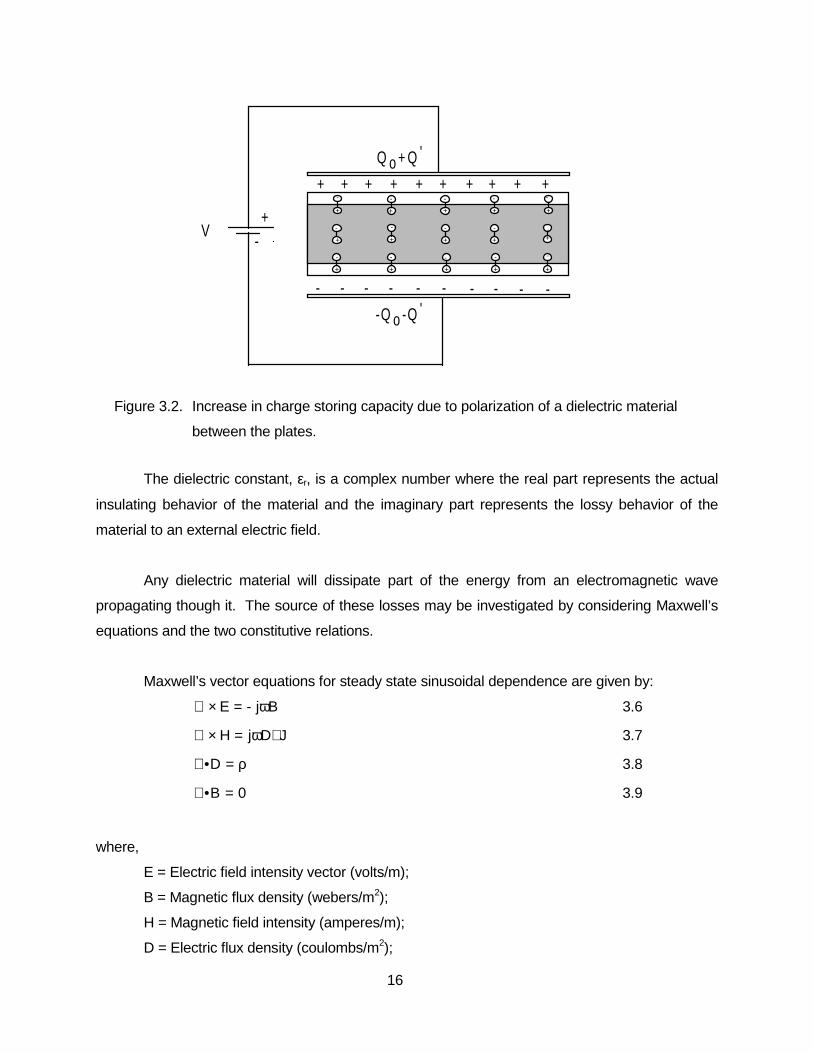
Figure 3.2 Increase in charge storing capacity due to polarization of a dielectric
material between the plates 16
Figure 3.3 Types of Polarization 20
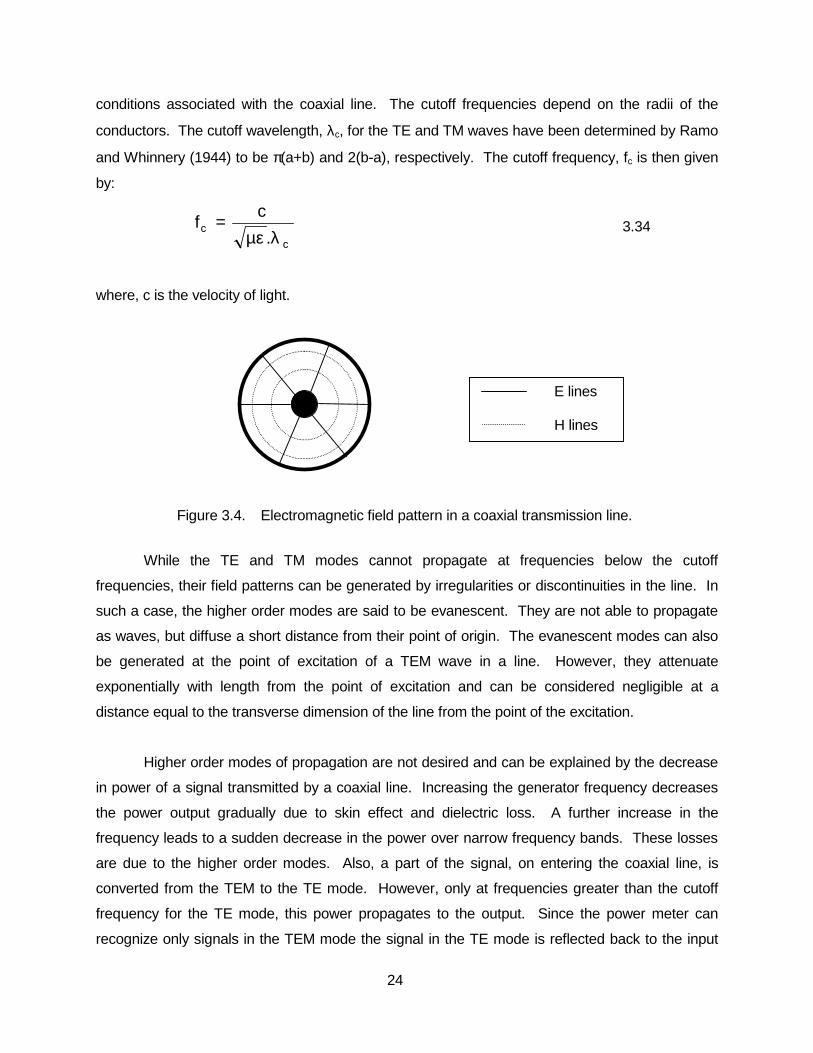
Figure 3.4 Electromagnetic field pattern in a coaxial transmission line 24
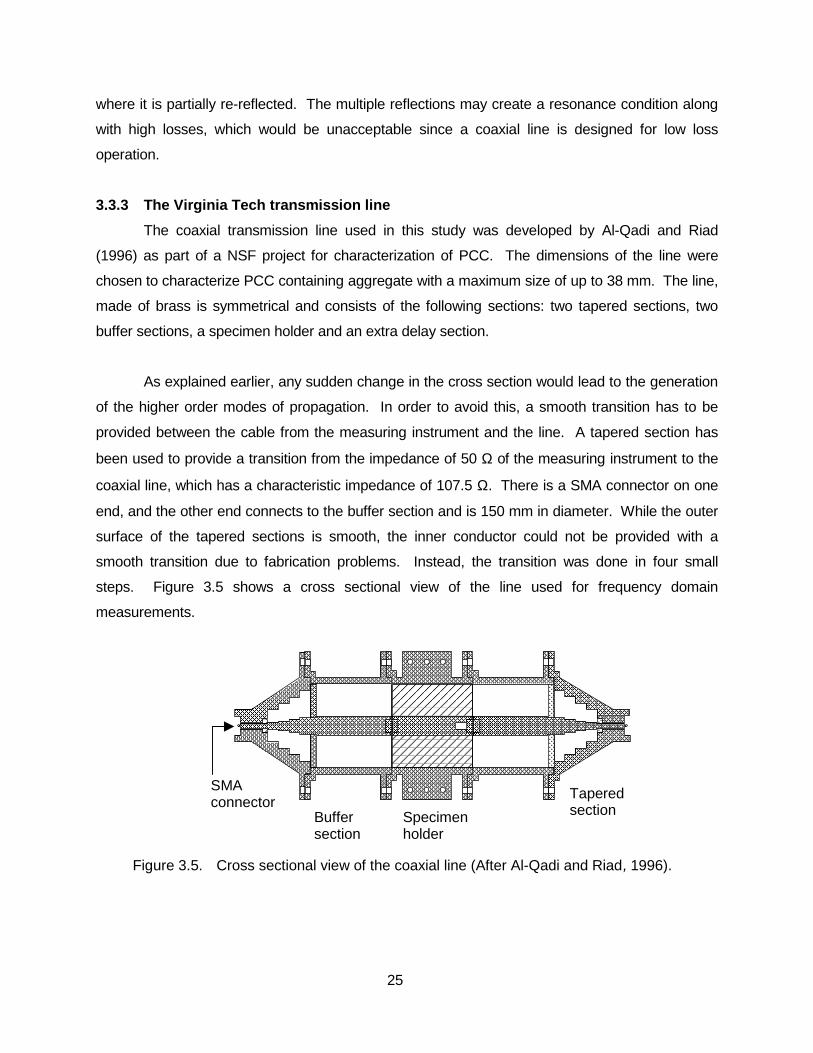
Figure 3.5 Cross sectional view of the Virginia Tech coaxial line 25
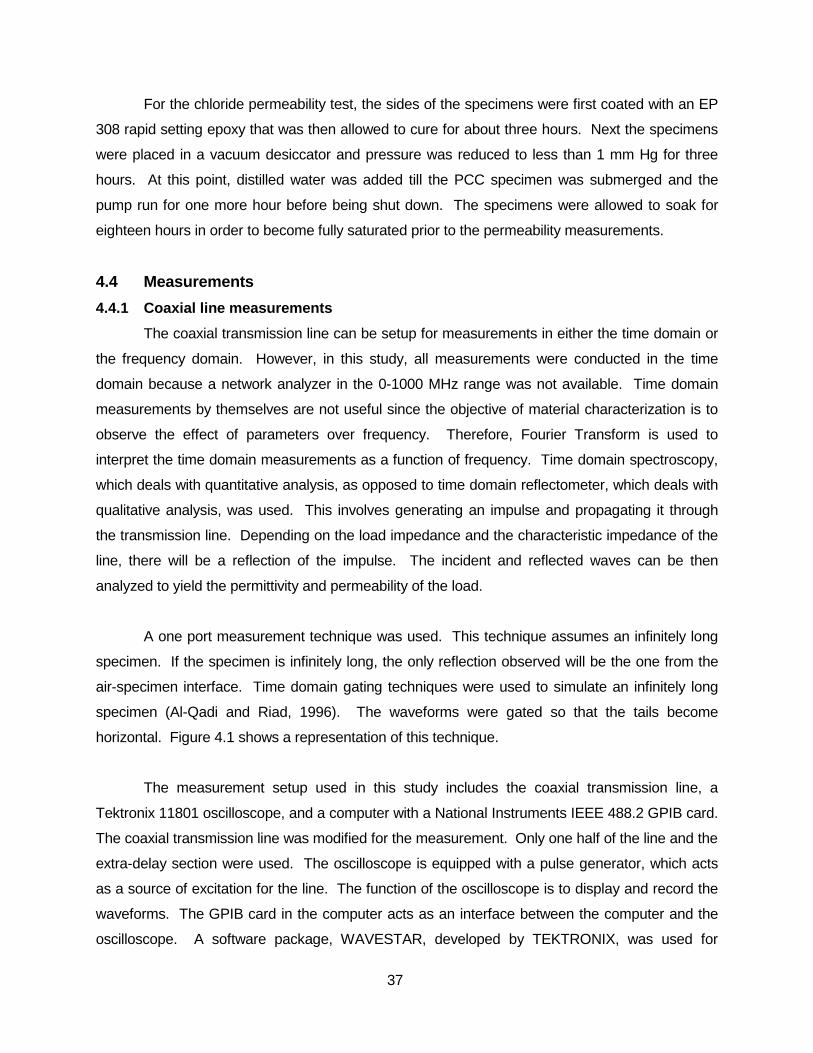
Figure 4.1 Gating technique 39
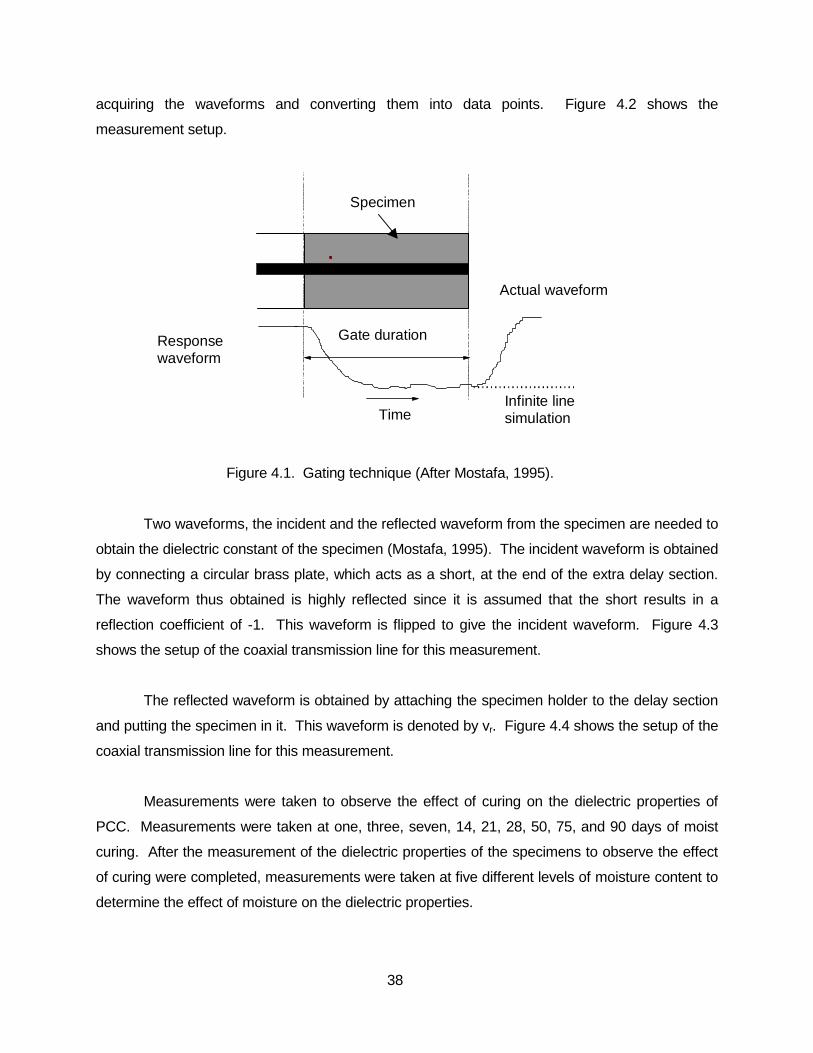
Figure 4.2 Measurement setup in time domain 39
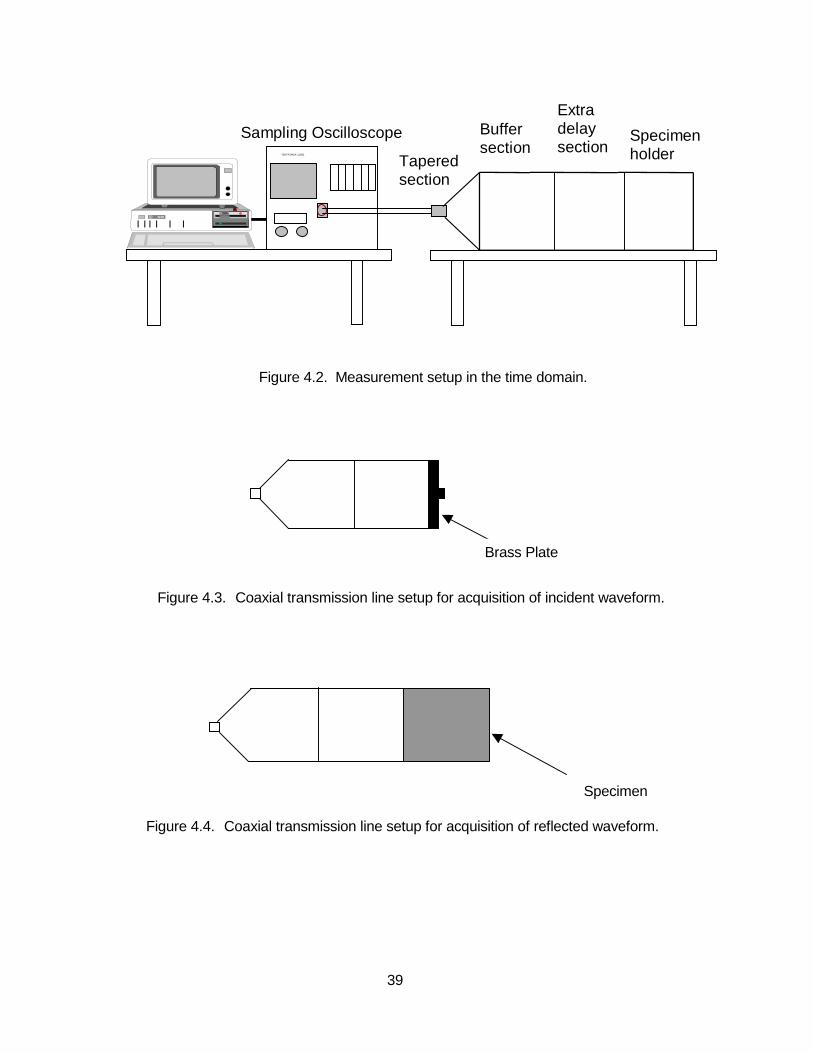
Figure 4.3 Coaxial transmission line setup for acquisition of incident waveform 39
Figure 4.4 Coaxial transmission line setup for acquisition of reflected waveform 39
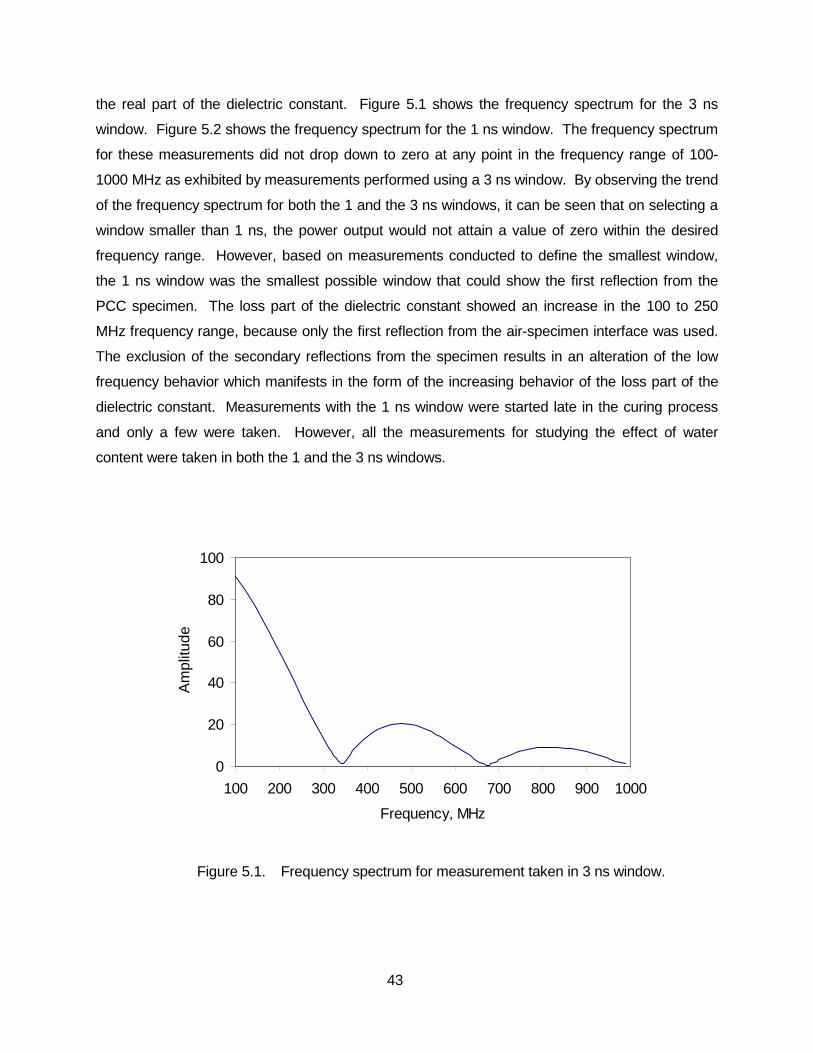
Figure 5.1 Frequency spectrum for measurement taken in a 3 ns window 43
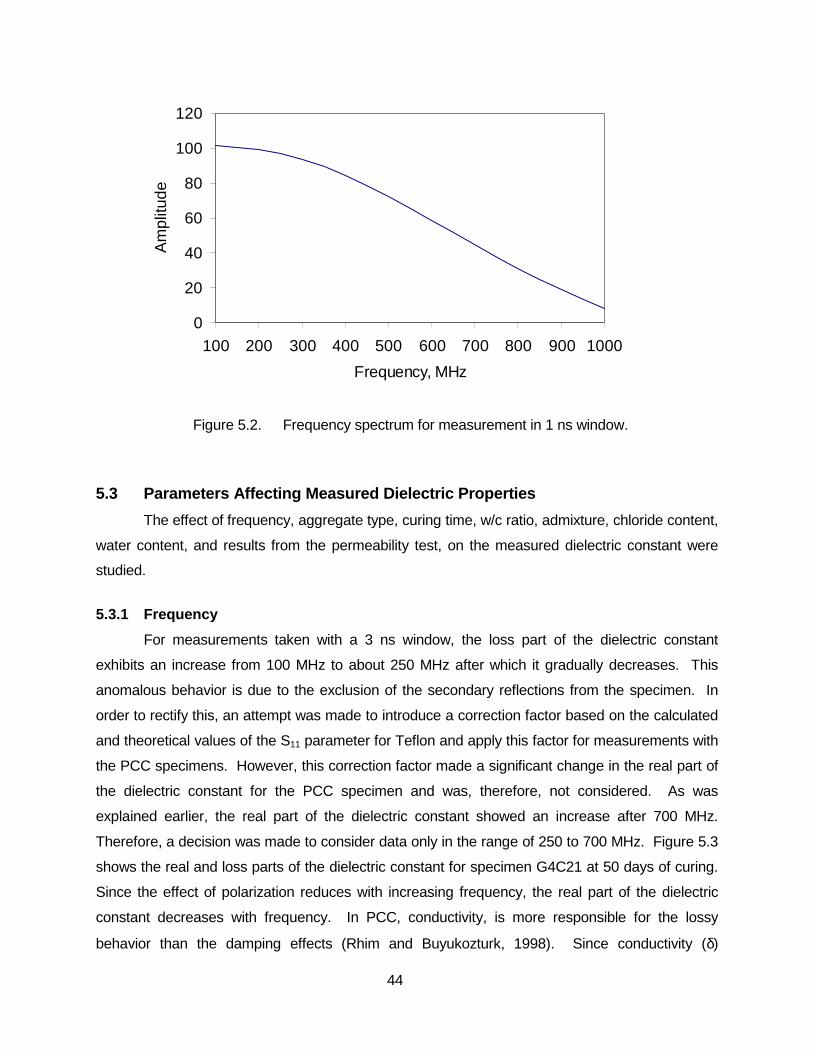
Figure 5.2 Frequency spectrum for measurement taken in a 1 ns window 44
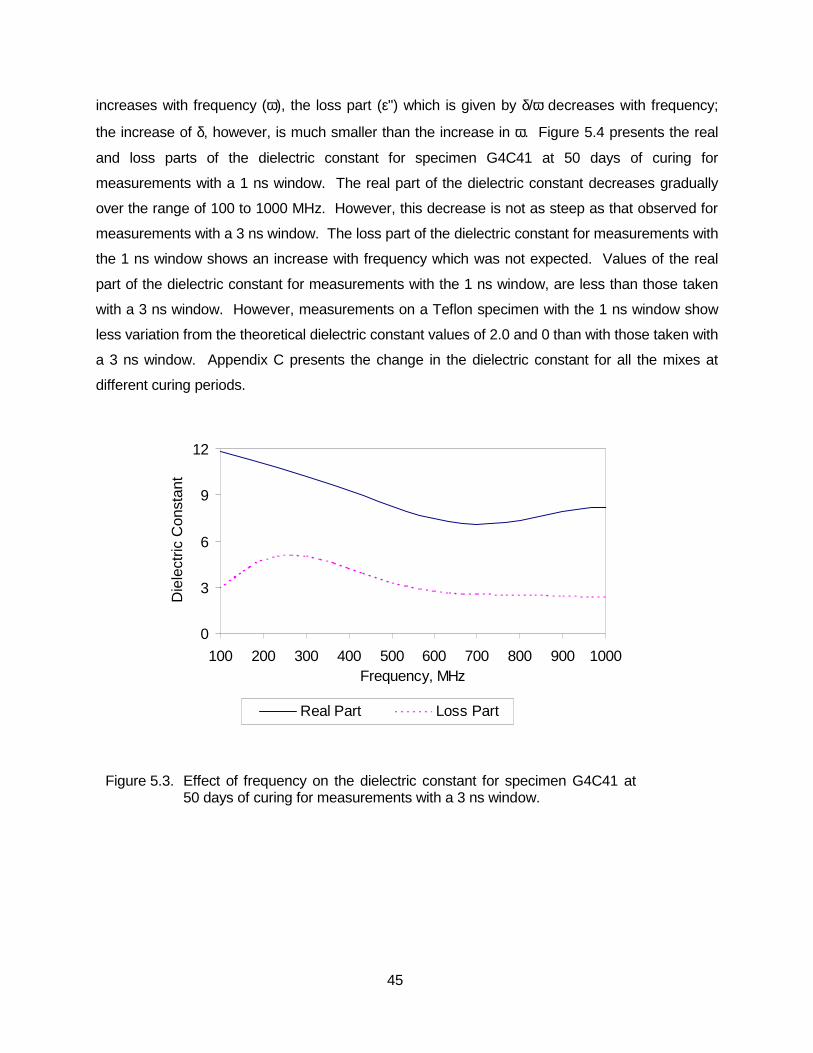
Figure 5.3 Effect of frequency on the dielectric constant for specimen
G4C41 at 50 days for measurements with a 3 ns window 45
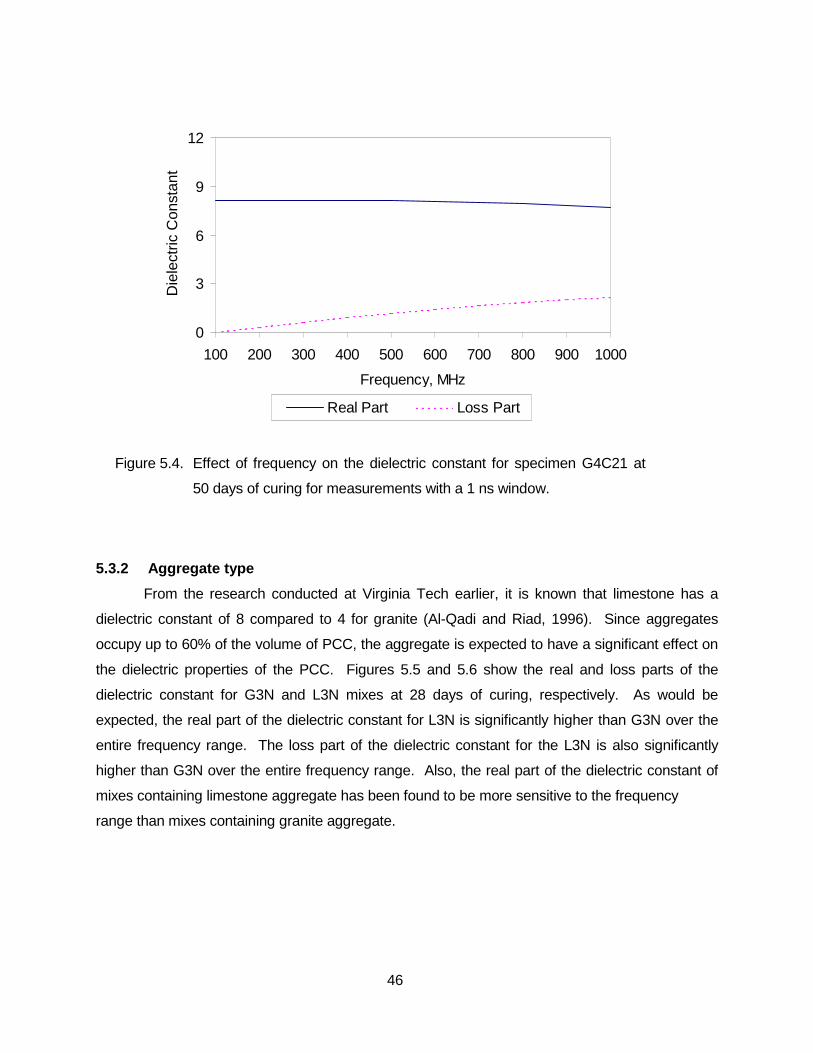
Figure 5.4 Effect of frequency on the dielectric constant for specimen
G4C41 at 50 days for measurements with a 1 ns window 46
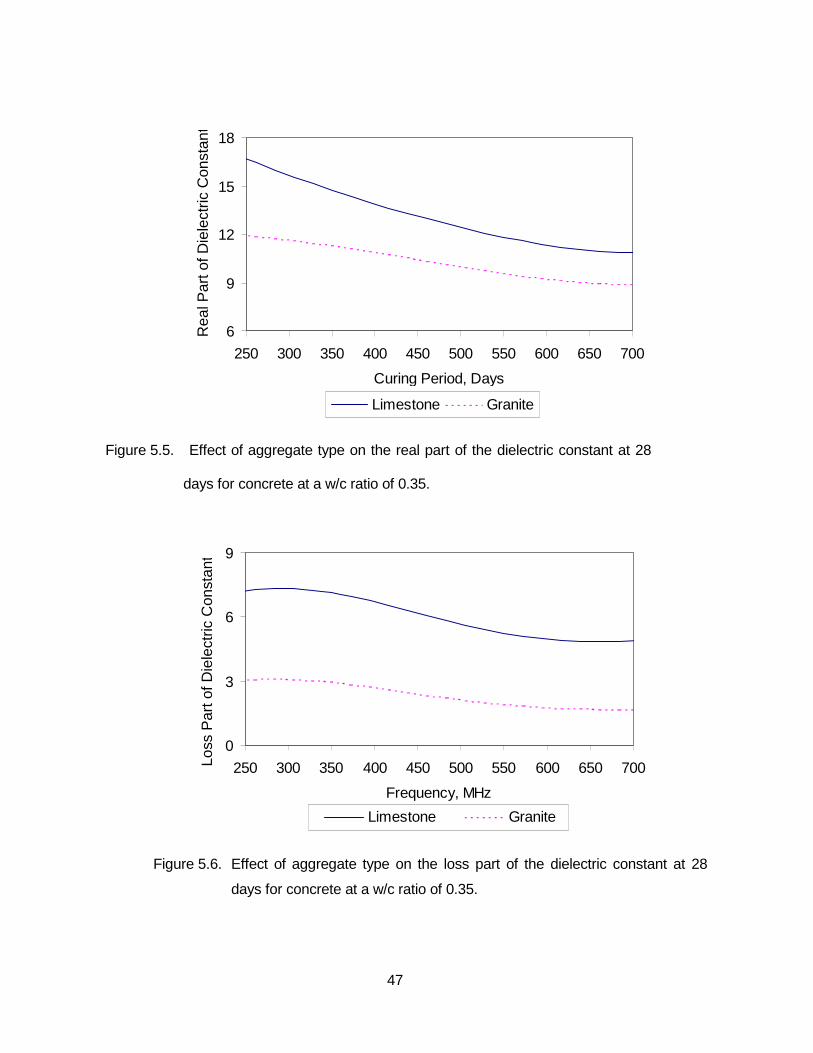
Figure 5.5 Effect of aggregate type on the real part of the dielectric constant
at 28 days for concrete at a w/c ratio of 0.35 47
Figure 5.6 Effect of aggregate type on the loss part of the dielectric constant
at 28 days for concrete at a w/c ratio of 0.35 47
Figure 5.7 Effect of curing period on the real part of the dielectric constant
for concrete at a w/c ratio of 0.35 48
vii
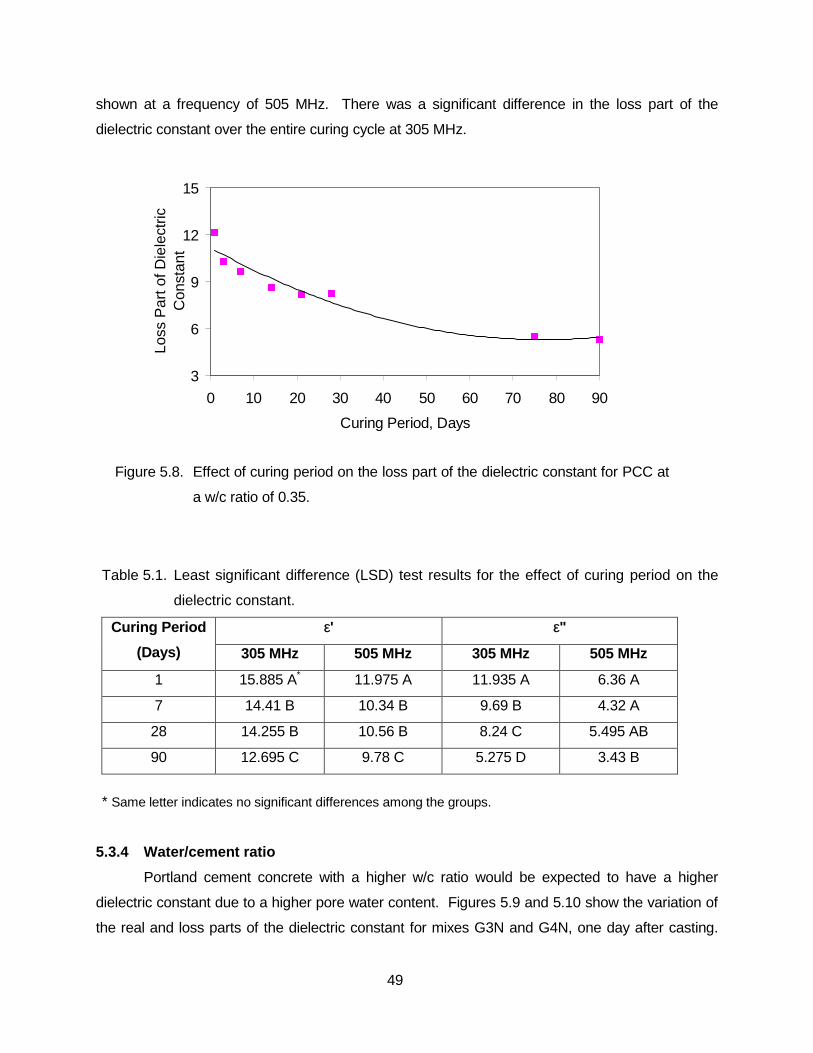
Figure 5.8 Effect of curing period on the loss part of the dielectric constant
for concrete at a w/c ratio of 0.35 49
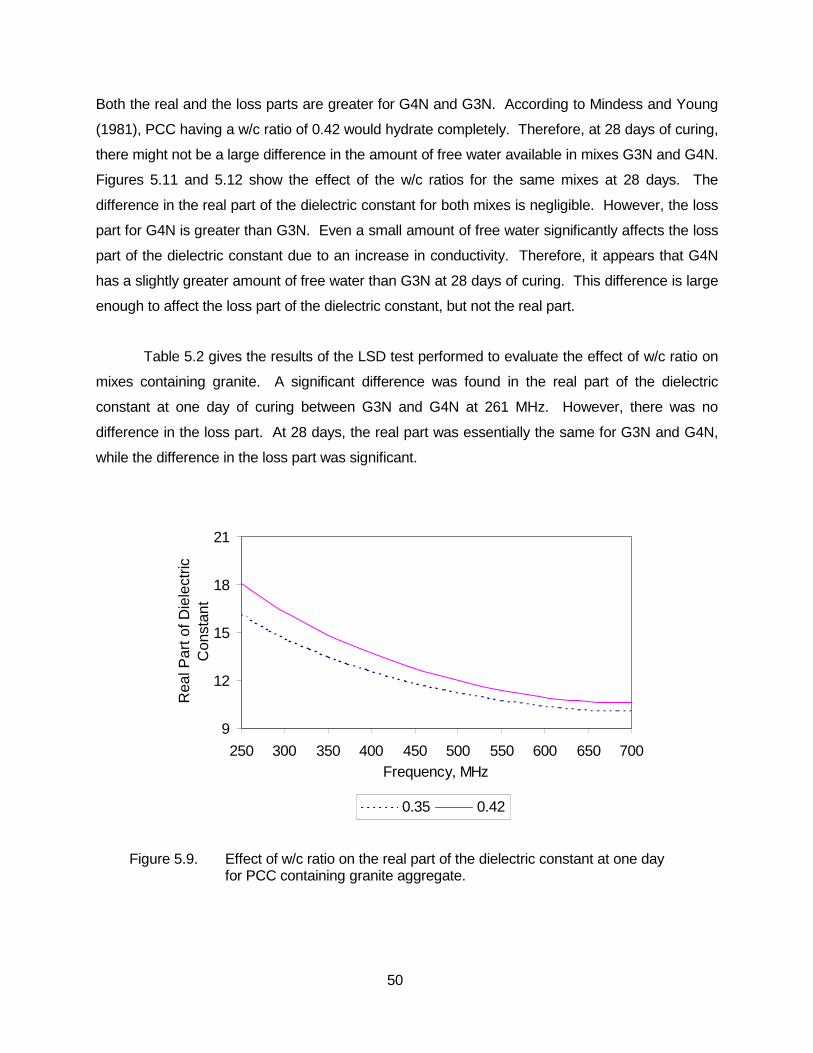
Figure 5.9 Effect of w/c ratio on the real part of the dielectric constant at 1 day
for concrete containing granite aggregate 50
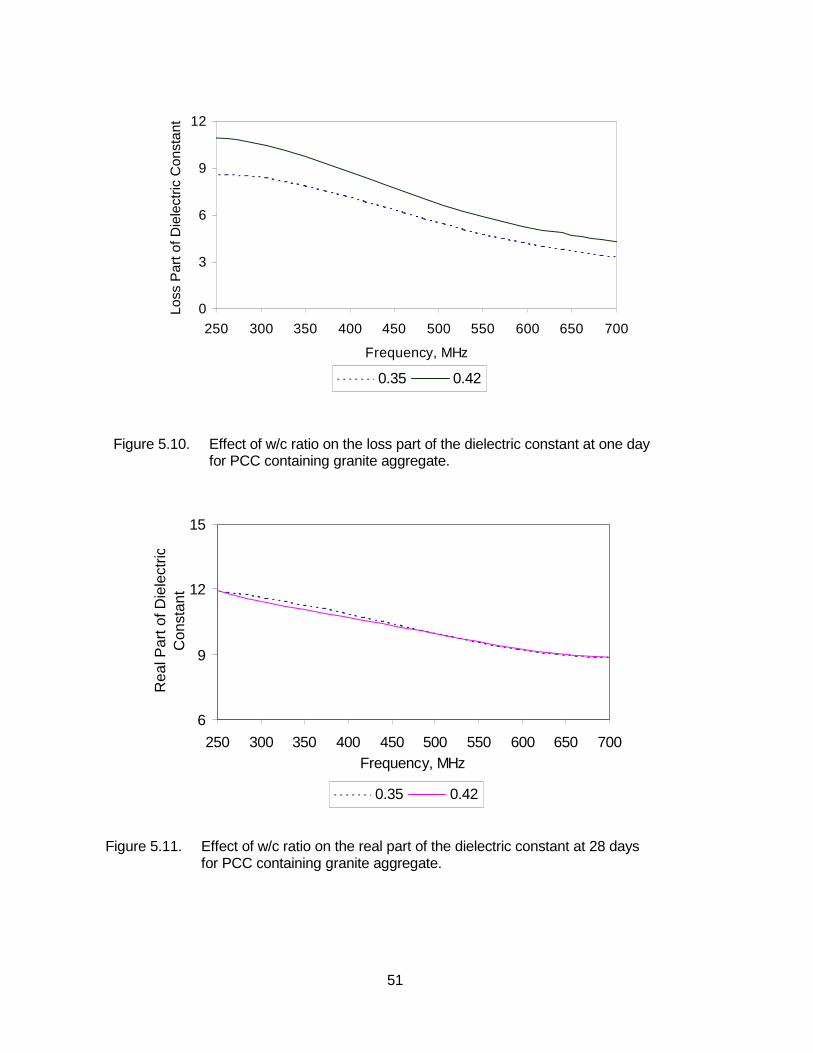
Figure 5.10 Effect of w/c ratio on the loss part of the dielectric constant at 1 day
for concrete containing granite aggregate 51
Figure 5.11 Effect of w/c ratio on the real part of the dielectric constant at
28 days for concrete containing granite aggregate 51
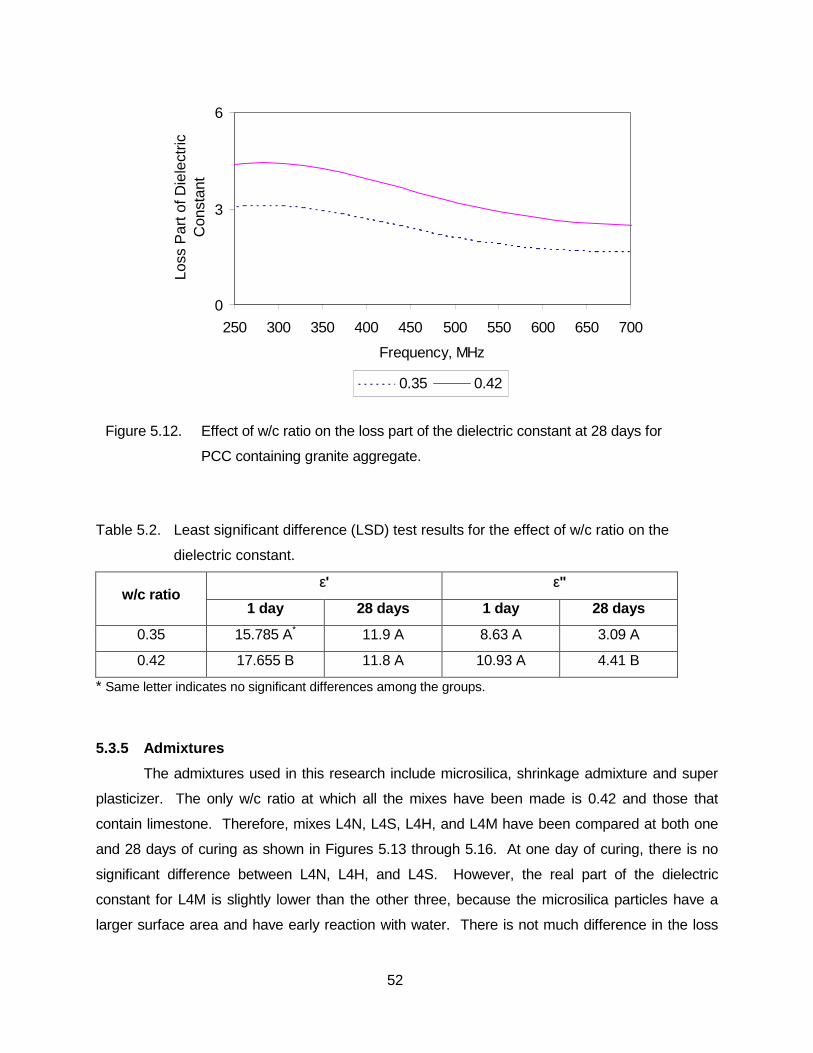
Figure 5.12 Effect of w/c ratio on the loss part of the dielectric constant at
28 days for concrete containing granite aggregate 52
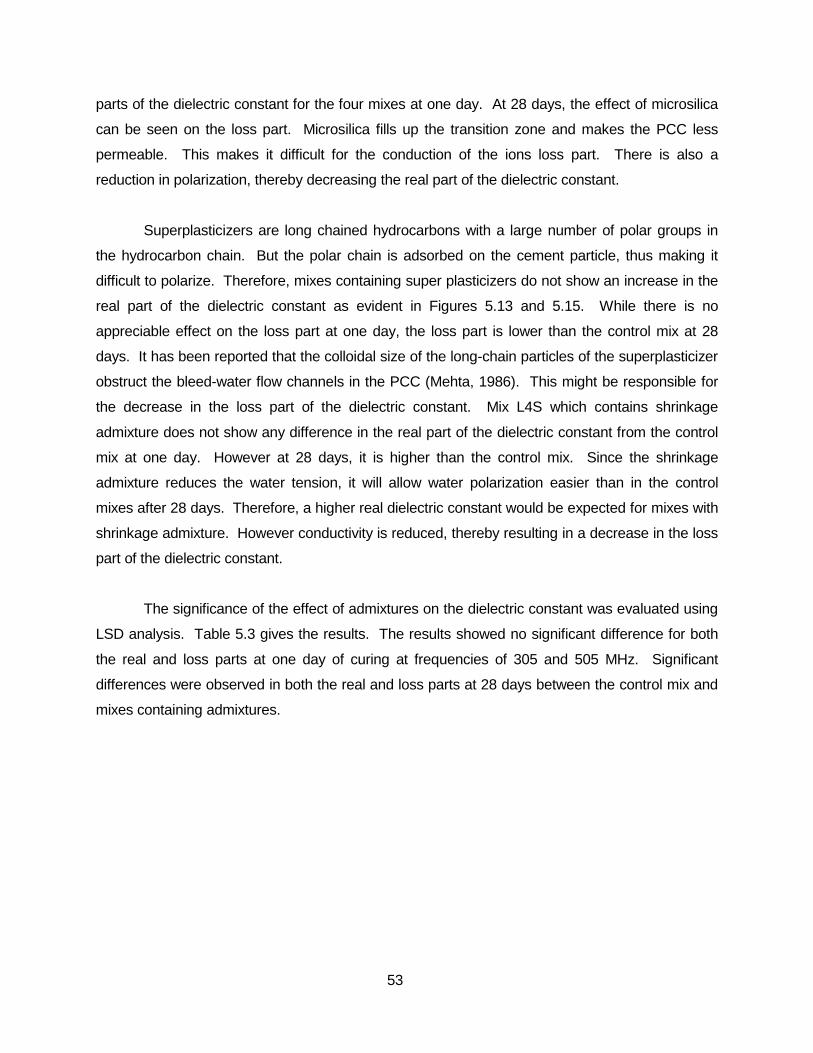
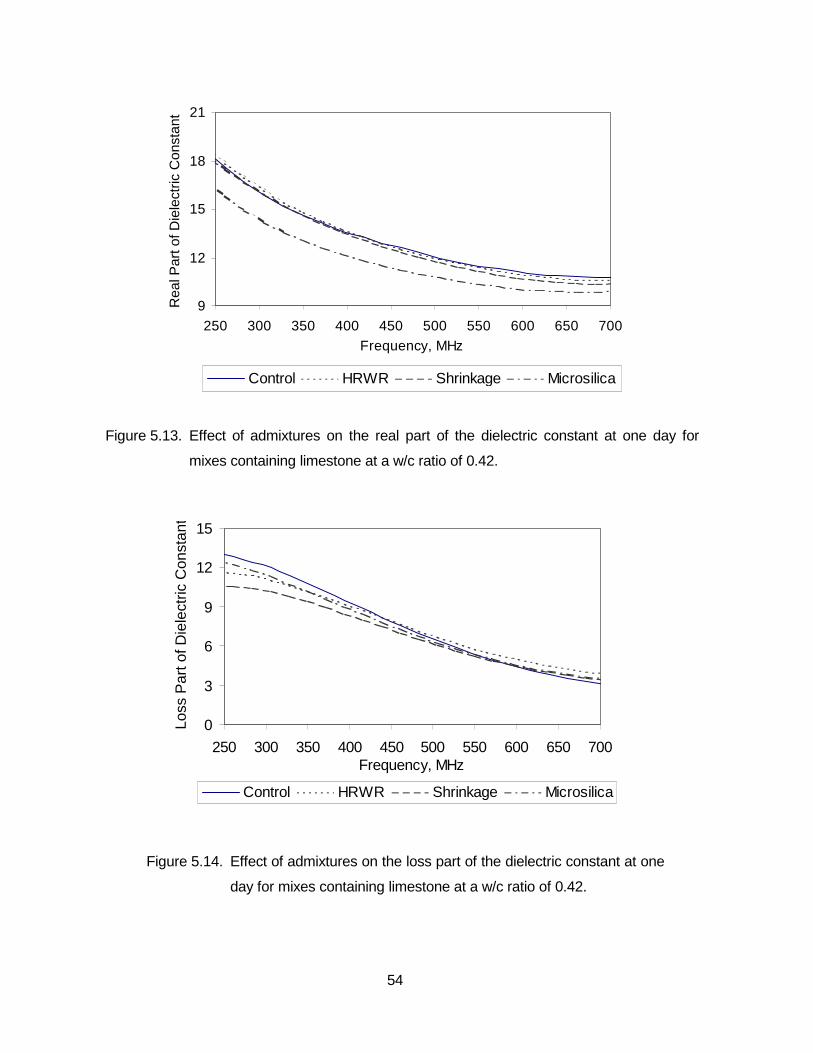
Figure 5.13 Effect of admixtures on the real part of the dielectric constant
at 1 day for mixes containing limestone at a w/c ratio of 0.42 54
Figure 5.14 Effect of admixtures on the losspart of the dielectric constant
at 1 day for mixes containing limestone at a w/c ratio of 0.42 54
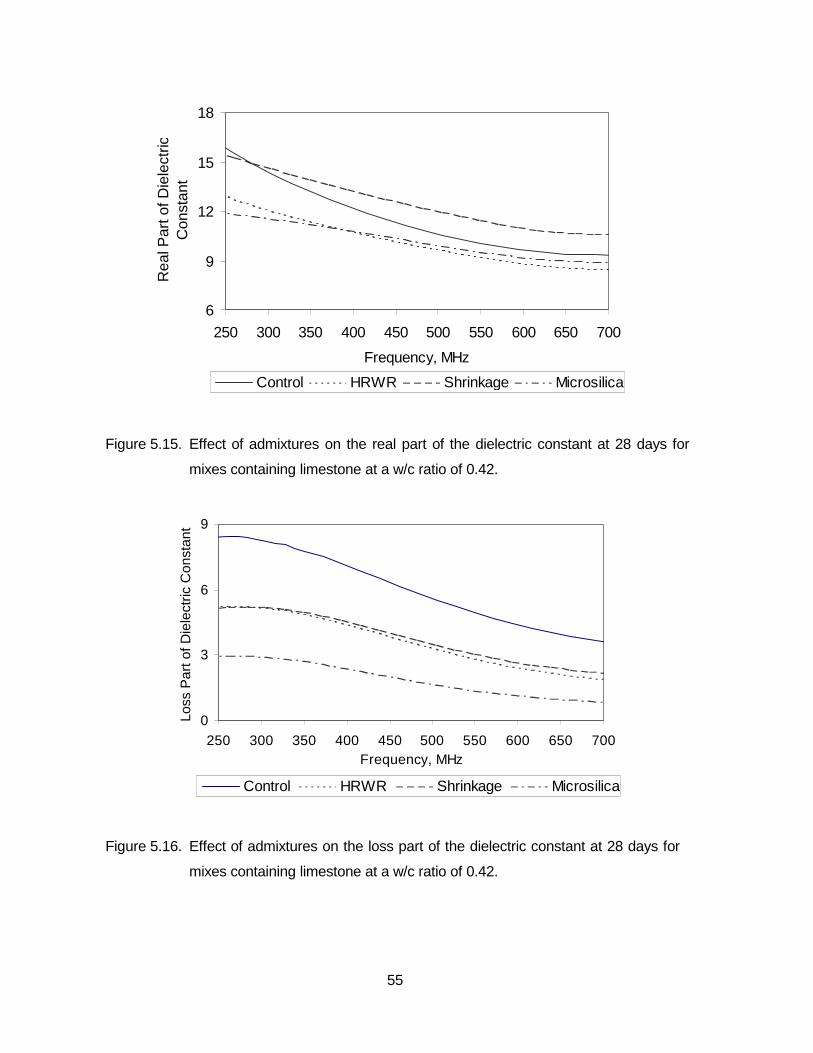
Figure 5.15 Effect of admixtures on the real part of the dielectric constant
at 28 days for mixes containing limestone at a w/c ratio of 0.42 55
Figure 5.16 Effect of admixtures on the loss part of the dielectric constant
at 28 days for mixes containing limestone at a w/c ratio of 0.42 55
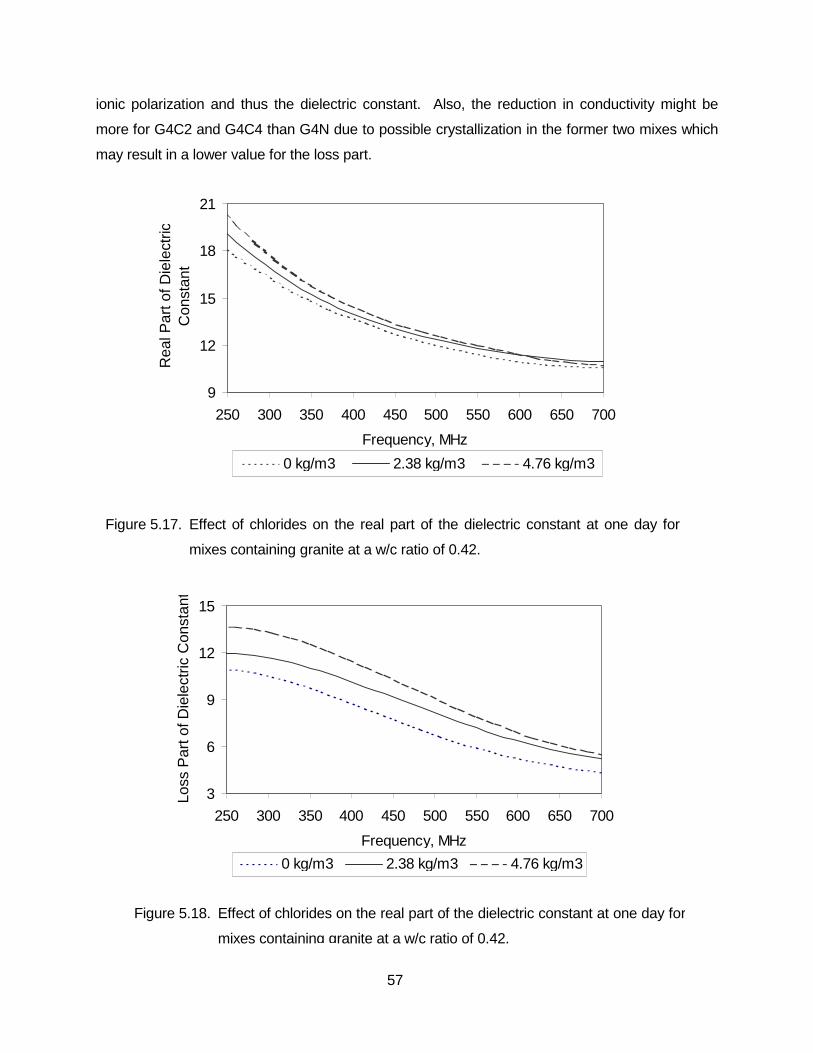
Figure 5.17 Effect of chlorides on the real part of the dielectric constant
at 1 day for mixes containing granite at a w/c ratio of 0.42 57
Figure 5.18 Effect of chlorides on the real part of the dielectric constant
at 1 day for mixes containing granite at a w/c ratio of 0.42 57
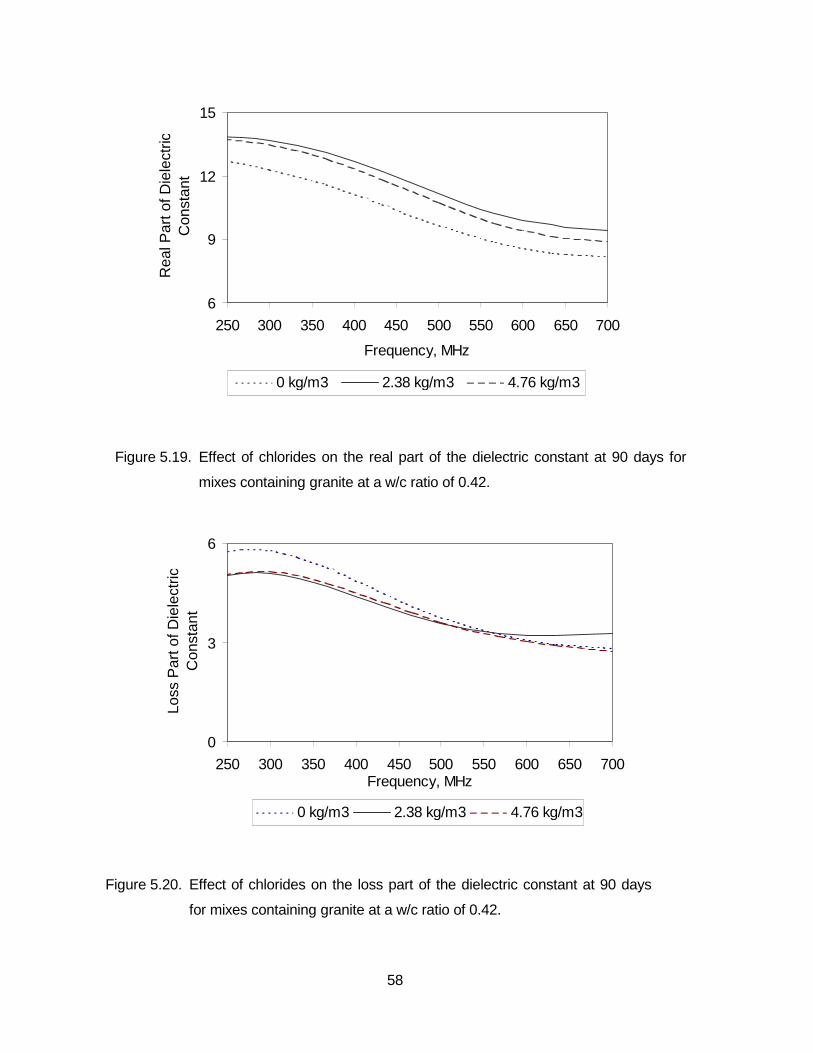
Figure 5.19 Effect of chlorides on the real part of the dielectric constant
at 90 days for mixes containing granite at a w/c ratio of 0.42 58
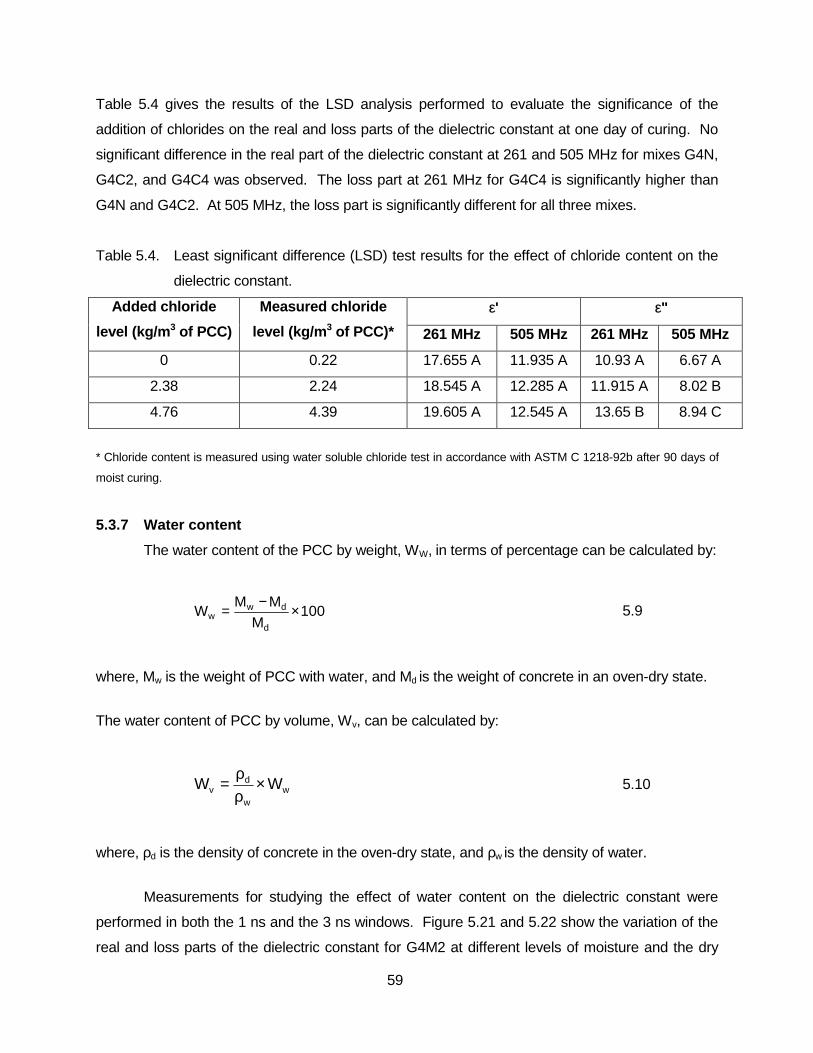
Figure 5.20 Effect of chlorides on the loss part of the dielectric constant
at 90 days for mixes containing granite at a w/c ratio of 0.42 58
viii
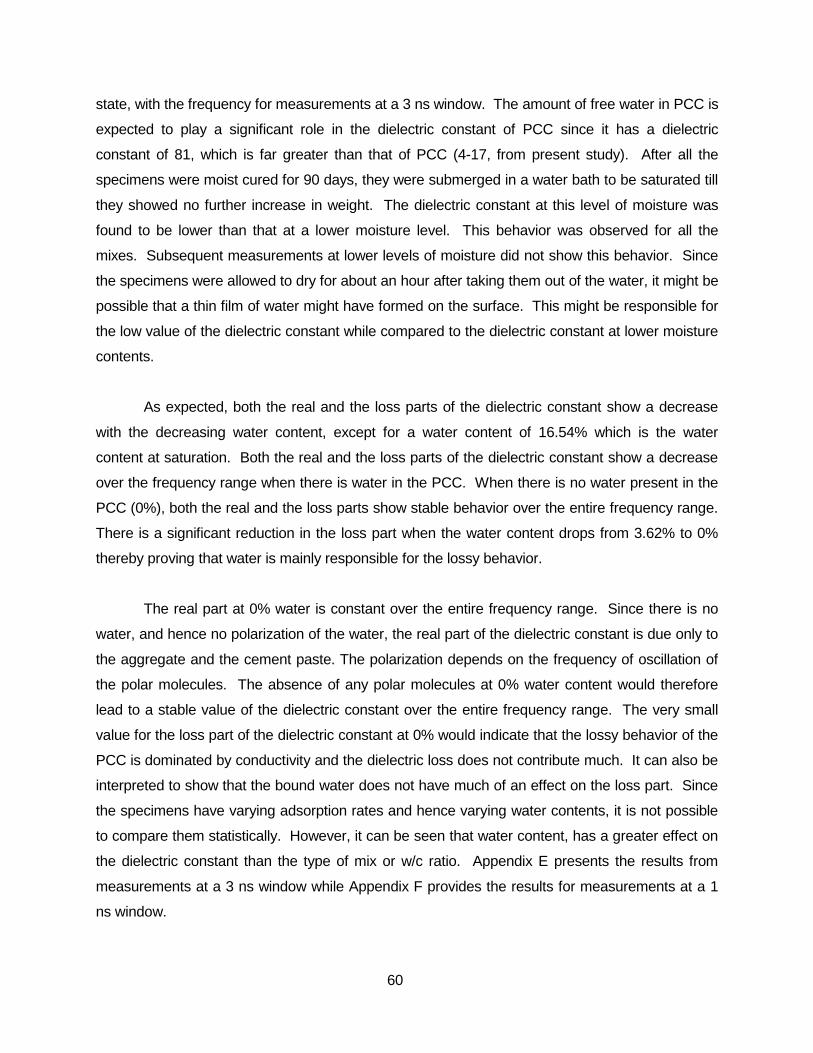
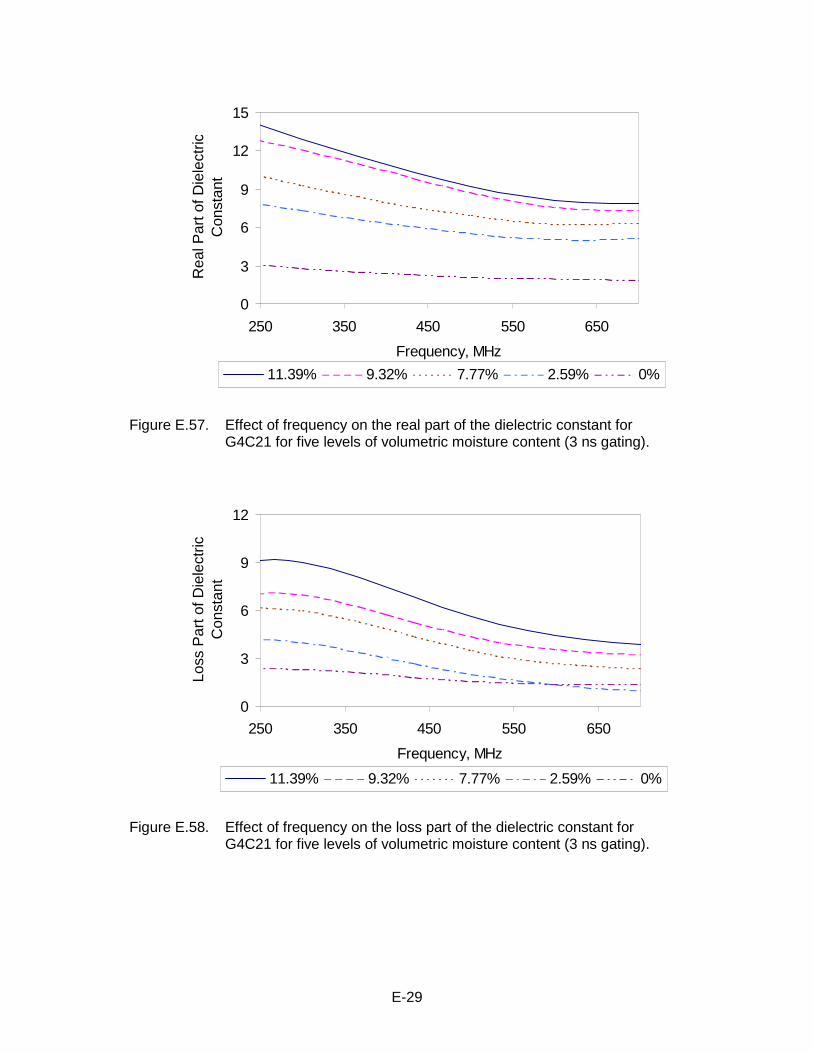
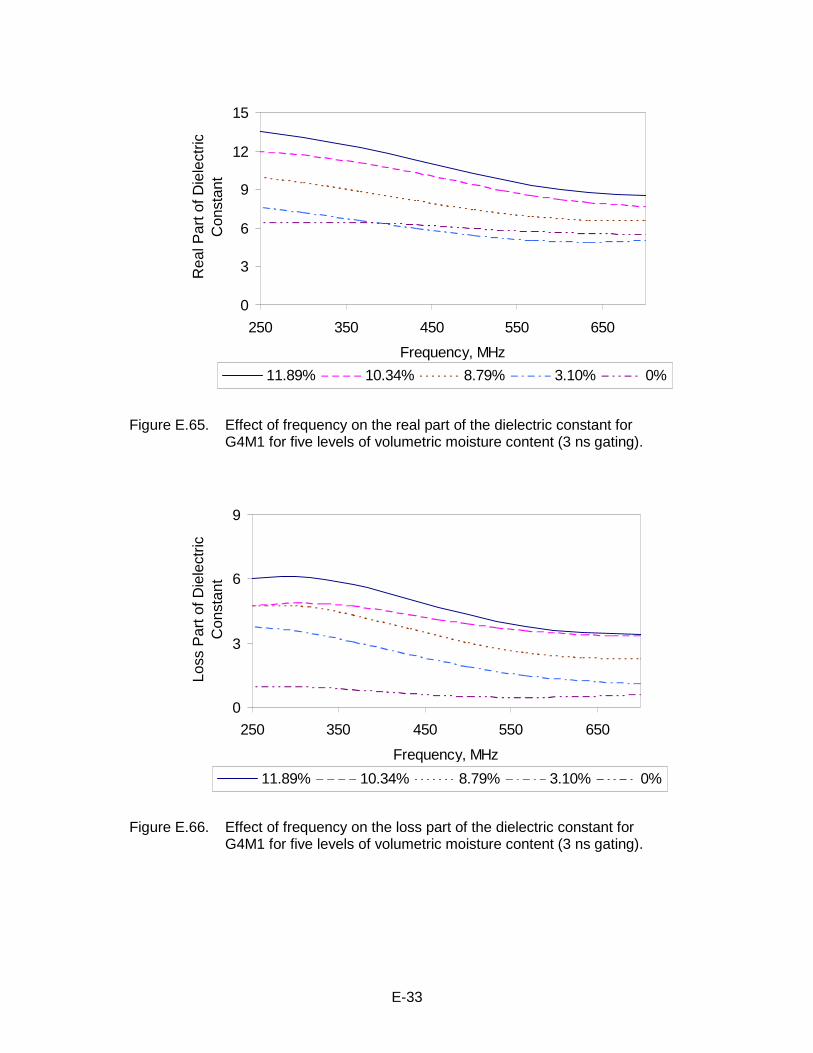
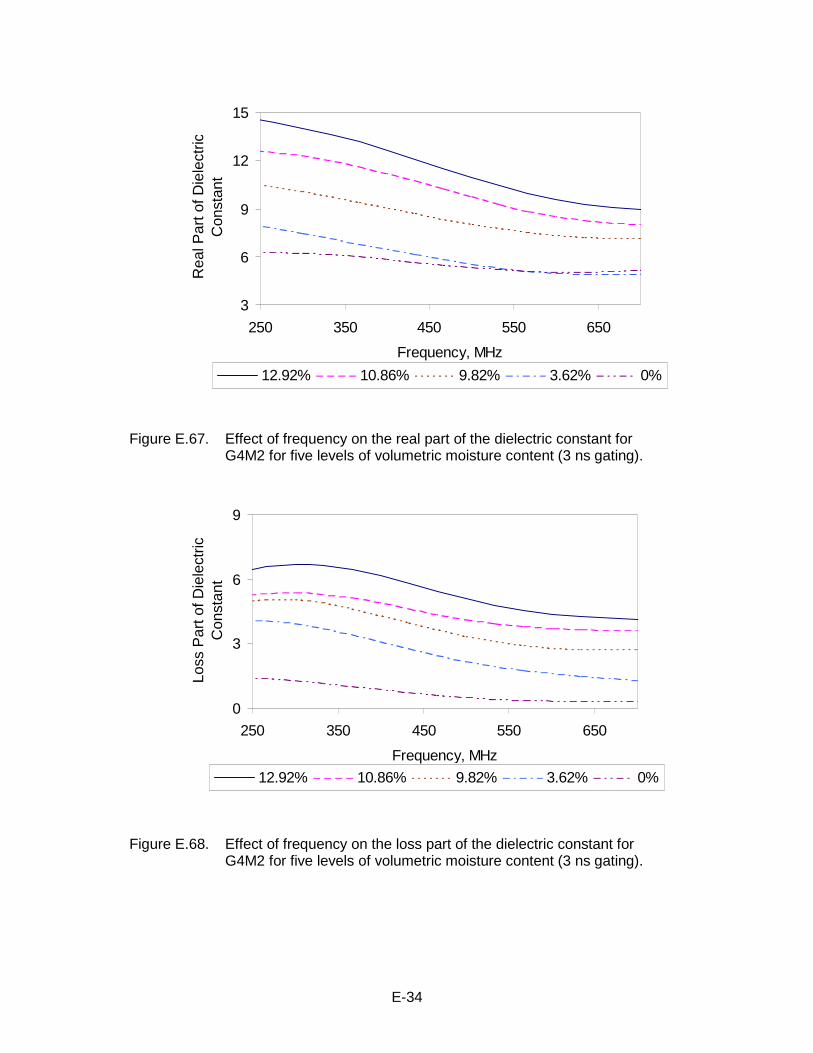
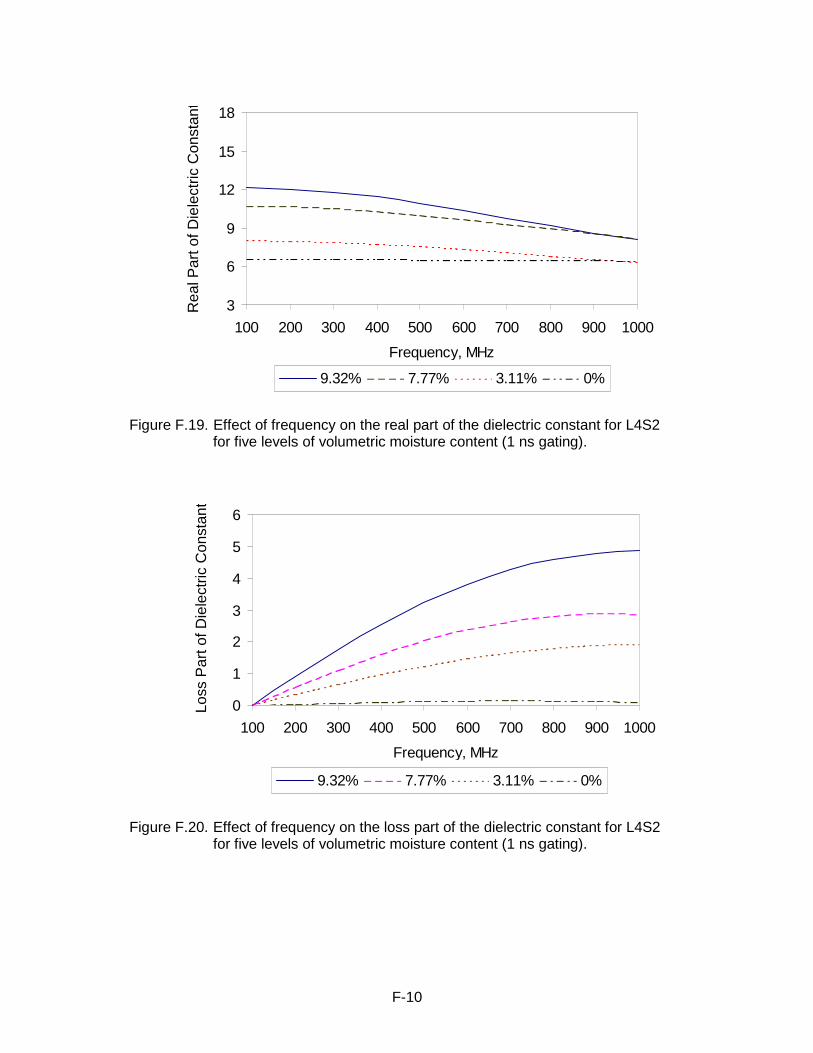
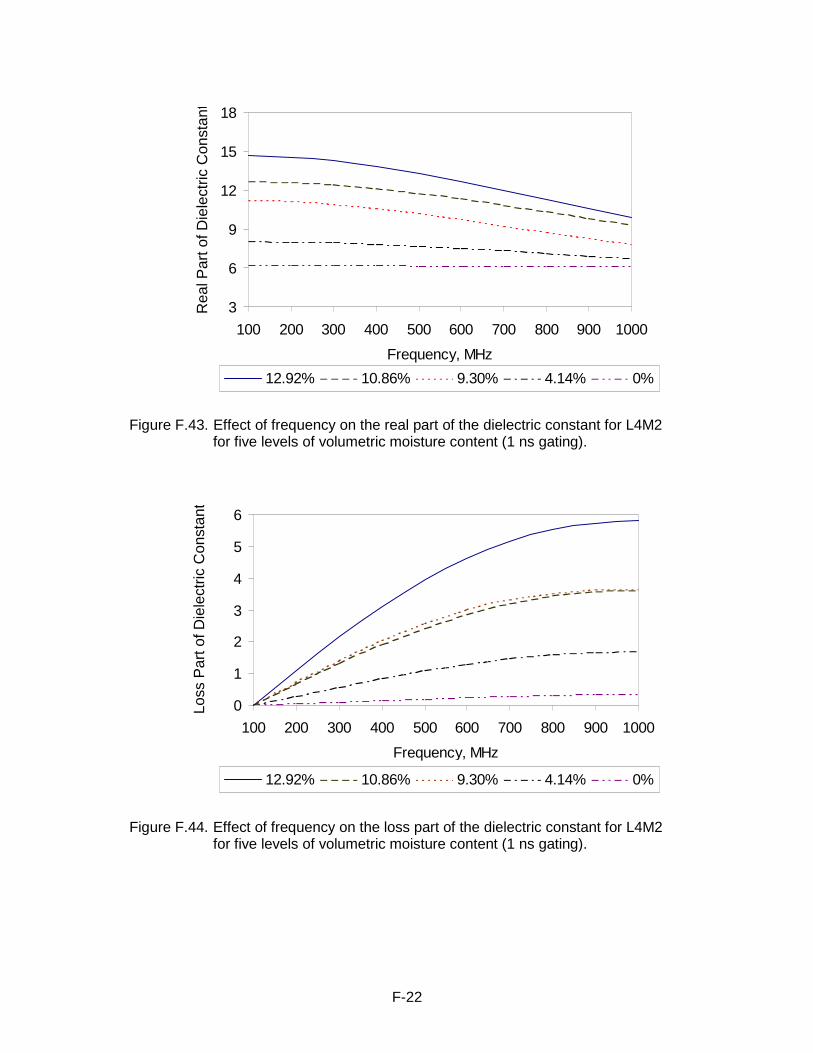
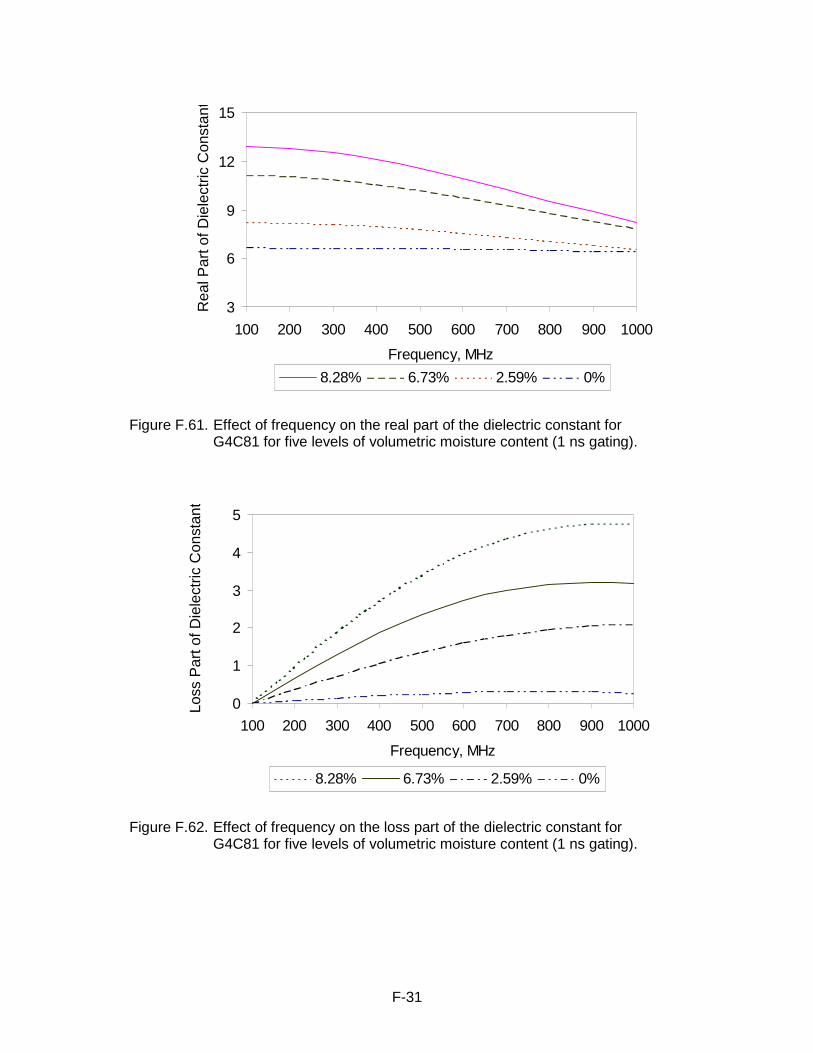
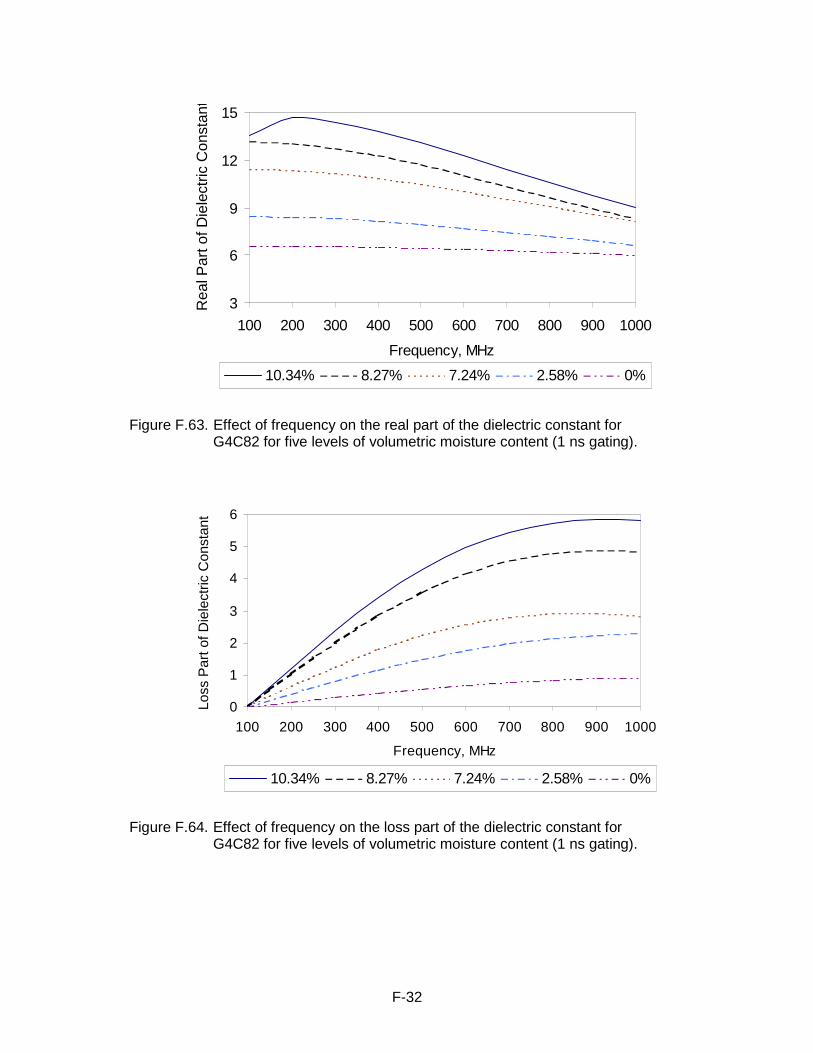
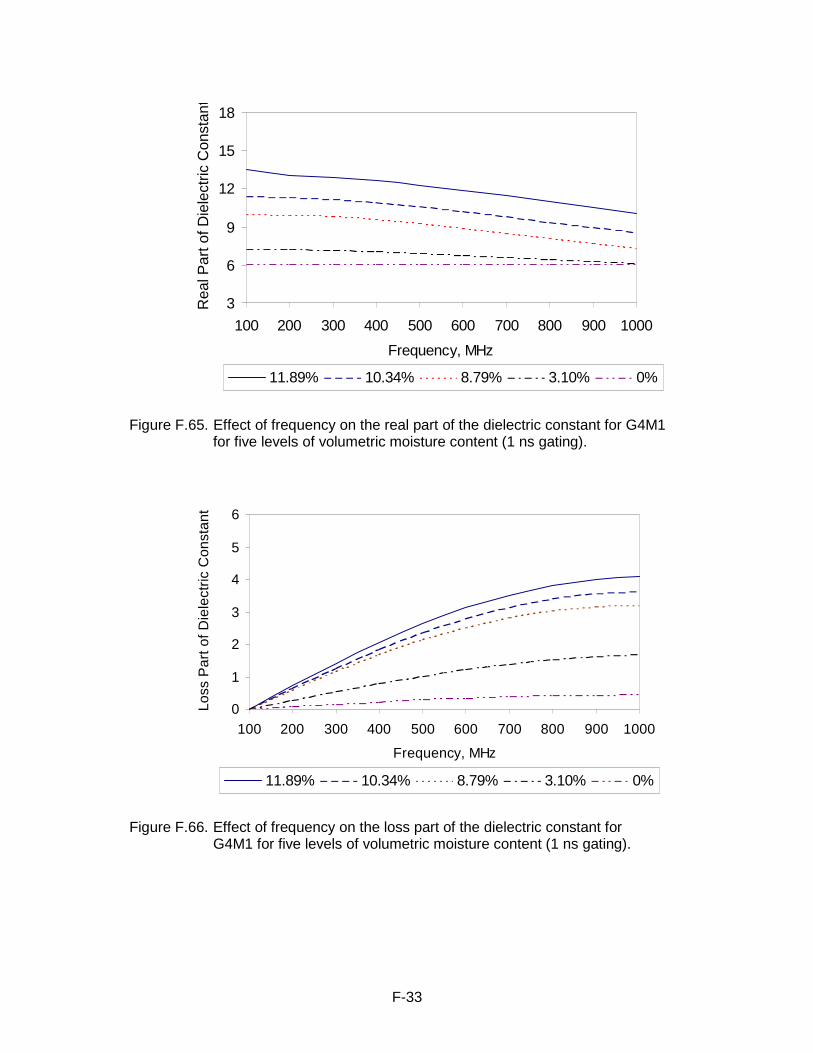
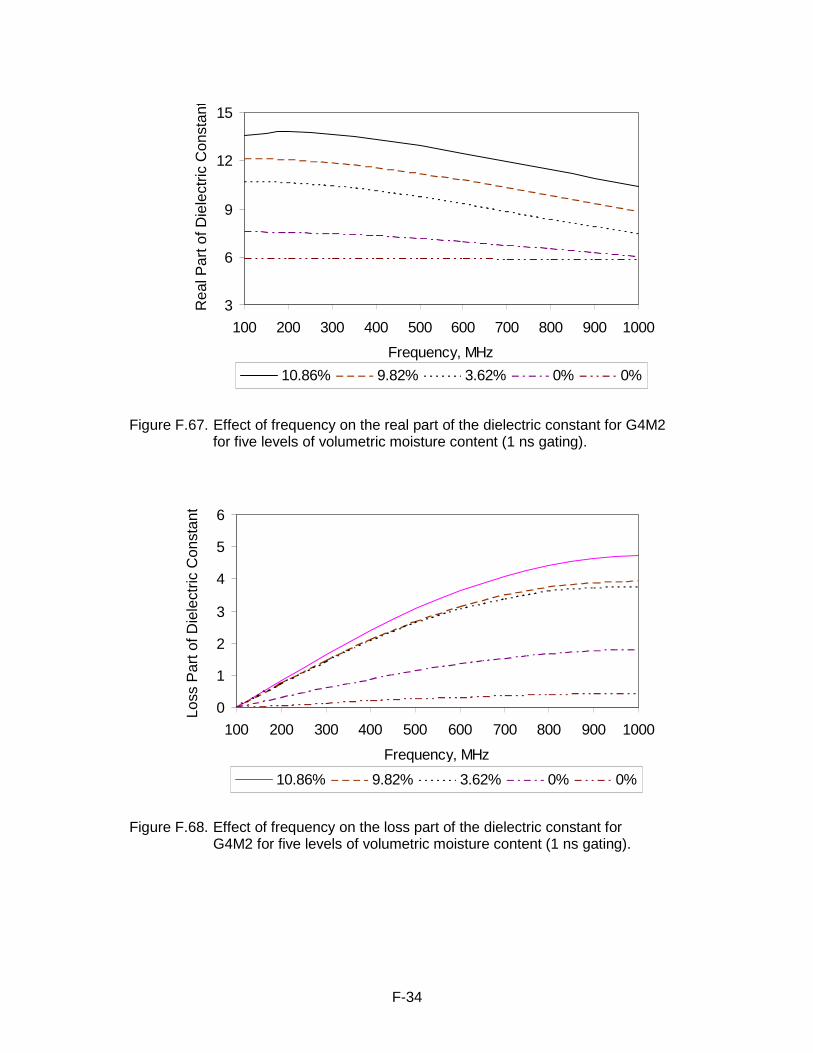
Figure 5.21 Effect of water content on the real part of the dielectric constant
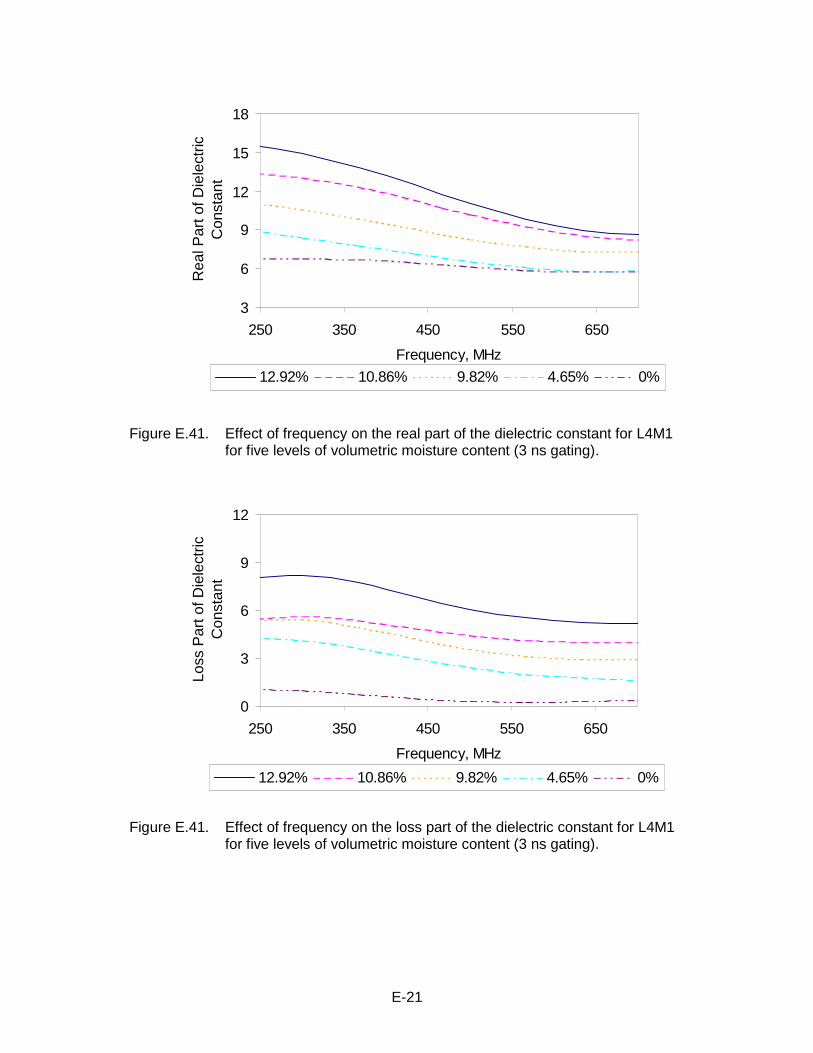
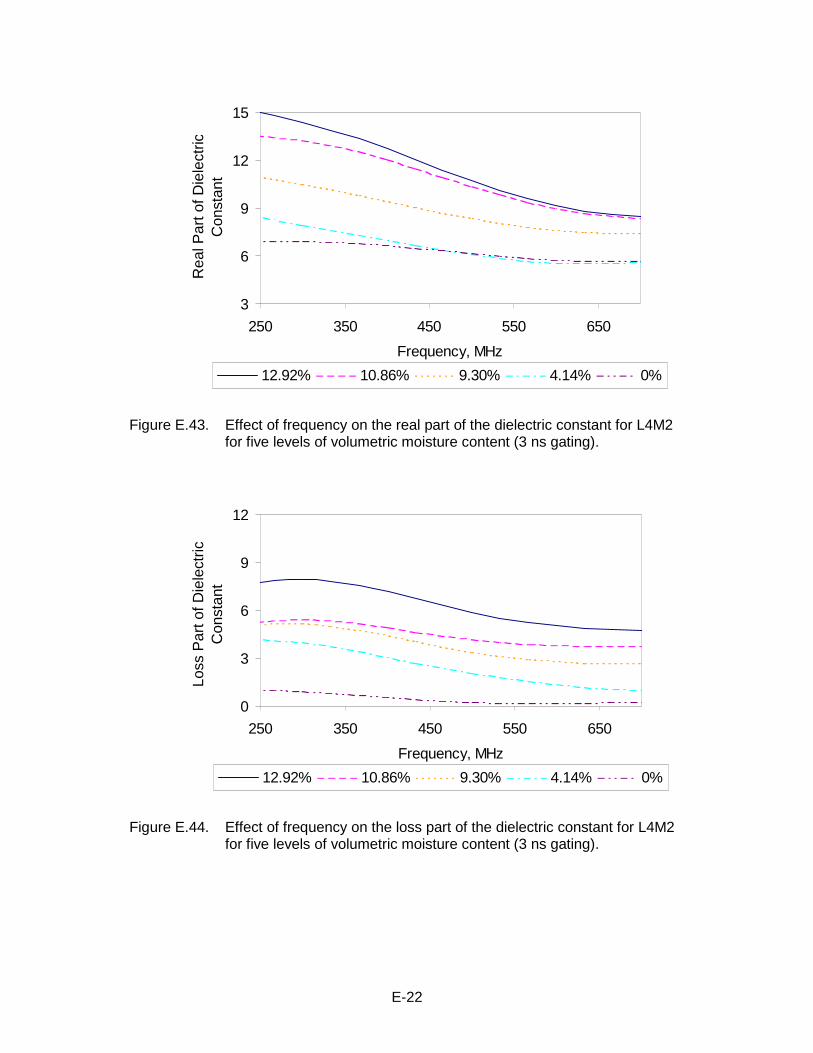
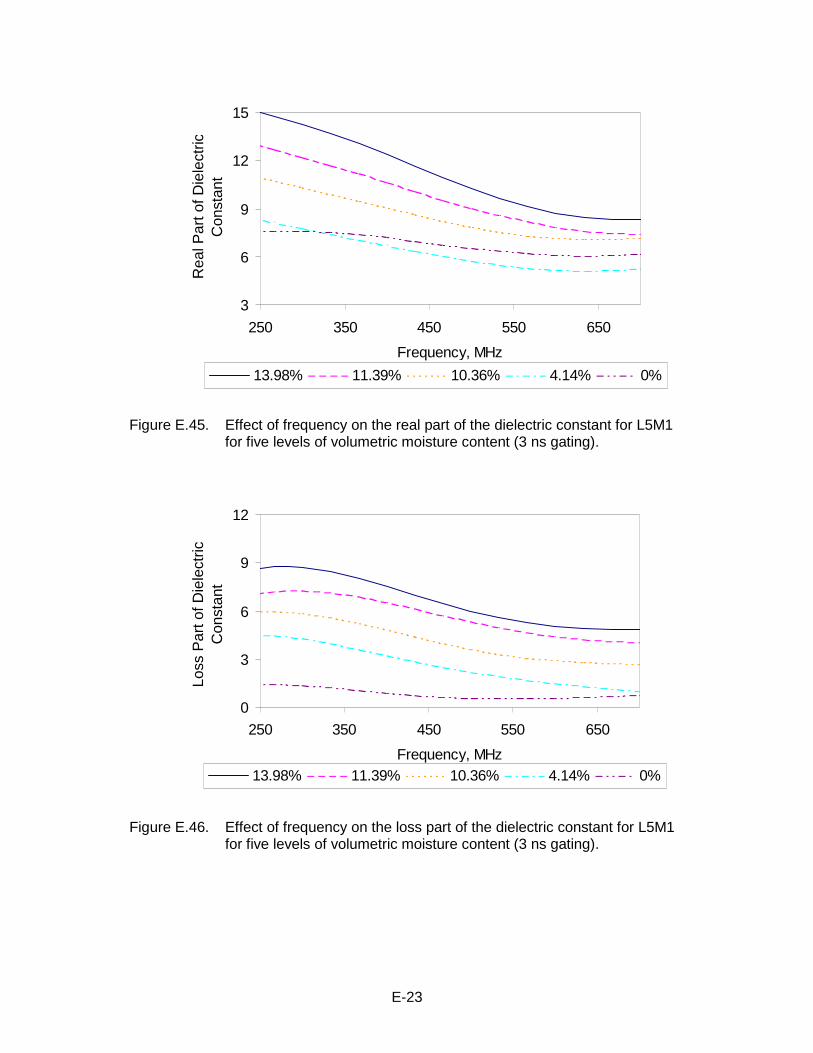
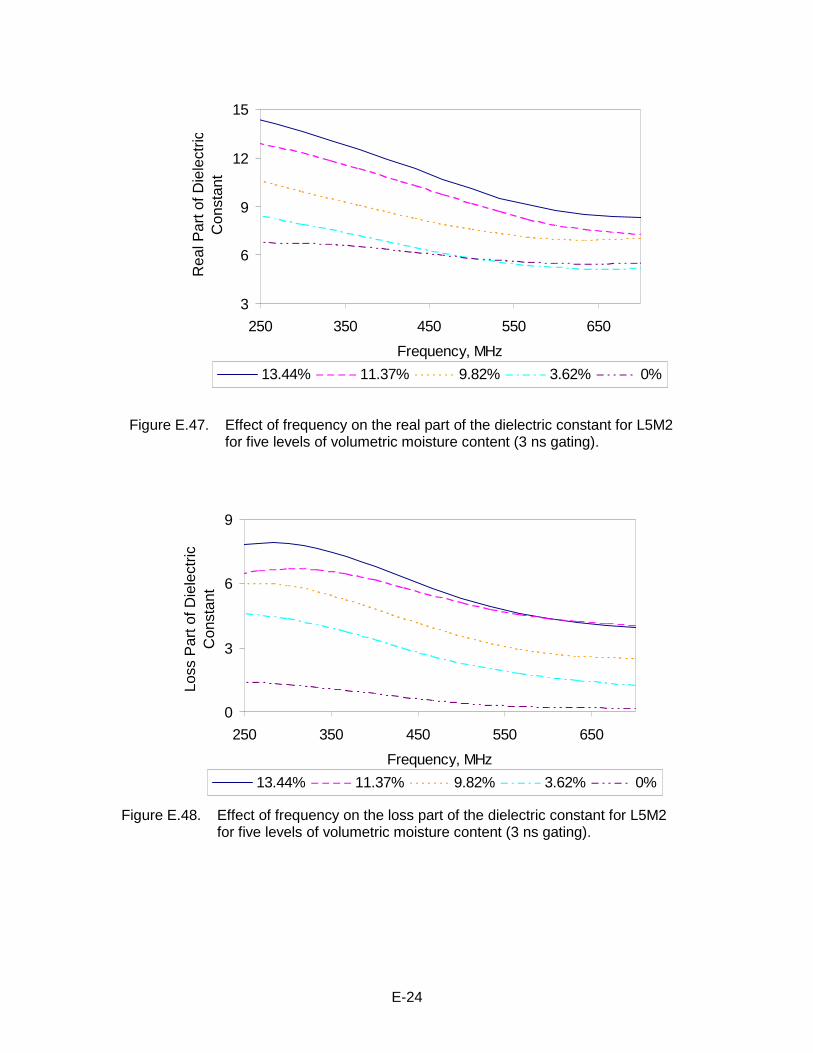
for G4M2, for measurements taken with a 3 ns time window 61
Figure 5.22 Effect of water content on the loss part of the dielectric constant
for G4M2, for measurements taken with a 3 ns time window 61
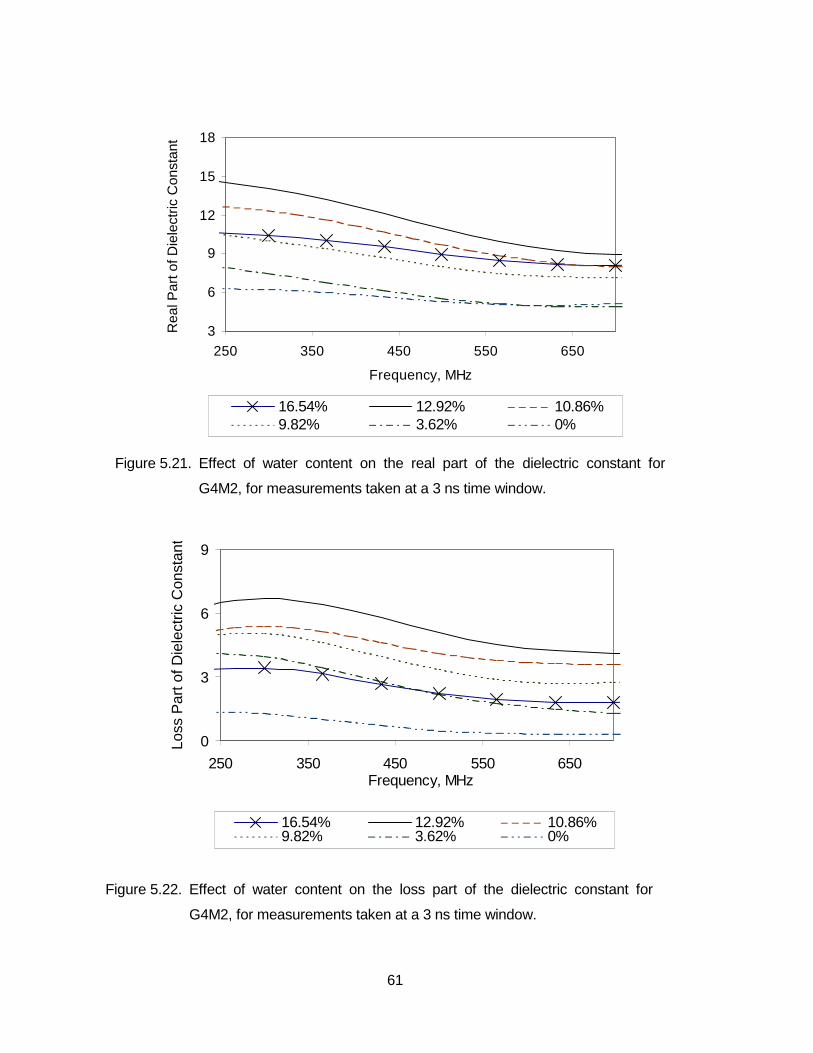
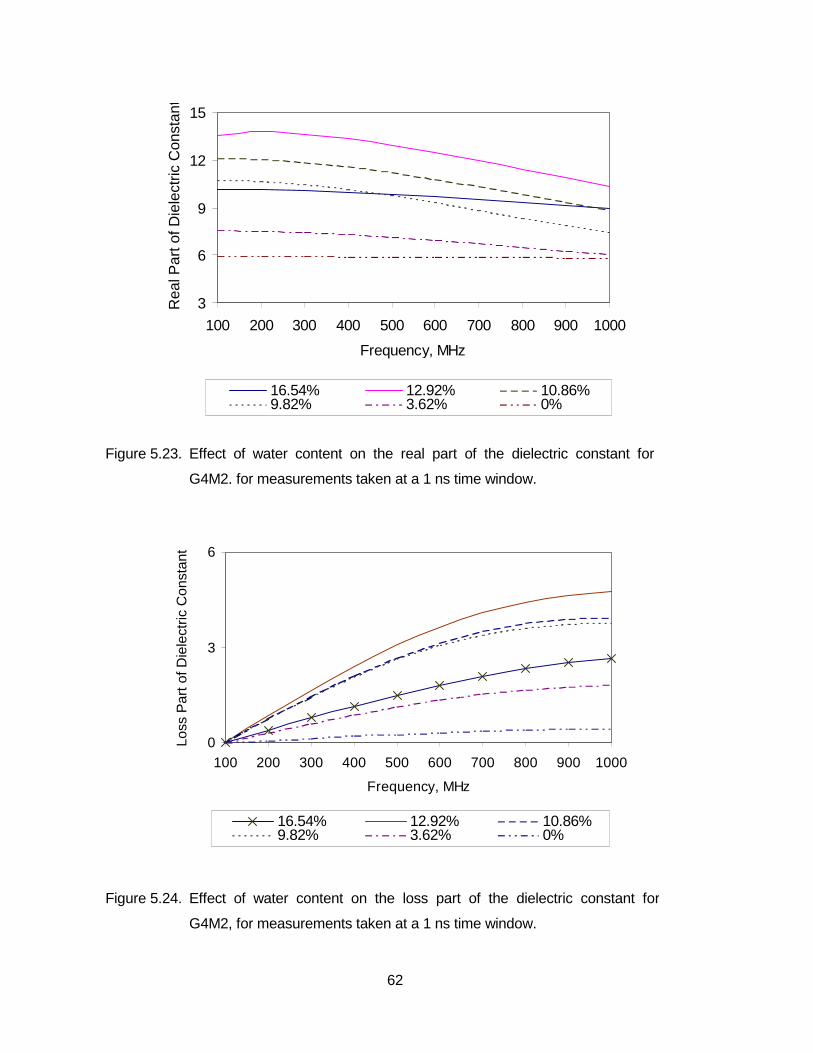
Figure 5.23 Effect of water content on the real part of the dielectric constant
for G4M2, for measurements taken with a 1 ns time window 62
Figure 5.24 Effect of water content on the loss part of the dielectric constant
for G4M2, for measurements taken with a 1 ns time window 62
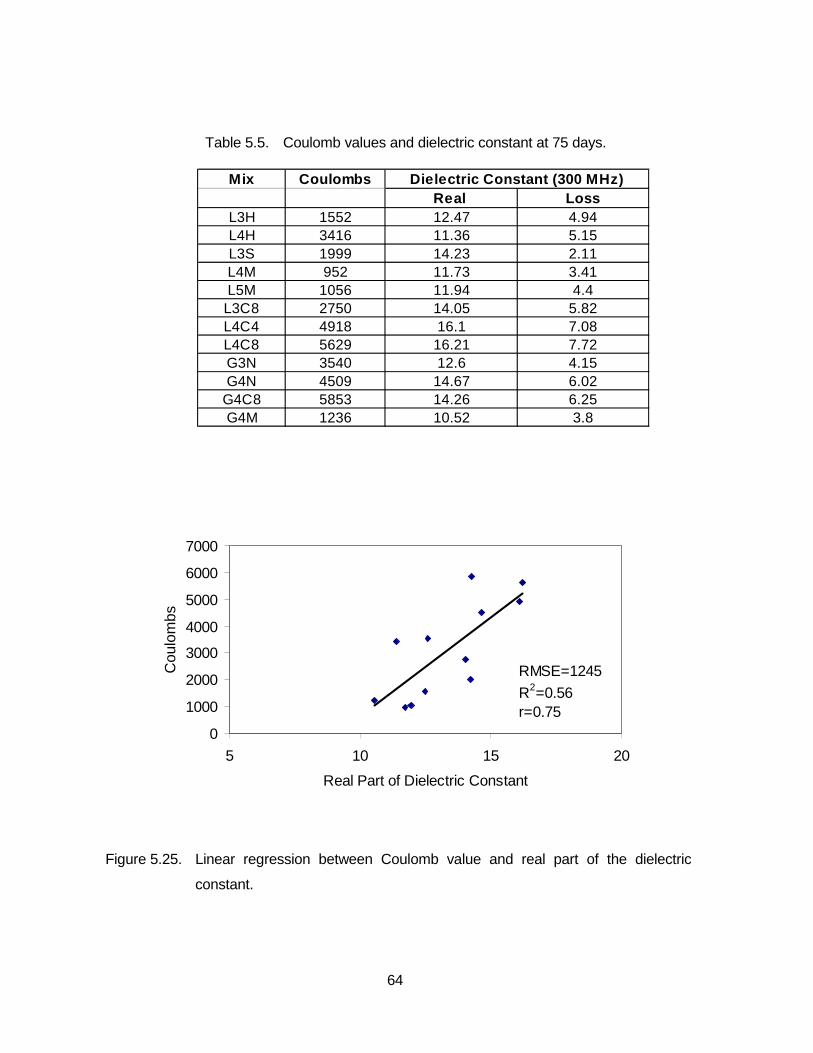
Figure 5.25 Linear regression between Coulomb value and real part of
the dielectric constant 64
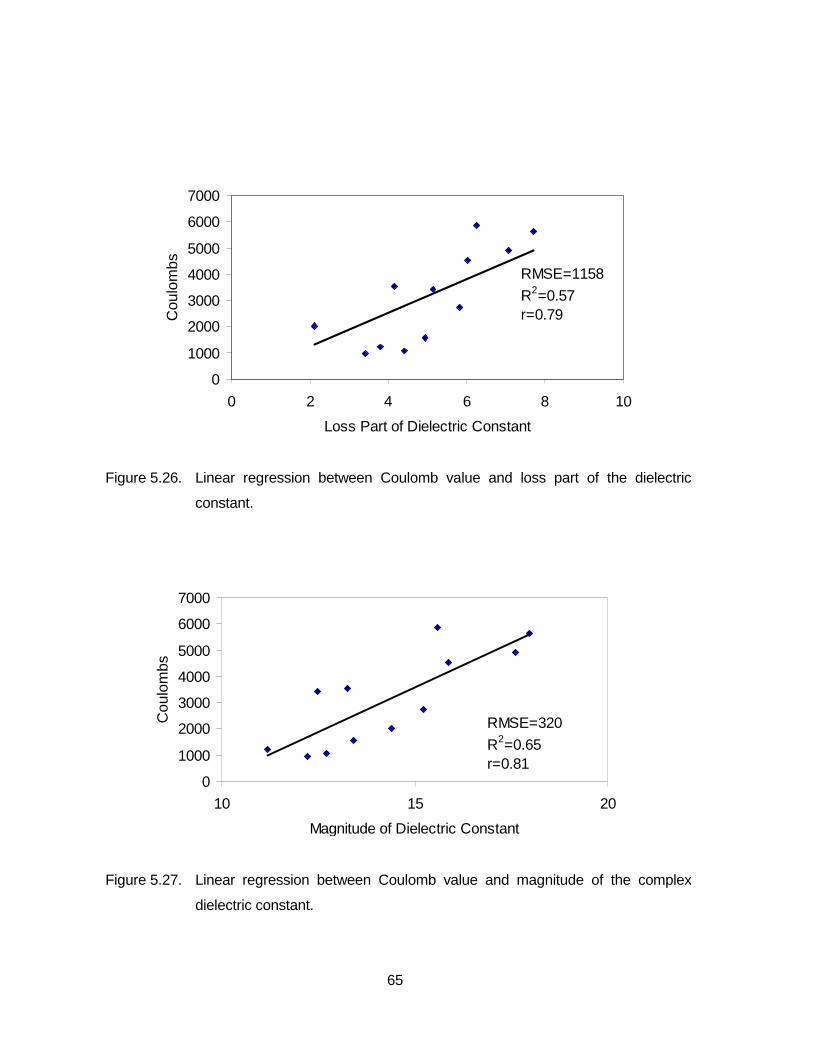
Figure 5.26 Linear regression between Coulomb value and loss part of
the dielectric constant 65
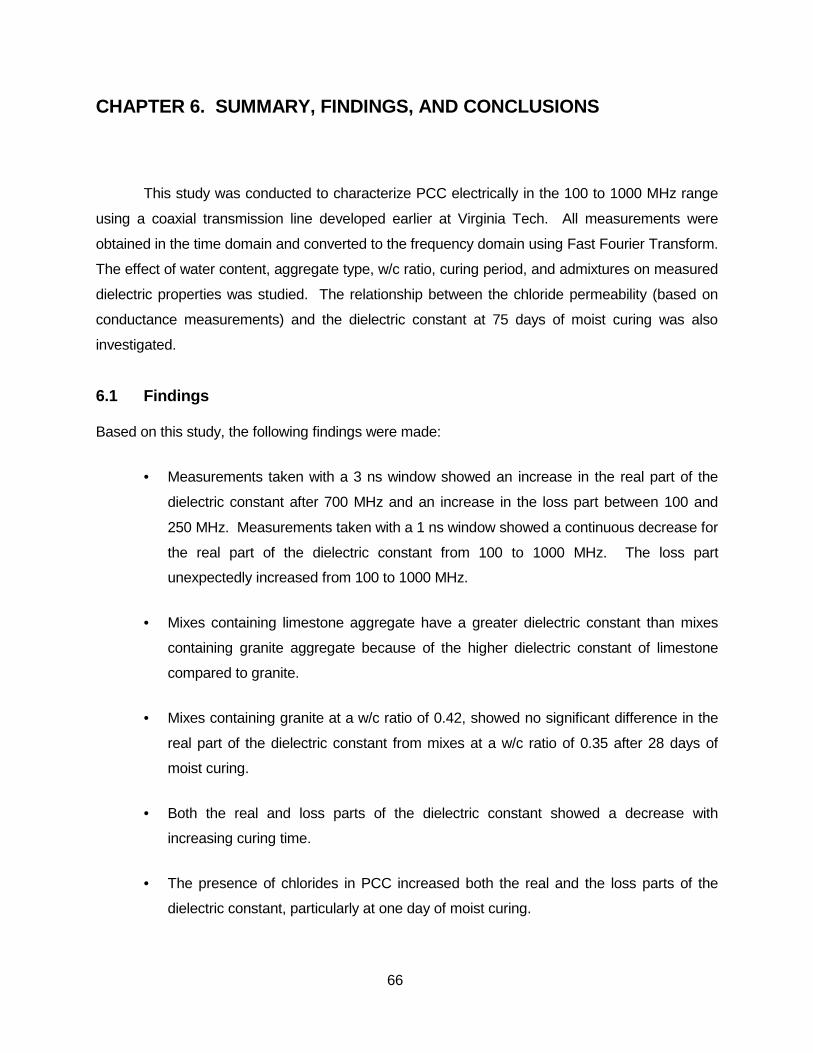
Figure 5.27 Linear regression between Coulomb value and magnitude of
complex dielectric constant 65
ix
LIST OF TABLES
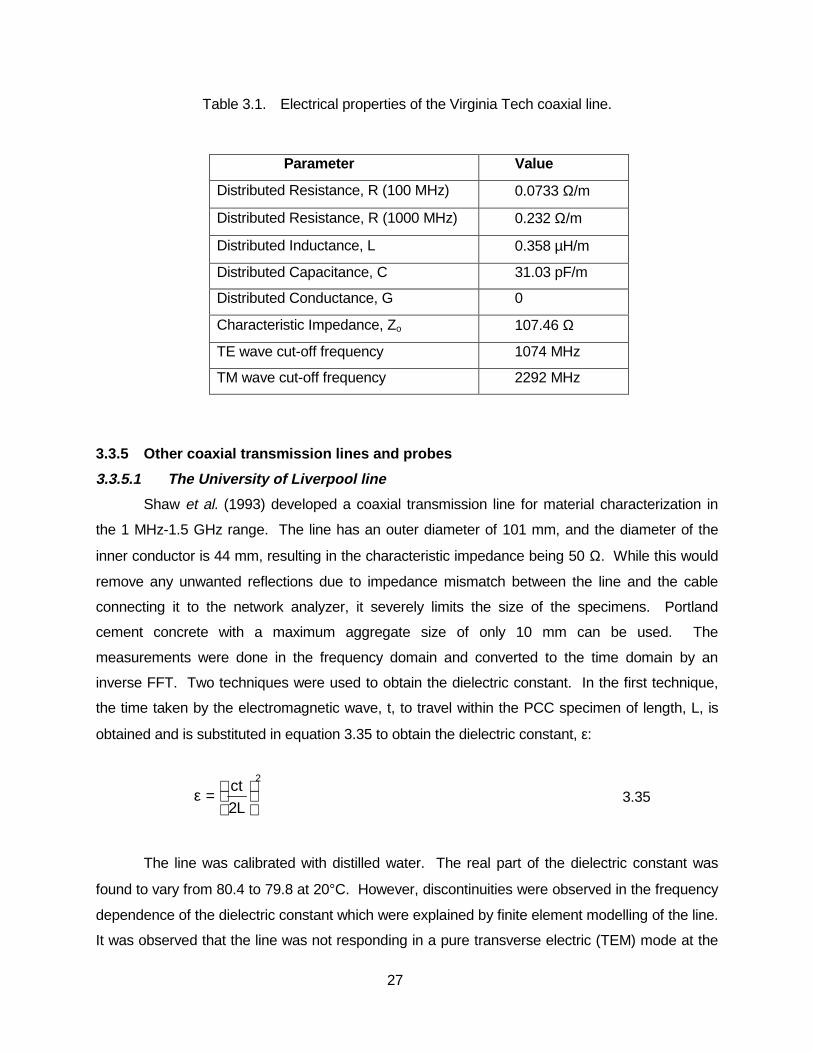
Table 3.1 Electrical properties of the Virginia Tech coaxial line 27
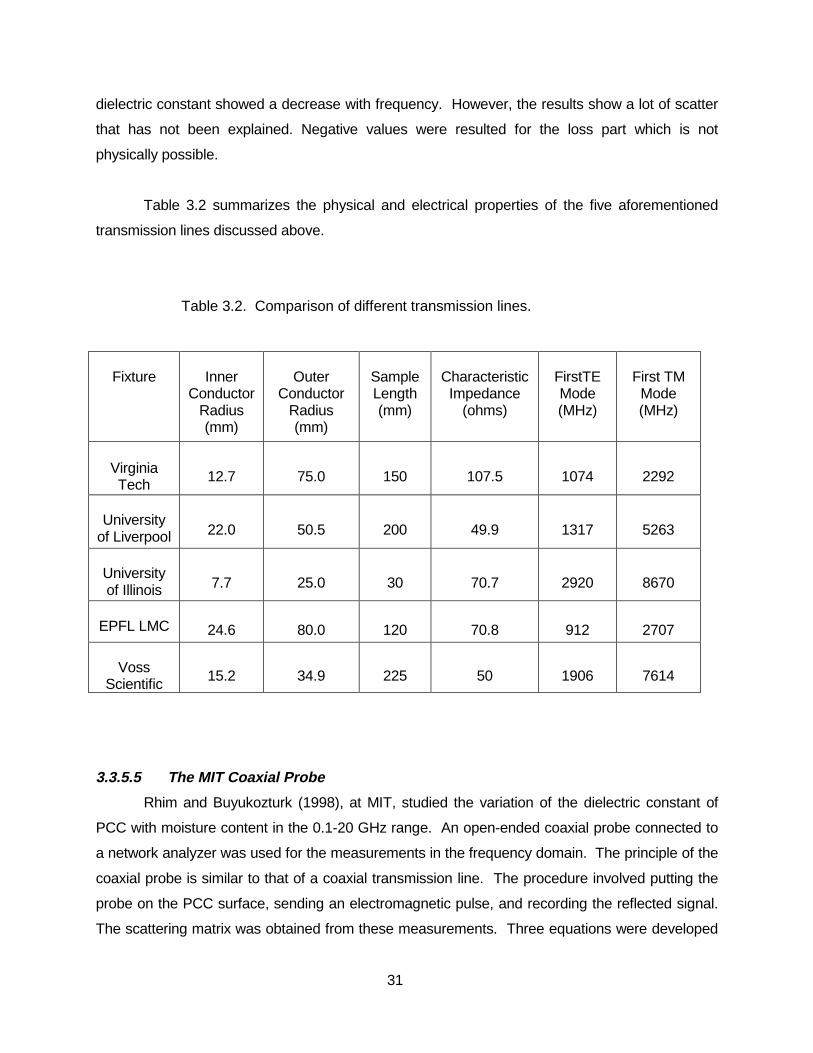
Table 3.2 Comparison of different transmission lines 31
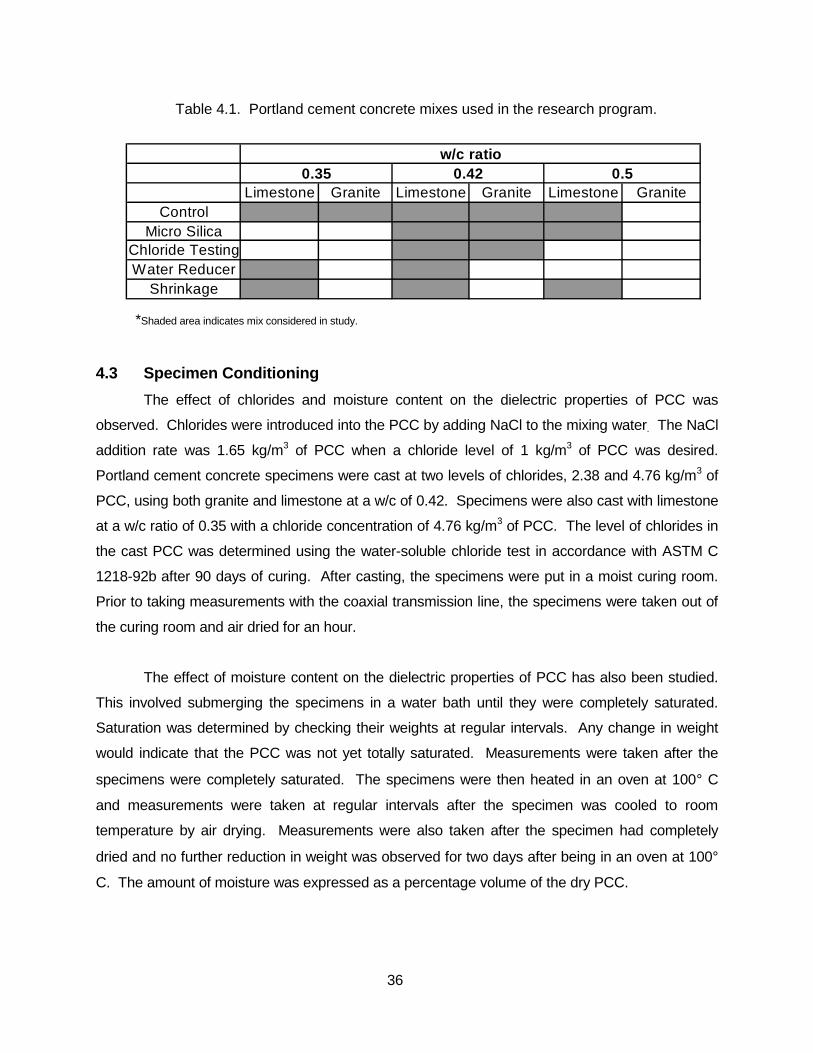
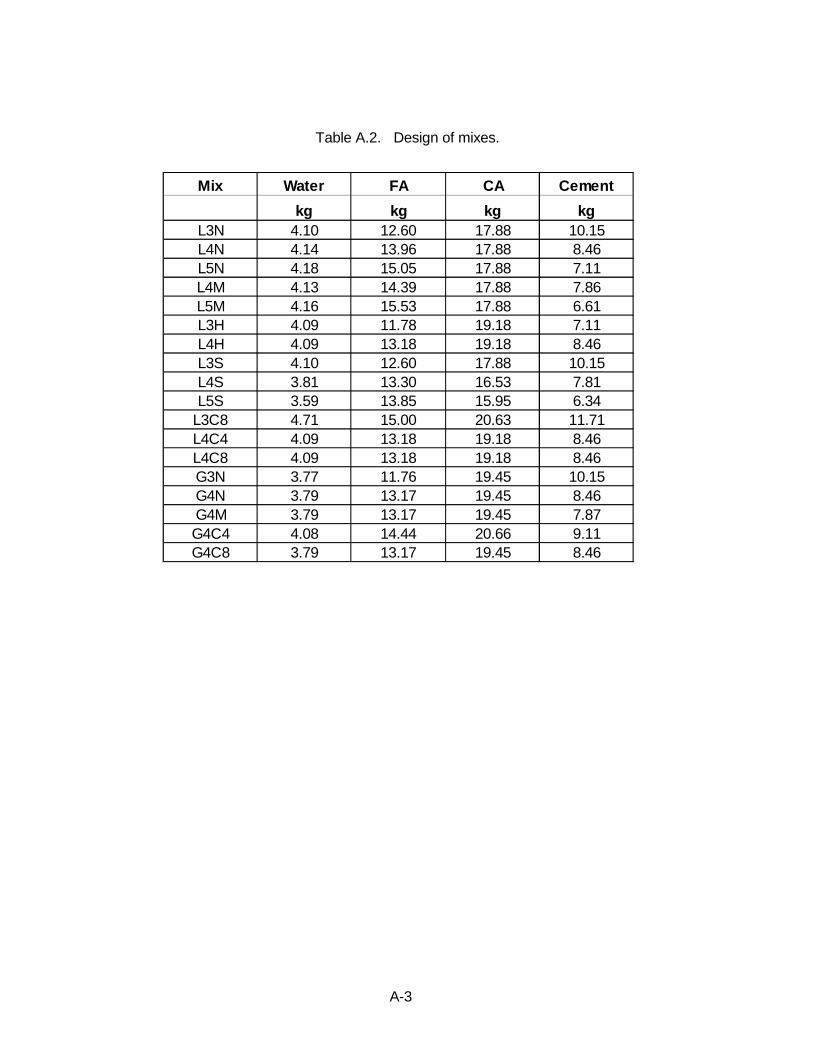
Table 4.1 Portland cement concrete mixes used in the research program 36
Table 5.1 Least significant difference (LSD) test results for the effect of curing 49
period on the dielectric constant
Table 5.2 Least significant difference (LSD) test results for the effect of w/c
ratio on the dielectric constant 52
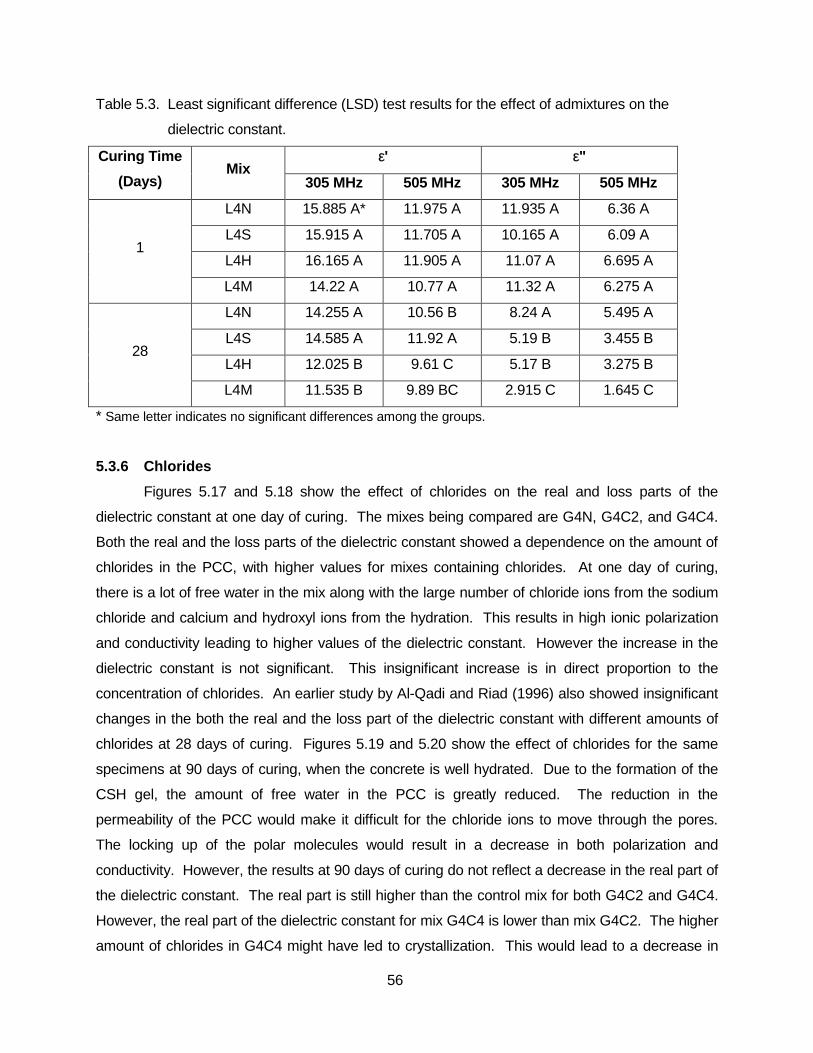
Table 5.3 Least significant difference (LSD) test results for the effect of
admixtures on the dielectric constant 56
Table 5.4 Least significant difference (LSD) test results for the effect of
curing period on the dielectric constant 59
Table 5.5 Coulomb values and dielectric constant at 75 days 64
1
CHAPTER 1. INTRODUCTION
1.1 Background
Portland Cement Concrete (PCC) is the most popular building material and accounts for a
large part of the infrastructure system. Roads are an important part of the infrastructure system
and concrete pavements constitute 6% of the total pavement length in the United States. There
are also about 575,000 bridges in the United States, a majority of which are built with concrete.
Unfortunately, the transportation infrastructure in the United States is currently deteriorating at an
alarming rate. Before any repairs can be undertaken on a PCC structure, its condition needs to
be evaluated to determine the existing conditions and understand the mechanisms of
deterioration. Nondestructive testing is one of the techniques that can be used for assessing the
structural condition. Nondestructive techniques are becoming increasingly popular due to their
ability to provide information not discernible to the unaided eye and conventional assessment
techniques. While nondestructive techniques are not perfect, they have great potential for in-situ
applications.
Among the nondestructive evaluation techniques is the use of electromagnetic waves.
Electromagnetic properties of materials show the interaction of a material with applied external
electric and magnetic fields. The main property of interest related to applications in PCC is the
complex dielectric constant. Changing properties and deterioration in PCC results in a change in
its electromagnetic properties. The amplitude and the phase measurement of the reflected and
the transmitted electromagnetic waves can provide information about internal flaws, material
compositon, porosity, state of curing, and moisture content of PCC. Therefore, electrically
characterizing PCC would allow for a better knowledge of its internal structure. In addition,
changes in dielectric properties of PCC at different frequencies may assist in optimizing the
frequency at which deterioration can be detected. The coaxial transmission line device is one of
the few techniques that can measure the dielectric properties of PCC at frequencies greater than
100 MHz.
The coaxial transmission line is mainly used for low loss transmission of power. However,
it has also been used as a tool for the dielectric characterization of materials, including PCC.
Coaxial transmission lines developed by various organizations have been used to test for the
2
effect of such factors as curing time, aggregate type, chlorides, and moisture content on the
complex dielectric constant. The transmission lines developed for testing PCC have larger than
normal dimensions to accommodate the size of the aggregates in the PCC mixes.
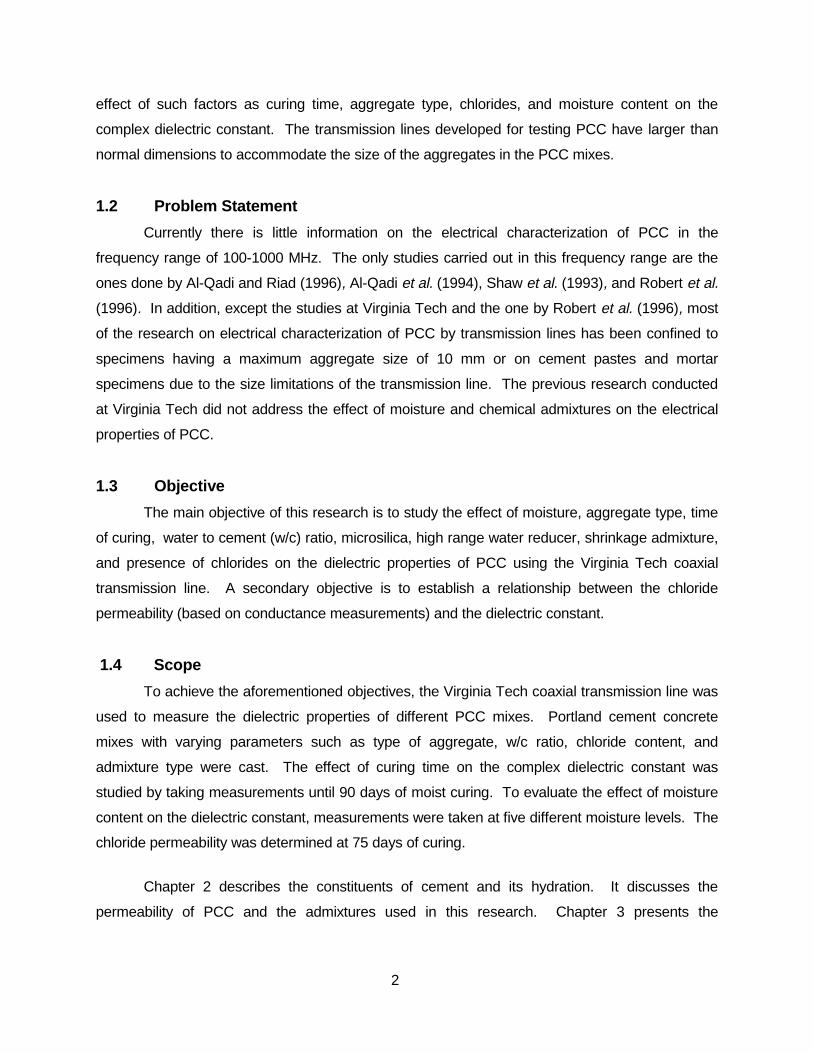
1.2 Problem Statement
Currently there is little information on the electrical characterization of PCC in the
frequency range of 100-1000 MHz. The only studies carried out in this frequency range are the
ones done by Al-Qadi and Riad (1996), Al-Qadi et al. (1994), Shaw et al. (1993), and Robert et al.
(1996). In addition, except the studies at Virginia Tech and the one by Robert et al. (1996), most
of the research on electrical characterization of PCC by transmission lines has been confined to
specimens having a maximum aggregate size of 10 mm or on cement pastes and mortar
specimens due to the size limitations of the transmission line. The previous research conducted
at Virginia Tech did not address the effect of moisture and chemical admixtures on the electrical
properties of PCC.
1.3 Objective
The main objective of this research is to study the effect of moisture, aggregate type, time
of curing, water to cement (w/c) ratio, microsilica, high range water reducer, shrinkage admixture,
and presence of chlorides on the dielectric properties of PCC using the Virginia Tech coaxial
transmission line. A secondary objective is to establish a relationship between the chloride
permeability (based on conductance measurements) and the dielectric constant.
1.4 Scope
To achieve the aforementioned objectives, the Virginia Tech coaxial transmission line was
used to measure the dielectric properties of different PCC mixes. Portland cement concrete
mixes with varying parameters such as type of aggregate, w/c ratio, chloride content, and
admixture type were cast. The effect of curing time on the complex dielectric constant was
studied by taking measurements until 90 days of moist curing. To evaluate the effect of moisture
content on the dielectric constant, measurements were taken at five different moisture levels. The
chloride permeability was determined at 75 days of curing.
Chapter 2 describes the constituents of cement and its hydration. It discusses the
permeability of PCC and the admixtures used in this research. Chapter 3 presents the
3
electromagnetic properties of materials and the features of the different currently researched
coaxial transmission lines including the modes of propagation and their parameters.
Chapter 4 focuses on the experimental program. It describes the materials used in
preparing the specimens, dielectric and chloride permeability measurements (based on
conductance measurements), and the rationale behind choosing the different mixes. Data
analysis and results are presented in Chapter 5. In this chapter, the procedure used to analyze
the measurements, the time window used for the measurements, and the factors affecting the
measured dielectric properties are discussed. Chapter 6 summarizes the findings and
conclusions of this study.
4
CHAPTER 2. STRUCTURE AND PROPERTIES OF PORTLAND
CEMENT CONCRETE
2.1 Portland Cement Concrete
For over a hundred and fifty years, Portland cement concrete (PCC), which is a mixture of
cement, water and aggregate, has been the most commonly used building material because it is
durable, cheap, and readily available and can be cast into almost any shape. The main
components of PCC are the hydrated cement paste, aggregates, water, and the transition zone.
2.1.1 Hydrated cement paste (HCP)
The main constituent of PCC is cement, which is made up of calcium, silica, alumina, and
iron oxide. Calcium carbonate materials like limestone provide the calcium, while clay is usually
the source for silica, alumina, and iron oxide. The manufacture of cement involves the crushing
and grinding of the raw materials to about 75 microns in size and then mixing them together in the
kiln. This mix is then heated to about 1000°C. The reactions inside the kiln produce Tricalcium
silicate (3CaO.SiO2), Dicalcium silicate (2CaO.SiO2), Tricalcium aluminate (3CaO.Al2O3), and
Tetracalcium aluminoferrite (4CaO.Al2O3.Fe2O3). In order to simplify the usage of these terms,
they have been abbreviated as C3S, C2S, C3A, and C4AF, respectively. The composition of these
compounds ranges from 45-60%, 15-30%, 6-2% and 6-8%, respectively (Mehta, 1986). These
compounds do not exist in a pure form. The C3S phase is a solid solution containing magnesium
and aluminum and is called alite. The phase containing C2S along with aluminum, magnesium
and potassium dioxide is called belite. The C3A phase is called aluminate phase and consists of
magnesium, sodium, potassium, and silica along with the C3A. The C4AF phase is called the
ferrite phase.
The chemical reaction of cement with water is called hydration. The hydration of silicates
produces a calcium silicate hydrate gel that accounts for 60-70% of the volume of solids in the
HCP (Ramachandran, 1995). The reaction of the C3S with water is the following:
2C3S+6H → CSH+3CH 2.1
where CSH stands for 3CaO.2SiO2.3H2O and CH stands for Ca(OH)2.
5
This gel is poorly crystalline and contains particles of colloidal size. Although its exact
structure is not known, it is believed that the gel has a layer structure with a very high surface area
of the order of 100-700 m2/g (Powers, 1958). The distance between the layers is of the order of
18A°. The layers are bound together by van der Waals forces, which imparts strength to the
paste. The gel does not have a fixed composition and the C/S ratio keeps on decreasing as
hydration progresses. The gel is also referred to as the CSH gel because the composition is not
fixed.
Since hydration is an exothermic reaction, it can also be explained by calorimetric studies.
There are five stages in the hydration of C3S (Ramachandran, 1995). In the first stage, C3S
reacts with water and releases CSH, calcium, and hydroxyl ions into the solution while liberating a
large amount of heat (equation 2.1). This stage, called the pre-induction stage, usually lasts
about 15 to 20 minutes. The second stage, called the dormant or induction period, lasts a few
hours. The hydration slows down considerably during this stage and there is little evolution of
heat. The next stage finds the reaction accelerating and the amount of heat reaching a maximum
level at its end. This peak corresponds to the final set. A deceleration in the rate of reaction
occurs in the fourth stage which might take place over a few days. In the fifth stage which lasts for
a few years, there is almost no reaction and very little evolution of heat.
When hydrated, C2S also gives out CSH. The reaction is given by:
2C2S+4H → CSH+CH 2.2
Calorimetric studies have shown similar results to that of hydration of C3S, but with less
heat evolution. According to stoichometric calculations, the hydration of C3S would produce 61%
of CSH gel and 39% of CH, while the hydration of C2S would produce 82% of CSH gel and only
18% of CH (Mehta, 1986) Therefore, a higher quantity of C2S in the cement would result in more
strength. For early strength, however, more C3S is needed, because its reaction rate is higher.
The other major component in the hydration of silicates is calcium hydroxide, which is
crystalline with a hexagonal prismatic shape. It occupies 20-25% of the volume of solids in the
hydrated paste (Ramachandran, 1995). It does not contribute to the strength of the PCC since it
has a lower surface area than the CSH. In fact, the presence of CH may be a liability, because it
is highly soluble and susceptible to acidic and sulfate attack.
6
Tricalcium aluminate (C3A), the compound responsible for the early setting of cement, has
the highest rate of reaction with water among the constituents of cement. Gypsum is added to
cement to retard this rapid reaction. Tricalcium aluminate reacts with gypsum and water to form
needle shaped prismatic crystals, called ettringite. The reaction is given by:
323623 HSACH26HSC3AC →++ 2.3
where 2HSC stands for CaSO4.2H2O and 3236 HSAC stands for 3CaO.Al2O3.3CaSO4.32H2O.
After the consumption of all gypsum into ettringite, the excess C3A reacts with ettringite to form
sulfoaluminate hydrate. This reaction is given by:
3236 HSAC +2C3A + 4H → 124 HSAC3 2.4
where 124 HSAC stands for 3CaO.Al2O3.CaSO4.12H2O.
C4AF hydrates to give structurally similar products as C3A. However, gypsum retards the
reaction more effectively than it does with C3A. In the first stage of the reaction, it forms a high
calcium sulfoaluminate form that reacts with the excess C4AF to give a low sulfoaluminate form.
These sulfoaluminates occupy about 15-20% of the volume of solids in the paste and influence
the early setting and hardening reactions of the cement paste.
2.1.2 Aggregates
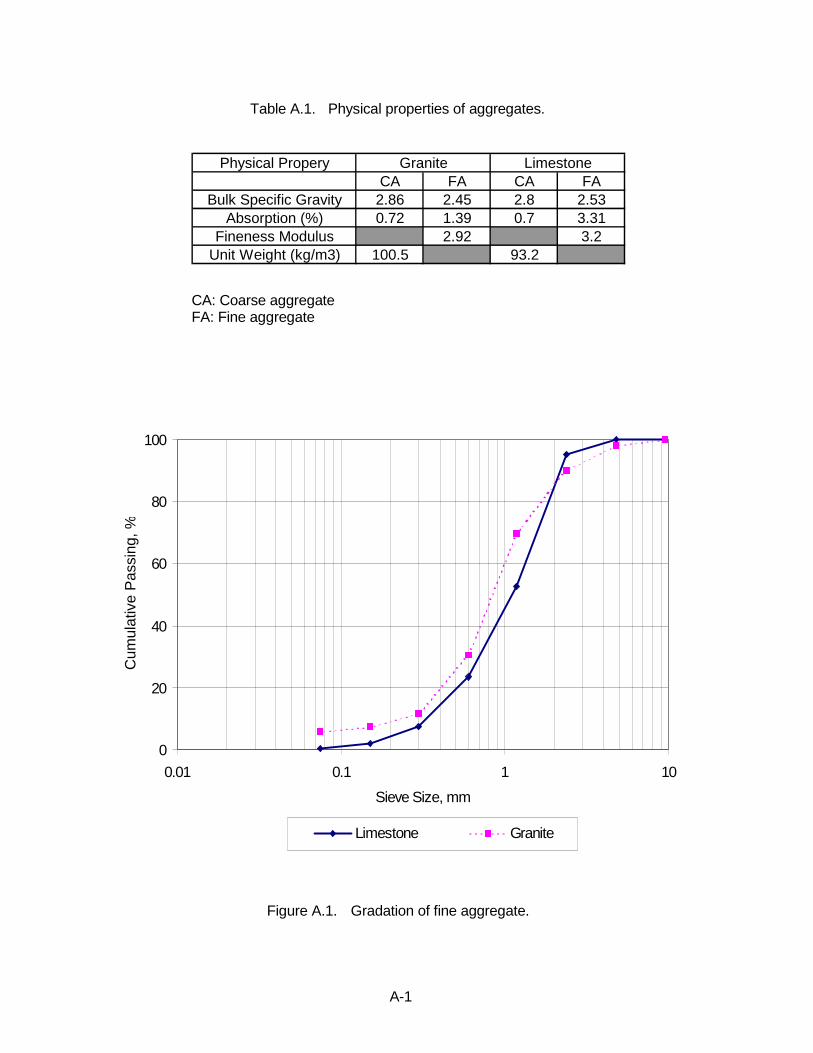
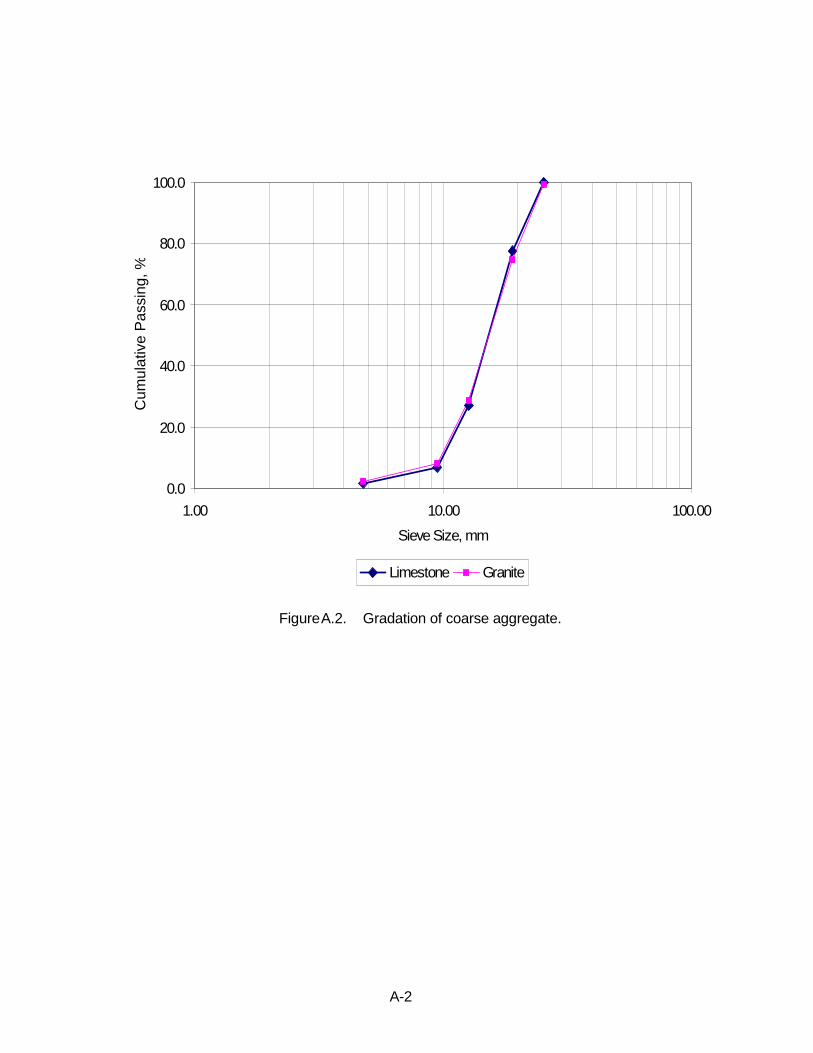
Aggregates occupy 60 to 80% of the volume of PCC (Mehta, 1986). The role of aggregate
in PCC is as a filler. Aggregates can be classified on the basis of their size. Aggregates greater
than 4.75 mm are called coarse aggregate and those smaller than 4.75 mm are called fine
aggregate. Aggregates play a significant role in the physical properties of PCC. They affect the
unit weight, elastic modulus, absorption, and the durability of PCC. The properties of PCC are
also affected by the shape, texture and gradation of the aggregate. Aggregates are usually
stronger than cement paste and therefore do not play a significant role in the strength of PCC.
Aggregate reaction with cement may be detrimental such as alkali-silica reaction.
7
2.1.3 Water
Portland cement concrete has a number of voids that are usually filled with water.
Depending on the type of voids and the degree of firmness with which the water is held in these
voids, water can be classified as capillary water, adsorbed water, and interlayer water. Capillary
voids are spaces in PCC that are not filled by the products of hydration. The water in these voids,
called capillary water, can be further subdivided into free and bound water. Free water is the
water present in voids greater than 50 nm in size, while the water in voids in the 5-50 nm range
constitutes bound water. As will be explained later, bound water is crucial from the point of view
of shrinkage. Free water, on the other hand is responsible for the electrical conductivity of PCC.
Adsorbed water is the water bonded to the surface of the CSH gel. The water present between
the layers of the CSH gel is called interlayer or zeolitic water. Adsorbed water and interlayer
water do not have an impact on the conductivity.
2.1.4 Transition zone
The transition zone, the region that exists between the hydrated cement paste and the
aggregate, is very thin, with a thickness on the order of 10 to 50 µm. The transition zone is
important in that it is the weakest zone in the PCC and thus influences its stiffness and durability.
In the early stages, the transition zone is made up of ettringite and calcium hydroxide, both of
which contain large crystals that result in more voids in the zone. Due to the larger size and high
number of voids, the van der Waals force of attraction with the aggregates is low compared to the
HCP, resulting in lower strength. Hydration takes place slowly in the transition zone; thus strength
increases when the voids start getting filled with CSH along with a decrease in calcium hydroxide.
Cracking may start at 70% of the ultimate strength of PCC. The properties affecting the strength
of the transition zone are the capillary voids, the amount of calcium hydroxide, and the presence
of microcracks. The transition zone also affects the durability of PCC; the microcracks present in
the transition zone increase the permeability of the PCC, thus making it easy for corrosion to take
place.
2.2 Admixtures
Portland cement concrete by itself does not possess all the required properties. Hence
admixtures are added. An admixture, as defined by ASTM, is a material other than water,
aggregates, hydraulic cements, and fiber reinforcement, that is used as an ingredient of PCC or
mortar and added to the batch immediately before or during mixing. There are hundreds of
admixtures currently in use and it is reported that about 71% of the PCC placed in the United
8
States contains at least one admixture (Mehta, 1986). Admixtures fall into two categories:
admixtures that act by changing the surface tension of water (e.g., superplasticizers) and those
that break up into their ionic constituents and affect the chemical reactions between cement
compounds and water (e.g., fly ash). In this thesis, only admixtures related to this research are
discussed.
2.2.1 Pozzolans
Pozzolans are defined as noncementitious materials that contain constituents which
combine with the calcium hydroxide in the hydrated cement paste in the presence of water to form
stable insoluble compounds possessing cementing properties (Lea, 1971). Pozzolans can be
divided into two groups, natural and artificial. The natural pozzolans include materials of volcanic
origin and certain diatomaceous earths. Artificial pozzolans are the more commonly used types
and include burnt clay and shales, fly ash, blast furnace slag, and microsilica. The pozzolan on
combination with the lime forms a hydrated calcium silicate similar to the CSH gel and
tetracalcium aluminate hydrate. When calcium sulphate is present, ettringite is formed initially and
later transforms into the monosulphate as gypsum is removed from the solution.
Microsilica is being used more and more as a pozzolan. It is a by-product of electric arc
furnaces used to reduce high purity quartz with coal in the production of elemental silicon and
ferrosilicon alloys. This process produces SiO vapors that oxidize and condense into minute
spherical particles of the order of 1 µm, which are called microsilica or silica fume. Microsilica
particles react with the calcium hydroxide in the transition zone and form a large number of small
crystals. This results in a significant improvement in the microstructure of the hydrated cement
paste in the transition zone. With an increase in the amount of microsilica, there is a reduction in
thickness of the transition zone and also the amount of water bound to the aggregate. This
translates to increased strength and reduced permeability due to reduction in porosity. A
reduction in bleeding has also been reported.
An added advantage is that microsilica, which is a waste product, can be put to good use.
It is superior to fly ash (obtained by combustion of powdered coal in power plants and comes in
many types) in that it does not exhibit the variability in composition and heterogeneity in
mineralogical character which fly ash does. Because of its higher surface area, the rate of
reaction with calcium hydroxide is significantly higher than it is with fly ash. This results in earlier
attainment of higher strength. Typical addition rate of microsilica in the state of Virginia is 7% by
9
weight of cement. Because of the increased surface area, more water is needed. Therefore,
super plasticizers are also required.
2.2.2 Superplasticizers
Water reducing admixtures are chemicals that increase workability of PCC and allow
reduction of water. Superplasticizers or High range water reducers differ from conventional water
reducers in that they are capable of reducing the water requirement by up to 30% (Mehta, 1986).
They can also increase the slump by up to 250 mm (Mehta, 1986). More significant than the
increase in workability is the fact that PCC having lower w/c ratios can be used. Theoretically a
w/c ratio of 0.27 is adequate for hydration and any water greater than this ratio lowers the
potential compressive strength that can be achieved (Cement and Concrete Association
Publication 45.030). It has also been observed that PCC containing superplasticizers have high
ultimate strengths, excellent durability, and water proofing characteristics.
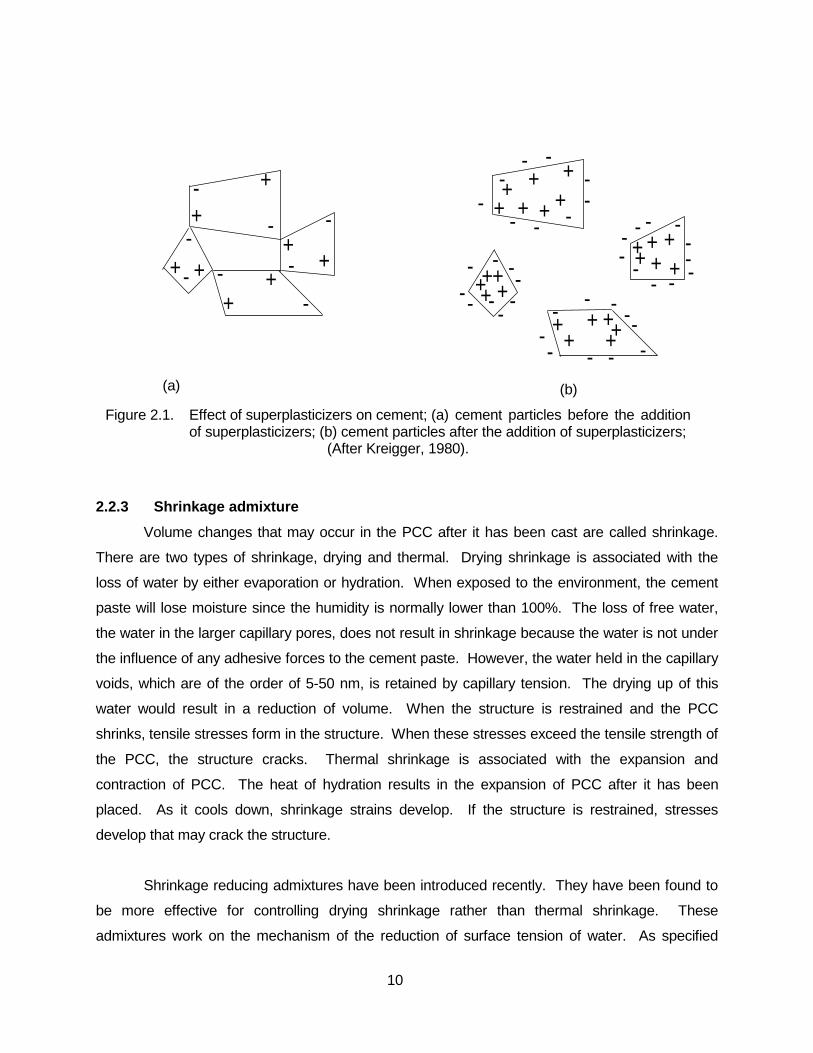
The three commonly used superplasticizers are sulfonated melamine formaldehyde,
sulfonated naphtalene formaldehyde, and modified lignosulfates. Superplasticizers work on the
principle of dispersion of cement particles. They are composed of long chained organic molecules
that are hydrophobic at one end and hydrophillic at the other. The superplasticizer is adsorbed
onto the cement particles where its anionic nature imparts a negative charge to the cement
particles that results in their mutual repulsion. Thus, less water is required. Figure 2.1 shows the
working of superplasticizers. It has been observed that superplasticized PCC exhibits an
acceleration of the hydration process that might be attributed to the good dispersion of the cement
particles. Due to the higher rate of hydration, superplasticized PCC show higher compressive
strengths at one, three, and seven days than PCC containing no super plasticizer (Mehta, 1986).
Superplasticizers are also needed when pozzolanic materials like microsilica and fly ash are used
because of the higher water requirement due to an increased surface area.
10
2.2.3 Shrinkage admixture
Volume changes that may occur in the PCC after it has been cast are called shrinkage.
There are two types of shrinkage, drying and thermal. Drying shrinkage is associated with the
loss of water by either evaporation or hydration. When exposed to the environment, the cement
paste will lose moisture since the humidity is normally lower than 100%. The loss of free water,
the water in the larger capillary pores, does not result in shrinkage because the water is not under
the influence of any adhesive forces to the cement paste. However, the water held in the capillary
voids, which are of the order of 5-50 nm, is retained by capillary tension. The drying up of this
water would result in a reduction of volume. When the structure is restrained and the PCC
shrinks, tensile stresses form in the structure. When these stresses exceed the tensile strength of
the PCC, the structure cracks. Thermal shrinkage is associated with the expansion and
contraction of PCC. The heat of hydration results in the expansion of PCC after it has been
placed. As it cools down, shrinkage strains develop. If the structure is restrained, stresses
develop that may crack the structure.
Shrinkage reducing admixtures have been introduced recently. They have been found to
be more effective for controlling drying shrinkage rather than thermal shrinkage. These
admixtures work on the mechanism of the reduction of surface tension of water. As specified
Figure 2.1. Effect of superplasticizers on cement; (a) cement particles before the additionof superplasticizers; (b) cement particles after the addition of superplasticizers;
(After Kreigger, 1980).
(a) (b)
+-+ -
- ++
--
-+ ++
+-
-
+-+ -
- ++
-
-
--
-
-
---
-+++
++
+ -+++
++-
++++
+- -
---
----
----
---
- - -
-
-
-++++
- -
11
earlier, in voids less than 50 nm in size, as the water evaporates, curved menisci are formed and
the surface tension of water pulling the walls of the voids results in shrinkage. The use of the
shrinkage admixtures reduces the surface tension, resulting in reduction of the force pulling in the
walls of the voids. A reduction in shrinkage of up to 80% has been observed at 28 days. The
addition of these admixtures has also been found to reduce the heat of hydration. However, the
use of shrinkage admixtures has been found to reduce the compressive strength by about 10%.
Manufacturers therefore recommend the use of super plasticizers to reduce w/c ratio of the mix.
2.3 Permeability of Portland Cement Concrete
According to the ACI, permeability of water in PCC is defined as the rate of discharge of
water under laminar flow conditions through a unit cross-sectional area of a porous medium under
a unit hydraulic gradient and a temperature of 20°C. It is one of the most important properties of
PCC relating to its durability. This is because the durability of the PCC structure is affected by the
transport of water containing chloride and sulfate ions through its pore system.
While permeability depends on the porosity to a large extent, it does not depend just on
the level of porosity. It also depends on the size of the pores and how well they are
interconnected. While the permeability is mainly due to the capillary pores, the gel pores are also
responsible. However, their permeability is only 7×10-16 compared to 10-14 for the capillary pores
(Powers, 1958). The permeability of PCC is due to both the cement paste and the aggregate.
The addition of low permeable aggregate to the cement paste should decrease the permeability.
However, according to Mehta (1986), the opposite is true. He attributes this increase in
permeability to the presence of micro cracks in the transition zone. Also, the porosity and pore
sizes are greater in the transition zone. According to Mehta (1986), there are two components of
pores. One is the same for PCC with different w/c ratios, while the other changes as a function of
the w/c ratio. The two pore ranges are divided at 1320A° with the pores greater than 1320A°
being responsible for permeability. Permeability of the cement paste is almost zero for capillary
porosities less than 10%. This level is assumed to be a transition stage between a system of
interconnected pores and a system of isolated pores. The permeability also depends on the w/c
ratio, the age of the PCC, and the use of pozzolans. For the same level of hydration, permeability
is reduced as the w/c ratio decreases. This happens because, as the w/c ratio decreases, the
cement content in PCC increases. More of the products of hydration can be formed, thereby
reducing both the amount and size of voids.
12
The flow space in the cement paste is confined to distinct flow channels. As hydration
progresses, the products of hydration subdivide the spaces between the cement particles into
smaller channels. This reduces porosity and changes the pore size distribution, thereby reducing
permeability. From the permeability point of view, where the CSH gel forms is more important
than the amount of gel produced. If the gel formation results in blockage of capillary pores,
permeability is reduced.
Portland cement concrete containing pozzolans such as fly ash, microsilica, or slag has
been found to have lower permeability than PCC without these pozzolans, because the fine
pozzolan particles react with the calcium hydroxide in the cement paste to form more CSH gel that
fills up the voids. Ozyilidrim and Halstead (1994) have shown that PCC containing fly ash and
silica fume has less permeability than PCC without fly ash and silica fume. They also observed
that increasing the curing temperature up to 38°C and duration of moist curing reduces the
permeability.
2.4 Effects of Chlorides on Portland Cement Concrete
Corrosion of the steel in reinforced PCC is a major problem and millions of dollars are
spent every year to repair the deterioration it causes. Corrosion of steel is an electrochemical
process. The nonuniformities in the steel, such as in the welds and in the physical and chemical
properties of the surrounding PCC can produce electrical potential differences and cause
corrosion. However, corrosion is prevented by a passive film of iron oxide, which is formed during
the hydration of the cement. The high alkalinity of the PCC due to calcium hydroxide prevents the
breakup of this film. In some cases, the presence of sodium and potassium oxides increases the
pH to about 13.2 (Mehta, 1986).
There are two mechanisms responsible for reducing the alkalinity of PCC and breaking the
passive layer: the carbonation of PCC and the presence of chloride ions (Weyers et al, 1993).
Chlorides may be present in the PCC due to deicing salts, aggregate, or seawater. In the
corrosion process, the pore water acts as the electrolyte. The corrosion process can be explained
by the reactions that take place at the anode and the cathode. At the anode, the iron is oxidized
and the chloride ions react with it to form iron chloride, which ultimately forms iron oxide. At the
cathode, the oxygen reacts with the water to form hydroxyl ions.
13
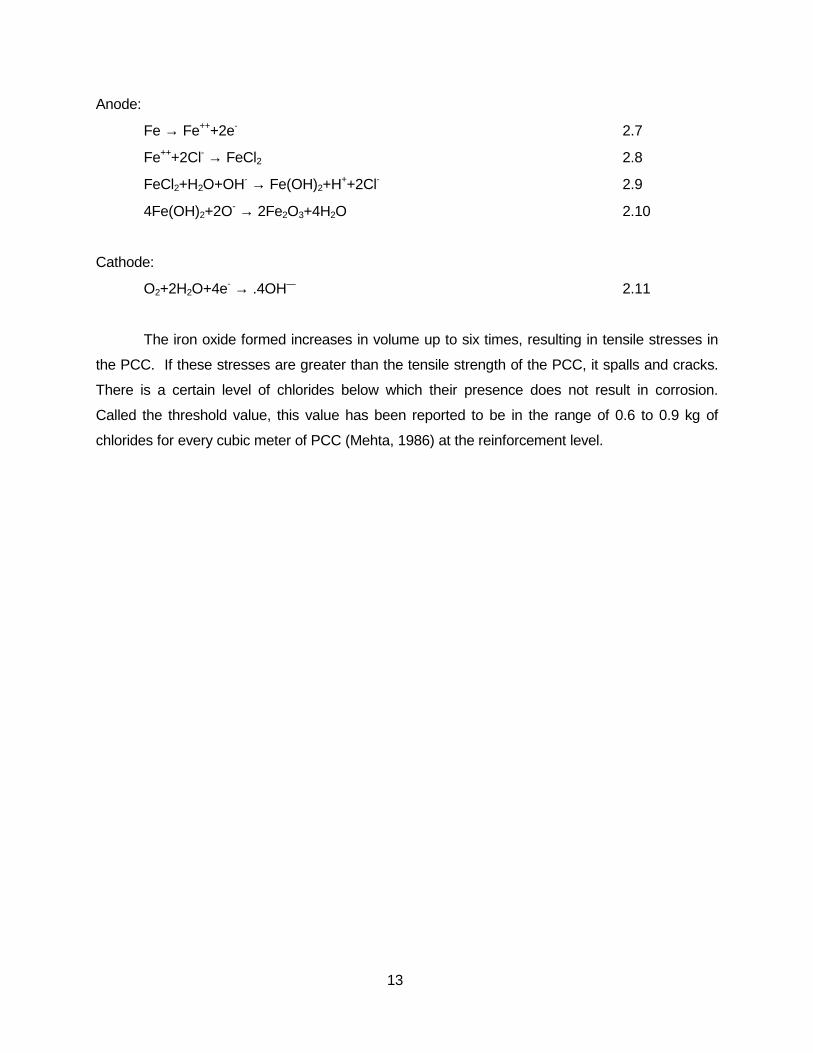
Anode:
Fe → Fe+++2e- 2.7
Fe+++2Cl- → FeCl2 2.8
FeCl2+H2O+OH- → Fe(OH)2+H++2Cl- 2.9
4Fe(OH)2+2O- → 2Fe2O3+4H2O 2.10
Cathode:
O2+2H2O+4e- → .4OH— 2.11
The iron oxide formed increases in volume up to six times, resulting in tensile stresses in
the PCC. If these stresses are greater than the tensile strength of the PCC, it spalls and cracks.
There is a certain level of chlorides below which their presence does not result in corrosion.
Called the threshold value, this value has been reported to be in the range of 0.6 to 0.9 kg of
chlorides for every cubic meter of PCC (Mehta, 1986) at the reinforcement level.
14
CHAPTER 3. ELECTROMAGNETIC WAVES AND COAXIAL
TRANSMISSION LINES
3.1 Electromagnetic Waves
The generation of electromagnetic waves depend on the relationship between the electric
and magnetic fields. A changing magnetic field will induce an electric filed and a changing electric
field will induce a magnetic field. An electromagnetic wave contains energy which flows in the
direction of propagation. Electromagnetic waves have energy, momentum, and mass, and move
through space by means of wave motion. The electromagnetic theory was developed by Maxwell
who proved mathematically that electromagnetic waves could propagate through a conducting
medium. He also stated that electromagnetic waves travel at the speed of light. Hertz, in 1888,
experimentally proved that the velocity of electromagnetic waves was the same as the velocity of
light. He also proved that electromagnetic waves could be reflected, refracted, and polarized like
light and heat waves (Hertz, 1900).
3.2 Dielectric Materials
Materials, which have the outermost electron shell of their atoms almost completely filled,
are called dielectric materials. Since the shells are completely filled, the electrons are bound and
it is relatively difficult to dislodge them. Therefore dielectric materials have few electrons available
for conduction and are classified as insulators. These materials usually exhibit or can be made to
exhibit a dipole structure, which is the separation of two point charges of equal magnitude and
opposite sign by a small distance.
The ability of a dielectric material to store a charge can be explained using a parallel plate
capacitor. When the space between the plates is filled with vacuum, the capacitance, Co, which is
the ratio of the charge on either plate to the potential difference between the plates, is directly
proportional to the area of the plates, A, and inversely proportional to the distance between the
plates, d. Therefore, the relationship can be given by:
ε=
dA
C oo 3.3
15
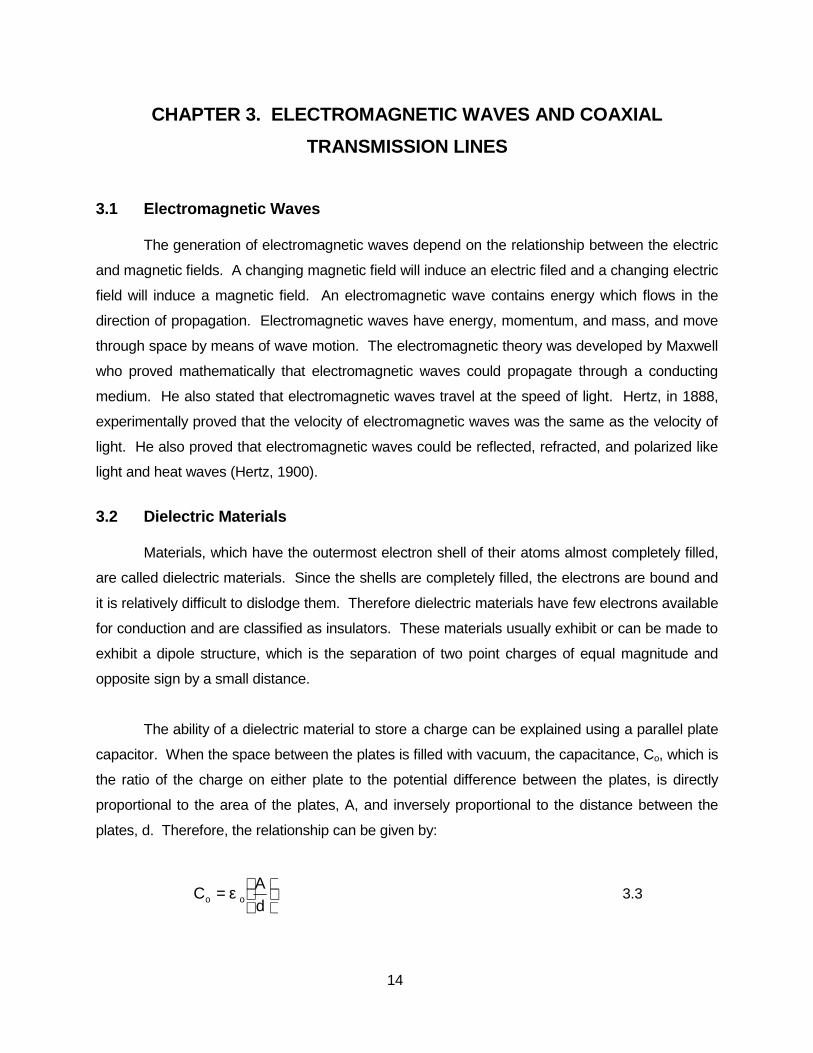
where, εo is the permittivity of vacuum, and has a value of 8.85×10⁻¹² F/m. Figure 3.1 shows the
charge between the plates when the space between them is filled with vacuum.
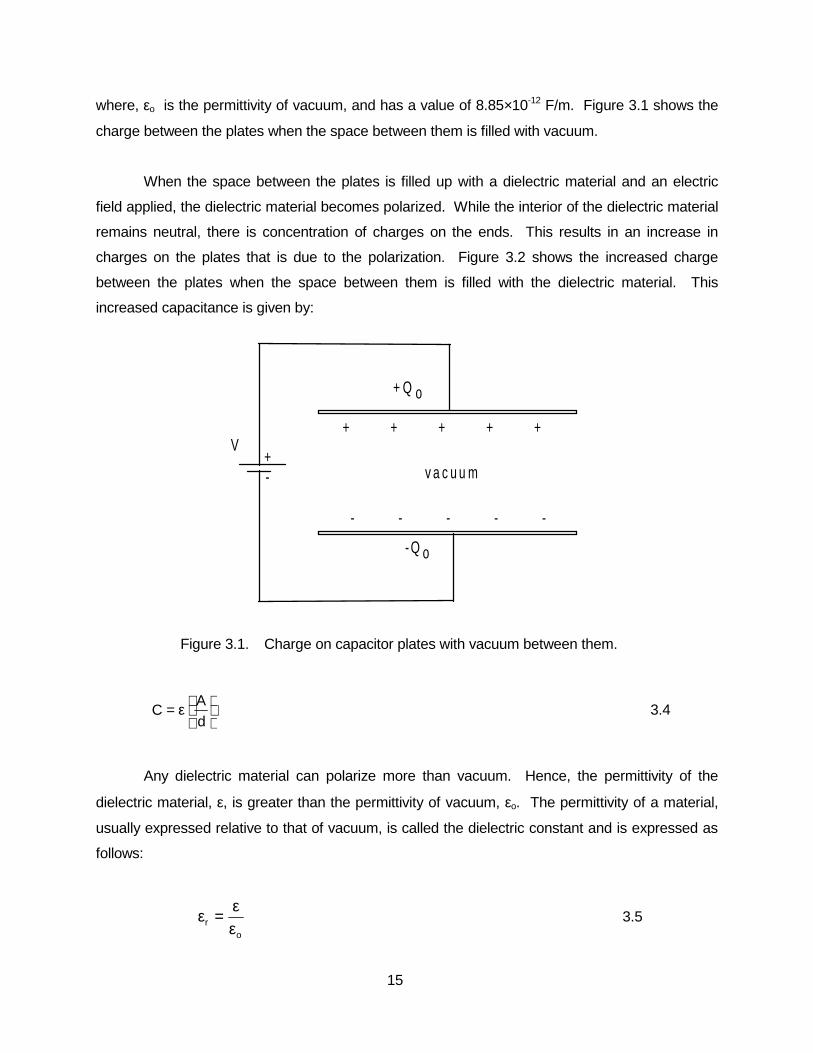
When the space between the plates is filled up with a dielectric material and an electric
field applied, the dielectric material becomes polarized. While the interior of the dielectric material
remains neutral, there is concentration of charges on the ends. This results in an increase in
charges on the plates that is due to the polarization. Figure 3.2 shows the increased charge
between the plates when the space between them is filled with the dielectric material. This
increased capacitance is given by:
ε=
dA
C 3.4
Any dielectric material can polarize more than vacuum. Hence, the permittivity of the
dielectric material, ε, is greater than the permittivity of vacuum, εo. The permittivity of a material,
usually expressed relative to that of vacuum, is called the dielectric constant and is expressed as
follows:
o
r εε=ε 3.5
Figure 3.1. Charge on capacitor plates with vacuum between them.
+ + + + +
- - - - -
V
v a c u u m
+ Q o
- Q o
+-
16
The dielectric constant, εr, is a complex number where the real part represents the actual
insulating behavior of the material and the imaginary part represents the lossy behavior of the
material to an external electric field.
Any dielectric material will dissipate part of the energy from an electromagnetic wave
propagating though it. The source of these losses may be investigated by considering Maxwell’s
equations and the two constitutive relations.
Maxwell’s vector equations for steady state sinusoidal dependence are given by:
Bj-=E ω×∇ 3.6
JDjH +ω=×∇ 3.7
ρ=•∇ D 3.8
0B =•∇ 3.9
where,
E = Electric field intensity vector (volts/m);
B = Magnetic flux density (webers/m2);
H = Magnetic field intensity (amperes/m);
D = Electric flux density (coulombs/m2);
Figure 3.2. Increase in charge storing capacity due to polarization of a dielectric material
between the plates.
Q o + Q '
-Q o -Q '
V+
-
-
+
-
+
-
+
-
+
-
+
-
+
-
+
-
+
-
+
-
+
-
+
-
+
-
+
-
+
-+
+ + + + + + + + + +
- - - - - - - - - -
17
J = σE = Electric current density (amperes/m2);
ρ = Electric charge density (coulombs/m2); and
σ = Conductivity (mhos/m).
The two constitutive relations that relate the flux densities to the field intensities for a given
material are:
PED 0 +ε= 3.10
( )MHB 0 +µ= 3.11
where,
P = Dipole moment per unit volume;
M = Magnetic dipole polarization per unit volume;
εo = Dielectric permittivity of free space = 8.854×10⁻¹² farad/m; and
µo = Permeability of free space = 4π× 10-7 henry/m.
For an isotropic material, the relationship between E and P is linear and is given by:
EP e0χε= 3.12
where, χe is the electrical susceptibility and is given by:
1j
0
'''
e −ε
ε−ε=χ 3.13
( )E''j'D ε−ε= 3.14
For non magnetic materials, the relationship between H and M is given by:
HM mχ= 3.15
where, χm is the magnetic susceptibility and is given by:
18
1'''
=0
−−µ
µµχ jm 3.16
and,
( )Hj'B µ ′′−µ= 3.17
On substituting the values in equation 3.5, it changes to:
E'jE)"(H ωε+σ+ωε=×∇ 3.18
The loss tangent of a dielectric medium is the ratio of the loss part to the real part of equation 3.18
and is given by:
'
"tan
ωεσωεδ += 3.19
Thus, the loss of charge in a dielectric medium is due to finite conductivity and damping
effects of the dielectric material. Measurements of the loss tangent do not separate the
contributions of the dielectric damping effects and conductivity. At microwave frequencies where
ω is large, conductivity in poor conductors or good dielectrics is insignificant.
The molecules in a dielectric material can be characterized by dipole moment, p, which is
the product of the charge, q, and the distance between the two charges, d. For a dielectric
material of volume ∆v, containing n dipoles per unit volume, the total dipole moment, ptotal, is given
by the vector sum:
∑∆
=
=vn
1iitotal pp 3.1
Polarization, P, is defined as the dipole moment per unit volume and is given by:
∑∆
=→∆ ∆
=vn
1ii
0vp
v1
limP 3.2
19
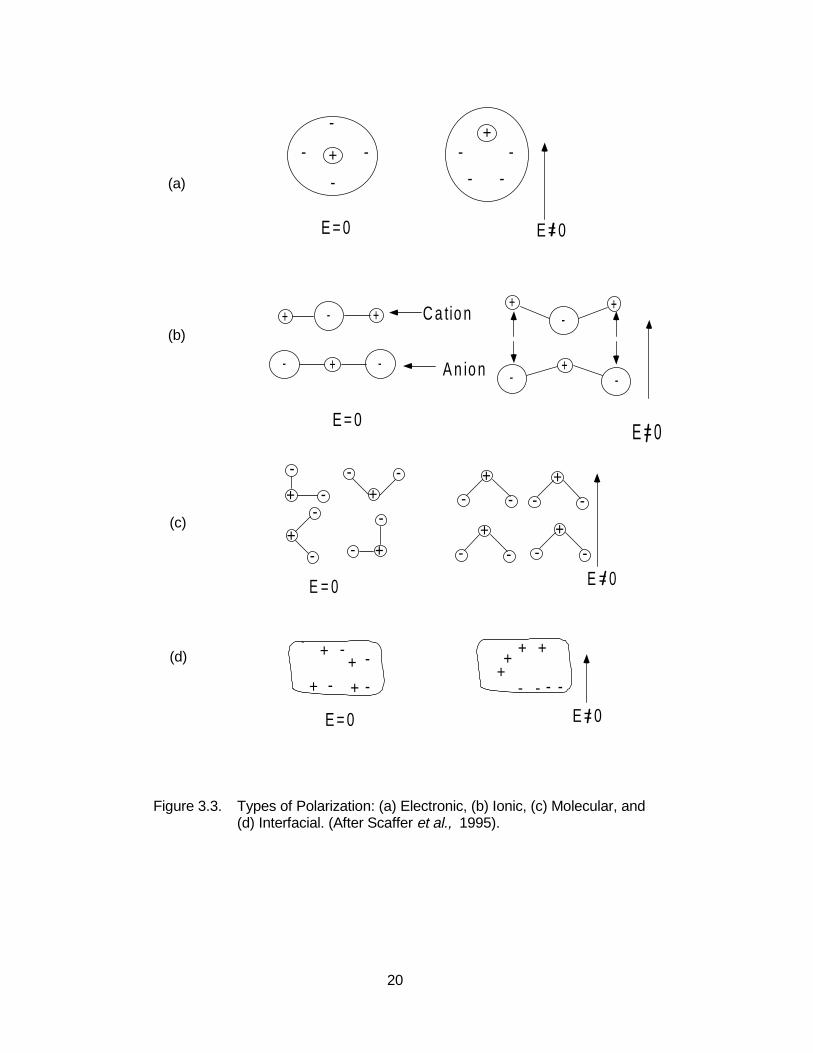
Polarization is also defined as the alignment of the dipoles with the electric field.
Polarization results in an increase in the charge that can be stored in the material. There are four
main types of polarization in the microwave range: electronic, ionic, molecular, and interfacial.
Electronic polarization occurs when an electric field is applied to a material and the electrons in
the atom shift away from the positively charged nucleus. Thus, the atom acts as a dipole. This
polarization is only temporary and disappears when the external electric field is removed. Ionic
polarization occurs when there is displacement of anions and cations in crystals relative to their
normal positions. Due to the application of the electric field, the cations move towards the
negative electrode and the anions move toward the positive electrode. It is also called atomic
polarization. When the application of an external electric field results in the alignment of the
permanent dipole in the direction of the electric field, it is called molecular polarization. The
removal of the electric field does not reverse the polarization effect in this case. Mobile charge
carriers are accelerated by an external electric field and on being stopped by a physical barrier,
accumulate at that place. This results in interfacial polarization, which is predominant in the low
frequency range of 10-3 to 103 Hz. Figure 3.3 shows the different types of polarization.
3.3 Coaxial Transmission Lines
Transmission lines are used for transmission of signals and power. Two-wire lines,
coaxial lines and waveguides are the different types of transmission lines in use. Coaxial lines are
popular because they have low loss transmission capability. A coaxial transmission line
essentially consists of two concentric, circular, nonmagnetic conductors. The space between the
two conductors is usually filled with an insulator and the electromagnetic fields are confined within
this space.
3.3.1 Electrical properties of transmission lines
The electrical properties of a coaxial transmission line depend on four parameters:
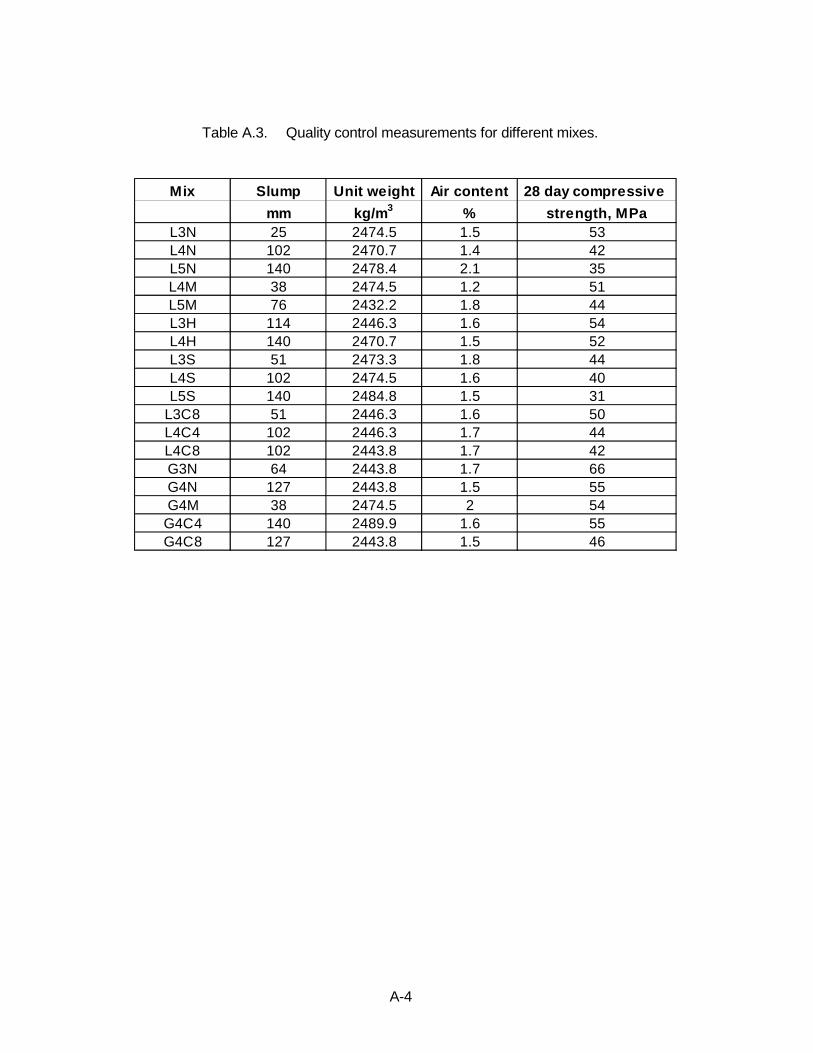
Table A.3. Quality control measurements for different mixes.
APPENDIX B
MATLAB PROGRAMS
B-1
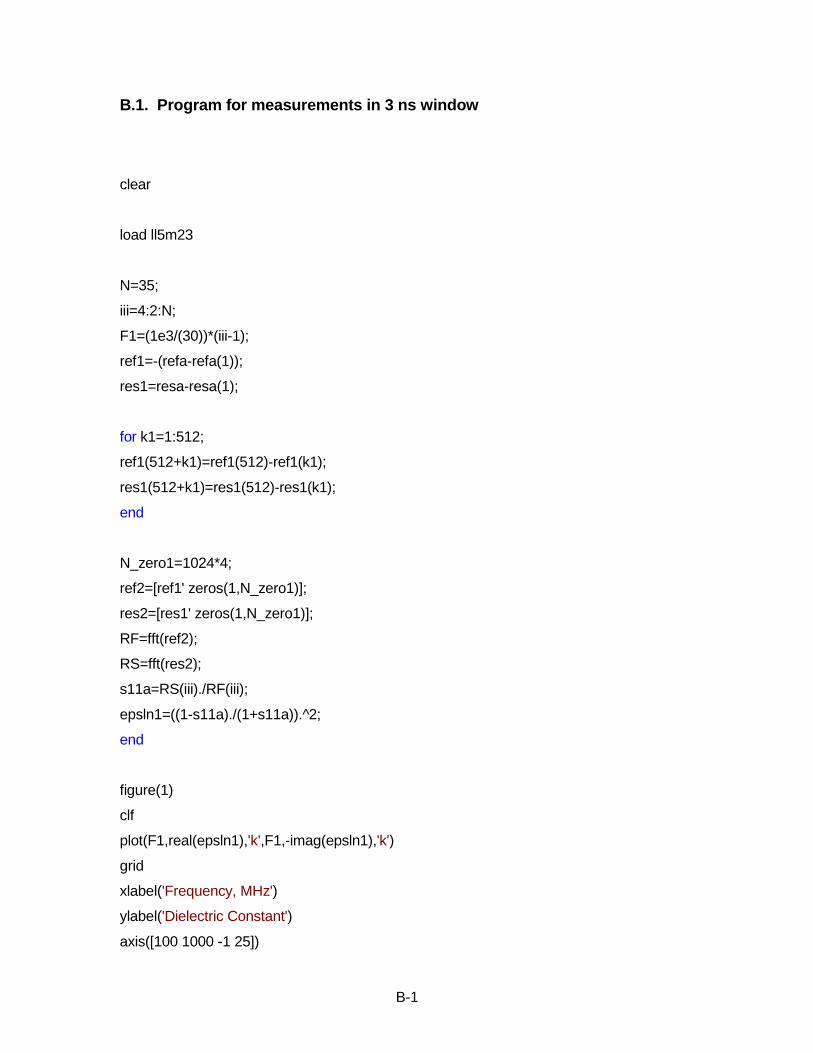
B.1. Program for measurements in 3 ns window
clear
load ll5m23
N=35;
iii=4:2:N;
F1=(1e3/(30))*(iii-1);
ref1=-(refa-refa(1));
res1=resa-resa(1);
for k1=1:512;
ref1(512+k1)=ref1(512)-ref1(k1);
res1(512+k1)=res1(512)-res1(k1);
end
N_zero1=1024*4;
ref2=[ref1' zeros(1,N_zero1)];
res2=[res1' zeros(1,N_zero1)];
RF=fft(ref2);
RS=fft(res2);
s11a=RS(iii)./RF(iii);
epsln1=((1-s11a)./(1+s11a)).^2;
end
figure(1)
clf
plot(F1,real(epsln1),'k',F1,-imag(epsln1),'k')
grid
xlabel('Frequency, MHz')
ylabel('Dielectric Constant')
axis([100 1000 -1 25])
B-2
disp('Saving File')
yy=[F1;real(epsln1);-imag(epsln1)];
fid=fopen('ll5m23.txt','a+');
fprintf(fid,'%10.4f\t %10.4f\t %10.4f\n',yy);
fclose(fid);
B-3
B.2. Program for measurements in 1 ns window
clear
load teflon1
N=10;
iii=1:1:N;
F1=(1e3/(10))*(iii);
ref1=-(refa-refa(1));
res1=resa-resa(1);
for k1=1:512;
ref1(512+k1)=ref1(512)-ref1(k1);
res1(512+k1)=res1(512)-res1(k1);
end
N_zero1=1024*4;
ref2=[ref1' zeros(1,N_zero1)];
res2=[res1' zeros(1,N_zero1)];
RF=fft(ref2);
RS=fft(res2);
s11a=RS(iii)./RF(iii);
epsln1=((1-s11a)./(1+s11a)).^2;
end
figure(1)
clf
plot(F1,real(epsln1),'k',F1,-imag(epsln1),'k')
grid
xlabel('Frequency, MHz')
ylabel('Dielectric Constant')
axis([100 1000 -1 25])
B-4
disp('Saving File')
yy=[F1;real(epsln1);-imag(epsln1)];
fid=fopen('teflon1.txt','a+');
fprintf(fid,'%10.4f\t %10.4f\t %10.4f\n',yy);
fclose(fid);
APPENDIX C
EFFECT OF FREQUENCY ON THE DIELECTRIC CONSTANT
OVER DIFFERENT CURING TIMES (3 ns WINDOW)
C-1
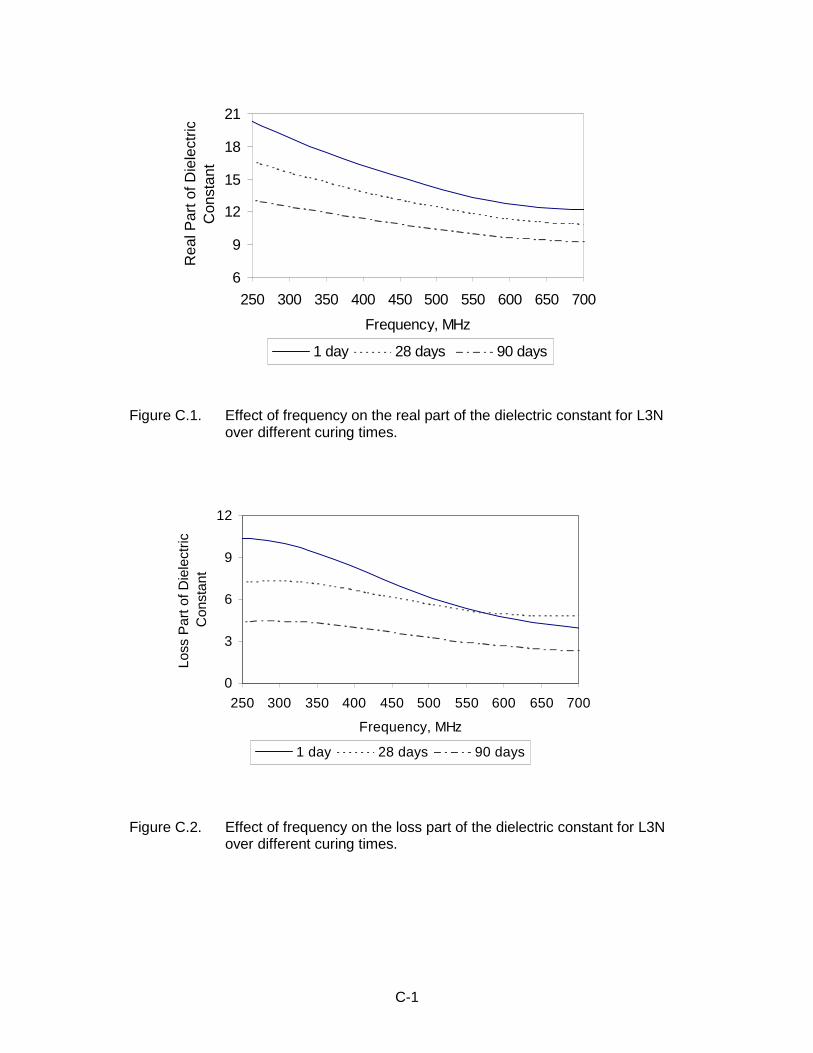
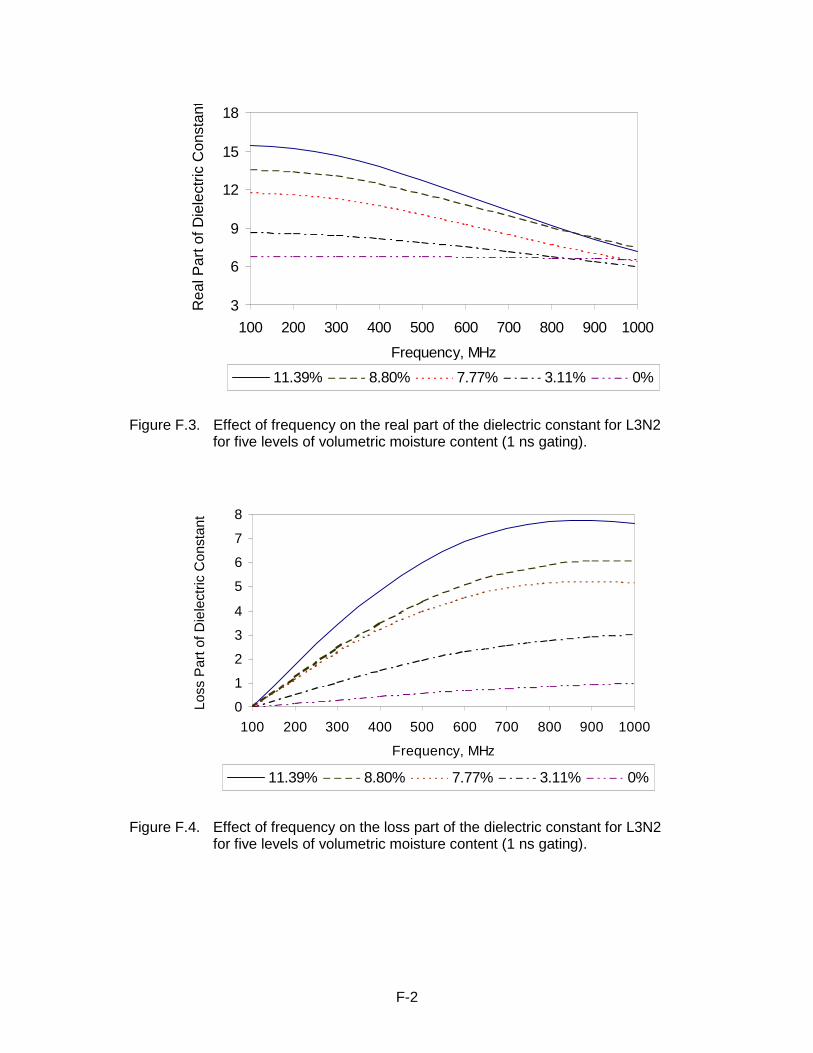
Figure C.2. Effect of frequency on the loss part of the dielectric constant for L3Nover different curing times.
0
3
6
9
12
250 300 350 400 450 500 550 600 650 700
Frequency, MHz
Loss
Par
t of D
iele
ctric
C
onst
ant
1 day 28 days 90 days
Figure C.1. Effect of frequency on the real part of the dielectric constant for L3Nover different curing times.
6
9
12
15
18
21
250 300 350 400 450 500 550 600 650 700
Frequency, MHz
Rea
l Par
t of D
iele
ctric
Con
stan
t
1 day 28 days 90 days
C-2
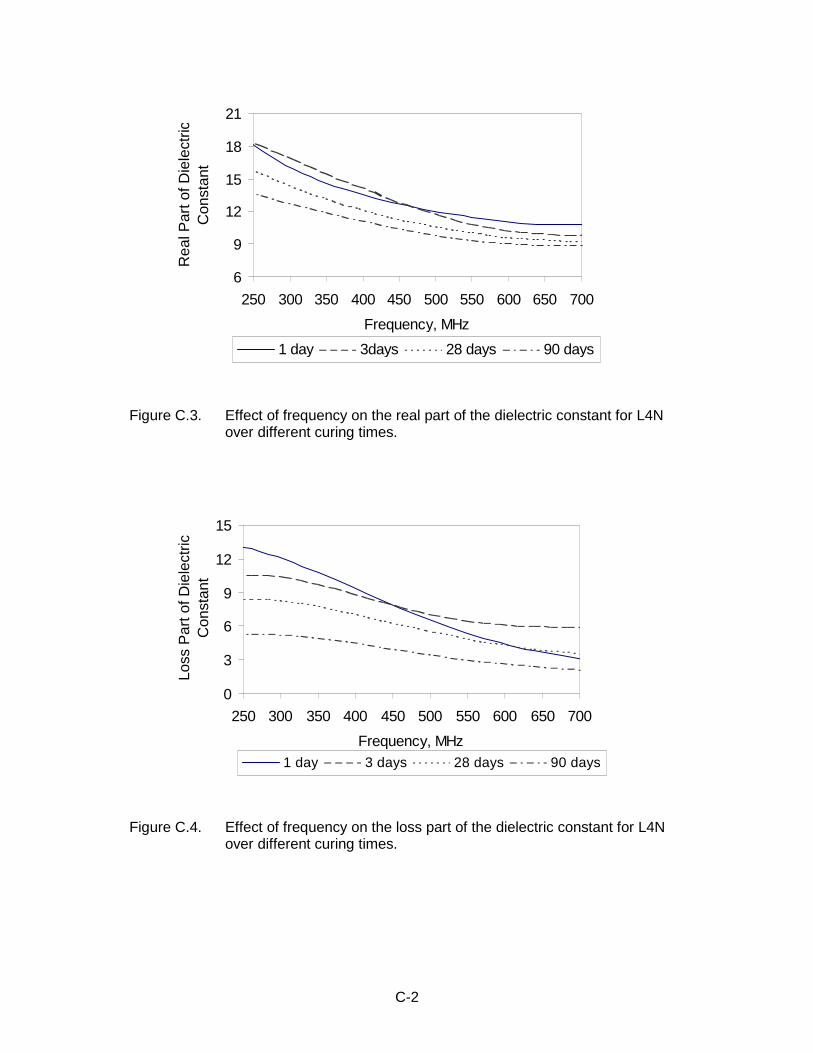
Figure C.4. Effect of frequency on the loss part of the dielectric constant for L4Nover different curing times.
0
3
6
9
12
15
250 300 350 400 450 500 550 600 650 700
Frequency, MHz
Loss
Par
t of D
iele
ctric
Con
stan
t
1 day 3 days 28 days 90 days
Figure C.3. Effect of frequency on the real part of the dielectric constant for L4Nover different curing times.
6
9
12
15
18
21
250 300 350 400 450 500 550 600 650 700
Frequency, MHz
Rea
l Par
t of D
iele
ctric
Con
stan
t
1 day 3days 28 days 90 days
C-3
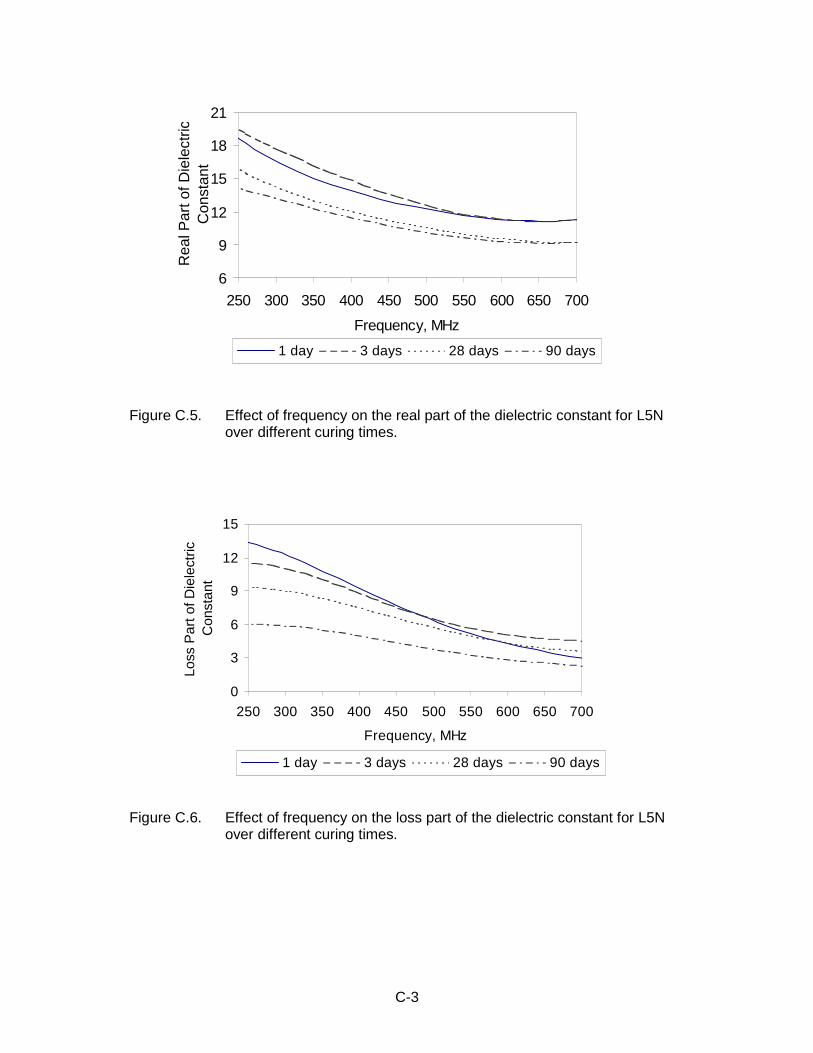
Figure C.5. Effect of frequency on the real part of the dielectric constant for L5Nover different curing times.
6
9
12
15
18
21
250 300 350 400 450 500 550 600 650 700
Frequency, MHz
Rea
l Par
t of D
iele
ctric
Con
stan
t
1 day 3 days 28 days 90 days
Figure C.6. Effect of frequency on the loss part of the dielectric constant for L5Nover different curing times.
0
3
6
9
12
15
250 300 350 400 450 500 550 600 650 700
Frequency, MHz
Loss
Par
t of D
iele
ctric
C
onst
ant
1 day 3 days 28 days 90 days
C-4
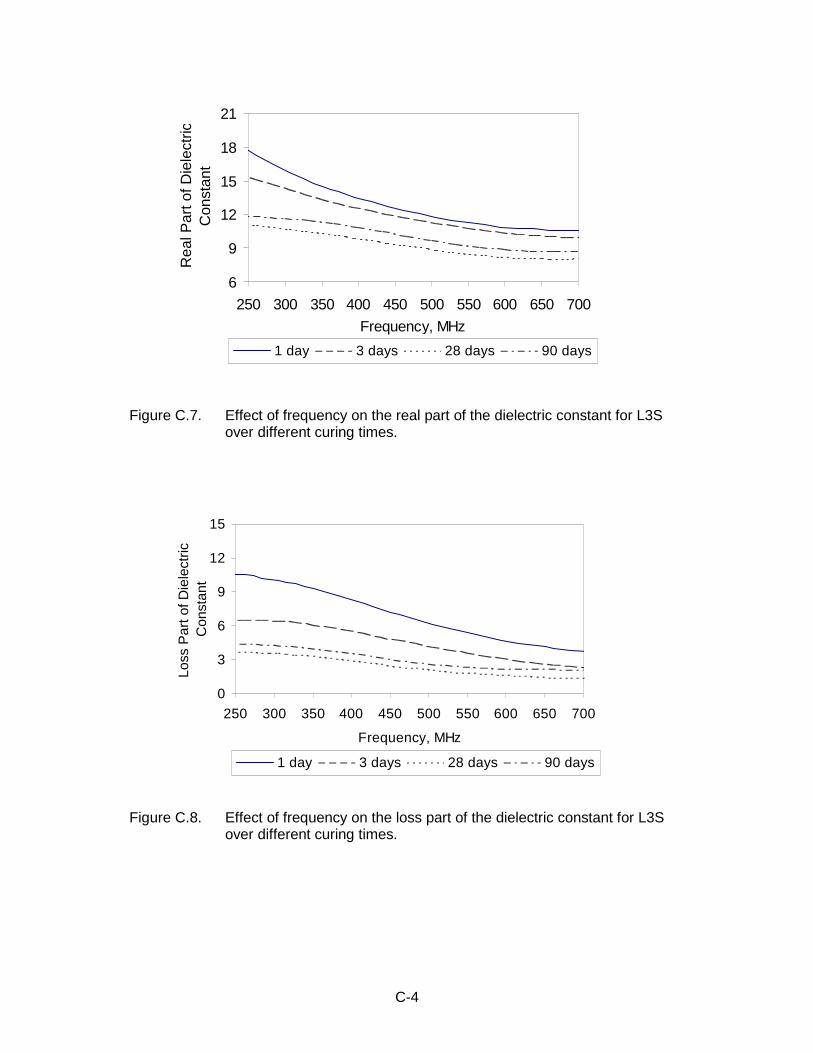
Figure C.7. Effect of frequency on the real part of the dielectric constant for L3Sover different curing times.
6
9
12
15
18
21
250 300 350 400 450 500 550 600 650 700
Frequency, MHz
Rea
l Par
t of D
iele
ctric
Con
stan
t
1 day 3 days 28 days 90 days
Figure C.8. Effect of frequency on the loss part of the dielectric constant for L3Sover different curing times.
0
3
6
9
12
15
250 300 350 400 450 500 550 600 650 700
Frequency, MHz
Loss
Par
t of D
iele
ctric
C
onst
ant
1 day 3 days 28 days 90 days
C-5
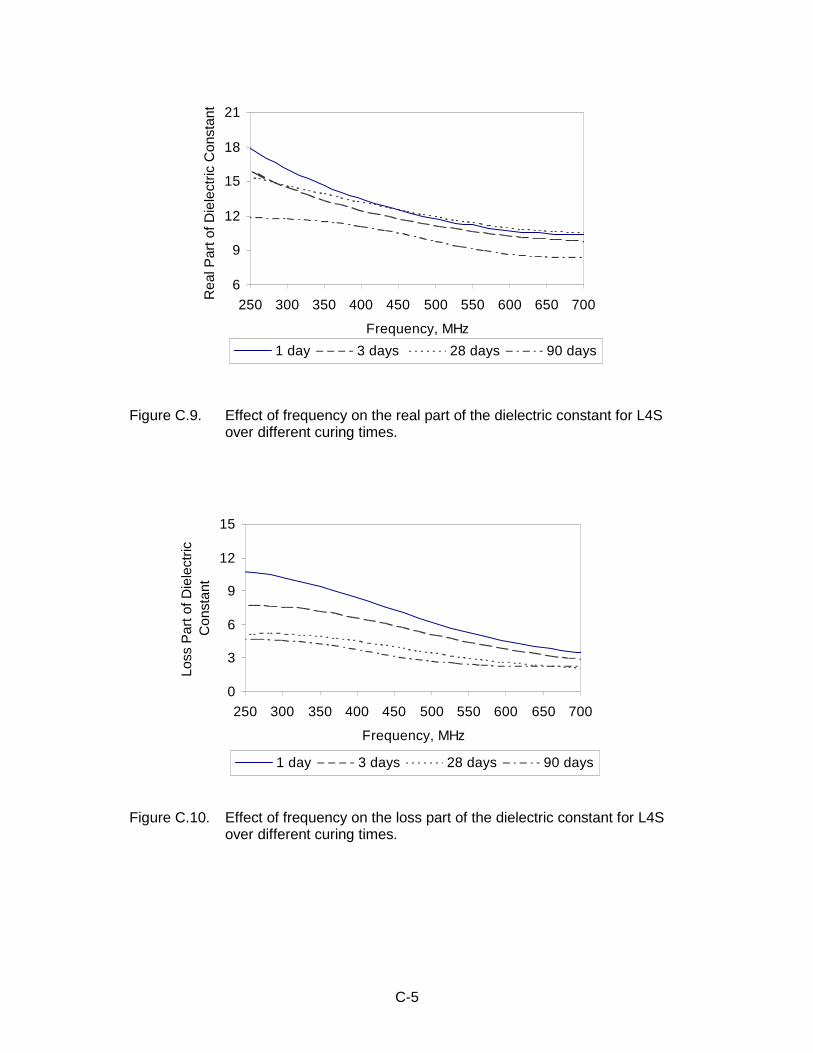
Figure C.9. Effect of frequency on the real part of the dielectric constant for L4Sover different curing times.
6
9
12
15
18
21
250 300 350 400 450 500 550 600 650 700
Frequency, MHz
Rea
l Par
t of D
iele
ctric
Con
stan
t
1 day 3 days 28 days 90 days
Figure C.10. Effect of frequency on the loss part of the dielectric constant for L4Sover different curing times.
0
3
6
9
12
15
250 300 350 400 450 500 550 600 650 700
Frequency, MHz
Loss
Par
t of D
iele
ctric
C
onst
ant
1 day 3 days 28 days 90 days
C-6
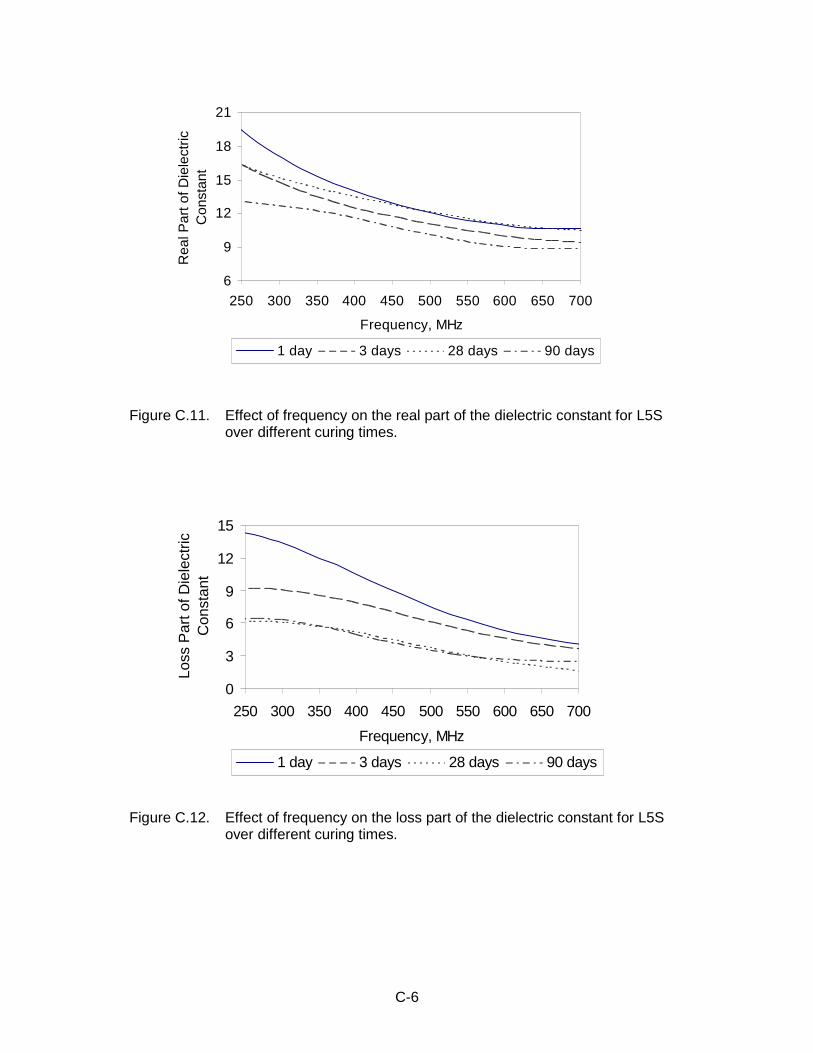
Figure C.11. Effect of frequency on the real part of the dielectric constant for L5Sover different curing times.
6
9
12
15
18
21
250 300 350 400 450 500 550 600 650 700
Frequency, MHz
Rea
l Par
t of D
iele
ctric
C
onst
ant
1 day 3 days 28 days 90 days
Figure C.12. Effect of frequency on the loss part of the dielectric constant for L5Sover different curing times.
0
3
6
9
12
15
250 300 350 400 450 500 550 600 650 700
Frequency, MHz
Loss
Par
t of D
iele
ctric
C
onst
ant
1 day 3 days 28 days 90 days
C-7
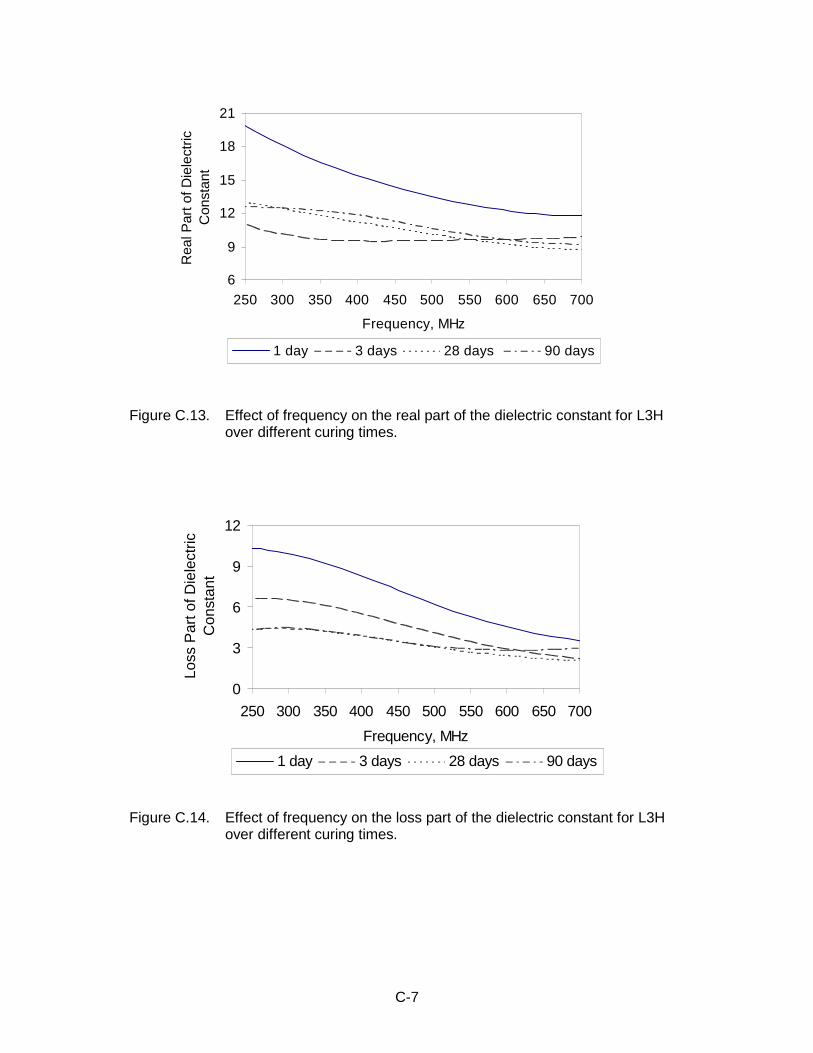
Figure C.13. Effect of frequency on the real part of the dielectric constant for L3Hover different curing times.
6
9
12
15
18
21
250 300 350 400 450 500 550 600 650 700
Frequency, MHz
Rea
l Par
t of D
iele
ctric
C
onst
ant
1 day 3 days 28 days 90 days
Figure C.14. Effect of frequency on the loss part of the dielectric constant for L3Hover different curing times.
0
3
6
9
12
250 300 350 400 450 500 550 600 650 700
Frequency, MHz
Loss
Par
t of D
iele
ctric
C
onst
ant
1 day 3 days 28 days 90 days
C-8
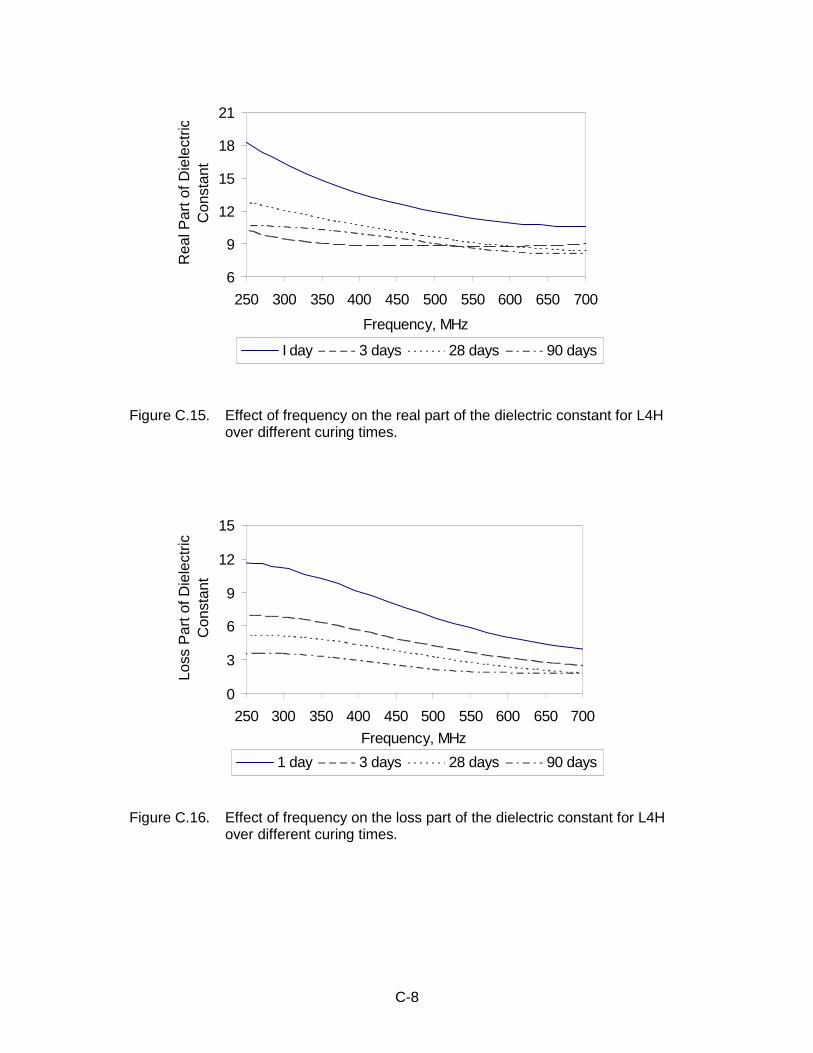
Figure C.15. Effect of frequency on the real part of the dielectric constant for L4Hover different curing times.
6
9
12
15
18
21
250 300 350 400 450 500 550 600 650 700
Frequency, MHz
Rea
l Par
t of D
iele
ctric
Con
stan
t
I day 3 days 28 days 90 days
Figure C.16. Effect of frequency on the loss part of the dielectric constant for L4Hover different curing times.
0
3
6
9
12
15
250 300 350 400 450 500 550 600 650 700
Frequency, MHz
Loss
Par
t of D
iele
ctric
Con
stan
t
1 day 3 days 28 days 90 days
C-9
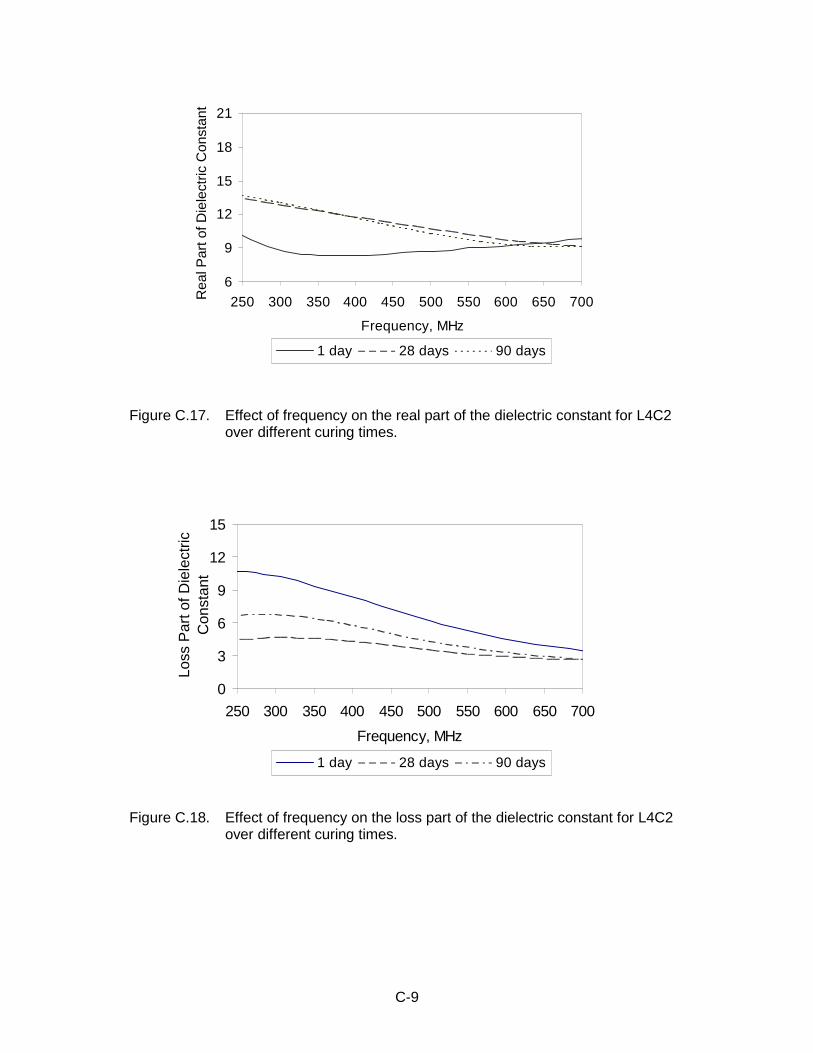
Figure C.17. Effect of frequency on the real part of the dielectric constant for L4C2over different curing times.
6
9
12
15
18
21
250 300 350 400 450 500 550 600 650 700
Frequency, MHz
Rea
l Par
t of D
iele
ctric
Con
stan
t
1 day 28 days 90 days
Figure C.18. Effect of frequency on the loss part of the dielectric constant for L4C2over different curing times.
0
3
6
9
12
15
250 300 350 400 450 500 550 600 650 700
Frequency, MHz
Loss
Par
t of D
iele
ctric
C
onst
ant
1 day 28 days 90 days
C-10
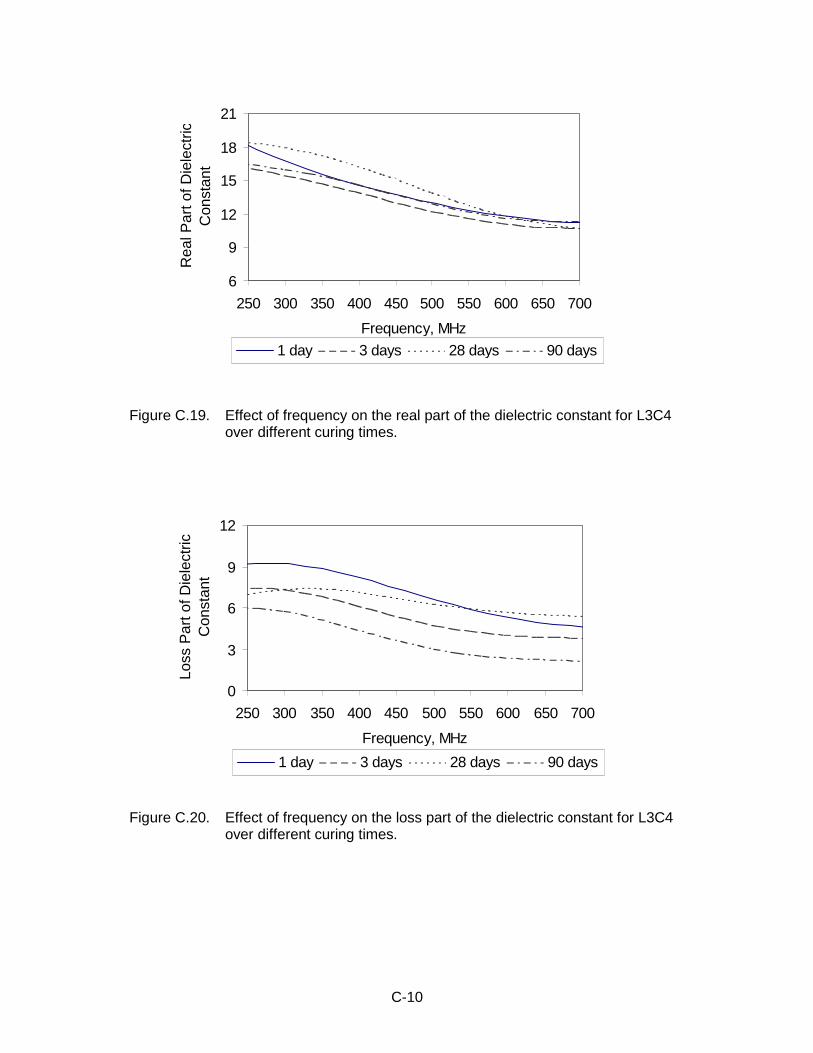
Figure C.19. Effect of frequency on the real part of the dielectric constant for L3C4over different curing times.
6
9
12
15
18
21
250 300 350 400 450 500 550 600 650 700
Frequency, MHz
Rea
l Par
t of D
iele
ctric
Con
stan
t
1 day 3 days 28 days 90 days
Figure C.20. Effect of frequency on the loss part of the dielectric constant for L3C4over different curing times.
0
3
6
9
12
250 300 350 400 450 500 550 600 650 700
Frequency, MHz
Loss
Par
t of D
iele
ctric
Con
stan
t
1 day 3 days 28 days 90 days
C-11
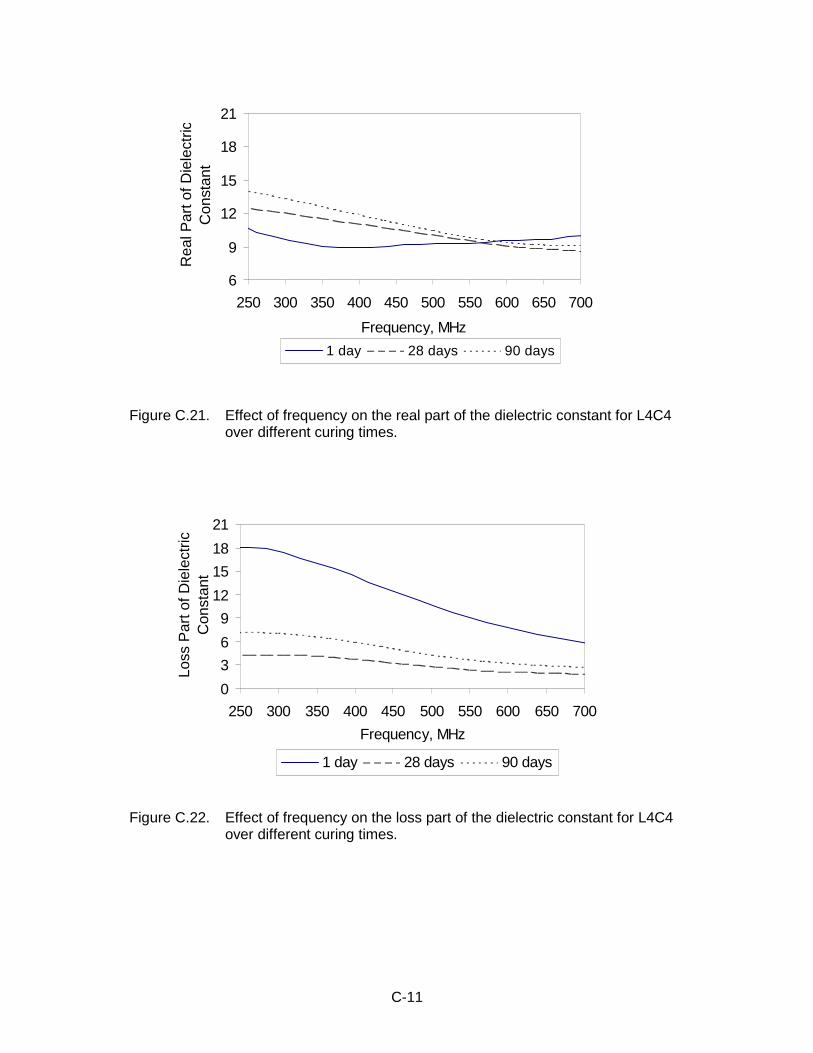
Figure C.21. Effect of frequency on the real part of the dielectric constant for L4C4over different curing times.
6
9
12
15
18
21
250 300 350 400 450 500 550 600 650 700
Frequency, MHz
Rea
l Par
t of D
iele
ctric
Con
stan
t
1 day 28 days 90 days
Figure C.22. Effect of frequency on the loss part of the dielectric constant for L4C4over different curing times.
0
3
6
9
12
15
18
21
250 300 350 400 450 500 550 600 650 700
Frequency, MHz
Loss
Par
t of D
iele
ctric
C
onst
ant
1 day 28 days 90 days
C-12
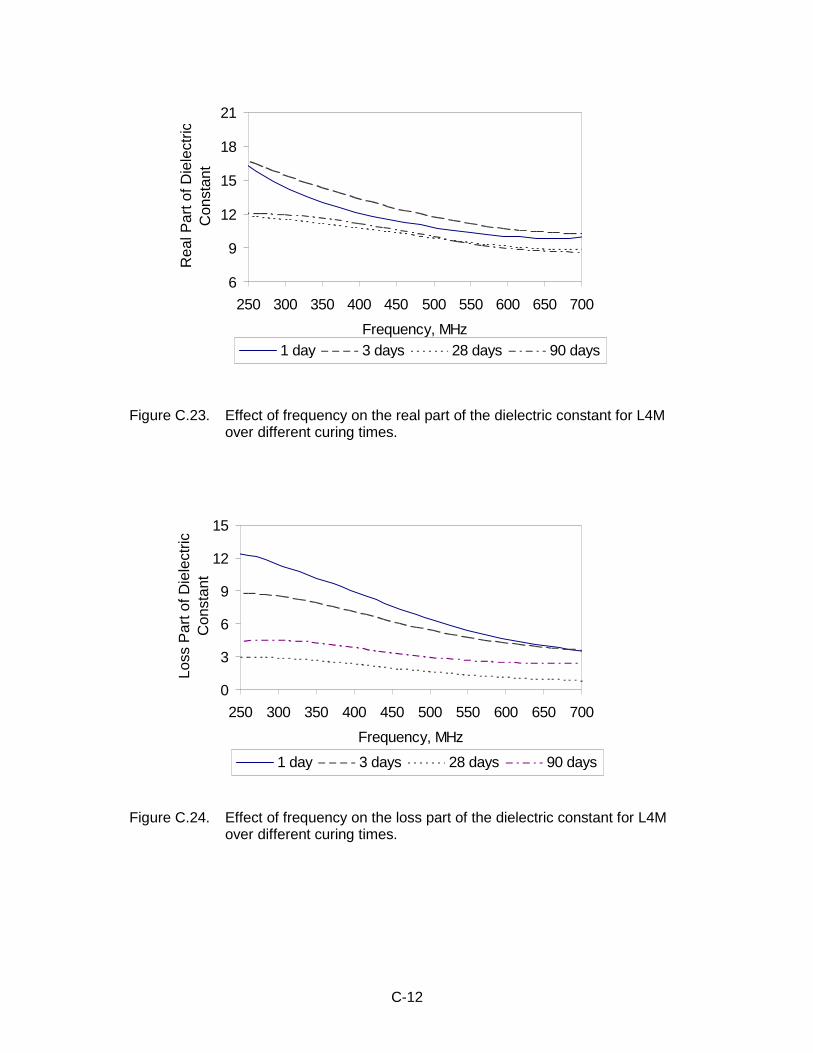
Figure C.23. Effect of frequency on the real part of the dielectric constant for L4Mover different curing times.
6
9
12
15
18
21
250 300 350 400 450 500 550 600 650 700
Frequency, MHz
Rea
l Par
t of D
iele
ctric
Con
stan
t
1 day 3 days 28 days 90 days
Figure C.24. Effect of frequency on the loss part of the dielectric constant for L4Mover different curing times.
0
3
6
9
12
15
250 300 350 400 450 500 550 600 650 700
Frequency, MHz
Loss
Par
t of D
iele
ctric
C
onst
ant
1 day 3 days 28 days 90 days
C-13
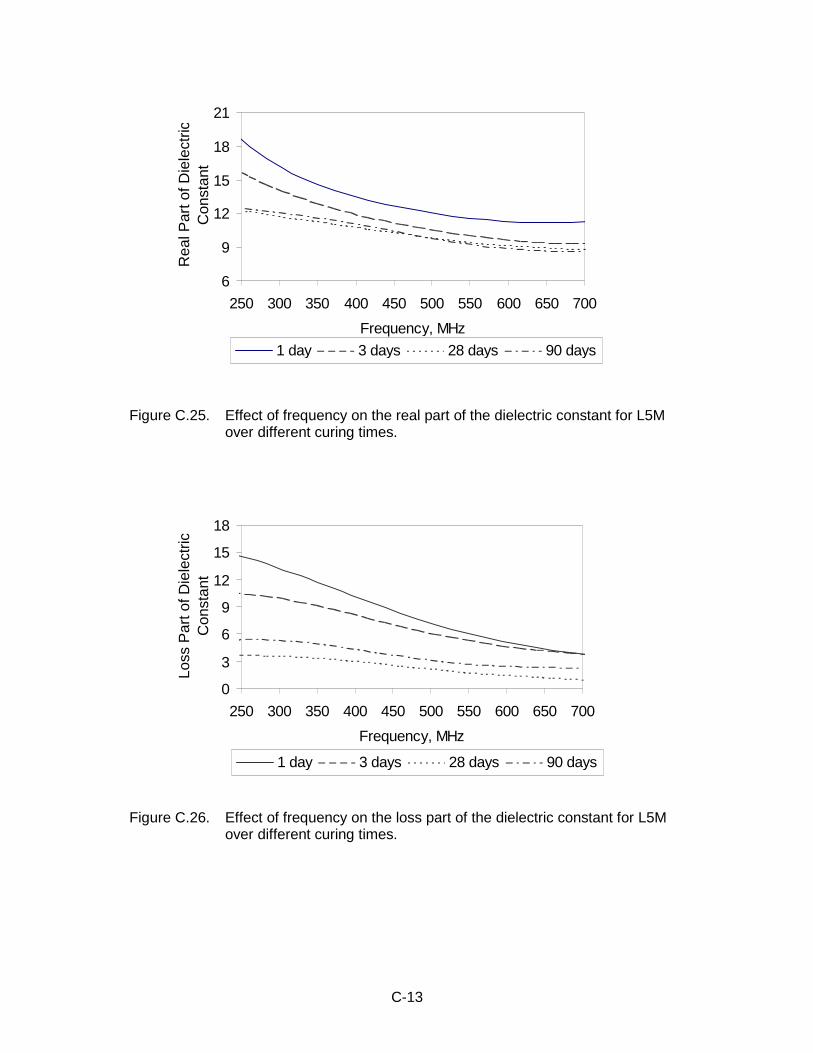
Figure C.25. Effect of frequency on the real part of the dielectric constant for L5Mover different curing times.
6
9
12
15
18
21
250 300 350 400 450 500 550 600 650 700
Frequency, MHz
Rea
l Par
t of D
iele
ctric
Con
stan
t
1 day 3 days 28 days 90 days
Figure C.26. Effect of frequency on the loss part of the dielectric constant for L5Mover different curing times.
0
3
6
9
12
15
18
250 300 350 400 450 500 550 600 650 700
Frequency, MHz
Loss
Par
t of D
iele
ctric
C
onst
ant
1 day 3 days 28 days 90 days
C-14
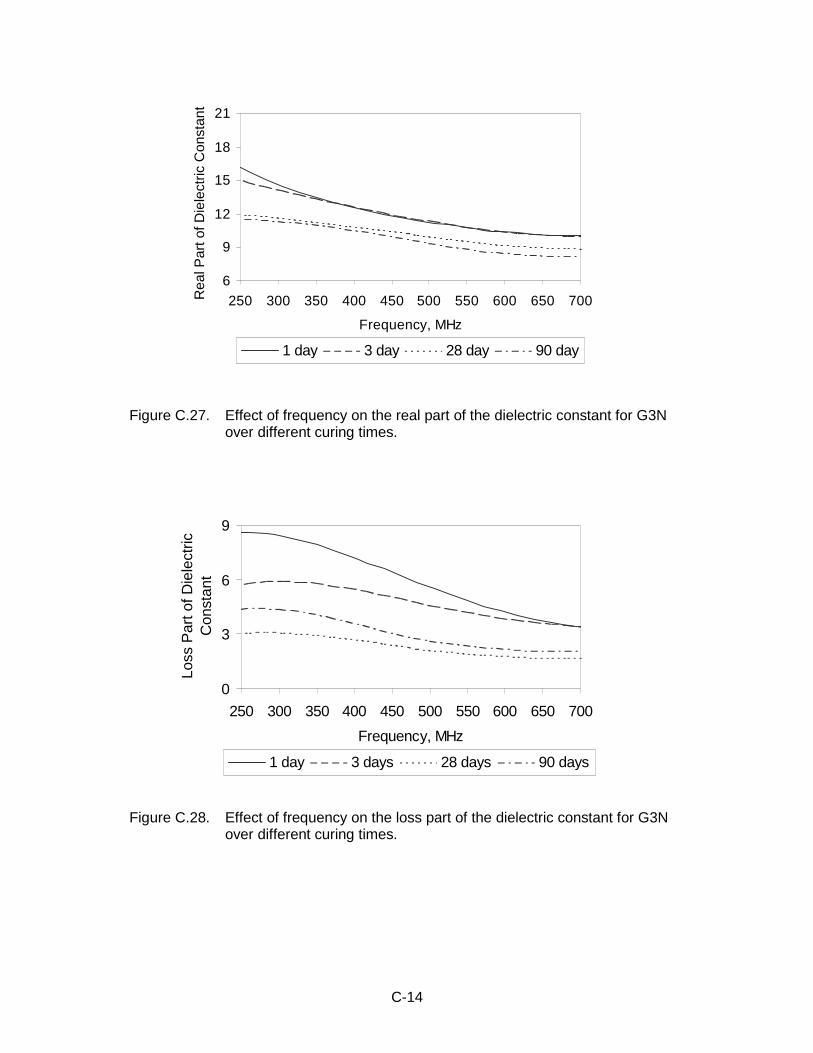
Figure C.27. Effect of frequency on the real part of the dielectric constant for G3Nover different curing times.
6
9
12
15
18
21
250 300 350 400 450 500 550 600 650 700
Frequency, MHz
Rea
l Par
t of D
iele
ctric
Con
stan
t
1 day 3 day 28 day 90 day
Figure C.28. Effect of frequency on the loss part of the dielectric constant for G3Nover different curing times.
0
3
6
9
250 300 350 400 450 500 550 600 650 700
Frequency, MHz
Loss
Par
t of D
iele
ctric
C
onst
ant
1 day 3 days 28 days 90 days
C-15
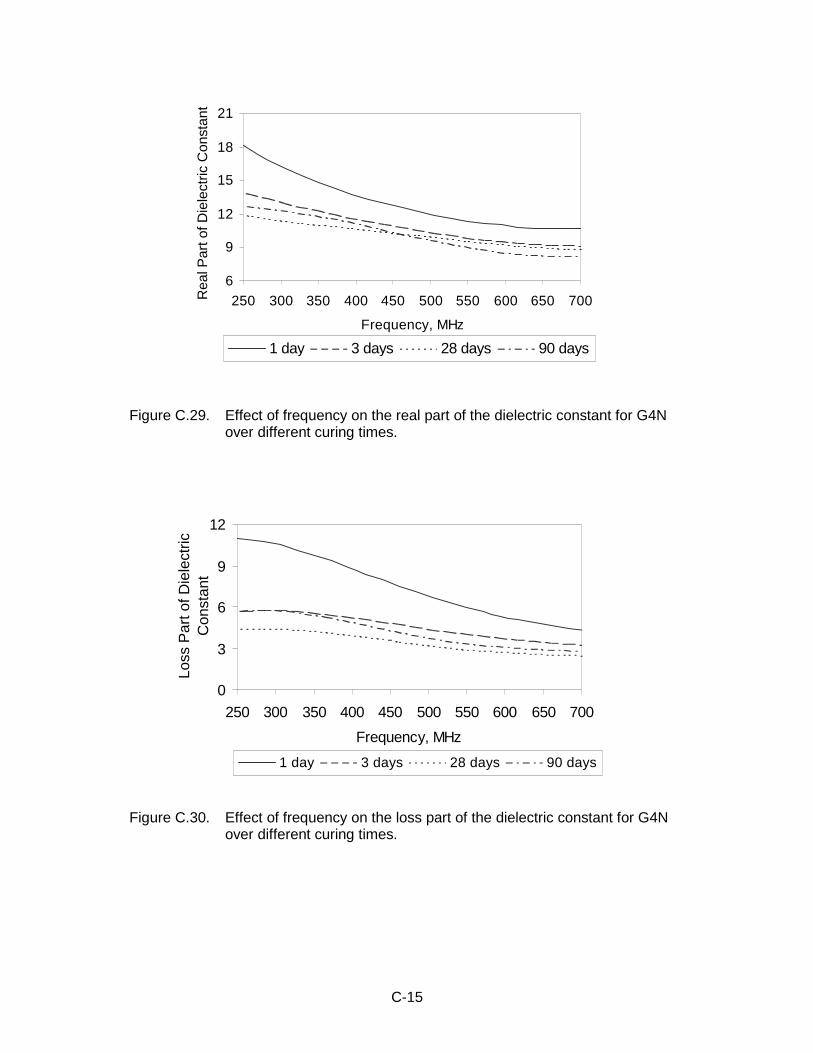
Figure C.29. Effect of frequency on the real part of the dielectric constant for G4Nover different curing times.
6
9
12
15
18
21
250 300 350 400 450 500 550 600 650 700
Frequency, MHz
Rea
l Par
t of D
iele
ctric
Con
stan
t
1 day 3 days 28 days 90 days
Figure C.30. Effect of frequency on the loss part of the dielectric constant for G4Nover different curing times.
0
3
6
9
12
250 300 350 400 450 500 550 600 650 700
Frequency, MHz
Loss
Par
t of D
iele
ctric
C
onst
ant
1 day 3 days 28 days 90 days
C-16
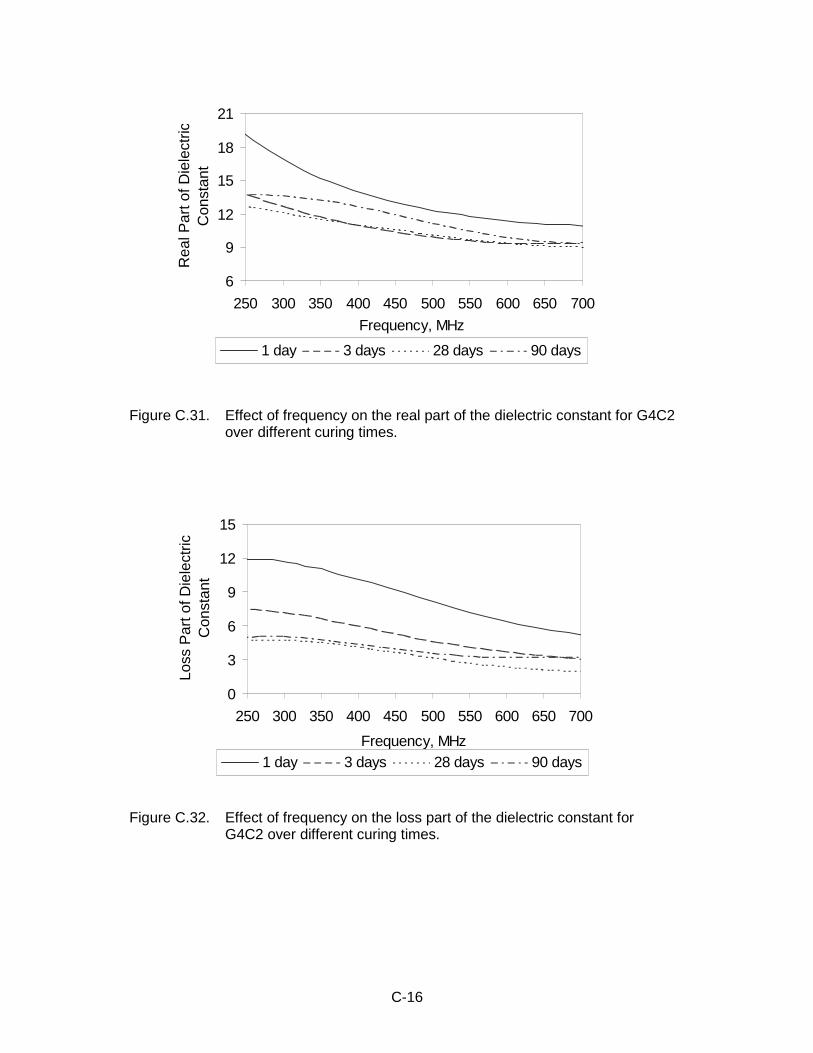
Figure C.31. Effect of frequency on the real part of the dielectric constant for G4C2over different curing times.
6
9
12
15
18
21
250 300 350 400 450 500 550 600 650 700
Frequency, MHz
Rea
l Par
t of D
iele
ctric
Con
stan
t
1 day 3 days 28 days 90 days
Figure C.32. Effect of frequency on the loss part of the dielectric constant forG4C2 over different curing times.
0
3
6
9
12
15
250 300 350 400 450 500 550 600 650 700
Frequency, MHz
Loss
Par
t of D
iele
ctric
Con
stan
t
1 day 3 days 28 days 90 days
C-17
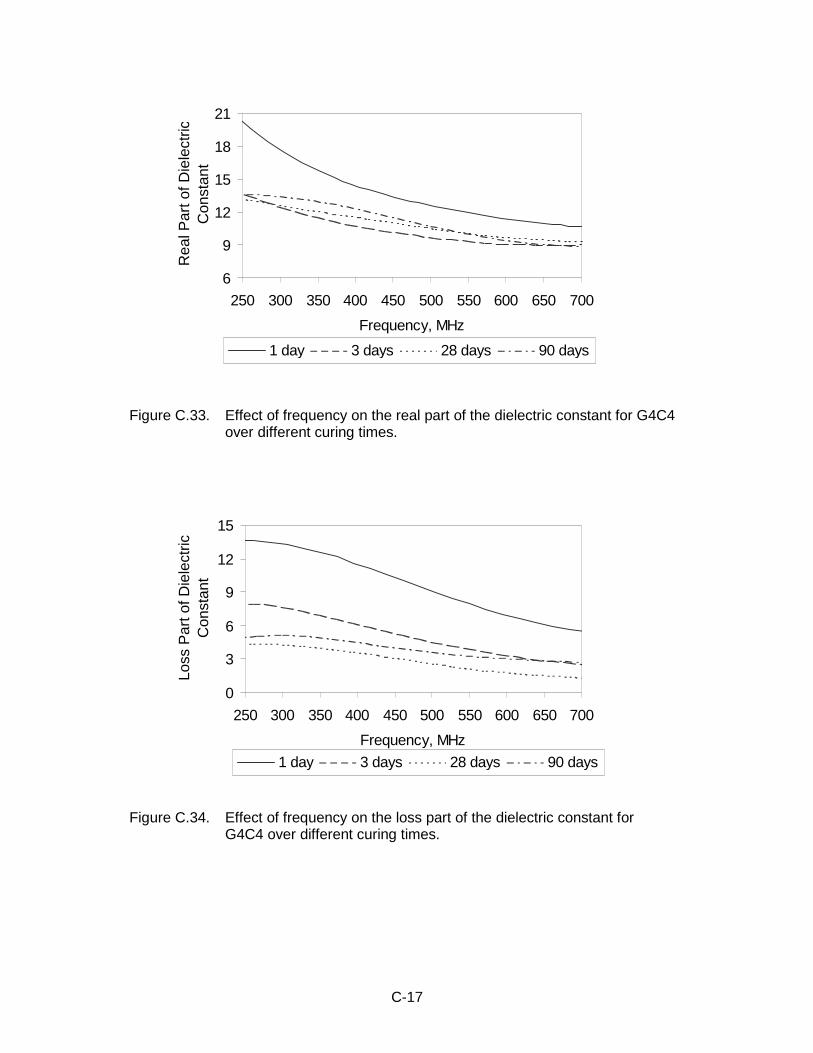
Figure C.33. Effect of frequency on the real part of the dielectric constant for G4C4over different curing times.
6
9
12
15
18
21
250 300 350 400 450 500 550 600 650 700
Frequency, MHz
Rea
l Par
t of D
iele
ctric
Con
stan
t
1 day 3 days 28 days 90 days
Figure C.34. Effect of frequency on the loss part of the dielectric constant forG4C4 over different curing times.
0
3
6
9
12
15
250 300 350 400 450 500 550 600 650 700
Frequency, MHz
Loss
Par
t of D
iele
ctric
Con
stan
t
1 day 3 days 28 days 90 days
C-18
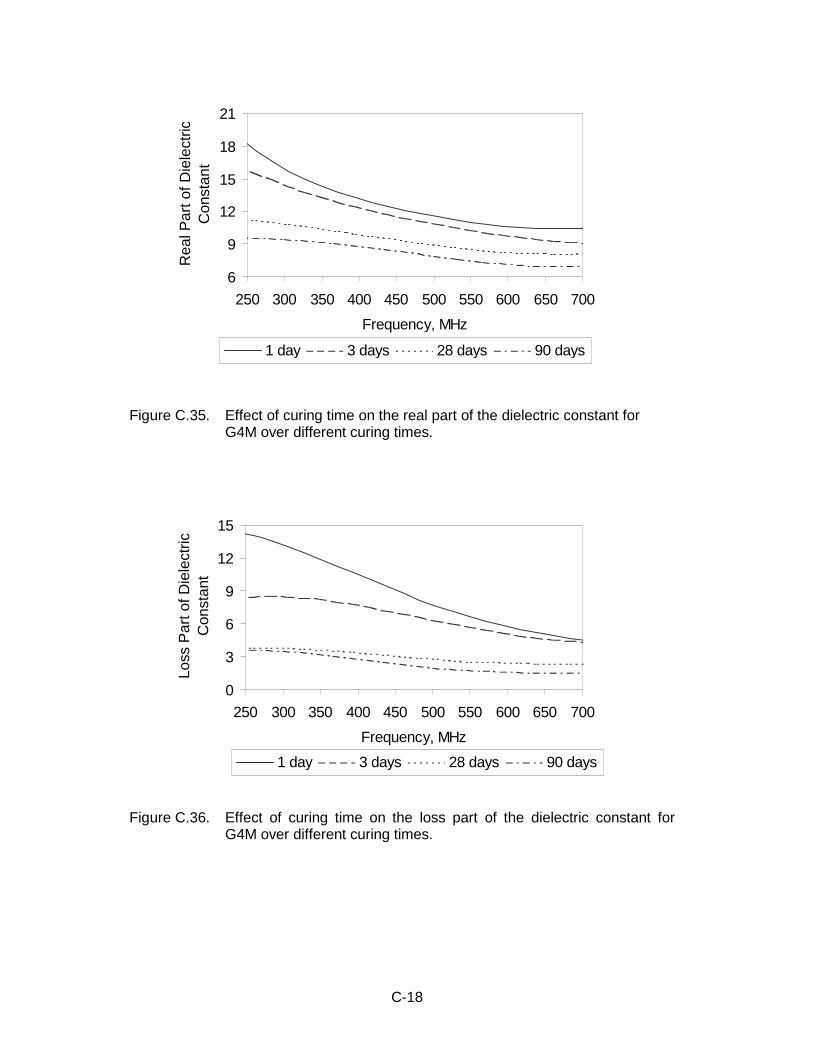
Figure C.35. Effect of curing time on the real part of the dielectric constant forG4M over different curing times.
6
9
12
15
18
21
250 300 350 400 450 500 550 600 650 700
Frequency, MHz
Rea
l Par
t of D
iele
ctric
Con
stan
t
1 day 3 days 28 days 90 days
Figure C.36. Effect of curing time on the loss part of the dielectric constant forG4M over different curing times.
0
3
6
9
12
15
250 300 350 400 450 500 550 600 650 700
Frequency, MHz
Loss
Par
t of D
iele
ctric
C
onst
ant
1 day 3 days 28 days 90 days
APPENDIX D
EFFECT OF CURING TIME ON THE DIELECTRIC CONSTANT
OVER DIFFERENT FREQUENCIES (3 ns WINDOW)
D-1
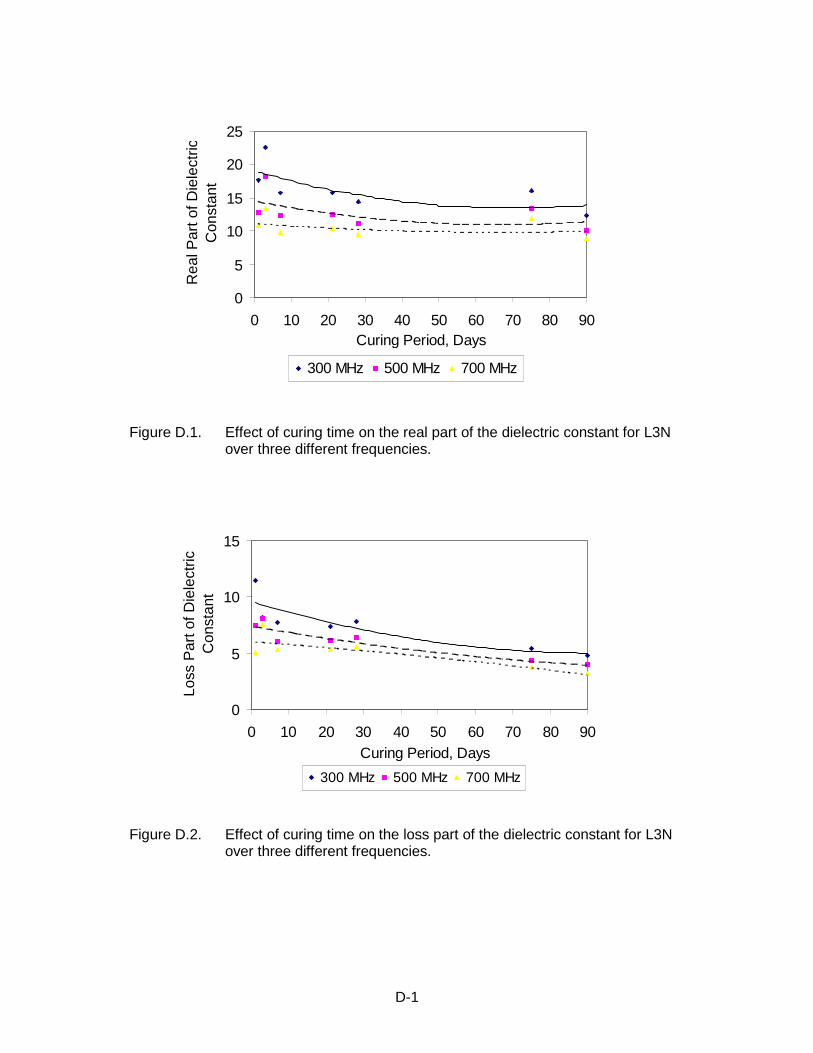
Figure D.1. Effect of curing time on the real part of the dielectric constant for L3Nover three different frequencies.
0
5
10
15
20
25
0 10 20 30 40 50 60 70 80 90Curing Period, Days
Rea
l Par
t of D
iele
ctric
Con
stan
t
300 MHz 500 MHz 700 MHz
Figure D.2. Effect of curing time on the loss part of the dielectric constant for L3Nover three different frequencies.
0
5
10
15
0 10 20 30 40 50 60 70 80 90Curing Period, Days
Loss
Par
t of D
iele
ctric
C
onst
ant
300 MHz 500 MHz 700 MHz
D-2
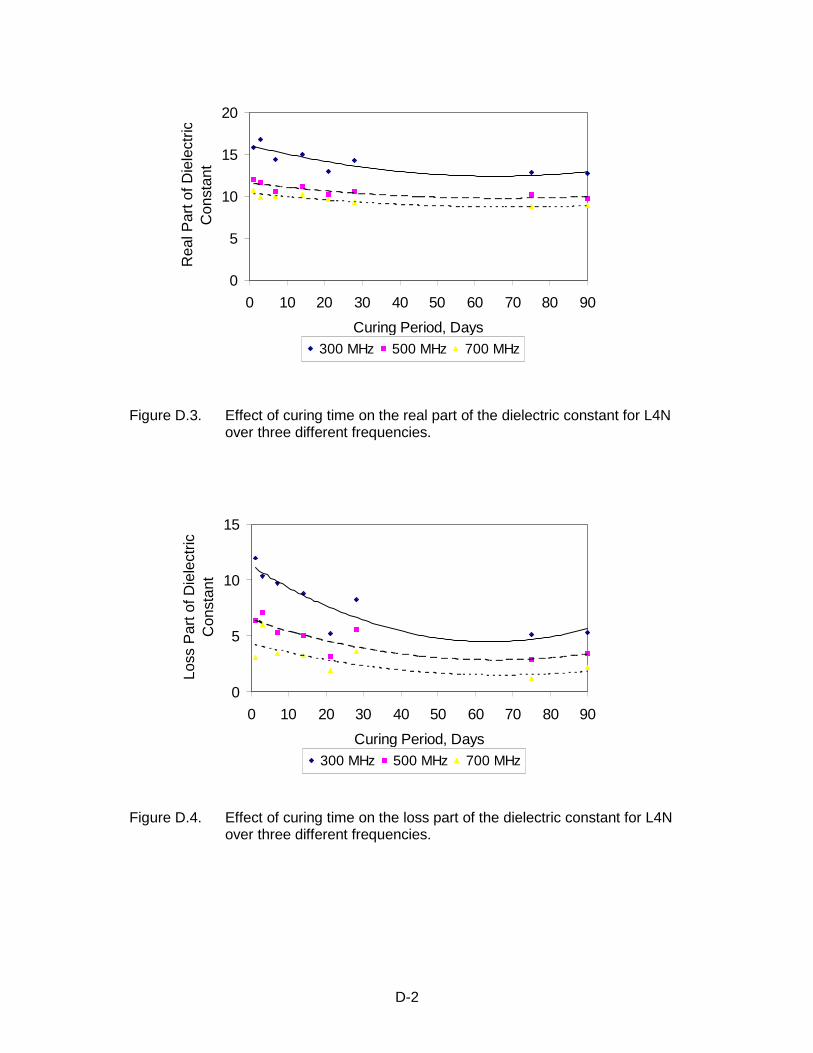
Figure D.3. Effect of curing time on the real part of the dielectric constant for L4Nover three different frequencies.
0
5
10
15
20
0 10 20 30 40 50 60 70 80 90
Curing Period, Days
Rea
l Par
t of D
iele
ctric
Con
stan
t
300 MHz 500 MHz 700 MHz
Figure D.4. Effect of curing time on the loss part of the dielectric constant for L4Nover three different frequencies.
0
5
10
15
0 10 20 30 40 50 60 70 80 90
Curing Period, Days
Loss
Par
t of D
iele
ctric
C
onst
ant
300 MHz 500 MHz 700 MHz
D-3
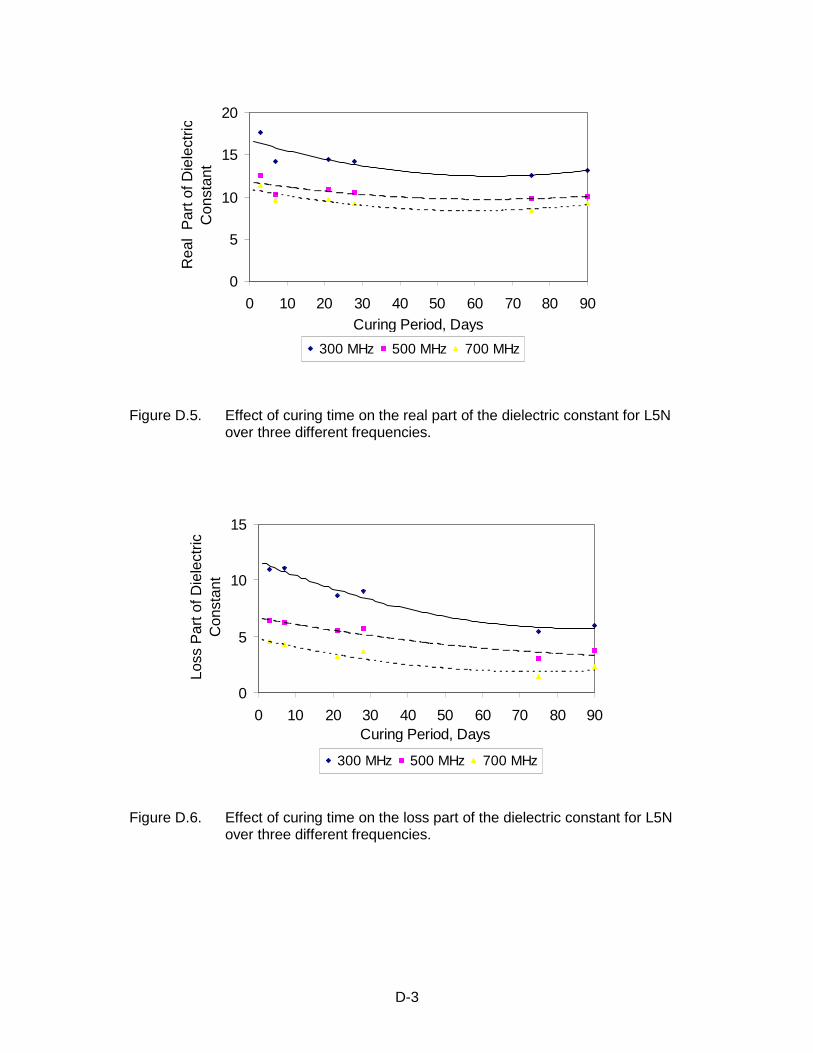
Figure D.5. Effect of curing time on the real part of the dielectric constant for L5Nover three different frequencies.
0
5
10
15
20
0 10 20 30 40 50 60 70 80 90Curing Period, Days
Rea
l P
art o
f Die
lect
ricC
onst
ant
300 MHz 500 MHz 700 MHz
Figure D.6. Effect of curing time on the loss part of the dielectric constant for L5Nover three different frequencies.
0
5
10
15
0 10 20 30 40 50 60 70 80 90Curing Period, Days
Loss
Par
t of D
iele
ctric
C
onst
ant
300 MHz 500 MHz 700 MHz
D-4
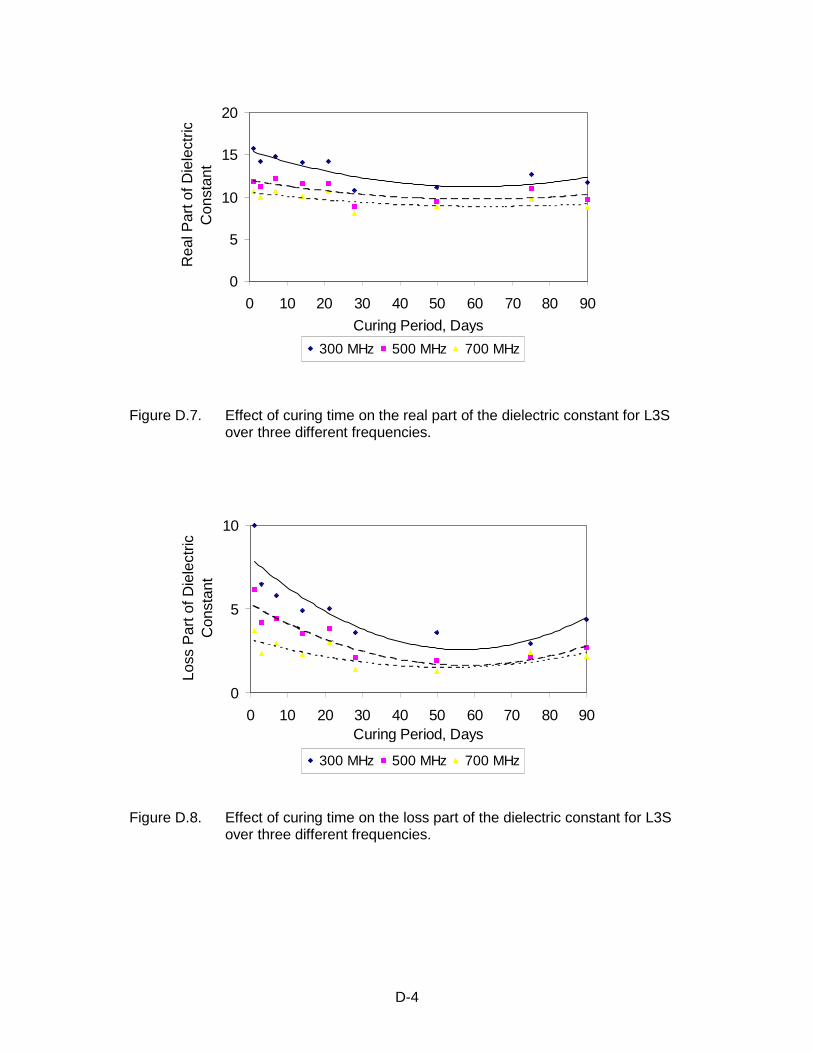
Figure D.7. Effect of curing time on the real part of the dielectric constant for L3Sover three different frequencies.
0
5
10
15
20
0 10 20 30 40 50 60 70 80 90
Curing Period, Days
Rea
l Par
t of D
iele
ctric
Con
stan
t
300 MHz 500 MHz 700 MHz
Figure D.8. Effect of curing time on the loss part of the dielectric constant for L3Sover three different frequencies.
0
5
10
0 10 20 30 40 50 60 70 80 90Curing Period, Days
Loss
Par
t of D
iele
ctric
C
onst
ant
300 MHz 500 MHz 700 MHz
D-5
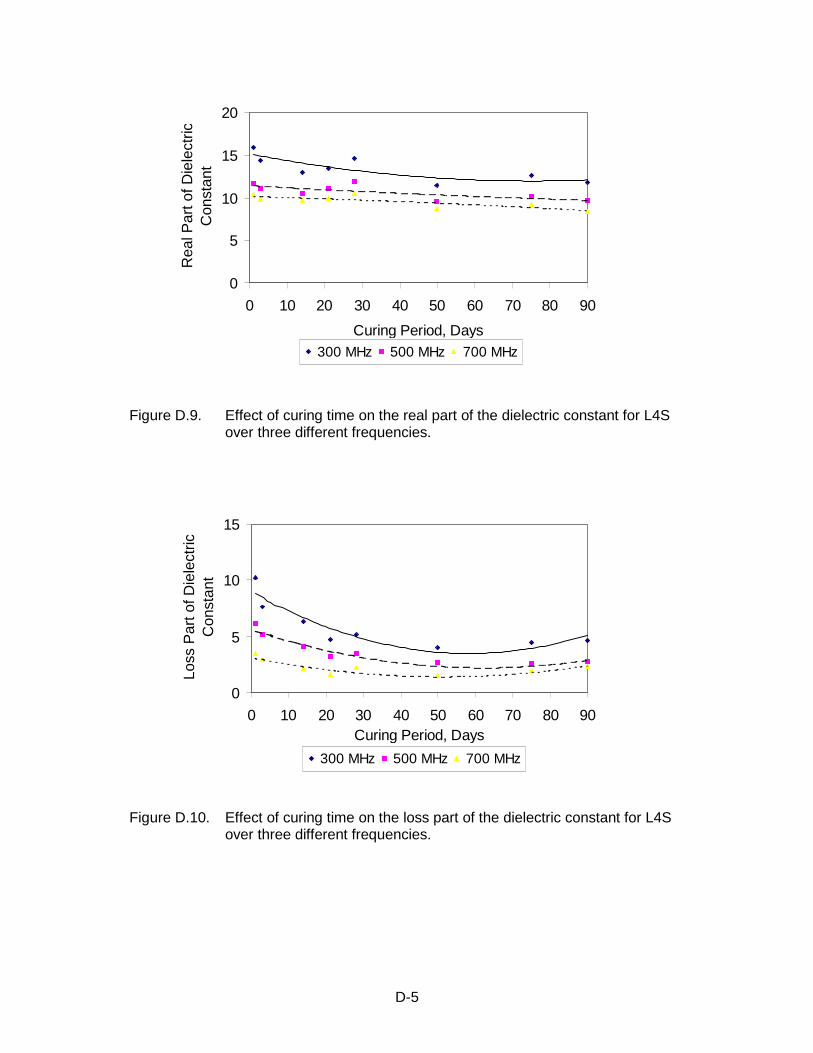
Figure D.9. Effect of curing time on the real part of the dielectric constant for L4Sover three different frequencies.
0
5
10
15
20
0 10 20 30 40 50 60 70 80 90
Curing Period, Days
Rea
l Par
t of D
iele
ctric
Con
stan
t
300 MHz 500 MHz 700 MHz
Figure D.10. Effect of curing time on the loss part of the dielectric constant for L4Sover three different frequencies.
0
5
10
15
0 10 20 30 40 50 60 70 80 90Curing Period, Days
Loss
Par
t of D
iele
ctric
C
onst
ant
300 MHz 500 MHz 700 MHz
D-6
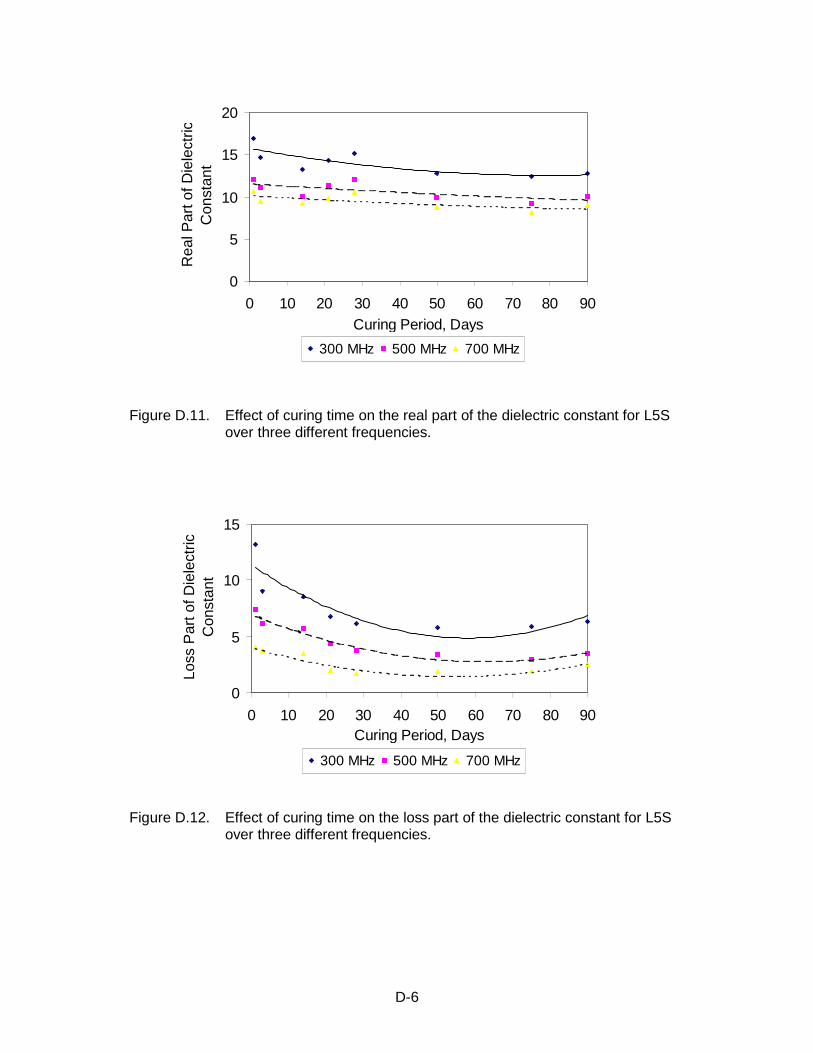
Figure D.11. Effect of curing time on the real part of the dielectric constant for L5Sover three different frequencies.
0
5
10
15
20
0 10 20 30 40 50 60 70 80 90Curing Period, Days
Rea
l Par
t of D
iele
ctric
Con
stan
t
300 MHz 500 MHz 700 MHz
Figure D.12. Effect of curing time on the loss part of the dielectric constant for L5Sover three different frequencies.
0
5
10
15
0 10 20 30 40 50 60 70 80 90Curing Period, Days
Loss
Par
t of D
iele
ctric
C
onst
ant
300 MHz 500 MHz 700 MHz
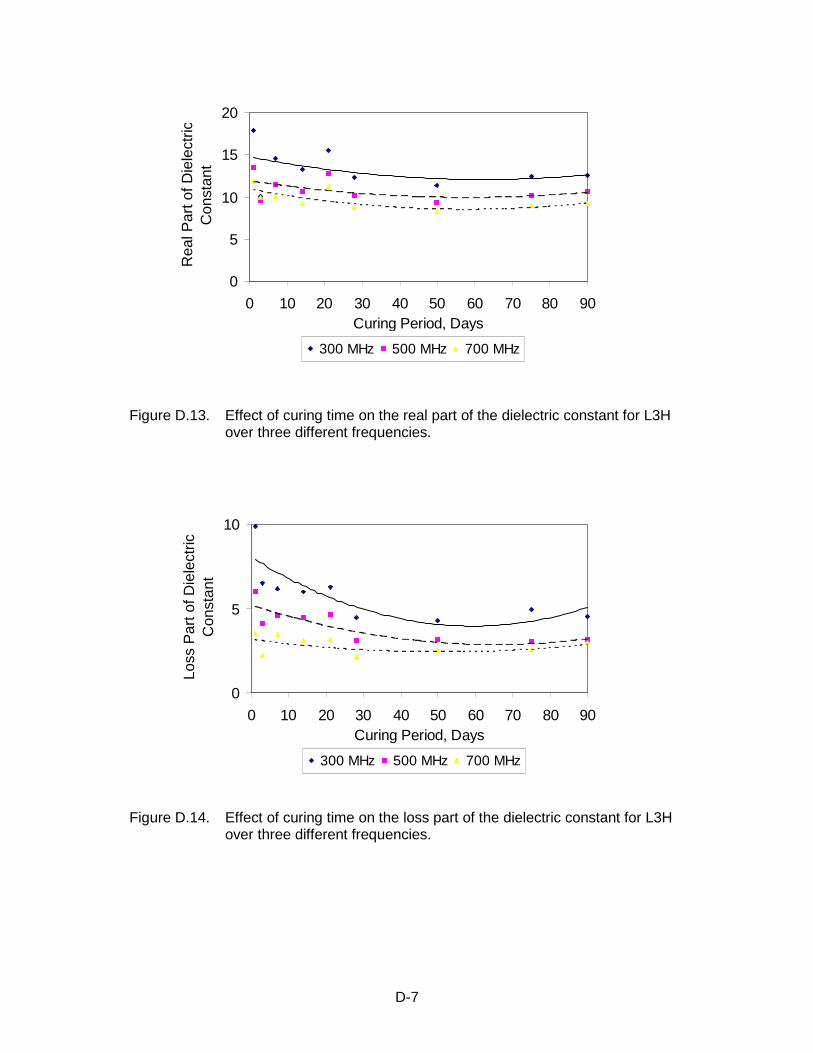
D-7
Figure D.13. Effect of curing time on the real part of the dielectric constant for L3Hover three different frequencies.
0
5
10
15
20
0 10 20 30 40 50 60 70 80 90Curing Period, Days
Rea
l Par
t of D
iele
ctric
Con
stan
t
300 MHz 500 MHz 700 MHz
Figure D.14. Effect of curing time on the loss part of the dielectric constant for L3Hover three different frequencies.
0
5
10
0 10 20 30 40 50 60 70 80 90Curing Period, Days
Loss
Par
t of D
iele
ctric
C
onst
ant
300 MHz 500 MHz 700 MHz
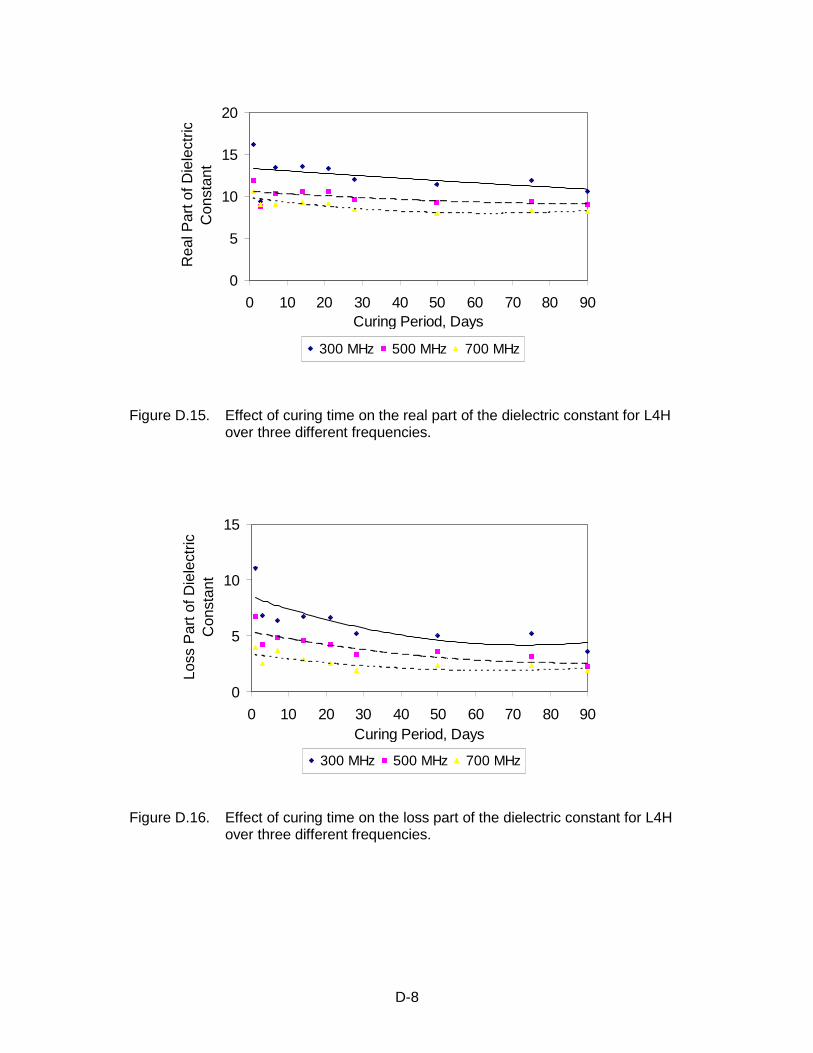
D-8
Figure D.15. Effect of curing time on the real part of the dielectric constant for L4Hover three different frequencies.
0
5
10
15
20
0 10 20 30 40 50 60 70 80 90Curing Period, Days
Rea
l Par
t of D
iele
ctric
Con
stan
t
300 MHz 500 MHz 700 MHz
Figure D.16. Effect of curing time on the loss part of the dielectric constant for L4Hover three different frequencies.
0
5
10
15
0 10 20 30 40 50 60 70 80 90Curing Period, Days
Loss
Par
t of D
iele
ctric
C
onst
ant
300 MHz 500 MHz 700 MHz
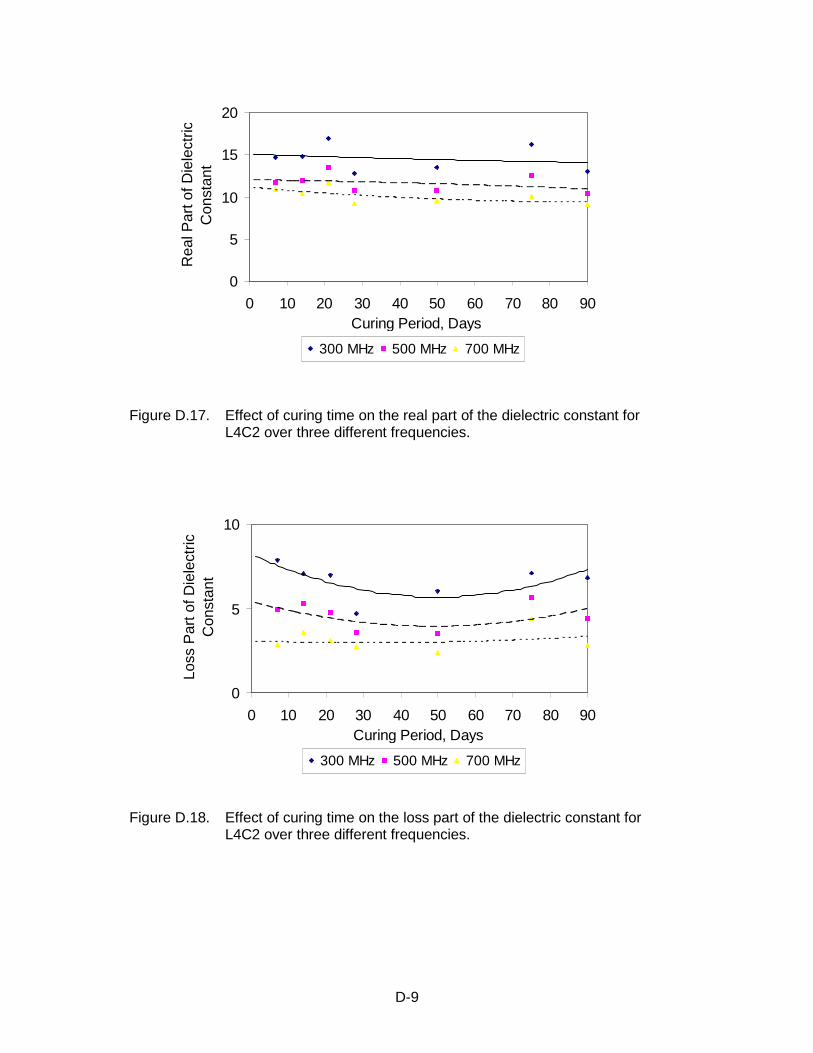
D-9
Figure D.17. Effect of curing time on the real part of the dielectric constant forL4C2 over three different frequencies.
0
5
10
15
20
0 10 20 30 40 50 60 70 80 90Curing Period, Days
Rea
l Par
t of D
iele
ctric
Con
stan
t
300 MHz 500 MHz 700 MHz
Figure D.18. Effect of curing time on the loss part of the dielectric constant forL4C2 over three different frequencies.
0
5
10
0 10 20 30 40 50 60 70 80 90Curing Period, Days
Loss
Par
t of D
iele
ctric
C
onst
ant
300 MHz 500 MHz 700 MHz
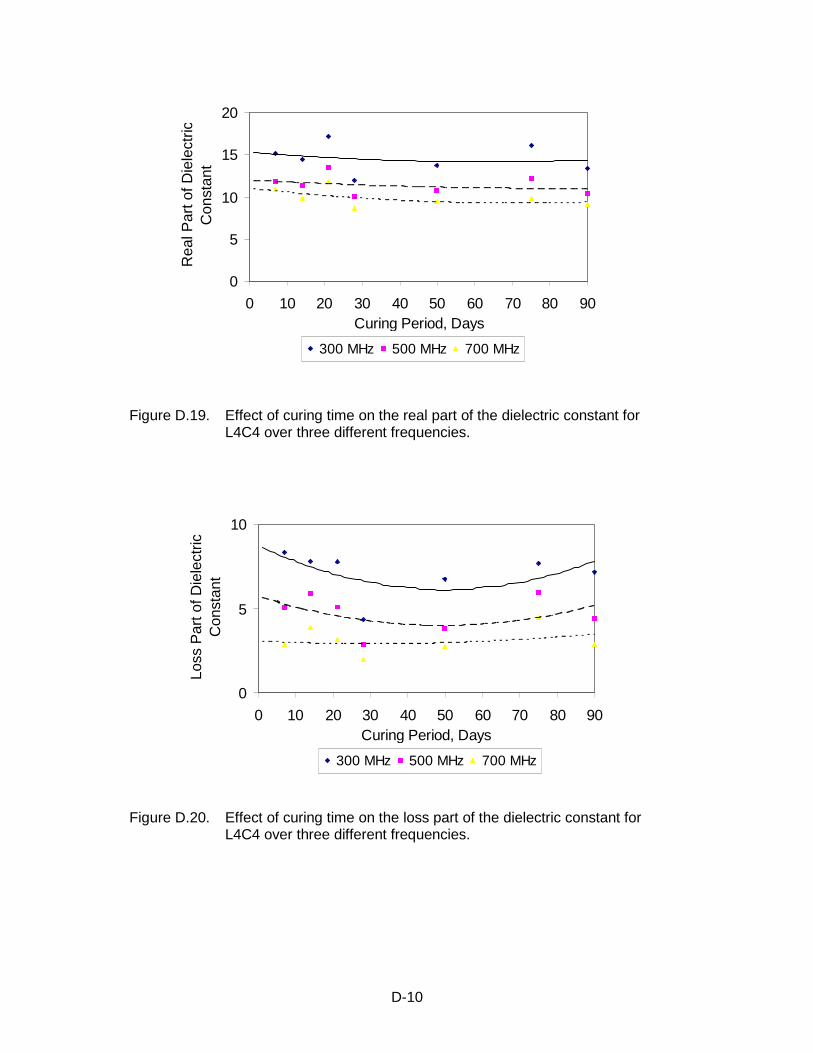
D-10
Figure D.19. Effect of curing time on the real part of the dielectric constant forL4C4 over three different frequencies.
0
5
10
15
20
0 10 20 30 40 50 60 70 80 90Curing Period, Days
Rea
l Par
t of D
iele
ctric
Con
stan
t
300 MHz 500 MHz 700 MHz
Figure D.20. Effect of curing time on the loss part of the dielectric constant forL4C4 over three different frequencies.
0
5
10
0 10 20 30 40 50 60 70 80 90Curing Period, Days
Loss
Par
t of D
iele
ctric
C
onst
ant
300 MHz 500 MHz 700 MHz
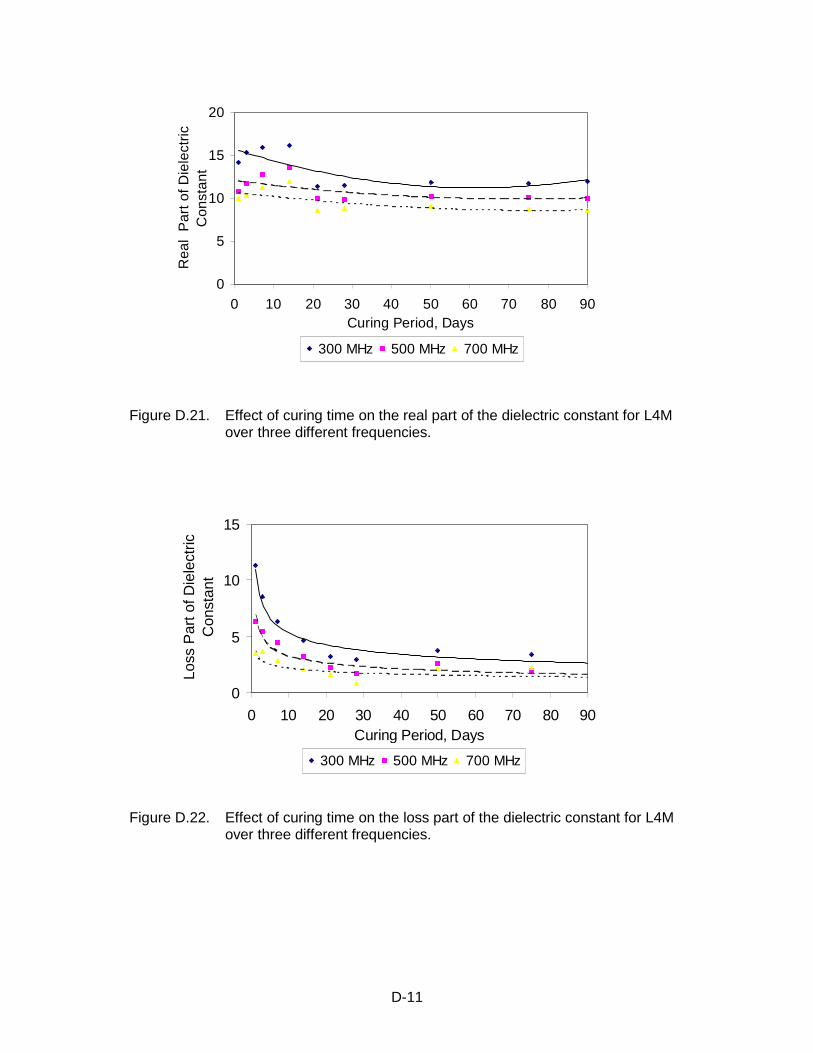
D-11
Figure D.21. Effect of curing time on the real part of the dielectric constant for L4Mover three different frequencies.
0
5
10
15
20
0 10 20 30 40 50 60 70 80 90Curing Period, Days
Rea
l P
art o
f Die
lect
ricC
onst
ant
300 MHz 500 MHz 700 MHz
Figure D.22. Effect of curing time on the loss part of the dielectric constant for L4Mover three different frequencies.
0
5
10
15
0 10 20 30 40 50 60 70 80 90Curing Period, Days
Loss
Par
t of D
iele
ctric
C
onst
ant
300 MHz 500 MHz 700 MHz
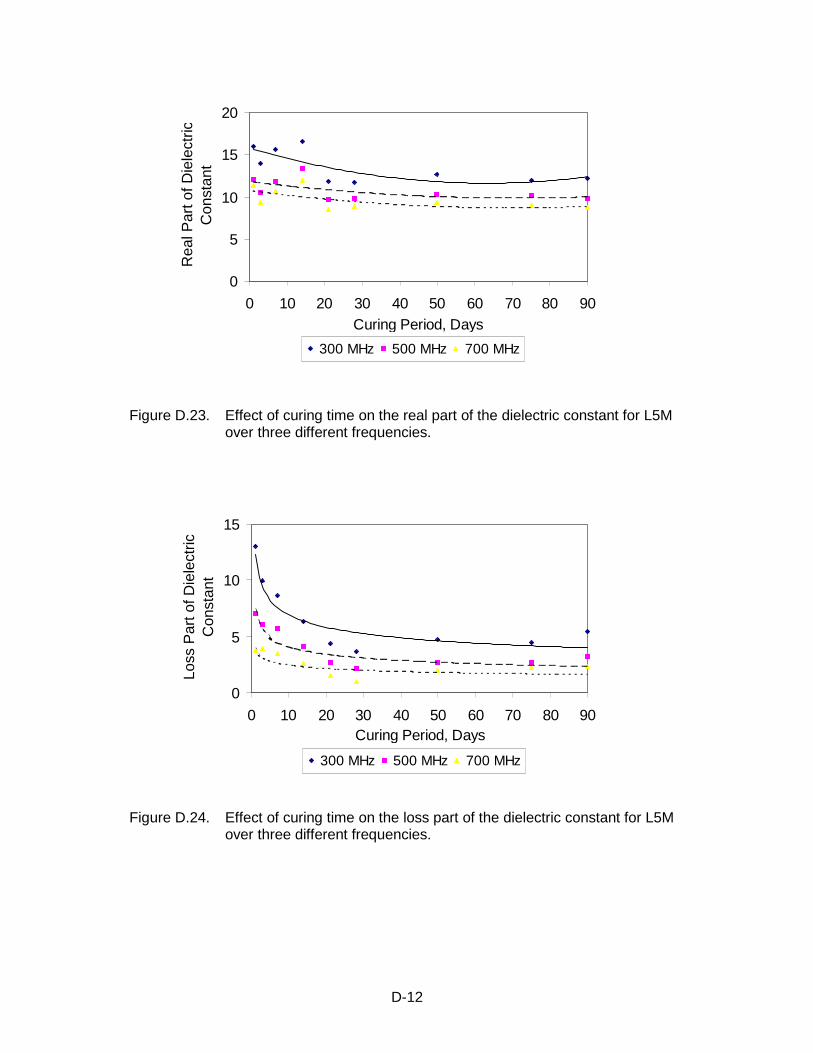
D-12
Figure D.23. Effect of curing time on the real part of the dielectric constant for L5Mover three different frequencies.
0
5
10
15
20
0 10 20 30 40 50 60 70 80 90Curing Period, Days
Rea
l Par
t of D
iele
ctric
Con
stan
t
300 MHz 500 MHz 700 MHz
Figure D.24. Effect of curing time on the loss part of the dielectric constant for L5Mover three different frequencies.
0
5
10
15
0 10 20 30 40 50 60 70 80 90Curing Period, Days
Loss
Par
t of D
iele
ctric
C
onst
ant
300 MHz 500 MHz 700 MHz
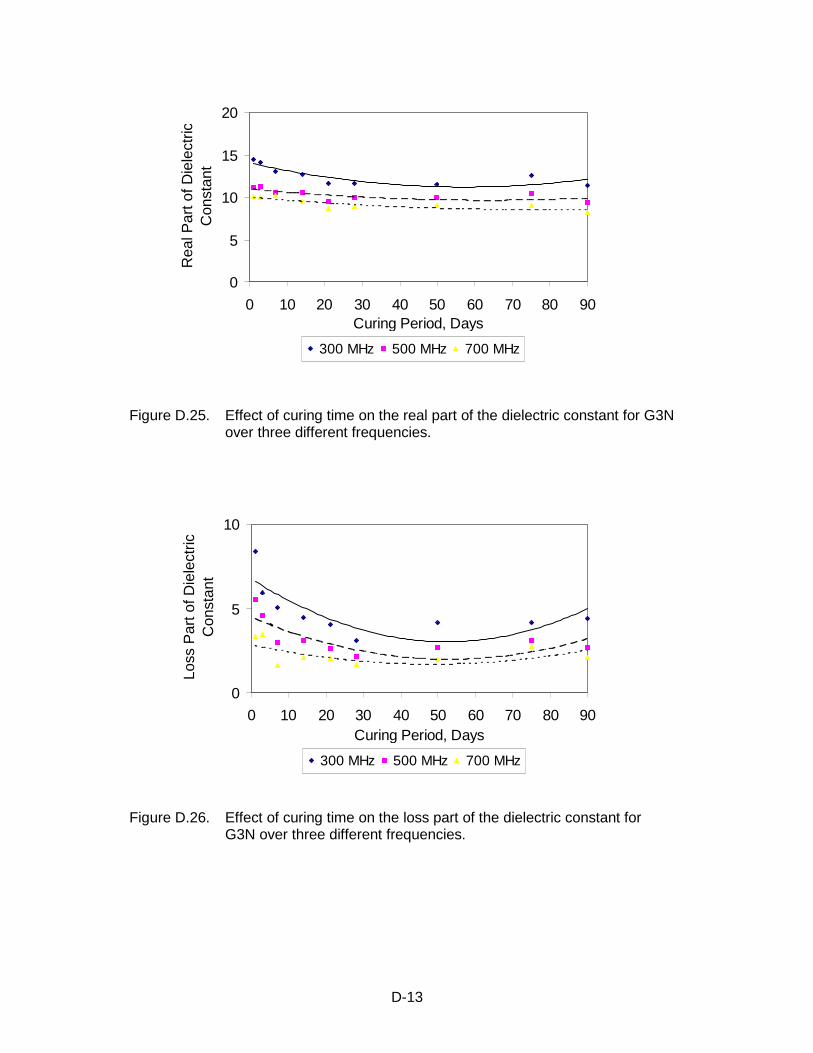
D-13
Figure D.25. Effect of curing time on the real part of the dielectric constant for G3Nover three different frequencies.
0
5
10
15
20
0 10 20 30 40 50 60 70 80 90Curing Period, Days
Rea
l Par
t of D
iele
ctric
Con
stan
t
300 MHz 500 MHz 700 MHz
Figure D.26. Effect of curing time on the loss part of the dielectric constant forG3N over three different frequencies.
0
5
10
0 10 20 30 40 50 60 70 80 90Curing Period, Days
Loss
Par
t of D
iele
ctric
C
onst
ant
300 MHz 500 MHz 700 MHz
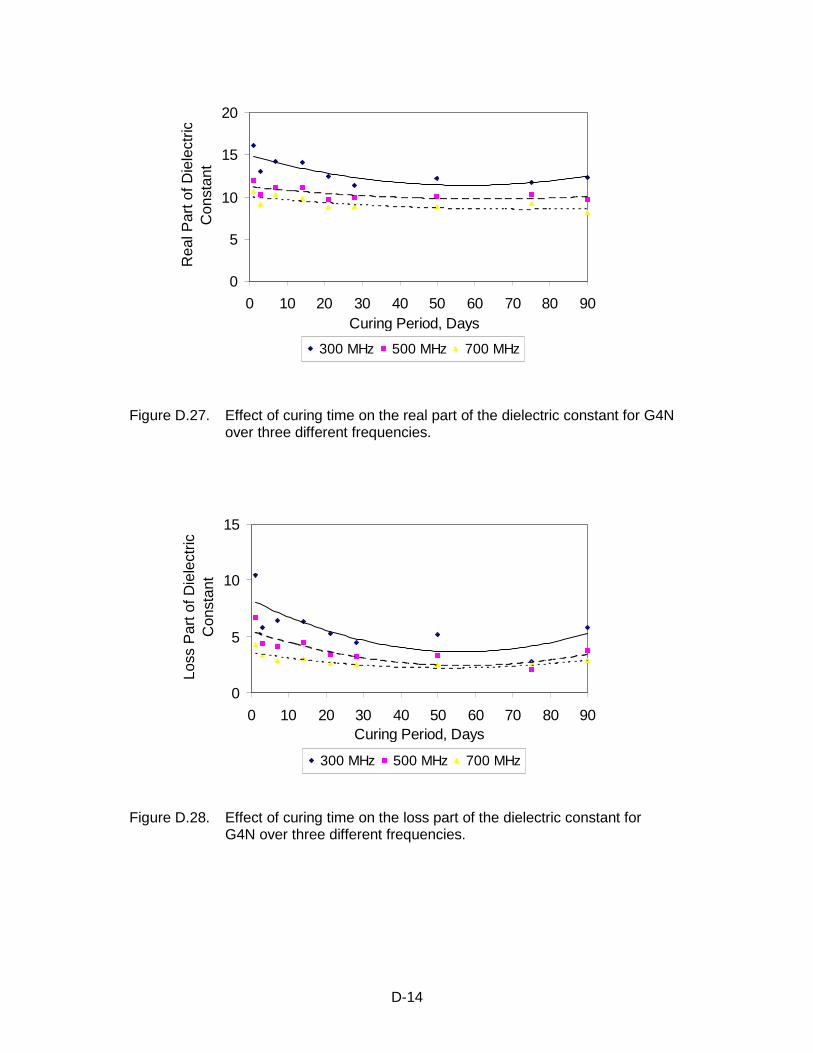
D-14
Figure D.27. Effect of curing time on the real part of the dielectric constant for G4Nover three different frequencies.
0
5
10
15
20
0 10 20 30 40 50 60 70 80 90Curing Period, Days
Rea
l Par
t of D
iele
ctric
Con
stan
t
300 MHz 500 MHz 700 MHz
Figure D.28. Effect of curing time on the loss part of the dielectric constant forG4N over three different frequencies.
0
5
10
15
0 10 20 30 40 50 60 70 80 90Curing Period, Days
Loss
Par
t of D
iele
ctric
C
onst
ant
300 MHz 500 MHz 700 MHz
D-15
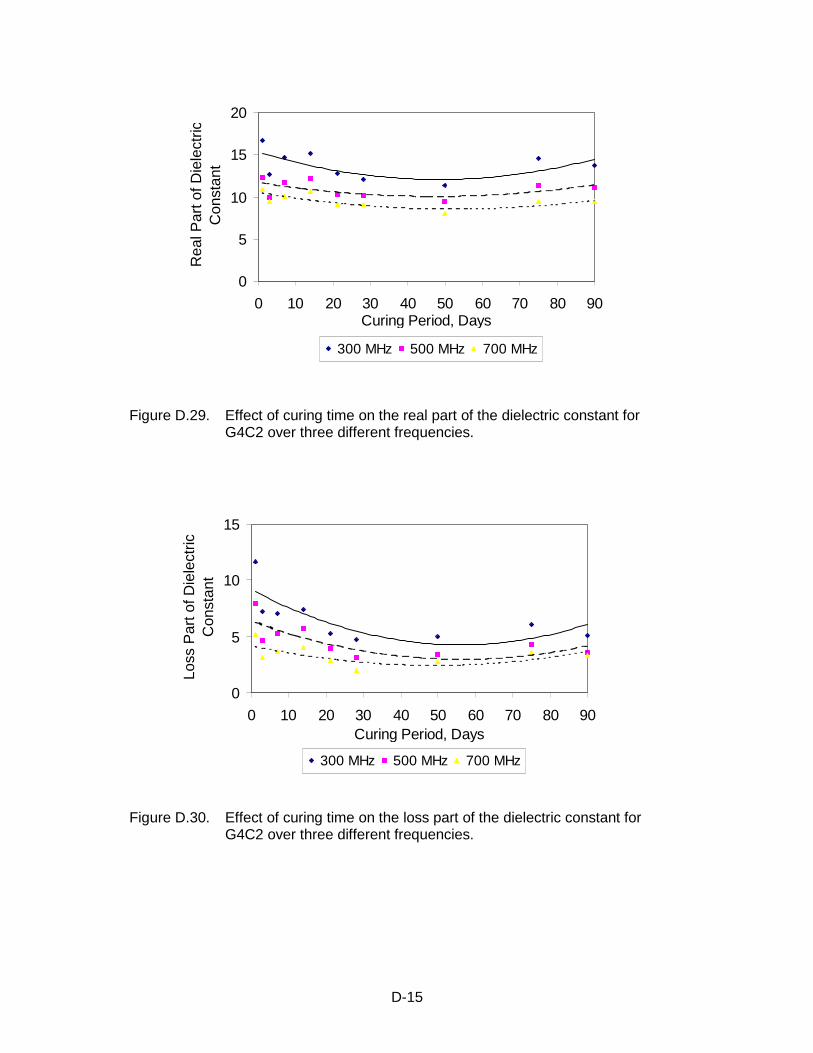
Figure D.29. Effect of curing time on the real part of the dielectric constant forG4C2 over three different frequencies.
0
5
10
15
20
0 10 20 30 40 50 60 70 80 90Curing Period, Days
Rea
l Par
t of D
iele
ctric
Con
stan
t
300 MHz 500 MHz 700 MHz
Figure D.30. Effect of curing time on the loss part of the dielectric constant forG4C2 over three different frequencies.
0
5
10
15
0 10 20 30 40 50 60 70 80 90Curing Period, Days
Loss
Par
t of D
iele
ctric
C
onst
ant
300 MHz 500 MHz 700 MHz
D-16
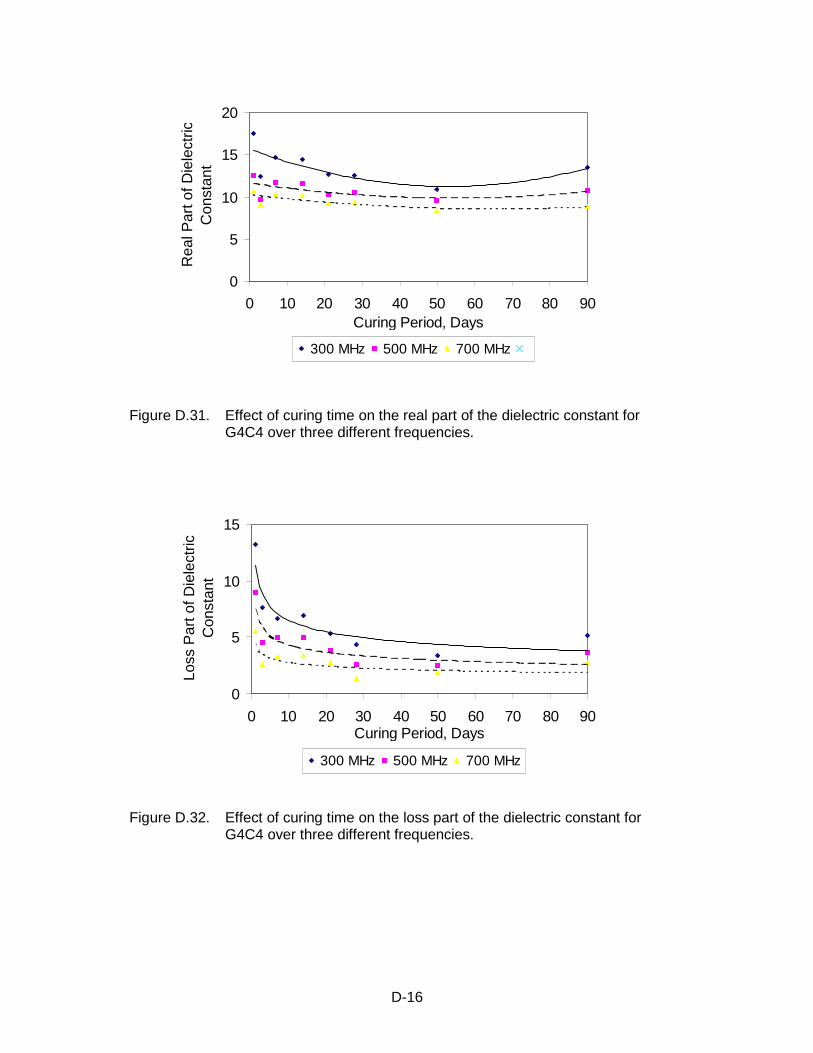
Figure D.31. Effect of curing time on the real part of the dielectric constant forG4C4 over three different frequencies.
0
5
10
15
20
0 10 20 30 40 50 60 70 80 90Curing Period, Days
Rea
l Par
t of D
iele
ctric
Con
stan
t
300 MHz 500 MHz 700 MHz
Figure D.32. Effect of curing time on the loss part of the dielectric constant forG4C4 over three different frequencies.
0
5
10
15
0 10 20 30 40 50 60 70 80 90Curing Period, Days
Loss
Par
t of D
iele
ctric
C
onst
ant
300 MHz 500 MHz 700 MHz
D-17
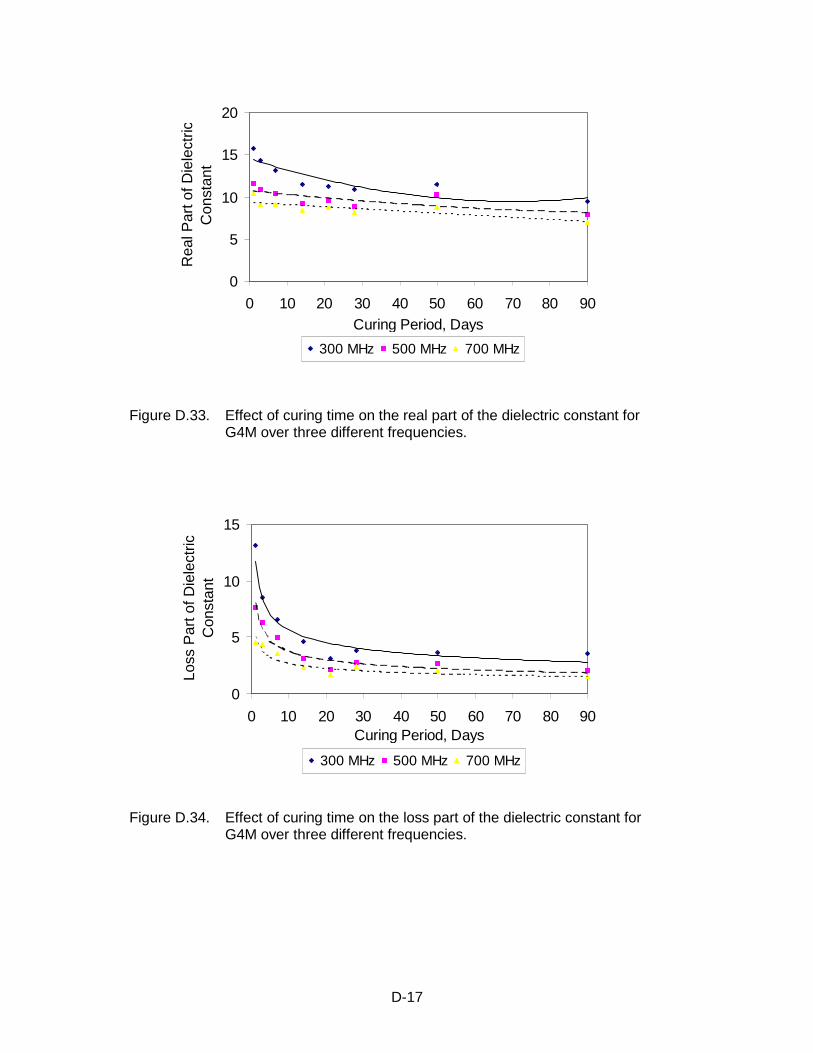
Figure D.33. Effect of curing time on the real part of the dielectric constant forG4M over three different frequencies.
0
5
10
15
20
0 10 20 30 40 50 60 70 80 90Curing Period, Days
Rea
l Par
t of D
iele
ctric
Con
stan
t
300 MHz 500 MHz 700 MHz
Figure D.34. Effect of curing time on the loss part of the dielectric constant forG4M over three different frequencies.
0
5
10
15
0 10 20 30 40 50 60 70 80 90Curing Period, Days
Loss
Par
t of D
iele
ctric
C
onst
ant
300 MHz 500 MHz 700 MHz
APPENDIX E
EFFECT OF FREQUENCY ON THE DIELECTRIC CONSTANT FOR
DIFFERENT LEVELS OF MOISTURE CONTENT (3 ns WINDOW)
E-1
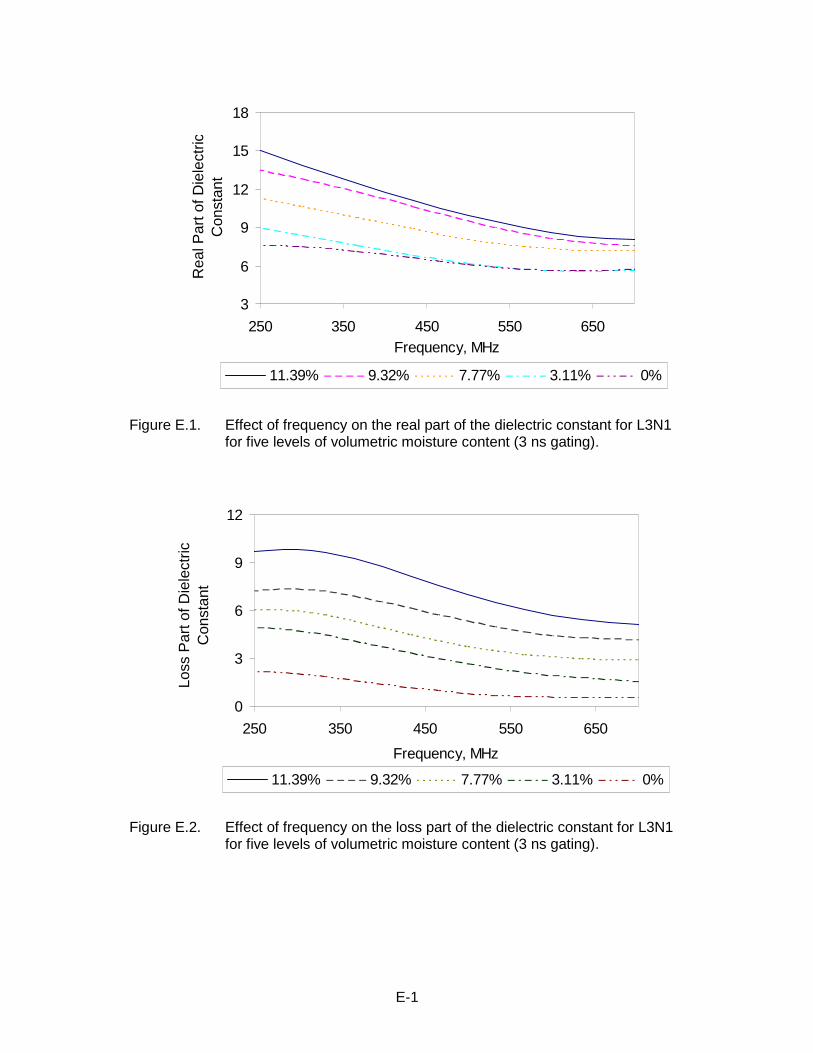
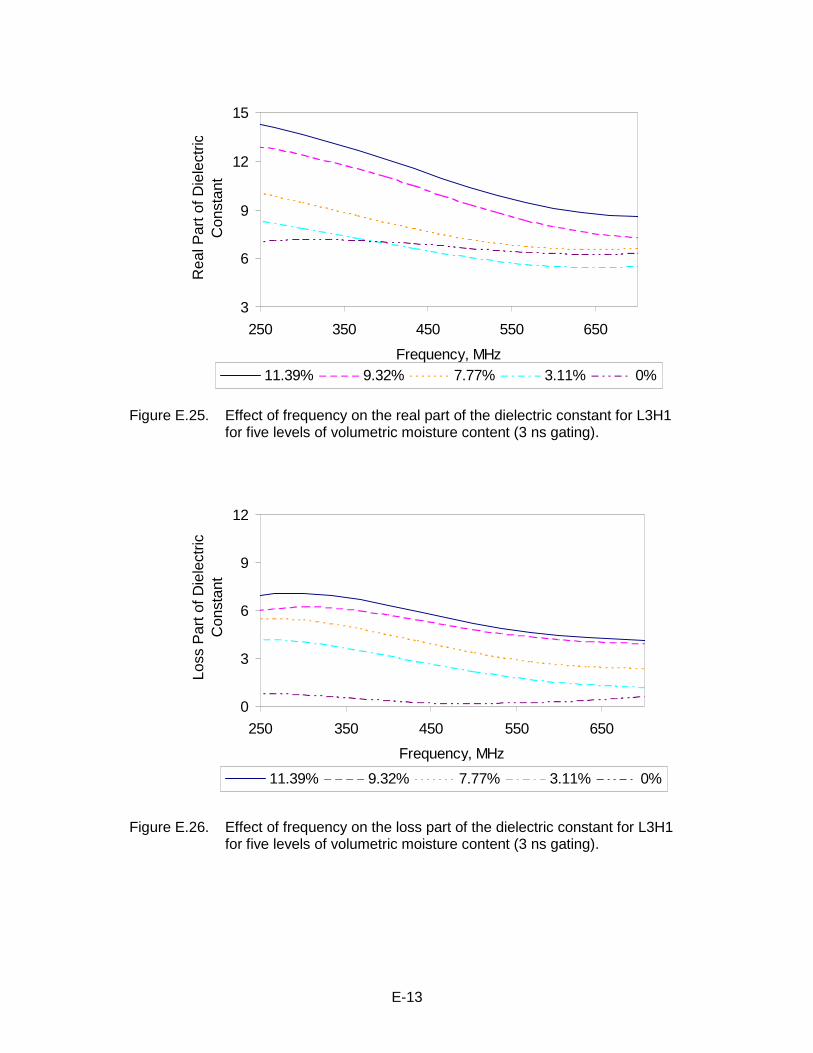
Figure E.1. Effect of frequency on the real part of the dielectric constant for L3N1for five levels of volumetric moisture content (3 ns gating).
3
6
9
12
15
18
250 350 450 550 650Frequency, MHz
Rea
l Par
t of D
iele
ctric
Con
stan
t
11.39% 9.32% 7.77% 3.11% 0%
Figure E.2. Effect of frequency on the loss part of the dielectric constant for L3N1for five levels of volumetric moisture content (3 ns gating).
0
3
6
9
12
250 350 450 550 650
Frequency, MHz
Loss
Par
t of D
iele
ctric
C
onst
ant
11.39% 9.32% 7.77% 3.11% 0%
E-2
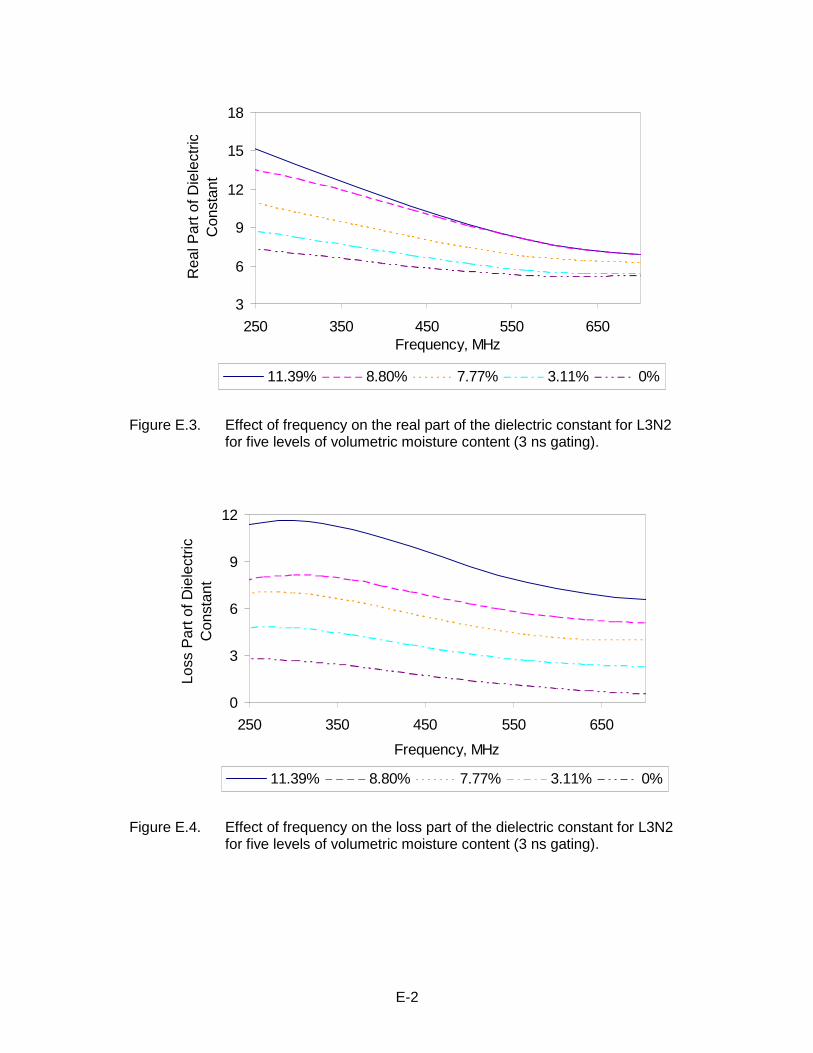
Figure E.3. Effect of frequency on the real part of the dielectric constant for L3N2for five levels of volumetric moisture content (3 ns gating).
3
6
9
12
15
18
250 350 450 550 650Frequency, MHz
Rea
l Par
t of D
iele
ctric
Con
stan
t
11.39% 8.80% 7.77% 3.11% 0%
Figure E.4. Effect of frequency on the loss part of the dielectric constant for L3N2for five levels of volumetric moisture content (3 ns gating).
0
3
6
9
12
250 350 450 550 650
Frequency, MHz
Loss
Par
t of D
iele
ctric
C
onst
ant
11.39% 8.80% 7.77% 3.11% 0%
E-3
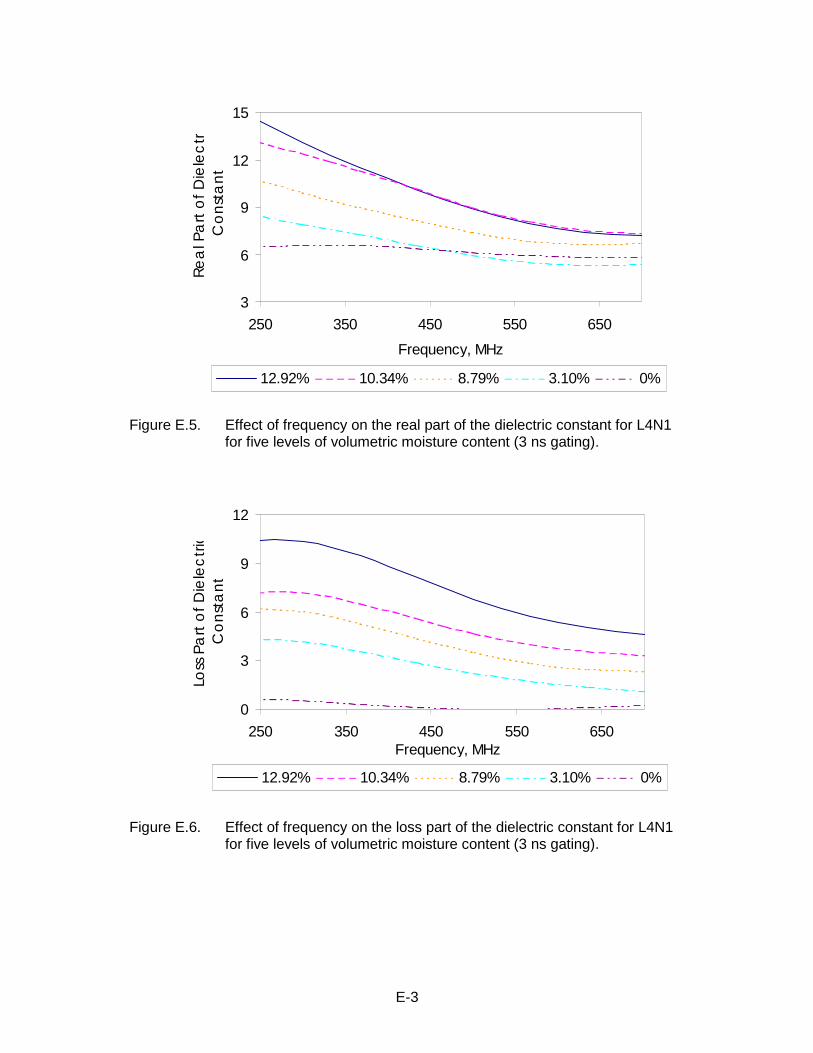
Figure E.5. Effect of frequency on the real part of the dielectric constant for L4N1for five levels of volumetric moisture content (3 ns gating).
3
6
9
12
15
250 350 450 550 650
Frequency, MHz
Re
al P
art
of
Die
lec
trC
on
sta
nt
12.92% 10.34% 8.79% 3.10% 0%
Figure E.6. Effect of frequency on the loss part of the dielectric constant for L4N1for five levels of volumetric moisture content (3 ns gating).
0
3
6
9
12
250 350 450 550 650Frequency, MHz
Loss
Pa
rt o
f D
iele
ctr
icC
on
sta
nt
12.92% 10.34% 8.79% 3.10% 0%
E-4
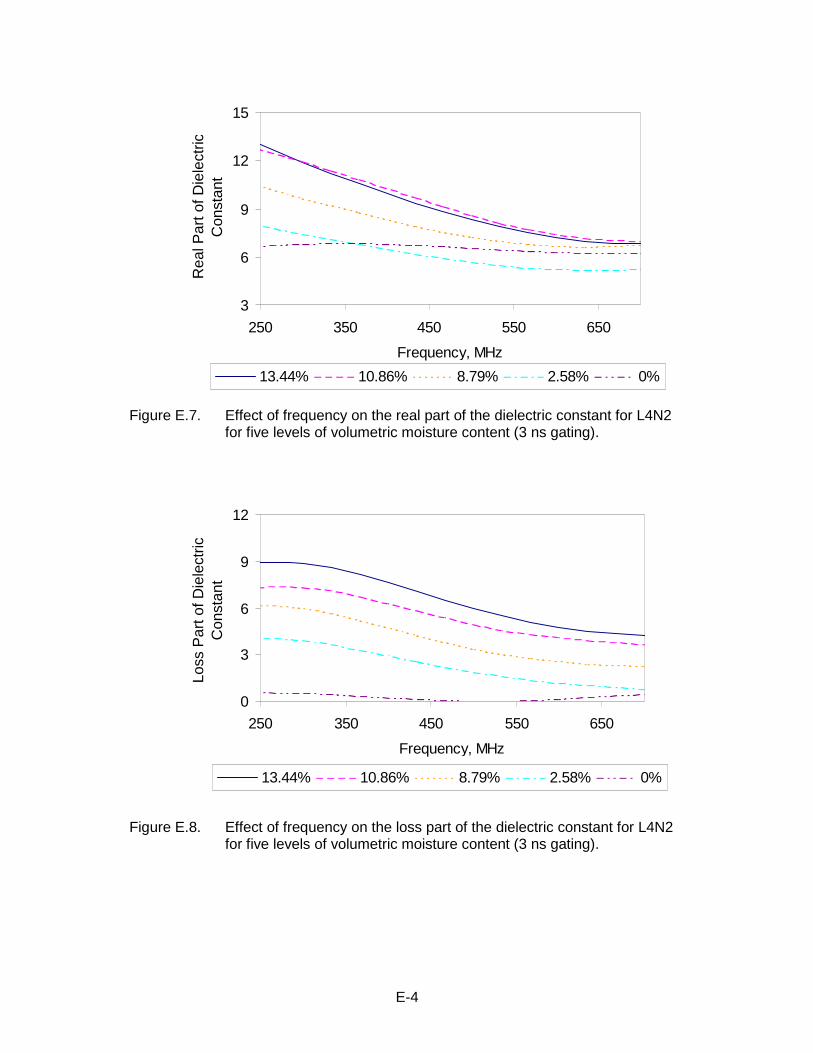
Figure E.7. Effect of frequency on the real part of the dielectric constant for L4N2for five levels of volumetric moisture content (3 ns gating).
3
6
9
12
15
250 350 450 550 650
Frequency, MHz
Rea
l Par
t of D
iele
ctric
Con
stan
t
13.44% 10.86% 8.79% 2.58% 0%
Figure E.8. Effect of frequency on the loss part of the dielectric constant for L4N2for five levels of volumetric moisture content (3 ns gating).
0
3
6
9
12
250 350 450 550 650
Frequency, MHz
Loss
Par
t of D
iele
ctric
Con
stan
t
13.44% 10.86% 8.79% 2.58% 0%
E-5
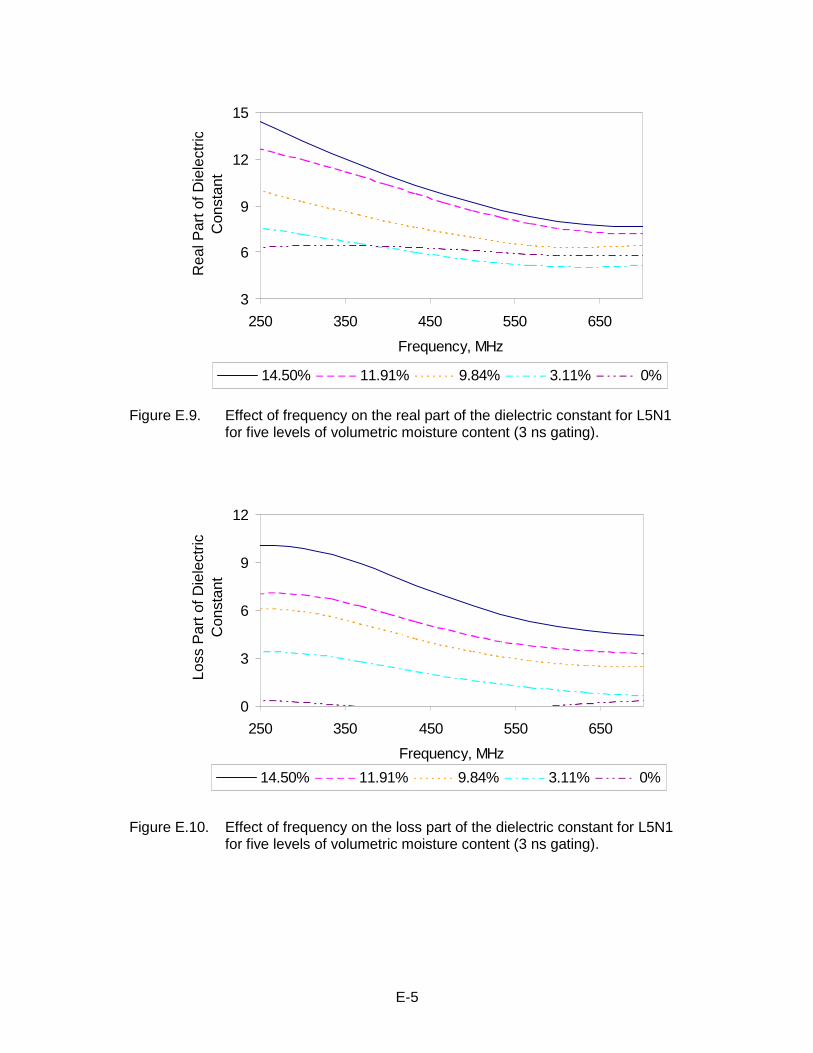
Figure E.9. Effect of frequency on the real part of the dielectric constant for L5N1for five levels of volumetric moisture content (3 ns gating).
3
6
9
12
15
250 350 450 550 650
Frequency, MHz
Rea
l Par
t of D
iele
ctric
Con
stan
t
14.50% 11.91% 9.84% 3.11% 0%
Figure E.10. Effect of frequency on the loss part of the dielectric constant for L5N1for five levels of volumetric moisture content (3 ns gating).
0
3
6
9
12
250 350 450 550 650
Frequency, MHz
Loss
Par
t of D
iele
ctric
C
onst
ant
14.50% 11.91% 9.84% 3.11% 0%
E-6
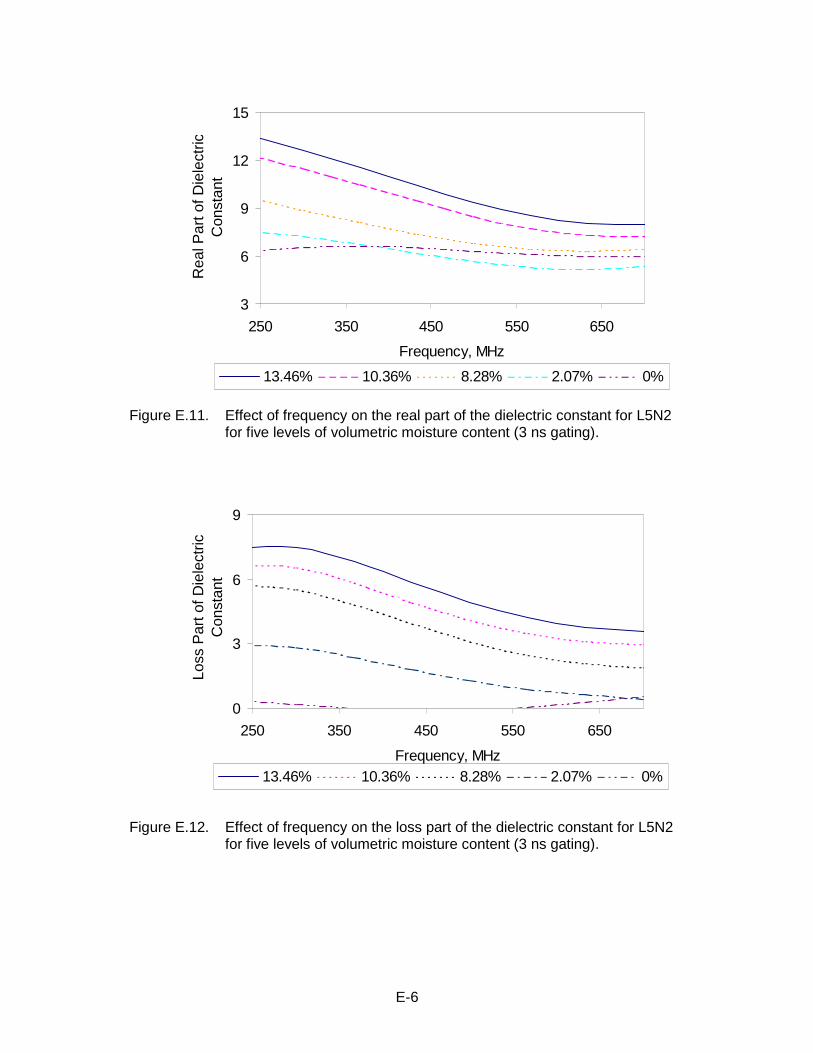
Figure E.11. Effect of frequency on the real part of the dielectric constant for L5N2for five levels of volumetric moisture content (3 ns gating).
3
6
9
12
15
250 350 450 550 650
Frequency, MHz
Rea
l Par
t of D
iele
ctric
Con
stan
t
13.46% 10.36% 8.28% 2.07% 0%
Figure E.12. Effect of frequency on the loss part of the dielectric constant for L5N2for five levels of volumetric moisture content (3 ns gating).
0
3
6
9
250 350 450 550 650
Frequency, MHz
Loss
Par
t of D
iele
ctric
C
onst
ant
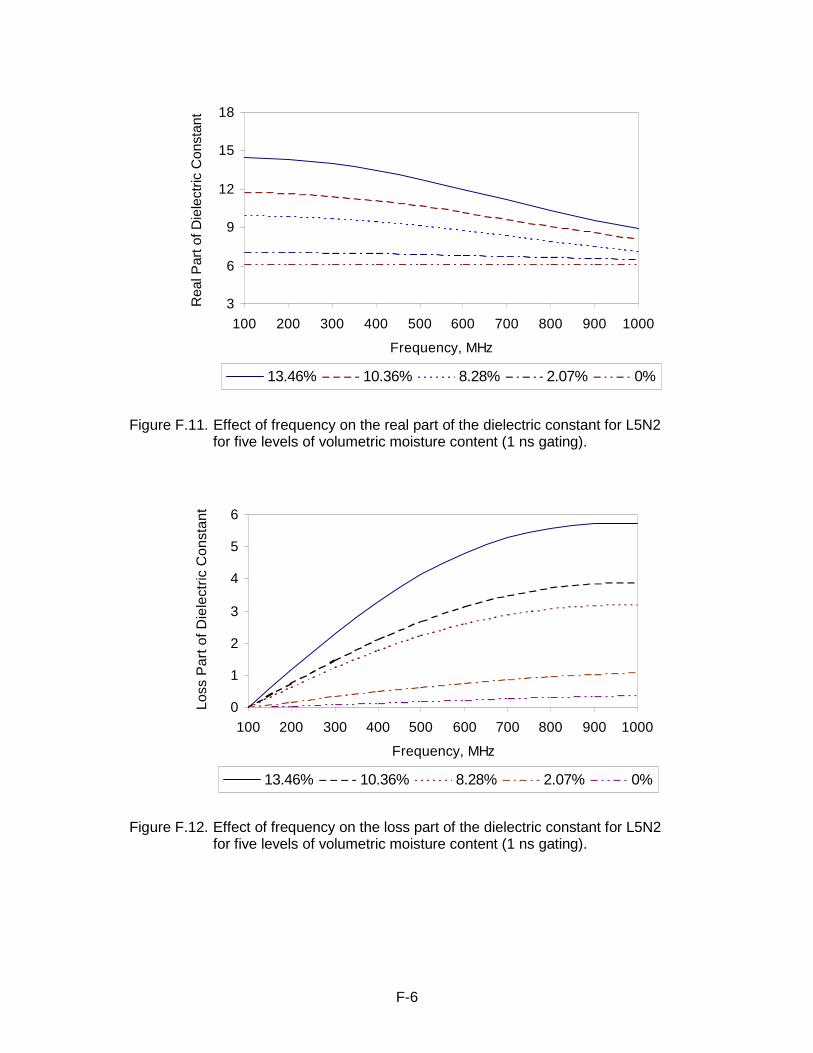
13.46% 10.36% 8.28% 2.07% 0%
E-7
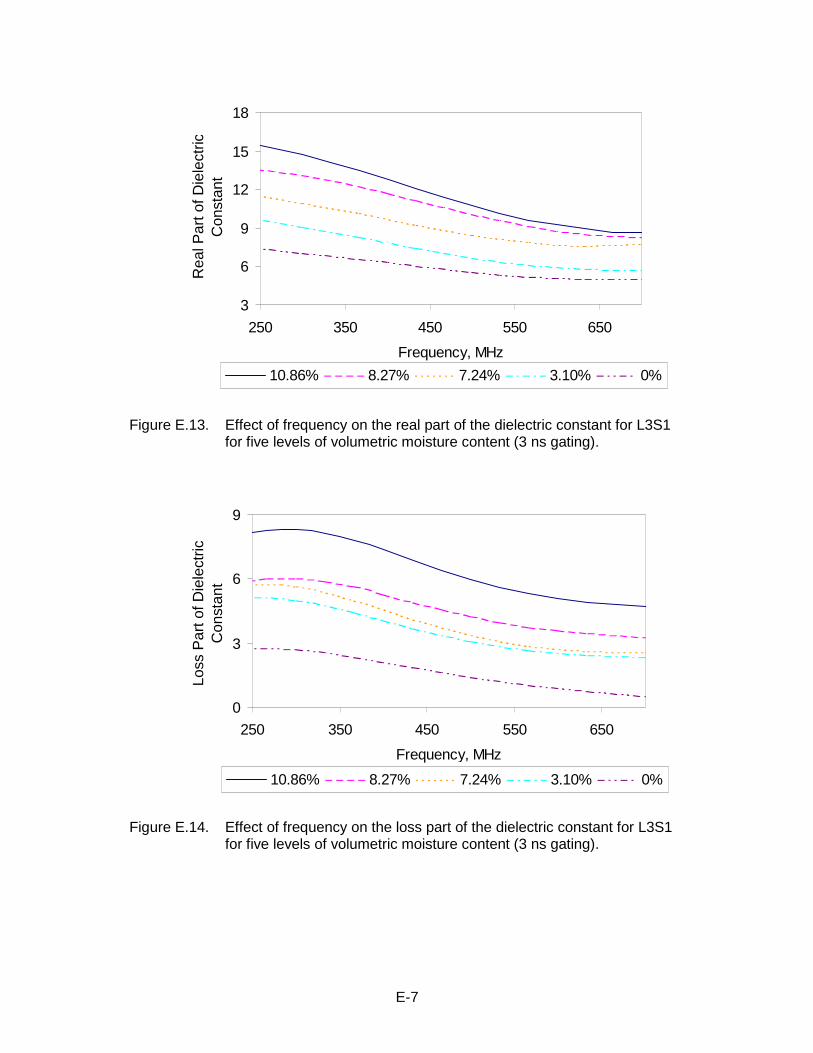
Figure E.13. Effect of frequency on the real part of the dielectric constant for L3S1for five levels of volumetric moisture content (3 ns gating).
3
6
9
12
15
18
250 350 450 550 650
Frequency, MHz
Rea
l Par
t of D
iele
ctric
Con
stan
t
10.86% 8.27% 7.24% 3.10% 0%
Figure E.14. Effect of frequency on the loss part of the dielectric constant for L3S1for five levels of volumetric moisture content (3 ns gating).
0
3
6
9
250 350 450 550 650
Frequency, MHz
Loss
Par
t of D
iele
ctric
Con
stan
t
10.86% 8.27% 7.24% 3.10% 0%
E-8
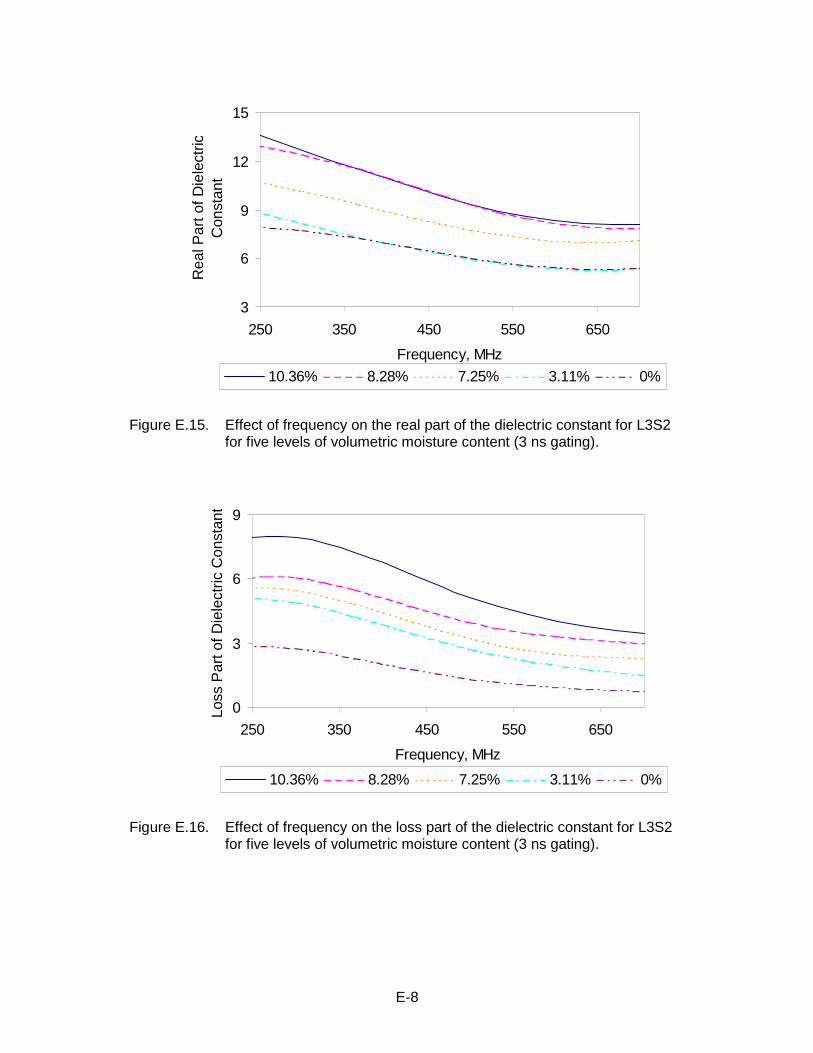
Figure E.15. Effect of frequency on the real part of the dielectric constant for L3S2for five levels of volumetric moisture content (3 ns gating).
3
6
9
12
15
250 350 450 550 650
Frequency, MHz
Rea
l Par
t of D
iele
ctric
Con
stan
t
10.36% 8.28% 7.25% 3.11% 0%
Figure E.16. Effect of frequency on the loss part of the dielectric constant for L3S2for five levels of volumetric moisture content (3 ns gating).
0
3
6
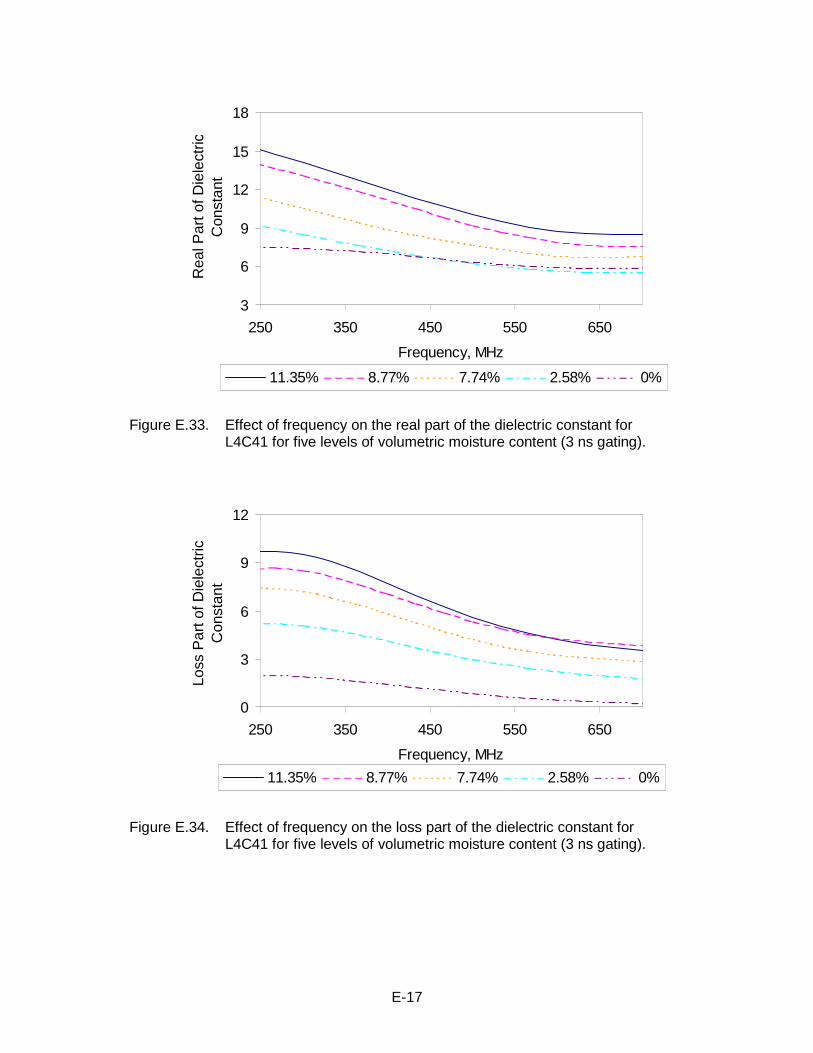
9
250 350 450 550 650
Frequency, MHz
Loss
Par
t of D
iele
ctric
Con
stan
t
10.36% 8.28% 7.25% 3.11% 0%
E-9
Figure E.17. Effect of frequency on the real part of the dielectric constant for L4S1for five levels of volumetric moisture content (3 ns gating).
3
6
9
12
15
250 350 450 550 650
Frequency, MHz
Rea
l Par
t of D
iele
ctric
Con
stan
t
10.86% 8.27% 7.24% 2.58% 0%
Figure E.18. Effect of frequency on the loss part of the dielectric constant for L4S1for five levels of volumetric moisture content (3 ns gating).
0
3
6
9
250 350 450 550 650
Frequency, MHz
Loss
Par
t of D
iele
ctric
Con
stan
t
10.86% 8.27% 7.24% 2.58% 0%
E-10
3
6
9
12
15
250 300 350 400 450 500 550 600 650 700
Frequency, MHz
Rea
l Par
t of D
iele
ctric
C
onst
ant
10.18% 8.48% 3.39% 0%
Figure E.19. Effect of frequency on the real part of the dielectric constant for L4S2for five levels of volumetric moisture content (3 ns gating).
0
3
6
9
250 300 350 400 450 500 550 600 650 700
Frequency, MHz
Loss
Par
t of D
iele
ctric
C
onst
ant
10.18% 8.48% 3.39% 0%
Figure E.20. Effect of frequency on the loss part of the dielectric constant for L4S2for five levels of volumetric moisture content (3 ns gating).
E-11
Figure E.21. Effect of frequency on the real part of the dielectric constant for L5S1for five levels of volumetric moisture content (3 ns gating).
3
6
9
12
15
250 350 450 550 650
Frequency, MHz
Rea
l Par
t of D
iele
ctric
Con
stan
t
13.96% 10.86% 9.30% 4.14% 0%
Figure E.22. Effect of frequency on the loss part of the dielectric constant for L5S1for five levels of volumetric moisture content (3 ns gating).
0
3
6
9
12
250 350 450 550 650
Frequency, MHz
Loss
Par
t of D
iele
ctric
Con
stan
t
13.96% 10.86% 9.30% 4.14% 0%
E-12
Figure E.23. Effect of frequency on the real part of the dielectric constant for L5S2for five levels of volumetric moisture content (3 ns gating).
3
6
9
12
15
250 350 450 550 650
Frequency, MHz
Rea
l Par
t of D
iele
ctric
Con
stan
t
13.98% 10.87% 9.32% 3.62% 0%
Figure E.24. Effect of frequency on the loss part of the dielectric constant for L5S2for five levels of volumetric moisture content (3 ns gating).
0
3
6
9
12
250 350 450 550 650
Frequency, MHz
Loss
Par
t of D
iele
ctric
C
onst
ant
13.98% 10.87% 9.32% 3.62% 0%
E-13
Figure E.25. Effect of frequency on the real part of the dielectric constant for L3H1for five levels of volumetric moisture content (3 ns gating).
3
6
9
12
15
250 350 450 550 650
Frequency, MHz
Rea
l Par
t of D
iele
ctric
Con
stan
t
11.39% 9.32% 7.77% 3.11% 0%
Figure E.26. Effect of frequency on the loss part of the dielectric constant for L3H1for five levels of volumetric moisture content (3 ns gating).
0
3
6
9
12
250 350 450 550 650
Frequency, MHz
Loss
Par
t of D
iele
ctric
C
onst
ant
11.39% 9.32% 7.77% 3.11% 0%
E-14
Figure E.27. Effect of frequency on the real part of the dielectric constant for L3H2for five levels of volumetric moisture content (3 ns gating).
3
6
9
12
15
250 350 450 550 650
Frequency, MHz
Rea
l Par
t of D
iele
ctric
Con
stan
t
11.39% 9.32% 8.28% 2.59% 0%
Figure E.28. Effect of frequency on the loss part of the dielectric constant for L3H2for five levels of volumetric moisture content (3 ns gating).
0
3
6
9
12
250 350 450 550 650
Frequency, MHz
Loss
Par
t of D
iele
ctric
C
onst
ant
11.39% 9.32% 8.28% 2.59% 0%
E-15
Figure E.29. Effect of frequency on the real part of the dielectric constant for L4H1for five levels of volumetric moisture content (3 ns gating).
3
6
9
12
15
250 350 450 550 650
Frequency, MHz
Rea
l Par
t of D
iele
ctric
Con
stan
t
11.37% 9.82% 7.75% 2.58% 0%
Figure E.30. Effect of frequency on the loss part of the dielectric constant for L4H1for five levels of volumetric moisture content (3 ns gating).
0
3
6
9
250 350 450 550 650
Frequency, MHz
Loss
Par
t of D
iele
ctric
Con
stan
t
11.37% 9.82% 7.75% 2.58% 0%
E-16
Figure E.31. Effect of frequency on the real part of the dielectric constant for L4H2for five levels of volumetric moisture content (3 ns gating).
3
6
9
12
15
250 350 450 550 650
Frequency, MHz
Rea
l Par
t of D
iele
ctric
Con
stan
t
11.39% 9.32% 7.77% 2.59% 0%
Figure E.32. Effect of frequency on the loss part of the dielectric constant for L4H2for five levels of volumetric moisture content (3 ns gating).
0
3
6
9
250 350 450 550 650
Frequency, MHz
Loss
Par
t of D
iele
ctric
Con
stan
t
11.39% 9.32% 7.77% 2.59% 0%
E-17
Figure E.33. Effect of frequency on the real part of the dielectric constant forL4C41 for five levels of volumetric moisture content (3 ns gating).
3
6
9
12
15
18
250 350 450 550 650
Frequency, MHz
Rea
l Par
t of D
iele
ctric
Con
stan
t
11.35% 8.77% 7.74% 2.58% 0%
Figure E.34. Effect of frequency on the loss part of the dielectric constant forL4C41 for five levels of volumetric moisture content (3 ns gating).
0
3
6
9
12
250 350 450 550 650
Frequency, MHz
Loss
Par
t of D
iele
ctric
Con
stan
t
11.35% 8.77% 7.74% 2.58% 0%
E-18
Figure E.35. Effect of frequency on the real part of the dielectric constant forL4C42 for five levels of volumetric moisture content (3 ns gating).
3
6
9
12
15
18
250 350 450 550 650
Frequency, MHz
Rea
l Par
t of D
iele
ctric
Con
stan
t
12.94% 10.36% 8.80% 3.62% 0%
Figure E.36. Effect of frequency on the loss part of the dielectric constant forL4C42 for five levels of volumetric moisture content (3 ns gating).
0
3
6
9
12
250 350 450 550 650
Frequency, MHz
Loss
Par
t of D
iele
ctric
C
onst
ant
12.94% 10.36% 8.80% 3.62% 0%
E-19
Figure E.37. Effect of frequency on the real part of the dielectric constant forL4C81 for five levels of volumetric moisture content (3 ns gating).
3
6
9
12
15
250 350 450 550 650
Frequency, MHz
Rea
l Par
t of D
iele
ctric
Con
stan
t
9.32% 8.28% 0% 0%
Figure E.38. Effect of frequency on the loss part of the dielectric constant forL4C81 for five levels of volumetric moisture content (3 ns gating).
0
3
6
9
12
250 350 450 550 650
Frequency, MHz
Loss
Par
t of D
iele
ctric
Con
stan
t
9.32% 8.28% 3.62% 0%
E-20
Figure E.39. Effect of frequency on the real part of the dielectric constant forL4C82 for five levels of volumetric moisture content (3 ns gating).
3
6
9
12
15
18
250 350 450 550 650
Frequency, MHz
Rea
l Par
t of D
iele
ctric
Con
stan
t
10.86% 9.30% 7.75% 3.10% 0%
Figure E.40. Effect of frequency on the loss part of the dielectric constant forL4C82 for five levels of volumetric moisture content (3 ns gating).
0
3
6
9
12
250 350 450 550 650
Frequency, MHz
Loss
Par
t of D
iele
ctric
Con
stan
t
10.86% 9.30% 7.75% 3.10% 0%
E-21
Figure E.41. Effect of frequency on the real part of the dielectric constant for L4M1for five levels of volumetric moisture content (3 ns gating).
3
6
9
12
15
18
250 350 450 550 650
Frequency, MHz
Rea
l Par
t of D
iele
ctric
Con
stan
t
12.92% 10.86% 9.82% 4.65% 0%
0
3
6
9
12
250 350 450 550 650
Frequency, MHz
Loss
Par
t of D
iele
ctric
Con
stan
t
12.92% 10.86% 9.82% 4.65% 0%
Figure E.41. Effect of frequency on the loss part of the dielectric constant for L4M1for five levels of volumetric moisture content (3 ns gating).
E-22
Figure E.43. Effect of frequency on the real part of the dielectric constant for L4M2for five levels of volumetric moisture content (3 ns gating).
3
6
9
12
15
250 350 450 550 650
Frequency, MHz
Rea
l Par
t of D
iele
ctric
Con
stan
t
12.92% 10.86% 9.30% 4.14% 0%
Figure E.44. Effect of frequency on the loss part of the dielectric constant for L4M2for five levels of volumetric moisture content (3 ns gating).
0
3
6
9
12
250 350 450 550 650
Frequency, MHz
Loss
Par
t of D
iele
ctric
Con
stan
t
12.92% 10.86% 9.30% 4.14% 0%
E-23
Figure E.45. Effect of frequency on the real part of the dielectric constant for L5M1for five levels of volumetric moisture content (3 ns gating).
3
6
9
12
15
250 350 450 550 650
Frequency, MHz
Rea
l Par
t of D
iele
ctric
Con
stan
t
13.98% 11.39% 10.36% 4.14% 0%
Figure E.46. Effect of frequency on the loss part of the dielectric constant for L5M1for five levels of volumetric moisture content (3 ns gating).
0
3
6
9
12
250 350 450 550 650
Frequency, MHz
Loss
Par
t of D
iele
ctric
C
onst
ant
13.98% 11.39% 10.36% 4.14% 0%
E-24
Figure E.47. Effect of frequency on the real part of the dielectric constant for L5M2for five levels of volumetric moisture content (3 ns gating).
3
6
9
12
15
250 350 450 550 650
Frequency, MHz
Rea
l Par
t of D
iele
ctric
Con
stan
t
13.44% 11.37% 9.82% 3.62% 0%
Figure E.48. Effect of frequency on the loss part of the dielectric constant for L5M2for five levels of volumetric moisture content (3 ns gating).
0
3
6
9
250 350 450 550 650
Frequency, MHz
Loss
Par
t of D
iele
ctric
C
onst
ant
13.44% 11.37% 9.82% 3.62% 0%
E-25
Figure E.49. Effect of frequency on the real part of the dielectric constant for G3N1for five levels of volumetric moisture content (3 ns gating).
0
3
6
9
12
15
250 350 450 550 650
Frequency, MHz
Rea
l Par
t of D
iele
ctric
Con
stan
t
10.36% 8.80% 7.25% 2.59% 0%
Figure E.50. Effect of frequency on the loss part of the dielectric constant forG3N1 for five levels of volumetric moisture content (3 ns gating).
0
3
6
9
250 350 450 550 650
Frequency, MHz
Loss
Par
t of D
iele
ctric
Con
stan
t
10.36% 8.80% 7.25% 2.59% 0%
E-26
Figure E.51. Effect of frequency on the real part of the dielectric constant for G3N2for five levels of volumetric moisture content (3 ns gating).
0
3
6
9
12
15
250 350 450 550 650
Frequency, MHz
Rea
l Par
t of D
iele
ctric
Con
stan
t
10.36% 8.80% 7.25% 2.59% 0%
Figure E.52. Effect of frequency on the loss part of the dielectric constant forG3N2 for five levels of volumetric moisture content (3 ns gating).
0
3
6
9
250 350 450 550 650
Frequency, MHz
Loss
Par
t of D
iele
ctric
Con
stan
t
10.36% 8.80% 7.25% 2.59% 0%
E-27
Figure E.53. Effect of frequency on the real part of the dielectric constant for G4N1for five levels of volumetric moisture content (3 ns gating).
0
3
6
9
12
15
250 350 450 550 650
Frequency, MHz
Rea
l Par
t of D
iele
ctric
Con
stan
t
10.87% 8.28% 7.25% 2.59% 0%
Figure E.54. Effect of frequency on the loss part of the dielectric constant forG4N1 for five levels of volumetric moisture content (3 ns gating).
0
3
6
9
250 350 450 550 650
Frequency, MHz
Loss
Par
t of D
iele
ctric
C
onst
ant
10.87% 8.28% 7.25% 2.59% 0%
E-28
Figure C.1 Effect ofFigure E.55. Effect of frequency on the real part of the dielectric constant for G4N2for five levels of volumetric moisture content (3 ns gating).
0
3
6
9
12
15
250 350 450 550 650
Frequency, MHz
Rea
l Par
t of D
iele
ctric
Con
stan
t
11.39% 8.80% 7.25% 3.11% 0%
Figure E.56. Effect of frequency on the loss part of the dielectric constant forG4N2 for five levels of volumetric moisture content (3 ns gating).
0
3
6
9
250 350 450 550 650
Frequency, MHz
Loss
Par
t of D
iele
ctric
C
onst
ant
11.39% 8.80% 7.25% 3.11% 0%
E-29
Figure E.57. Effect of frequency on the real part of the dielectric constant forG4C21 for five levels of volumetric moisture content (3 ns gating).
0
3
6
9
12
15
250 350 450 550 650
Frequency, MHz
Rea
l Par
t of D
iele
ctric
Con
stan
t
11.39% 9.32% 7.77% 2.59% 0%
Figure E.58. Effect of frequency on the loss part of the dielectric constant forG4C21 for five levels of volumetric moisture content (3 ns gating).
0
3
6
9
12
250 350 450 550 650
Frequency, MHz
Loss
Par
t of D
iele
ctric
C
onst
ant
11.39% 9.32% 7.77% 2.59% 0%
E-30
Figure E.59. Effect of frequency on the real part of the dielectric constant forG4C22 for five levels of volumetric moisture content (3 ns gating).
0
3
6
9
12
15
18
250 350 450 550 650
Frequency, MHz
Rea
l Par
t of D
iele
ctric
Con
stan
t
11.39% 8.80% 7.77% 2.59% 0%
Figure E.60. Effect of frequency on the loss part of the dielectric constant forG4C22 for five levels of volumetric moisture content (3 ns gating).
0
3
6
9
12
250 350 450 550 650
Frequency, MHz
Loss
Par
t of D
iele
ctric
Con
stan
t
11.39% 8.80% 7.77% 2.59% 0%
E-31
Figure E.61. Effect of frequency on the real part of the dielectric constant forG4C41 for five levels of volumetric moisture content (3 ns gating).
0
3
6
9
12
15
250 350 450 550 650
Frequency, MHz
Rea
l Par
t of D
iele
ctric
Con
stan
t
8.28% 6.73% 2.59% 0%
Figure E.62. Effect of frequency on the loss part of the dielectric constant forG4C41 for five levels of volumetric moisture content (3 ns gating).
0
3
6
9
250 350 450 550 650
Frequency, MHz
Loss
Par
t of D
iele
ctric
Con
stan
t
8.28% 6.73% 2.59% 0%
E-32
Figure E.63. Effect of frequency on the real part of the dielectric constant forG4C42 for five levels of volumetric moisture content (3 ns gating).
0
3
6
9
12
15
250 350 450 550 650
Frequency, MHz
Rea
l Par
t of D
iele
ctric
Con
stan
t
10.34% 8.27% 7.24% 2.58% 0%
Figure E.64. Effect of frequency on the loss part of the dielectric constant forG4C42 for five levels of volumetric moisture content (3 ns gating).
0
3
6
9
12
250 350 450 550 650
Frequency, MHz
Loss
Par
t of D
iele
ctric
Con
stan
t
10.34% 8.27% 7.24% 2.58% 0%
E-33
Figure E.65. Effect of frequency on the real part of the dielectric constant forG4M1 for five levels of volumetric moisture content (3 ns gating).
0
3
6
9
12
15
250 350 450 550 650
Frequency, MHz
Rea
l Par
t of D
iele
ctric
Con
stan
t
11.89% 10.34% 8.79% 3.10% 0%
Figure E.66. Effect of frequency on the loss part of the dielectric constant forG4M1 for five levels of volumetric moisture content (3 ns gating).
0
3
6
9
250 350 450 550 650
Frequency, MHz
Loss
Par
t of D
iele
ctric
C
onst
ant
11.89% 10.34% 8.79% 3.10% 0%
E-34
Figure E.67. Effect of frequency on the real part of the dielectric constant forG4M2 for five levels of volumetric moisture content (3 ns gating).
3
6
9
12
15
250 350 450 550 650
Frequency, MHz
Rea
l Par
t of D
iele
ctric
Con
stan
t
12.92% 10.86% 9.82% 3.62% 0%
Figure E.68. Effect of frequency on the loss part of the dielectric constant forG4M2 for five levels of volumetric moisture content (3 ns gating).
0
3
6
9
250 350 450 550 650
Frequency, MHz
Loss
Par
t of D
iele
ctric
Con
stan
t
12.92% 10.86% 9.82% 3.62% 0%
APPENDIX F
EFFECT OF FREQUENCY ON THE DIELECTRIC CONSTANT FOR
DIFFERENT LEVELS OF MOISTURE CONTENT (1 ns WINDOW)
F-1
Figure F.1. Effect of frequency on the real part of the dielectric constant for L3N1for five levels of volumetric moisture content (1 ns gating).
3
6
9
12
15
18
100 200 300 400 500 600 700 800 900 1000
Frequency, MHz
Rea
l Par
t of D
iele
ctric
Con
stan
t
11.39% 9.32% 7.77% 3.11% 0%
Figure F.2. Effect of frequency on the loss part of the dielectric constant for L3N1for five levels of volumetric moisture content (1 ns gating).