Effect of Akt (PKB) on the activity of mammalian target of rapamycin (mTOR) vorgelegt von Diplom-Ingenieurin Annett Hahn-Windgassen aus Chicago von der Fakultaet III -Prozesswissenschaften -Biotechnologie- der Technischen Universitaet Berlin zur Erlangung des akademischen Grades Doktor der Naturwissenschaften -Dr.rer.nat.- genehmigte Dissertation Promotionsausschuss: Vorsitzender: Prof. Dr. R. Lauster 1.Berichter: Prof. Dr. rer. nat. Dipl.-Ing. U. Stahl 2.Berichter: Prof. Dr. N. Hay Tag der wissenschaftlichen Aussprache: 18. November 2004 Berlin 2004 D83
Transcript
Effect of Akt (PKB) on the activity of mammalian target of rapamycin (mTOR)
vorgelegt von Diplom-Ingenieurin
Annett Hahn-Windgassen aus Chicago
von der Fakultaet III -Prozesswissenschaften
-Biotechnologie-
der Technischen Universitaet Berlin
zur Erlangung des akademischen Grades Doktor der Naturwissenschaften
-Dr.rer.nat.-
genehmigte Dissertation
Promotionsausschuss:
Vorsitzender: Prof. Dr. R. Lauster
1.Berichter: Prof. Dr. rer. nat. Dipl.-Ing. U. Stahl
2.Berichter: Prof. Dr. N. Hay
Tag der wissenschaftlichen Aussprache: 18. November 2004
Berlin 2004 D83
This thesis is dedicated to the loving memories
of my grandmother Elli Schumann �Oma Elli�
and Dirk�s mother Edith Windgassen.
Acknowledgments This thesis is dedicated to the loving memories of my grandmother Elli Schumann �Oma Elli� and Dirk�s mother Edith Windgassen. Both, very important women in our lives, died at young ages from breast cancer.
I am very grateful for the tremendous scientific direction and environment provided to me by my thesis advisor Prof. Dr. Nissim Hay. He allows all students to grow as scientists, and as people, in their own unique way. Working under his direction has been an honor and a privilege, one that I am very thankful for.
I would like to thank Prof. Dr Ulf Stahl, who supported my thesis in Germany at the University of Technology in Berlin. He is a very inspiring teacher and scientist in my first years of study in genetics and biology.
I am certainly appreciative of my fellow graduate students and colleagues for their support and friendship: from those who left: Nate and Kathrin, to those who are still there: Vero, Prashanth, Deepa, Chia-Chen, Joel, Jen, Pei Zhang, William, Xiao-ding, Yongmei and Ivana.
A special thanks to two of my colleagues who were with me for almost the entire journey, Veronique and Nate. Vero and Nate have been extraordinary labmates, always willing to go the extra mile to help.
A very special thanks to my family and friends for their support and encouragement over the last three years. Thanks to you, I am ending my graduation with my spirit intact.
At the heart of my support system were my parents Dieter and Renate Hahn, my loving son Sebastian, my sisters Kerstin and Ines, who lend me unending support in everything I do, whether they agree or not.
The greatest support and belief has been undoubtedly the love of my life, Dirk. His unconditionally support and belief in me lifted me from darkest times that inevitably present themselves along the road to the PhD (Dr.). �It doesn�t matter it�s dark out there if you are the light.�
A very special thanks to my beloved son Sebastian, who has taught me in our journey as mother and son to focus on the outcome not on the problem. I am certainly very proud of him and he is attending college specialized in Biology, Chemistry and Physics, sciences that we both love.
I
TABLE OF CONTENTS
TABLE OF CONTENTS ........................................................................................I
TABLE OF FIGURES ......................................................................................... IV
ABBREVIATIONS ............................................................................................... V
I. THEORETICAL- THE ROLE OF AKT (PKB) IN CELL GROWTH (SIZE) AND CELL PROLIFERATION..............................................................................1
2. Akt or protein kinase B (PKB) .................................................................2 2.1 Upstream of Akt ......................................................................................4
2.1.1 PI3-Kinase and PTEN.........................................................................4 2.1.2 PDK1, Akt activating kinase ................................................................6
4. Akt activity on mTOR controlled by growth factors............................10 4.1 TSC1-TSC2 tumor suppressor .............................................................10 4.2 Rheb, a small G protein, activates mTOR ............................................11 4.3 TOR- target of rapamycin .....................................................................12 4.4 Downstream targets of mTOR..............................................................14
5. Control of mTOR by nutrients and energy metabolism..........................15 5.1 Protein-protein interaction with mTOR senses nutrient availability? .....15 5.2 Energy sensor mTOR, regulation through AMPK? ...............................16 5.3 LKB1 potentiates the effect on AMPK...................................................17 5.4 Amino acid sensor mTOR, AMPK-sensing mechanism?......................18
3. Materials and Methods ..............................................................................25 3.1 Materials...............................................................................................25
Chemicals....................................................................................................25 3.1.2 Enzymes and kits..............................................................................27
II
3.1.3 Equipment.........................................................................................27 3.1.4 Plasmids and constructs ...................................................................28 3.1.5 Enzymes and Antibodies...................................................................29 3.1.6 Bacteria and Cell lines ......................................................................30 3.1.7 Media, agarose plates, antibotica and materials ...............................31 3.1.8 Buffers and solutions.........................................................................32
3.2 Cell culture methods.............................................................................33 3.2.1 Culture conditions, stimulations and Inhibitions ................................33 3.2.2 Maintenance of cell lines...................................................................34 3.2.3 Storage of cells .................................................................................34
3.3 Mouse embryo fibroblast (MEF) isolation .............................................35 3.4 Transfection of adherent mammalian cells for recombinant expression 36
3.5 Retrovirus production and infection ......................................................38 3.6 Modification and amplification of DNA ..................................................38
3.6.1 Methods of in vitro modification of DNA ............................................38 3.6.2 Preparation of vector-DNA................................................................39 3.6.3 Gel electrophoresis ...........................................................................40 3.6.4 Isolation of restriction fragments from gel slices ...............................40 3.6.5 Phenol extraction and ethanol precipitation of DNA..........................40 3.6.6 Quantiative determination of DNA concentration ..............................41 3.6.7 Production of competent bacteria cells for transformation ................41 3.6.8 Transformation of vector or plasmid DNA in competent bacteria ......42 3.6.9 Mini-preparation ................................................................................42 3.6.10 Maxi-preparation...........................................................................43
3.7 Protein Methods ...................................................................................44 3.7.1 Whole-Cell Lysate Preparation .........................................................44 3.7.2 Quantification of proteins ..................................................................45 3.7.3 SDS-PAGE .......................................................................................45 3.7.4 Protein transfer .................................................................................47 3.7.5 Immunoblotting and Development ....................................................48 3.7.6 Immunoprecipitation..........................................................................49
4. Results........................................................................................................52 4.1 Cellular atrophy of skeletal muscle and impaired mTOR activity in Akt1/Akt2 DKO cells ........................................................................................52
4.1.1 Cellular atrophy of skeletal muscle in Akt1/Akt2 DKO cells ...........52 4.1.2 Status of mTOR-activity in AKT1/AKT2 DKO cells............................52 4.1.3 Status of TSC2 phosphorylation by Akt in Akt1/Akt2 DKO MEFs .....56
4.2 Akt maintains the intracellular level of ATP and regulates AMPK activity 59
4.2.1 Akt deficiency significantly reduce intracellular ATP level and increases AMP/ATP ratio.............................................................................59 4.2.2 Akt deficiency markedly increases AMPK activity .............................62 4.2.3 Expression of activated Akt increases intracellular ATP level, reduces AMP/ATP ratio and affects AMPK activity....................................................63
III
4.3 ATP depletion and activation of AMPK attenuates Akts ability to activate mTOR 66
4.3.1 ATP depletion in Rat1a cells expressing activated Akt .....................66 4.3.2 ATP depletion of insulin-stimulated Rat1a cells ................................68 4.3.3 Activation of AMPK by AICAR in Rat1a cells expressing activated Akt 69 4.3.4 Co-expression experiment with constitutively activated AMPK and 4EBP1 .........................................................................................................71
4.4 Reduced AMPK activity by over expression of dominant negative AMPK restores mTOR activity in Akt1/Akt2 DKO MEFs.............................................72
4.4.1 Stable Akt1/Akt2 DKO MEF cell line expressing dominant negative AMPK restores mTOR activity .....................................................................72 4.4.2 Increasing expression of dominant negative AMPK in Akt1/Akt2 DKO MEFs restores mTOR activity......................................................................75
4.5 Akt�s ability to activate mTOR by inhibiting AMPK is dependent on TSC2 76
4.5.1 TSC2 deficiency renders cells almost resistant to ATP depletion .....76 4.5.2 TSC2 KO cells exert a high AMP/ATP ratio and the expression of activated Akt is able to decrease this ratio...................................................79 4.5.3 Inhibition of AMPK by Akt despite TSC2 phosphorylation is also required for mTOR activiy............................................................................81
5. Discussion..................................................................................................85 5.1 Akt can determine the cell mass and is required for mTOR activity......85 5.2 Akt is a key regulator for energy metabolism and regulates indirectly AMPK activity ..................................................................................................86 5.3 Akt-mediated phosphorylation of TSC2 is not sufficient to fully activate mTOR 89 5.4 New mechanism by which growth factors activate mTOR....................91 5.5 Concluding Remarks ............................................................................92
III. REFERENCES.........................................................................................98
IV
TABLE OF FIGURES Figure 1: Structure of serine/threonine kinase Akt (PKB). ..............................3 Figure 2: Activation of the serine/threonin kinase Akt (PKB). ........................5 Figure 3: Structure of mammalian target of rapamycin (mTOR)...................13 Figure 4: Scheme of the Akt-TSC2-mTOR pathway summarizing current literature. ...........................................................................................................19 Figure 5: Hypothetical scheme for the regulation of the AKT-TSC2-mTOR pathway. ............................................................................................................23 Figure 6: Skeletal muscle atrophy in Akt1/Akt2 DKO mice. ..........................53 Figure 7: mTOR activity in WT and Akt1/Akt2 DKO MEFs.............................55 Figure 8: TSC2 phosphorylation in WT and Akt1/Akt2 DKO cells, immunoblotting.................................................................................................57 Figure 9: TSC2 phosphorylation in WT and Akt1/Akt2 DKO cells, immunoprecipitation. .......................................................................................57 Figure 10: ATP level is reduced in Akt1/Akt2 DKO cells vs. WT...................59 Figure 11: ATP level in cells expressing activated Akt vs. control cells. ....60 Figure 12: AMP/ATP ratio in Akt1/Akt2 DKO cells vs. WT.............................61 Figure 13: AMPK activity in Akt1/Akt2 DKO cells vs. WT..............................63 Figure 14: AMP/ATP ratio in cells expressing activated Akt vs. control cells.............................................................................................................................64 Figure 15: AMPK activity in cells expressing activated Akt vs. control cells and correlation with mTOR activity.................................................................65 Figure 16: ATP depletion attenuates the ability of activated Akt to activate mTOR. ................................................................................................................67 Figure 17: ATP depletion of insulin-stimulated Rat1a cells, and its inhibition of the growth-factors-dependent activation of mTOR. ..................................68 Figure 18: Dose-dependent activation of AMPK by AICAR...........................70 Figure 19: Co-expression of activated AMPK and 4EBP1 in HEK293 and HEK293MAkt cells.............................................................................................72 Figure 20: Expression of dominant-negative AMPK in Akt1/Akt2 DKO cells vs. WT. ...............................................................................................................74 Figure 21: Dose-dependent co-expression of dominant-negative AMPK and 4EBP1 in Akt1/Akt2 DKO MEFs. ......................................................................76 Figure 22: mTOR activity in TSC2-/- vs. control cells following ATP depletion ...........................................................................................................78 Figure 23: AMP/ATP ratio in TSC2-/-, mAkt-TSC2-/- and TSC2-/+ cells. .......79 Figure 24: Akt and AMPK activity in TSC2-/-, mAkt-TSC2-/- and TSC2-/+ cells....................................................................................................................80 Figure 25: Expression of Akt-phosphomimetic mutant of TSC2 in TSC2-/- cells....................................................................................................................82 Figure 26: Expression of Akt-phosphomimetic mutant of TSC2 in TSC2-/- cells sensitizes mTOR activity to ATP depletion, which is restored by activated Akt......................................................................................................83 Figure 27: Proposed model for the regulation of mTOR activity by Akt. .....91
V
ABBREVIATIONS A260 absorbance at 260 nm Aa amino acids Ampr ampicillin resistance AMP adenosine 5� monophosphate ADP adenosine 5� diphosphate ATP adenosine 5� triphosphate AICAR 5-aminoimidazole-4-carboxamide-riboside bp base pairs BSA bovine serum albumin cDNA complementary deoxyribonucleic acid d day Da Dalton GTP guanosine triphosphate DNA deoxyribonucleic acid DNAse deoxyribonuclease DTT dithiothreitol EB ethidium bromide EDTA ethylene diaminetetraacetic acid EtOH ethanol g gram g gravity h hour HEPES N-2-hydroxyethylpiperazine-N�-2-ethansulfonic acid kb kilo base pairs M molar mcs multiple cloning site min minute MOPS 3-(N-morpholino) propane sulfonic acid MRNA messenger ribonucleic acid MW molecular weight NADH nicotinamide adenine dinucleotide (reduced form) nt nucleotides OD260 optical density at 260 nm oligo oligonucleotide ORF open reading frame PAA polyacrylamide
VI
PAGE polyacrylamide gel electrophoresis PCR polymerase chain reaction PEG polyethylene glycol RNA ribonucleic acid RNase ribonuclease rpm rounds per minute rRNA ribosomal ribonucleic acid RT room temperature RT-PCR reverse transcriptase PCR s second SD standard deviation SDS sodium dodecyl sulfate ss single stranded TEMED N, N, N�, N�-tetramethyl-ethylenediamine Tris trihydroxymethylaminomethane tRNA transfer ribonucleic acid U unit UV ultraviolet light V volt WT wild type PREFIXES FOR MULTIPLES AND SUBMULTIPLES G giga 109 M mega 106 k kilo 103 c centi 10-2 m milli 10-3 µ micro 10-6 n nano 10-9
1
I. THEORETICAL- The role of Akt (PKB) in cell growth (size) and cell proliferation
1. Introduction
Why are mice smaller than men? Why are pea pods smaller than pumpkins?
What controls the progression of growth, and when the proper size is attained,
what tells organs and organisms to stop growing? These are fundamental
questions of cell biology. The first evidence that animals can monitor dimension
came from haploids and polyploids in amphibian.
Cell size of a given cell type is usually proportional to ploidy in
amphibians. It was shown that haploid cells are about half the volume of diploids
cells, diploids cells are about half the volume of tetraploid cells and so on (Day
and Lawrence 2000). For example in plants and flies, endoreduplicating nuclei
can contain over a thousand copies of their chromosomes, and these cells have
a corresponding enlargement in total cell size. However, different cell types
within a multicellular organism often vary in size, despite containing identical
genomes of the same ploidy. The ratio of DNA:cytoplasm indicates that the
amount of DNA is not necessary determining the cell size (Saucedo and Edgar
2002).
Another way to look at the restriction on cell size is the ratio of cell volume
to surface area. Volume expands more quickly than surface area, and as a
consequence cell membrane associated reactions, such as import and export,
may set constraints on cell size (Saucedo and Edgar 2002).
Insulin signaling was first observed to affect organism size in mammals in
the early 1990s (Efstratiadis 1998). Shioi et al. have demonstrated that either an
increase or decrease in PI3K (phophatidylinositol-3-kinase) activity, which
activates serine/threonine protein kinase Akt (PKB), led to a larger or smaller
organ size by directing expression specifically to the heart (Shioi et al. 2002).
Strong loss-of-function mutations in the insulin receptor gene are lethal, but flies
with some loss of function survive and show a growth pattern similar to that
induced by starvation: delayed development, smaller overall size and a reduction
in both cell number and cell size (Chen et al. 1996).
2
The maintenance of cell size requires homeostasis between
macromolecule synthesis and degradation and, in multicellulare systems, is
intimately linked to nutrient and growth factor availability. As environmental
conditions change, cells can reduce and restore their size. When nutrients and
growth factors are saturated, however, there appears to be a limit to the
maximum size a given cell type can reach (Saucedo and Edgar 2002).
2. Akt or protein kinase B (PKB)
In 1991 three research groups discovered the cDNA of Akt (PKB), a novel
serine/threonin kinase. Two research groups identified it by homology cloning,
searching for novel members of protein kinase A (PKA) and protein kinase
(PKC). It was termed by one group RAC-PK (Related to A and C-Protein Kinase)
(Coffer and Woodgett 1991; Jones et al. 1991).
At the same time, another research group identified it as the cellular
homologue of the murine oncogene v-akt, from a transforming retrovirus (AKT8)
in spontaneous thymoma of the AKR mouse and therefore, it was termed c-Akt
(Bellacosa et al. 1991). PKBβ and PKBγ or Akt2 and Akt3, two additional PKB or
Akt isoforms have been identified as well (Cheng et al. 1992; Brodbeck et al.
1999).
Akt (PKB) kinases are evolutionarily conserved in eukaryotes ranging from
C.elegans to human. The amino acid identity between mouse, rat and human is
more than 95%, whereas between C.elegans and human, it is only 60% (Hanada
et al. 2004).
Three isoforms of Akt encoded by three separate genes have been found
in mammalian cells. Akt1 is ubiquitously expressed in mammalian cells and
tissues. Akt2 is expressed at lower level than Akt1, except in insulin-responsive
tissues: skeletal muscle, heart, liver and kidney (Altomare et al. 1995; Altomare
et al. 1998). Akt 3 is expressed at the lowest level in most tissues, except for
testes and brain (Brodbeck et al. 1999). Akt1 is the predominant isoform in most
tissues and mouse embryo fibroblasts (Chen et al. 2001).
The expression pattern of three isoforms may not always reflect their
activities. Different levels of kinase activities of the different Akt isoforms have
been observed in certain tissues and during differentiation, which is not
3
necessarily correlated with their level of expression (Walker et al. 1998; Fujio et
al. 1999).
Figure 1: Structure of serine/threonine kinase Akt (PKB). Scheme demonstrates the structure of Akt, with PH-domain, catalytic-domain and regulatory domain.
The amino acid identity between Akt1, Akt2 and Akt3 isoforms is >80%.
All three Akt-isoforms share a similar protein structure that contains a pleckstrin
homology (PH) domain that binds phospholipids (Figure 1), a short glycine-rich
region that bridges to the catalytic domain, and the regulatory domain (Walker et
al. 1998).
The catalytic domain of all Akt isoforms share similarity with a group of kinases
from the AGC family [cAMP-dependent protein kinase (PKA)/protein kinase
G/protein kinase C (PKC)]. The AGC family consists of more than 80 kinases,
most of them are protein kinases and are regulated by second messenger, for
example CA2+, cyclic mononucleotides and phosphoinositides. The carboxyl-
terminal regulatory domain that contains the hydrophobic motif is characteristic
for AGC-kinases (Hanada et al. 2004).
The PH domain interacts with membrane lipid products, such as phophati-
dylinositol-(3,4,5)triphosphat (PIP3/ PtdIns (3,4,5), Figure 1) produced by PI-3-
kinase (phophatidylinositol-3-kinase). Biochemical analysis revealed that the PH
4
domain of Akt binds to both PtdIns (3,4,5) P3 [PIP3] and PtdIns (3,4) P2 [PIP2]
with similar affinity (James et al. 1996; Frech et al. 1997). The kinase
domain/catalytic domain is located in the central region of the molecule and
shares a high similarity with other AGC-kinases such as PKA, PKC, p70S6K and
p90RSK (Peterson and Schreiber 1999).
All three Akt-isoforms have a carboxyl terminal extension of around 40 Aa,
this region possesses the F-X-XF/Y-S/T-YF hydrophobic motif (where X is any
amino acid), and is characteristic for AGC-family kinases (Peterson and
Schreiber 1999). The phosphorylation on the Serine or Threonine residue with in
this hydrophobic motif is necessary for full activation of all AGC-family kinases.
Akt�s motif is F-P-Q-F-S-Y, point mutation of this motif completely abolished
enzymatic activity (Andjelkovic et al. 1997).
All three Akt-isoforms have a conserved threonine and serine residue
(Threonine 308 and Serine 473, in Akt1) and the phosphorylation of those sites is
critical for full activation of Akt. Those serine and threonine residues are also
present in p70S6K and all PKC isoforms in a similar Aa context. The distance
between the two phosphorylation sites/residues is around 160-170 Aa and is also
conserved in AGC-Kinases (Kandel and Hay 1999).
2.1 Upstream of Akt The activation of Akt has been shown to be a multi- step process and several
proteins responsible for each step were identified. The first rate-limiting step for
Akt activation is the binding of PIP3 (phophatidylinositol-(3,4,5)triphosphate) or
PtdIns (3,4,5) P3) to the pleckstrin homology (PH) domain of Akt and the
translocation of Akt to the plasma membrane (Brazil et al. 2002) (Hanada et al.
2004) (Kandel and Hay 1999).
2.1.1 PI3-Kinase and PTEN Akt activity is dependent on PI3-kinase, this finding was the most significant
finding in regards to Akt regulation (Figure 2). Activation of receptor tyrosine
kinases through a number of stimuli activates Akt. Stimuli, by which Akt is
activated, are platelet derived growth factor (PDGF-R), insulin, epidermal growth
factor (EGF), basic fibroblast growth factor (bFGF) and insulin like growth factor
5
(IGF-1) (Burgering and Coffer 1995; Cross et al. 1995; Franke et al. 1995; Kohn
et al. 1995). PI3-kinase is activated by growth factor receptors through binding of
growth factor, its regulatory subunit p85 is activated by phosphotyrosin residue in
the receptor.
Figure 2: Activation of the serine/threonin kinase Akt (PKB). Scheme demonstrates the activation of Akt following the activation of growth factors (GFR).
This event leads to the activation of the catalytic subunit p110 of PI3-
kinase, which in turn phosphorylates phosphoinositides (PI) at the 3-position of
the inositolring to generate PIP2 (phophatidylinositol-(3,4)diphosphat) and PIP3
(phophatidylinositol-(3,4,5)triphosphat) (Vanhaesebroeck and Waterfield 1999) .
Ly94002 and wortmannin, two PI3-kinase inhibitors or dominant negative p110 of
the catalytic subunit of PI3-kinase, reduce the level of PIP3 that is responsible for
Akt activation (Chan et al. 1999).
The tumor suppressor protein PTEN (phosphatase and tensin homologue
deleted on chromosome10) reversed the production of phosphoinositides by PI3-
kinase. Pten phosphoinositde phosphatase activity leads to inactivation of Akt by
converting PIP3 to PIP2 (Maehama and Dixon 1998; Stambolic et al. 1998).
Studies using Pten-deficient cells, in which the PI3-kinase pathway is activated
owing to the up regulation of PIP3, indicated a constitutively activated
mammalian target of rapamycin (mTOR) (Podsypanina et al. 2001).
6
2.1.2 PDK1, Akt activating kinase
PDK1 (3-phosphoinositide-dependent kinase1), a AGC kinase member, was
purified and identified as a kinase, which phophorylates Akt on Threonine 308
(Stephens et al. 1998) The structure of PDK1 is very similar to other AGC-
kinases, especially its pleckstrin homology (PH) domain. For both Akt and PDK1
the translocation process to the plasma membrane is required for full activation
(Andjelkovic et al. 1997; Anderson et al. 1998).
Phosphorylation sites on Akt were identified by using phospho mapping of
quiescent cells and IGF-I stimulated cells. Stimulated cells are phosphorylated on
Threonine 308 and Serine 473 and can be blocked completely by the PI3-kinase
inhibitor wortmannin (Alessi et al. 1996). The kinase responsible for the
phosphorylation on Serine 473 has not been identified and is still controversial.
Phosphorylation on Serine 473 is dependent on PI3-kinase activity, as well as
phosphorylation on Threonine 308, it would be logical that PDK1 also
phosphorylated Threonine 473, however, this result was disapproved by using
PDK1 knock out ES (embryonic stem) cells. It was shown that Serine 473 was
phosphorylated similar to the wild type cells, whereas Threonine 308
phosphorylation was completely abolished in response to IGF-I stimulation
(Williams et al. 2000).
3. Physiological roles of Akt (PKB)
Akt, the serine/threonine kinase, plays an important role in executing multiple
cellular metabolic pathways, such as cell metabolism, cell survival and cell
proliferation.
3.1 Metabolism
GSK3β, the first physiological protein substrate identified for Akt, phosphorylates
and inactivates glycogen synthases in response to insulin stimulation. Both
isoforms GSK3α and GSK3β have the phosphorylation site Serine 9 and Serine
7
21 in the amino-terminal region and they are directly phosphorylated and
inactivated by Akt (Burgering and Coffer 1995).
Akt phosphorylates and induces the activity of the heart 6-phosphofructo-
2-kinase (PFK-2), which in turn stimulates glycolysis. The identified
phosphorylation site is serine 466 (Deprez et al. 1997). Phophodiester 3B
(PDE3E) is phosphorylated by Akt on Serine 273, which in turn regulates the
intracellular level of cAMP and cGMP in response to insulin (Kitamura et al.
1999).
Akt can also phosphorylate protein tyrosine phosphatases (PTP1B) on
Serine 50 to inhibit its phosphatase activity towards the insulin receptor. PTP1B
negatively regulates insulin sensitivity by dephosphorylating the insulin receptor.
This acts as a feedback loop in response to insulin (Ravichandran et al. 2001).
Akt can regulate several levels of glucose metabolism. It enhances glucose
uptake in insulin-responsive tissue by affecting the glucose transporter GLUT1,
GLUT3 and GLUT4. Akt was shown to increase the expression of the glucose
transporter (Barthel et al. 1999); (Mazure et al. 1997) and the translocation of
GLUT4 to the plasma membrane (Kohn et al. 1996; Cong et al. 1997; Tanti et al.
1997).
Akt phosphorylates TSC2 (tuberous sclerosis complex2) on four residues,
inactivates it and thereby activates mTOR (Inoki et al. 2002; Manning et al. 2002;
Potter et al. 2002). mTOR (mammalian target of rapamycin) activity appears to
be dependent on intracellular ATP level (Dennis et al. 2001) and it was shown
that ATP depletion activates AMP-activated protein kinase (AMPK), which in turn
phosphorylates and activates TSC2 leading to the inhibition of mTOR activity
(Inoki et al. 2003b). Akt is required for the phosphorylation of 4EBP1 (4E binding
protein1) by mTOR (Gingras et al. 1998).
Rapamycin, an inhibitor of TOR/mTOR, down-regulates cap-dependent
translation initiation. TOR/mTOR control protein synthesis by activating the
The rate-limiting step in mammalian translation initiation is the binding of
the ribosome to mRNA. Almost all of the factors that are involved in the recruiting
ribosome to the mRNA have phosphorylation states that are directly proportional
to the translation and growth rate of the cell. 4EBP, the inhibitory protein of
8
eIF4E, is similarly phosphorylated under the same circumstances. The mTOR
pathway is mediating the phosphorylation of almost all of these factors, except
eIF4E (Gingras et al. 2001). mTOR activity is often measured by using the
phosphorylation status of 4EBP1 and S6K.
3.2 Apoptosis
One of Akt�s major functions is to promote growth factor�mediated cell survival
and to block programmed cell death or apoptosis. Ectopically expression of a
constitutive active form of Akt has been shown to promote cell survival in the
absence of IGF-1 or serum (Kennedy et al. 1999). Mice lacking the Akt1 gene,
have provided genetic evidence, that Akt is required for cell survival
(Chen et al., 2001) Akt was shown to preserve mitochondrial integrity, and
thereby to inhibit apoptosis. It requires glucose availability and is coupled to its
metabolism. Hexokinase is known to bind VDAC (voltage dependent anion
channel) and directly couple intra-mitochondrial ATP synthesis to glucose
metabolism. Akt serves as downstream effector, which increases mitochondrial-
associated hexokinase activity. The ability of Akt to maintain the mitochondrial
integrity is dependent on glucose availability and through increased mitochondria
hexokinase (mtHK) activity (Gottlob et al. 2001).
Growth factor withdrawal induced proteolytic cleavage of proapoptotic
BCL-2 family member BID to yield its active truncated form tBID. Activated Akt
inhibited mitochondrial cytochrom c release and apoptosis following BID
cleavage. Akt also antagonized tBID mediated BAX activation and mitochondrial
BAK oligomerisation. Both events have been shown to be critical for tBid-induced
apoptosis. Glucose deprivation, which in turn impaires the ability of Akt to
maintain mitochondrial-hexokinase association, prevents Akt from inhibiting BID
mediated apoptosis (Majewski et al. 2004).
Bad is a member of the BCL-2 protein family, that binds to BCL-2 and
BCL-X and inhibits their anti-apoptotic potential (Downward 1999). Akt can
directly phosphorylate Bad on Serine 136 in vivo and in vitro (Datta et al. 1997;
del Peso et al. 1997). Once phosphorylated, Bad is released from the BCL-
2/BCL-X complex, which is localized on the mitochondrial membrane.
9
Phosphorylated Bad instead forms a complex with the chaperone 14-3-3 and
remains cytosolic (del Peso et al. 1997).
Caspase 9 can initiate the apoptotic cascade; Akt can phosphorylate pro-
caspase 9 on Serine 196 in a Ras-dependent manner that inhibits cytochrom c-
induced cleavage of pro-caspase 9, which is required for enzymatic activity
(Cardone et al. 1998). However, the Akt phosphorylation motif has not been
found in caspase 9 from lower species, such as mouse or rat (Cardone et al.
1998).
3.3 Proliferation
P21/cip1/waf1 is a major cyclin/CDK inhibitor and was reported to be directly
phosphorylated by Akt. Phosphorylation of p21 on Threonine 145 by Akt results
in the inhibition of its potential to arrest the cell cycle. Inhibition and antagonizing
of p21 by Akt targets nuclear localization of p21 and leads to activation of
cyclin/CDK required for HER-2/neu-dependent tumor growth (Zhou et al. 2001).
P27/kip1 is also regulated by Akt-dependent phosphorylation on
Threonine 157 in breast cancer cells. This activation by phosphorylation causes
its nuclear localization signal (NLS), which excludes p27 from the nucleus and
results in the activation of cyclin/CDK and cell cycle progression (Liang et al.
2002; Shin et al. 2002; Viglietto et al. 2002). It�s a similar mechanism as
described above for p21/cip1/waf1.
Akt can also regulate the expression level of p27 through mTOR. Down
regulation of p27 in Akt-mTOR dependent manner was supported by the
observation that Pten (Antagonist of Akt activity), which deactivates Akt, elicits
growth arrest through elevation of the p27 protein level (Li and Sun 1998).
The tumor suppressor p53 is the best studied regulator of cell cycle
progression and apoptosis in response to genotoxic stress (Vousden and Lu
2002). MDM2 (murin double minute2) is a ubiquitin E3 ligase that directly binds
to p53 and targets p53 for ubiquitination. It was shown that Akt phosphorylates
MDM2 and contributes to MDM2 nuclear localization (Mayo and Donner 2001).
The precise effect of MDM2 is still controversial.
10
Akt is also required for the activation of mammalian target of rapamycin
(mTOR), a large evolutionary conserved protein of about 300kD, a multifunctional
kinase, that mediates protein synthesis (Gingras et al., 1998).
The loss of Akt or PI3K function results in impaired growth and smaller
cells (Stocker et al., 2002; Weinkove et al., 1999), whereas the loss of PTEN
function in Drosophila leads to an increased growth and larger cells.
(Goberdhan et al., 1999; Huang et al., 1999).
4. Akt activity on mTOR controlled by growth factors 4.1 TSC1-TSC2 tumor suppressor
TSC1 and TSC2 proteins encoded by tuberous sclerosis complex 1 (TSC1) and
tuberous sclerosis complex 2 (TSC2) genes are upstream of mTOR (Hay and
Sonenberg 2004). These two tumor suppressor genes TSC1 (also known as
harmatin) and TSC2 (also known as tuberin) encoded by two genes were
associated with the autosomal dominant harmatoma syndrome (Cheadle et al.
2000a). Mutations in TSC1 and TSC2 genes contribute to sporadic TSC (van
Slegtenhorst et al. 1997), and tuberous sclerosis patients have hamartomas in
brain, skin, kidney and heart (Roach et al. 1998). Studies in mammalian cells
have implicated these tumor suppressors TSC1 and TSC2 in cellular functions
including cell cycle, endocytosis, cell adhesion and transcription (Pan et al.
2004).
Sequence-analysis revealed that rat TSC2 contains eight potential Akt
consensus phosphorylation sites. For experiments, the group of Inoki et al
obtained a rat cDNA, which contained only six putative Akt consensus
phosphorylation sites because of an internal deletion (Inoki et al. 2002). Several
groups have demonstrated that Akt directly targets TSC2 by direct
phosphorylation in vitro and in vivo. Identified sites are Serine 939, Serine
1086/1088 and Threonine 1462/1422rat-short cDNA (Tee et al. 2002, Inoki et al.
2002)). Many reports have demonstrated that TSC1-TSC2 act to antagonize the
insulin-signaling pathway through inhibition of S6K, which is downstream of
mTOR (McManus and Alessi 2002).
11
Consistent findings of all studies in mammalian cells are that TSC1 and
TSC2 form a complex (van Slegtenhorst et al. 1997; Nellist et al. 2002). The
consequences of Akt-mediated TSC2 phosphorylation are not clear, there are
reports supporting the model that Akt phosphorylation of TSC2 disrupts the
TSC1-TSC2-complex (Dan et al. 2002; Potter et al. 2002) and mediates TSC2
degradation by ubiquitination (Inoki et al. 2002). Other reports indicate that Akt
phosphorylation does not affect the complex between TSC1 and TSC2 (Manning
et al. 2002).
Akt activity mediated by insulin and growth factors is significantly
diminished in cells lacking TSC1 (Kwiatkowski et al. 2002) or TSC2 (Jaeschke et
al. 2002), although Akt protein is expressed to the same extend compared to
wildtype cells. The exact mechanism, how this intriguing phenomenon of a
negative regulatory loop is occurring, is still unknown. One study suggested it is
due to a reduced expression of PDGF alpha and PDGF beta (Zhang et al.
2003a).
Mammalian target of rapamycin (mTOR) is required for the regulation of a
number of components of the translational machinery; the translational repressor
4E-BP1 (eukaryotic initiation factor 4E-binding protein1) and p70S6K (p70
ribosomal protein S6 Kinase), both are downstream targets of mTOR
(Gingras et al., 2001; Schmelzle and Hall, 2000). The mTOR activity, measured
by phosphorylation on p706K1 and 4E-BP1, was found to be constitutively
phosphorylated in either TSC1-/- or TSC2-/- cells (Goncharova et al. 2002).
4.2 Rheb, a small G protein, activates mTOR
TSC1 and TSC2 do not have any sequence homologies with protein kinases or
protein phophatases and as a conclusion of this fact, the regulation to mTOR
must be indirect. Sequence information of TSC2 has revealed a GTPase-
activating protein (GAP) domain in its C-terminus (Krymskaya 2003). This GAP-
domain is highly conserved from yeast to human (Hay and Sonenberg 2004).
GAPs function is to down regulate the activity of small G proteins (small GTP-
bound proteins) (Krymskaya 2003).
Small G proteins cycle in between active status GTP-bound and inactive
status GDP-bound, whereas guanine nucleotide exchange factors (GEFs)
12
promote exchange between GDP and GTP on the small G protein. GAPs are
responsible for the inactivation of small G proteins by exchanging GTP for GDP
(Paduch et al. 2001). Genetic studies in Drosophila placed Rheb (Ras homolog
enriched in brain), a small G protein, in the insulin-signaling pathway downstream
of the TSC1-TSC2 complex and upstream of mTOR (Saucedo et al. 2003;
Stocker et al. 2003; Zhang et al. 2003b). Using an RNAi-based screen in
Drosophila, Zhang et al. could show a highly TSC2-GAP-specificity for the small
GTP-binding protein Rheb. They found that only the inhibition of Rheb
expression by RNAi, and none of the other 17 small G proteins abolished mTOR
activity, measured by p70S6K phosphorylation on Threonine 389 (Zhang et al.
2003b).
Biochemical studies revealed that the ratio GTP to GDP bound on Rheb
was decreased as shown by over-expression experiments using TSC1 and TSC2
cDNA in both mammalian and Drosophila cells (Castro et al. 2003; Garami et al.
2003; Inoki et al. 2003a; Zhang et al. 2003b). The role of TSC1 in the TSC1-
TSC2-complex has been unclear, it was suggested it stabilized TSC2 to function
as a GAP-protein (Li et al. 2004). The question that emerged from all studies is
how Rheb activates mTOR?
Further biochemical studies showed that over-expression of Rheb
increased mTOR activity measured by phosphorylation of p70S6K and 4EBP1
(Garami et al. 2003; Inoki et al. 2003a), and rapamycin, an inhibitor of mTOR
activity, completely blocked the increased p70S6K phosphorylation induced by
Rheb (Castro et al. 2003; Garami et al. 2003; Inoki et al. 2003a). Additionally,
Inoki et al. observed increased phosphorylation of mTOR on Serine 2448,
although the phosphorylation of this site accounting for mTOR activity is very
controversial (Hay and Sonenberg 2004). It still needs to be addressed which
factors are upstream and downstream of TSC1/2 and Rheb signaling.
4.3 TOR- target of rapamycin
The mammalian target of rapamycin (Figure 3), mTOR is a regulator for mRNA
translation in the signaling pathways controlled by insulin, growth factors and
availability of nutrients, such as amino acids (Myers et al. 1998).
13
TOR proteins, TOR1 and TOR2 were first cloned in yeast (Cafferkey et al.
1994) and originally named FRAP (FKBP-rapamycin and associated protein),
RAFT (rapamycin and FKBP target), or RAPT1 (rapamycin target) (Brown et al.
1994; Chiu et al. 1994; Sabatini et al. 1994; Sabers et al. 1995). Rapamycin was
isolated from the soil bacteria Streptomyces hygroscopius and is a macrolide
antibiotic with potent antifungal, immunosuppressive and antimitotic properties
(Gregory et al. 1995). Rapamycin forms an inhibitory complex with FK506
binding protein (FKBP12), this FKBP12 complex then binds to a FRB (FKBP12-
rapamycin binding) region in the carboxy-terminus of mTOR/TOR protein and
inhibits their activity (Chen et al. 1995) (Choi et al. 1996).
Figure 3: Structure of mammalian target of rapamycin (mTOR). mTOR possesses 20 HEAT repeats in its amino-terminus, which are important for protein-protein interaction. The FAT domain, FRB domain, catalytic domain (kinase), NRD domain and FATC domains are located in the carboxy-terminus half of the protein TOR. The catalytic domain is very similar to the catalytic domain of the PI3-kinase.
The mammalian TOR protein (Figure 3), was cloned short after the yeast
orthologue and has a similar structure exhibiting approximately 40% amino acid
identity and conserved structural domain (Brown et al. 1994; Chiu et al. 1994;
Sabatini et al. 1994).
TOR is a large evolutionary conserved protein of 2549 amino acids
(depending on species) and about 280 kD of molecular weight. It possess 20
HEAT repeats (for Huntington, EF3, A-Subunit of PP2 A TOR1) in its amino-
terminus, which are important for protein-protein interaction (Andrade and Bork
1995). The FAT domain, FRB domain, catalytic domain, NRD domain and FATC
14
domains are located in the carboxy-terminus half of the protein TOR (Figure 3).
The catalytic domain is very similar to the catalytic domain of the PI3-kinase (Hay
and Sonenberg 2004). The mammalian target of rapamycin displays an intrinsic
serine/threonine kinase activity and can be autophosphorylated (Brown et al.
1995).
Insulin and activated Akt were shown to induce phosphorylation of mTOR
in vivo. Two phosphorylation sites were identified for Akt, Threonine 2446 and
Serine 2448. Serine 2448 was shown to be phosphorylated by Akt in vitro and in
vivo (Scott and Lawrence 1998; Nave et al. 1999; Sekulic et al. 2000; Reynolds
et al. 2002). However, mutation of both sites converted to alanine did not affect
mTOR activity (Selculic et al 2000) and additionally, both phosphorylation sites
are not conserved in Drosophila dTOR (Hay and Sonenberg 2004).
4.4 Downstream targets of mTOR
Akt is required for the phosphorylation and inhibition of 4EBP1 by mTOR
(Gingras et al., 1998). TOR is responsible for the phosphorylation of p70S6K and
activates it, whereas 4EBP1 activity is inhibited by phosphorylation of TOR. Both
4E-BP1 and p70S6K have been implicated in determining the cell size (Kozma
and Thomas 2002). The phosphorylation of 4EBP1 and S6K is inhibited by
rapamycin.
Thus, p70S6K accelerates global protein synthesis and phosphorylates
the 40S ribosomal protein S6, which accelerates translation of mRNAs containing
a terminal oligopolypyrimidine (TOP) track at the 5' end that encodes mainly for
ribosomal protein and elongation factors (Jefferies et al., 1997).
The hypophosphorylated form of 4EBP1 binds to the translation initiation
factor eIF4E (the cap-binding protein) and is a repressor of translation that
inhibits the translation of cap-containing mRNAs. The full phosphorylation of
4EBP1 (hyperphosphorylated form) leads to the dissociation from eIF4E.
Released eIF4E is able to interact with the cap region of the mRNA.
15
5. Control of mTOR by nutrients and energy metabolism
How cell growth, cellular energy level and nutrient availability are coordinated is a
fundamental question in cell biology. The protein mTOR appears to control
various cellular signaling in response to mitogens, nutrients (such as amino
acids) and energy.
5.1 Protein-protein interaction with mTOR senses nutrient availability?
TOR or mTOR possess about 20 HEAT repeats in their amino-terminus, which
are likely to be involved in protein-protein interaction (Andrade and Bork 1995). In
addition to possessing kinase activity, TOR in yeast and mTOR in mammalian
cells have been shown to interact with other proteins, which modulate
mTOR/TOR kinase activity to its downstream effectors S6K and 4EBP.
TOR builds complexes with other proteins, which are likely for �sensing�
the availability of nutrients. Studies in yeast revealed TOR-complex1 and TOR-
complex2 (TORC1 and TORC2), whereby TORC1 contains TOR1, TOR2,
KOG1 and LST8. The mammalian orthologue of KOG1 is named Raptor
(regulatory associated protein of mTOR), and builds a complex with the
mammalian orthologue of LST8 (mLST8) and mTOR (Hara et al. 2002; Kim et al.
2002). Similar to TORC1 in yeast this complex has been named �nutrient
sensitive� complex (Kim et al. 2002).
mLST8, identified as a G protein β�subunit like protein, interacts
specifically and independently of Raptor with the kinase domain of mTOR and
plays a positive role in regulating mTOR activity (Kim et al. 2003). Raptor binds
to mTOR on its amino-terminal domain containing the HEAT repeats and is
required for interaction with the mTOR-Raptor complex (Kim et al. 2002). RNAi
experiments in mammalian cells suggested a positive role for mTOR-activity
regulation (Hara et al. 2002; Kim et al. 2002). Nutrient withdrawal resulted in an
increased association of Raptor with mTOR (Kim et al. 2002). Raptor appeared
to serve as an adaptor protein that recruits mTOR targeting S6k and 4EBP1
(Schalm and Blenis 2002). Changing conformation of the mTOR-Raptor complex
16
mediated by availability of nutrients, such as amino acids, affected mTORs ability
to interact with the substrates S6K and 4EBP (Hay and Sonenberg 2004).
TORC2 in yeast contains TOR2, AVO-1, AVO-2 and AVO-3, whereas
AVO-1 contains a Ras binding domain (RBD) of Ras targets and AVO-2
possesses a Ras-GEFN-domain (guanine nucleotide exchange factor) that has
been found in exchange factors and activating proteins for Ras-like small
GTPases (Loewith et al. 2002).
The exact mechanism, how mTOR or TOR senses nutrients, are still not
clear and whether growth factor or insulin activation of mTOR is involved in this
process.
5.2 Energy sensor mTOR, regulation through AMPK?
Translation (protein synthesis) requires both amino acids and a substantial
amount of metabolic energy. The translation rate of mRNA was shown to be
regulated by multiple signaling pathways, including intracellular ATP, nutrients,
growth factor and environmental stress (Proud 2002).
Dennis et al. linked mTOR-activity to the availability of intracellular energy
in form of ATP (Dennis et al. 2001). They showed that ATP depletion by reduced
glucose availability or inhibition of mitochondrial respiration inhibites mTOR-
activity. The interpretation of this effect was due to a low Km of mTOR-kinase
activity for the substrate ATP. However, under physiologically conditions,
reduced glucose availability did not dramatically diminish ATP levels (Hay and
Sonenberg 2004).
A sensor for even moderate changes of the intracellular ATP level is
AMPK (AMP-activated kinase), which senses the status of the intracellular ratio
of adenine nucleotides AMP and ATP. The AMPK-structure is built by a
heterotrimetric complex composed of a catalytic α subunit and non-catalytic
subunits β and γ. Activation of AMPK under hypoxia, exercise, ischemia, heat
shock, and low glucose and is regulated allosterically by AMP-ATP ratios caused
by a rising AMP level and by phosphorylation of the catalytic α subunit by one or
more AMPK-kinases on Thr-172. The phosphorylation site of AMPK is located in
the �T-loop� of the catalytic subunit α (Hardie et al. 1998; Kemp et al. 1999) and
17
can be used as a read out for AMPK-activity (Kimura et al. 2003). Even a small
reduction in ATP can result in elevation of cellular AMP through the activation of
adenylate kinase, which is predominantly located in the mitochondrial matrix
aimed to conserving the ATP-level. The goal of AMPK is to further reduce ATP-
consumption by inhibiting key enzymes in the biosynthesis pathways such as
ACC (acetyl-Co-A carboxylase) in fatty acid synthesis (Kemp et al 1999).
Kimura et al. showed for the first time that activation of AMPK decreased mTOR
activity. AICAR (5-aminoimidazol-4-carboxiamide ribonucleoside), widely used as
an AMPK activator, induced AMPK activity and impaired insulin-mediated
phosphorylation of S6K. In addition, over expression of dominant negative AMPK
increased S6K phosphorylation, whereas a constitutively active AMPK decreased
S6K activity (Kimura et al. 2003).
Inoki et al 2003 provided more evidence for a link between ATP level
(energy availability), AMPK and mTOR. TSC2 was found to be the mediator of
energy status in response to AMPK. TSC2�KO (knock out) cells were more
refractive to ATP depletion when compared to wild type cells. To elucidate the
mechanism of how TSC2 is regulated by AMPK, an in vivo labeling and two-
dimensional phosophopeptide mapping of TSC2 was performed. By using 2-
deoxyglucose to induce AMPK activity, two important phosphorylation sites for
AMPK, Threonine 1227 and Serine 1345 were found on TSC2. Over expression
of a mutant TSC2, in which all AMPK phosphorylation residues were substituted
by alanine, S6K phosphorylation (mTOR-activity) was more resistant to depletion
of ATP (Inoki et al. 2003b). Whether GAP-activity of TSC2 was changed by
AMPK phosphorylation, has not been determined yet.
5.3 LKB1 potentiates the effect on AMPK
LKB1, a serine/treonine kinase, is a tumorsuppressor, which is mutationally
inactivated in the autosomal Peutz-Jeghers syndrome (PJS) (Boudeau et al.
2003a) (Boudeau et al. 2003b) as well as in some sporadic lung adenocarcinoma
(Sanchez-Cespedes et al. 2002). LKB1 heterozygosity in mouse results in
18
sporadic harmatomatous gastrointestinal polyps, which phenocopy those in PJS
patients (Rossi et al. 2002).
Hamartomas are benign tumors that display normal cellular differentiation
but disorganized tissue architecture, which are very similar to hamartomas
occurring in tuberous sclerosis complex and Cowden�s disease (Shaw et al.
2004). The 55kDa protein LKB1 was shown to be required for repression of
mTOR under low ATP conditions in cultured cells in AMPK and TSC2 dependent
manner. Lkb1 null MEFs (mouse embryo fibroblasts) and harmatomous
gastrointestinal polyps from Lkb1 mutant mice showed elevated signaling
downstream of mTOR (Shaw et al. 2004) .
Biochemical studies confirmed the relationship between LKB1 and AMPK
and showed that LKB1 potentiates the effects of increased intracellular AMP or
reduced intracellular ATP by direct phosphorylation on Threonin 172 of the
AMPK (Corradetti et al. 2004).
Using a phospho-mapping method, of co-transfected 293 cells with
TSC1/TSC2 and mutant (kinase dead) LKB1, showed increased phosphorylation
on Serine1345/Threonine1227 on TSC2 under ATP depletion. This result
established the molecular mechanism of LKB1 function through TSC2 (Corradetti
et al. 2004).
5.4 Amino acid sensor mTOR, AMPK-sensing mechanism? A very crucial element involved in the translation initiation and protein synthesis
are the protein substrates themselves i.e., amino acids. Among amino acids,
leucin has been reported to have the most impact on mTOR activity (Hara et al.
1998). It was proposed that leucin activates mTor activity, in part, by serving both
as a mitochondrial fuel through oxidative carboxylation and by allosteric
activation of glutamate dehydrogenase (Xu et al. 2001). This hypothesis supports
a model, in which leucin modulates mTOR activity by regulating mitochondrial
function and AMPK. Thus, energy and amino acids (leucin) responses are
regulated by a similar mechanism: through the regulation of intracellular levels of
ATP and/or AMP, which are mediating AMPK activity (Tokunaga et al. 2004).
19
6. Conclusion
Figure 4 depicts the regulation of the PI3-kinase-Akt-mTOR pathway, based on
the available knowledge in the literature (described in CHAPTER I 2-5).
Figure 4: Scheme of the Akt-TSC2-mTOR pathway summarizing current literature.
Binding of growth factor leads to activation of the growth factor receptor,
which in turn activates PI3-kinase (Figure 4 A). Activated PI3-kinase converts the
second messenger PIP2 to PIP3. The rate-limiting step in the activation of Akt is
the binding of PIP3 to the PH domain of Akt. Akt is then translocated to the
plasma membrane, where it is phosphorylated on two residues, a threonine in
the catalytic domain and a serine in the carboxy-terminal regulatory domain, for
full activation. PDK1, which also possesses a PH domain, is the kinase that
phosphorylates Akt on Threonine 308. Another yet unknown PI3K-dependent
20
kinase phosphorylates Akt on Serine 473 in the carboxy-terminus of Akt, are able
to phosphorylate and thereby to activate Akt. Fully activated Akt phosphorylates
TSC2 by direct phosphorylation on four sites (Figure 4C), which leads to a
separation of the inhibitory complex between TSC1 and TSC2, and activates
mTOR. The kinase mTOR affects its downstream target 4EBP1 and S6K1, both
are phosphorylated by its kinase activity and increasing protein synthesis (Figure
4 D). The small GTPase Rheb, which is in its active state GTP-bound, has been
shown to activate mTOR. TSC2 inhibits activation of Rheb by exerting its GAP
activity and converting Rheb-GTP bound to Rheb-GDP bound (Figure 4 E).
AMPK was shown to phosphorylate TSC2 and to decrease mTOR activity under
ATP depletion condition, hypothetically due to increased GAP-activity toward
Rheb (Figure 4 F).
21
II. Practical- Effect of Akt (PKB) on the activity of mammalian
target of rapamycin (mTOR) 1. Introduction
The serine/threonine kinase Akt, also known as protein kinase B (PKB), is a
multifunctional kinase (Kandel and Hay 1999; Hanada et al. 2004). The primary
structure of Akt is depicted in Figure 1. This dissertation is focused on the PI3-
kinase/Akt/mTOR axis. The PI3-kinase-Akt-mTOR pathway plays an important
role in development, cell growth and cell division. Deregulation of this pathway
can lead to cancer, metabolic diseases, diabetes and obesity in humans.
Especially, the process of tumorigenesis is the result of a disturbed balance
between cell division and cell growth on the one hand, and programmed cell
death (i.e., apoptosis) on the other. Activation of mTOR was shown to contribute
to genesis of cancer, by loss of function of the tumor suppressor PTEN or by
amplification of genes encoding catalytic subunits of PI3-kinase or Akt [reviewed
in (Hay and Sonenberg 2004)].
What actually determines cell size? Availability of nutrients, energy in form
of ATP, growth factors or physically stimuli induced cell growth? Increasing body
of evidence placed mTOR as a central regulator of cell growth (size), proliferation
and more recently, survival. Akt is required for the phosphorylation of 4EBP1 by
mTOR (Gingras et al. 1998). However, despite this observation that Akt may act
downstream of mTOR, there was no genetic evidence that Akt is required for
mTOR activity, and it is not clear how Akt exerts its effect on mTOR. A very
important question is whether TSC2 phosphorylation by Akt is sufficient to fully
activate mTOR. mTOR activity is also dependent on intracellular ATP levels and
AMPK activity. AMPK inhibits mTOR through the phosphorylation and
inactivation of TSC2.
A better understanding of how Akt exerts its effect on the mTOR-signaling
pathway may lead to the design of new drugs against cancer, metabolic
diseases, diabetes and obesity. A relatively new mTOR-inhibitor or drug is
rapamycin, which is in clinical trials to treat cancer, arthritis and heart diseases.
22
1.1 Objective The focus of this thesis is to verify the activity of Akt on mTOR and how ATP
availability affects the pathway in correlation with the effect on TSC2. How does Akt regulate cell mass (size)?
Skeletal muscle cells of Akt1/Akt2 DKO mice show severe atrophy and a
decrease in cell size (Peng et al. 2003). Increasing body of evidence placed
mTOR as a central regulator of cell growth (size) and proliferation. The kinase
mTOR affects its downstream targets 4EBP1 and S6K1, both are phosphorylated
by its kinase activity and increasing protein synthesis (Kozma and Thomas
2002). Akt phosphorylates TSC2 on four residues, inactivates it and thereby
activates mTOR (Inoki et al. 2002; Manning et al. 2002; Potter et al. 2002).
Design of experiments to investigate the status of mTOR activity and TSC2
phosphorylation in Akt1/Akt2 DKO MEFs vs. WT may establish genetic evidence
that Akt is required for the activation of mTOR by growth factor. Does Akt regulate mTOR activity by a mechanism related to energy metabolism?
mTOR activity appears to be dependent on the intracellular ATP level (Dennis et
al. 2001) and it was shown that ATP depletion activates AMP-activated protein
kinase (AMPK), which in turn phosphorylates and activates TSC2 leading to the
inhibition of mTOR activity (Inoki et al. 2003b). It was also shown that cells
expressing activated Akt have a significantly higher level of ATP (Gottlob et al.
2001). It might be possible to underlie this observation by experiments that will
determine if Akt deficiency reduces the intracellular level of ATP and how a
decreased ATP level affects the AMP/ATP ratio and AMPK activity. To prove
previous findings, experiments may uncover how AMPK attenuates Akt�s ability
to activate mTOR under ATP-depletion conditions. Furthermore, it is not known
whether a reduced or high ATP-level mediated by Akt affects AMPK activity and
which are potential downstream effectors. Experiments that determine the effect
of Akt�s ability to regulate the intracellular level of ATP and AMPK on
downstream effectors, such as TSC2 or mTOR, will explore the mechanism.
23
Figure 5: Hypothetical scheme for the regulation of the AKT-TSC2-mTOR pathway. Activation of Akt leads to the direct phosphorylation of TSC2. Does Akt regulate mTOR by a mechanism related to energy metabolism and AMPK? And if so, which are the downstream targets for this regulation, e.g., TSC2, or more downstream targets? IR (Insulin-receptor), (PI3K-phophatidylinositol-3-kinase), Akt (serine /threonine activated protein kinase), TSC1 (tuberose scleroses complex1-hamartine), TSC2 (tuberose scleroses complex2-tuberin), AMPK (AMP-activated kinase), LKB1 (AMPK-kinase), Rheb (Ras homologe enriched in brain), mTOR (mammalian target of rapamycin).
24
2. Network
Characterization of mTOR activity and cell mass in Akt1/Akt2 deficient cells
Isolation of mouse embryofibroblasts
Analysis of cell size in skeletal muscle
Analysis of mTOR-activity using Immuno- blotting
Biochemical /Genetical characterization: -Overexpression experiments using cDNAs with constitutivley activated and dominant negative AMPK -Using AICAR to induced
AMPK activity
Adenine nucleotide characterization: Using: -Akt1/Akt2 deficient cells, TSC2 deficient cells and Rat1a cells with or without activated Akt
Energy depletion experiments: Using: -Rat1 cells with insulin induced pathway -Rat1a with activated form of Akt -TSC2-KO cells
Mechanistic study of the pathway -Establishing a stable cell line with DN-AMPK in Akt1/Akt2 DKO cells -Establishing a stable cell line with Akt-phosphomimetic TSC2 mutant in TSC2-KO cells
-Construction of the vectors -Transfection -mTOR-activity using Immunoblotting
-Constructs and establishment of a cell line -HPLC-analysis
-Treatment with inhibitor of glycolysis and oxidative phosphorylation -mTOR-activity using Immunoblotting
-Vector construction -Cell lines
-mTOR-activity, using Immunoblotting
-Treatment with inhibitor of glycolysis -mTOR-activity, using Immunoblotting
25
3. Materials and Methods 3.1 Materials Chemicals Acrylamide/bis-Acrylamide (29:1), Sigma, St. Louis, MS, USA
30% Solution
AICAR TRC Inc., Toronto/Canada
Agarose Fisher, Fair Lawn, USA
Ampicilline Fisher, Fair Lawn, USA
Ammonium Persulfate Sigma, St. Louis, MS, USA
Bacto-Agar Difco, USA
Bromphenol blue Sigma, St. Louis, MO, USA
β-glycerolphosphate Sigma, St. Louis, MO, USA
Chloroquine Sigma, St. Louis, MO, USA
Chromatography paper Fisher, Fair Lawn, USA
Coomassie Brilliant BlueR250 Sigma, St. Louis, MO, USA
DEAE Sigma, St. Louis, MO, USA
Dextran Sigma, St. Louis, MO, USA
2-deoxy-D-glucose Sigma, St. Louis, MO, USA
DMEM Invitrogen, Grand Island, NY, US
DMSO Fisher, Fair Lawn, USA
ATP Sigma, St. Louis, MO, USA
ADP Sigma, St. Louis, MO, USA
AMP Sigma, St. Louis, MO, USA
DTT Sigma, St. Louis, MO, USA
Okadaicacid Sigma, St. Louis, MO, USA
EDTA Sigma, St. Louis, MO, USA
EGTA Sigma, St. Louis, MO, USA
Ethidiumbromide Sigma, St. Louis, MO, USA
Fetal Bovine Serum AtlantaBiologicals, Oakbrook, USA
deoR, ∆(lacZYA-argF) U169 (see PROMEGA, catalogue 1995)
Primary Cells:
Primary DKO (Akt1-/-Akt2-/-) and WT (Akt1+/+Akt2+/+) MEF (mouse embryo
fibroblast) cells were isolated and cultured as previously described in (Chen et al.
2001).
3.1.7 Media, agarose plates, antibotica and materials
For all cell lines DMEM high glucose (Dulbecco�s modified Eagle medium from
Invitrogen, Carlsbad/CA) containing 10% (v/v) FBS (fetal bovine serum from
Atlanta, Norcross) and 1% (v/v) Penicillin/Streptomycin (c=10,000U/ml Penicillin,
c=10µg/ml Streptomycin) from Cambrex Bioscience was used. DMEM (with L-
glutamine, without glucose, without sodium pyruvate, # 11966-025 from
Invitrogen, Carlsbad/CA) with 10% FBS dialyzed (# SH30079.02 from Hyclone,
Logan) was supplemented with 5.5 mM glucose and used for cell lines in ATP-
depletion experiments.
X-ray film KODAC
Syringes Falcon Becton Dickinson, Lakes USA
Tubes 1.5 ml, 2.0ml Eppendorf
Tubes 15ml, 50ml Falcon Becton Dickinson, Lakes USA
Cell lifter Corning Incorporated, Corning USA
Cryotubes Nalgene
Pipettes Falcon Becton Dickinson, Lakes, USA
32
3.1.8 Buffers and solutions All stock solutions were prepared with ddH2O (Millipore) double distillated water
and autoclaved or sterile filtered. Media and buffer were autoclaved or sterile
filtered before using. ddH2O (was generated by using a Millipore filtersystem
(#CPMQ004D2) and stored at 4°C.
RNase A: 10mM Tris-HCl pH 7,5; 15mM NaCl solved to a concentration of
10mg/ml; to inactivate DNases the solution was incubated for 15
minutes and slowly cooled to room temperature, aliquoted and
stored at -20°C
Ampicillin: - solved to a concentration of 100mg/ml with ddH2O, sterile
filtered, aliquoted and stored at -20°C
Lysozyme: - solved to a concentration of 20 mg/mL in TE pH 8.0 (10mM Tris
1mM EDTA) , sterile filtered, aliquoted and stored at -20°C
20 x TBS pH 7.4
using HCl, 3M NaCl 1M Tris
TE
10mM Tris/HCl, pH 7.5, 1mM EDTA
6X SDS-loading buffer
20x PBS-Puffer pH 7.2
6M NaCl, 140mM Na2HPO4,
60mM NaH2PO4 x 2 H2O
1x TRIS pH 7.4-8.0 1M Trisbase
1X TrisHCl pH 6.8
for SDS-stacking gel 1M Tris pH
6.8 using HCl
1x Tris HCl pH 8.8
for SDS-separation gel
1.5M Tris pH 8.8 HCl
50X TAE
2M Trisbase, 57.1ml Acetic Acid
(1M), 0.5M EDTA (pH 8.0)
0.5 M EDTA pH 8.0
using NaOH
DNA loading buffer
0.25% Bromphenolblue, 0.25%
Xylene cyanol FF 30% Glycerol
5mM EDTA
33
Lysis buffer
protect phosphorylation status of
proteins
20 mM Tris HCL (pH 7.5), 100 mM
KCl, 20 mM beta-glycerolphosphate
,1mM DTT, 0.25 mM Na3 VO4, 10 mM
NaF, 1mM EDTA, 1mM EGT, 1mM
PMSF, 10mM Na-pyrophosphate, 10
nM Okadaicacid, Protease inhibitor
cocktail complete
3.2 Cell culture methods 3.2.1 Culture conditions, stimulations and Inhibitions
1.5x10⁶ primary DKOs (Akt1-/-Akt2-/-) and WT (Akt1+/+Akt2+/+) MEFs (passage
3) were plated in 15-cm-plates in DMEM with 10% FBS and deprived of serum
for 24h. Cells were stimulated with insulin (1µg/ml), 10% FBS and 20% FBS for
60 min and intracellular ATP, ADP and AMP concentrations were analyzed by
HPLC (see CHAPTER 3.9). For Western analysis cells were stimulated with 10%
FBS and 20% FBS for 30 and 60 minutes.
Rat1a, TSC2 +/- MEFs and TSC2-/- MEFs (1x10⁶ /10-cm-plate) were
plated in DMEM (5.5 mM glucose) with 10% FBS (dialyzed) and deprived of
serum for 24h, stimulated with insulin (1µg/ml) for 30 minutes and either further
stimulated with insulin (1µg/ml) for 30 minutes or ATP-depleted by using different
concentrations of 5-thio-D-glucose, 2-deoxy-D-glucose and rotenone.
Rat1a MAkt cells (1x10⁶ /10-cm-plate) expressing activated Akt were
deprived of serum for 24h in DMEM (5.5 mM glucose) and treated with different
concentrations of 5-thioglucose, rotenone and AICAR for 30min.
293MAkt (1x10⁶ /6-cm-plate) were plated in DMEM with 10% FBS and
transfected with increasing concentrations of pcDNA3-AMPKalphpa-I-CA-
Thr172D-myc (5, 10, 15, 20 µg DNA) and 2.5 µg pcDNA-4EBP1-HA per 1x10⁶
cells by using Lipofectamine 2000, (CHAPTER 3.5.2).
34
3.2.2 Maintenance of cell lines
All cell culture work was done under sterile conditions (sterile guard hood Class II
Type A/B3, Baker company Inc.). For pipetting sterile serological pipettes
(Falcon, BD) and automatic pipette aids were used. Supernatants of cultured
cells and solutions were vacuumed by using sterile Pasteur pipettes. All cell lines
were cultured at 37°C using a CO2 water jacketed incubator for mammalian cell
culture from Forma Scientific. The culture of all incubated mammalian cells were
controlled every day to observe confluence status by using a light microscope
(Microscope Nicon, FRYET COMPANY INC). The culture medium DMEM with
10% (v/v) FBS and 1% (v/v) Penicillin/Streptomycin was replaced every third day
of culture. Cultured cells were used shortly after plating and expansion, to avoid
long-term effects, such as mutations.
Splitting of cell lines was performed by washing the plates two times with
PBS solution and incubating the cell plates with 1-3ml Trypsin/EDTA, dependent
on the size of the plate for 1-5 minutes. After cells had been detached, DMEM
with 10% FBS was added and cells were gently resuspended and split to a ratio
1:3 or 1:5 depending on the growth rate of the cell line.
3.2.3 Storage of cells
Cell lines were stored for long-term use in liquid nitrogen or for short-term use in
a freezer at -80°C. For storage of cell lines, cells of interest were trypsinized
when confluence reached 70%, centrifuged at 1000rpm for 5 minutes,
resuspended in ice cold freezing solution and aliquoted in cryotubes. Tubes were
transferred immediately into an -80°C freezer for short-term use and stored in
liquid nitrogen for long-term use.
Frozen cell lines were thawed at 37°C in a waterbath. Immediately after
thawing, the cell-solution was transferred into a 10 ml Falcon tube and
resuspended in DMEM with 10% FBS, centrifuged at 1000rpm for 5min, the
supernatant discarded and cells resuspended in fresh DMEM with 10% FBS and
plated.
35
Freezing solution:
90% FCS
10% DMSO
3.3 Mouse embryo fibroblast (MEF) isolation
Mouse embryo fibroblasts were produced using the protocol from (Chen et al.
2001). The first step for the production of mouse embryo fibroblast (MEFs) is to
sacrifice the bearing animal in the embryonic stage between days 12-14. With
sterile techniques and solutions, the uterus containing embryos was removed
and placed in DMEM. After transfer into a laminar flow hood, the embryos were
placed into a 15ml conical tube and rinsed 3 times with 5 ml DMEM.
The top half of the embryo head and the internal organs were removed
and stored in a separate conical tube for genotyping. With forceps and a fresh
disposable scalpel the remaining parts of the embryo were minced very well and
transferred into a 15 ml conical tube containing 5ml 0.05% trypsin-0.02% EDTA.
The tube was inverted for several times and then placed for 5 min in a 37°C
water bath (every minute the tube was inverted and returned to the water bath).
The supernatant was placed in a 15 ml conical tube containing 5 ml
DMEM with 10% FBS and with 1% Penicillin/Streptomycin. 5ml of trypsin was
added to the embryo and incubated for 5 min. The two tubes were combined
(total volume was 15ml) and centrifuged for 5min. After the supernatant had been
discarded, the pellet was resuspended in 10 ml of DMEM with 10% FBS-PS and
put into a 10 cm dish overnight.
On the next day, the plate was nearly confluent and split into 2x15 cm
plates. Once grown to confluence, primary MEF cells were frozen down in 4
cryovials per 15 cm plate and stored at �80°C in a freezer.
36
3.4 Transfection of adherent mammalian cells for recombinant
expression 3.4.1 Calcium phosphate method 1-1.5x10⁶ adherent 293 cells or 293 MAkt cells were plated in 6 cm plates in
DMEM with 10% FBS one day before the transfection. 30min before the
transfection, the media was changed to 3ml DMEM with 10% FBS. The amount
of DNA was dissolved in 440µl of 0.1X TE (pH 8.0) by mixing and allowing to sit
for 5 minutes in a 1.5ml eppendorf tube. After 5 min, 500 µl HBS (pH 7.05) buffer
was added to each tube and mixed. Using a 1ml pipettor hooked up to a taped
pipette aid, the DNA-TE-HBS solution was bubbled and 62µl of 2M CaCl2 was
drip wise added. To increase the transfection efficiency, chloroquine (25µM) was
added to each plate. The final step was to drip each of the 1.0 ml transfection
aliquots of precipitate onto one plate and to mix the media with this aliquot by
rotating the plates. After 1 hour there were salt crystals detectable by using a
light microscope. The transfected plates were incubated overnight at 37°C. On
the next day, the 293 or 293 MAkt cells were washed with PBS and the media
was replaced with DMEM with 10% FBS. Expression of the ectopic protein was
dependent on the construct and had to be addressed before starting the actual
experiment (Sambrook 1998).
3.4.2 Lipofectamine 2000 method
Transient overexpression of cDNA constructs into eukaryotic cells was performed
with Lipofectamine 2000 from Invitrogen, specifically by co-transfection of two or
three different constructs (according to the manufacturer�s instructions).
Liposomes are microscopic spherical vesicles that form when phospholipids are
hydrated. When mixed in water under low shear conditions, the phospholipids
arrange themselves in sheets, the molecules aligning side by side in like
orientation, "heads" up and "tails" down. These sheets then join tails-to-tails to
form a bilayer membrane, which encloses the DNA in a phospholipids sphere.
37
One day before transfection, cells were plated in 6cm plates using DMEM with
10% FBS. The next day, the media was changed to DMEM without FBS and
without Penicillin/Streptomycin (1h before transfection). At the same time the
suitable DNA-constructs were prepared in 300µl DMEM without FBS and without
Penicillin/Streptomycin by gently mixing and incubating for 5 minutes at room
temperature. Lipofectamin (20µl) was added to 300µl DMEM without FBS and
without Penicillin/Streptomycin. Immediately the DNA-DMEM-solution was added
to the Lipofectamin-DMEM-solution and incubated for 20 minutes at room
temperature. After incubation the transfection-mix was added on the prepared
plates and placed back into the incubator at 37°C for 5 hours. Finally, after
incubation, 1ml DMEM with 20% FBS was added to each plate. Transfected cells
were used for treatment 24 hours post-transfection.
3.4.3 DEAE-Dextran-Chloroquine method
293 cells were transfected by using the DEAE-Dextran-Chloroquine method
(Gonzalez und Joly 1995). The expression vector containing the cDNA of interest
or the empty vector for ectopically expression experiments was prepared in 50µl
TE pH 7.5. The amount of DNA varied dependent on the experiment. 1-1.5x10⁶
adherent cells were plated in 25 cm2 flasks with resealable lids in DMEM + 10%
FBS and cultured for 24h. 15ml Falcon tubes were used to set up the
transfection-mix for each sample by transferring 2.5ml DMEM without FBS and
100µl DEAE-Dextran-Chloroquine solution. Before transfection, media in the cell
culture plates were replaced with DMEM without FBS (1h before transfection).
DNA-TE-buffer and transfection-mix were mixed under sterile conditions and
incubated at room temperature for 5 minutes.
After the media were removed from the plates, the ready-transfection- mix
was applied to the plates, the lid was closed and incubated for 2h at 37°C.
Closing of the lid causes a drop of the pH-level of the media, which in turn
increases the efficiency of the transfection. After 2h incubation the transfection-
mix was removed and replaced with PBS-buffer+10% DMSO for 2 minutes and
washed with PBS-buffer. Finally, normal DMEM with 10% FBS and
38
Penicillin/Streptomycin was added and the plates were placed into the incubator
for overnight incubation.
DEAE-Dextran-Chloroquine
10mg/ml DEAE-Dextran in PBS
2.5mM Chloroquine
3.5 Retrovirus production and infection For the production of high virus titers of pLPCX-Puro-TSC2-4D, pBabe-eGFP-
AMPKalpha-II-DN-K45R, pBabe-eGFP-mAkt and pBabe-eGFP, packaging
ecotropic Phoenix cells were transfected by a calcium phosphate method
(CHAPTER 3.5.1). Cells were plated one day before transfection at
approximately 50% confluence in 15-cm-diameter tissue culture plates. Two days
after transfection, viral supernatants were collected and concentrated by
ultrafiltration (membrane # PBVK06210 from Millipore, Bedford). Concentrated
virus solution was first passed through 0.22 µm filter units (Millipore) and mixed
with DMEM with 10% FBS (1:1). The solution was added to the cells of interest in
the presence of polybrene 8µg/ mL (Kennedy et al. 1999) . Cells were selected
by puromycin and cells expressing 85-95% GFP were used as polyclonal cell
lines for further experiments. Polyclonal cell population that displayed lower
transfection rates were sorted by FACS (Vantage Becton Dickinson, San Jose,
CA) for enhanced green fluorescence protein signal (eGFP) to ensure high
expression levels of the respective plasmids.
3.6 Modification and amplification of DNA
3.6.1 Methods of in vitro modification of DNA
Conditions and buffers were used according to the manufacturer�s instructions.
Restriction of DNA with endonucleases (Sambrook 1998) was used for control of
ligations (Miniprep-Plasmid-DNA) and for preparative use. To each DNA-
digestion 1µg DNA in a volume of 20µl was added with 3-5 Units of restriction
endonucleases and buffers according to the manufacturer�s instructions.
39
Reactions with more than one endonuclease enzyme were possible using the
same buffer conditions. If reaction buffers had different requirements for NaCl
concentrations, the lowest NaCl concentration and the second endonuclease
enzyme were added after the NaCl concentration was adjusted to the higher salt
concentration. If the reaction buffers required different ions, agarose
electrophorese was used to separate the DNA-fragments after the first digestion.
The necessary DNA-fragment was cut out and purified by using the gel extraction
kit (CHAPTER 3.2.1). The second incubation with the endonuclease enzymes
were performed using the buffer according to the manufacturer�s instructions.
For Mini-preparation-plasmid-DNA the digestion-reaction contained 0.5µl RNase-
standard solution.
3.6.2 Preparation of vector-DNA
Vector-DNA was used in a concentration of 1µg pro 20µl total volume and
digested with the suitable endonucleases. The reaction was incubated for 1-3
hours with 3-5 Units/µg DNA and the buffer according to the manufacturer�s
instructions. After digestion, the linearized Vector-DNA was dephosphorylated.
The approach was set up to use 20 µl total digestion-volume and add up
to a total volume of 50µl with 1x CIAP-buffer and 1 unit Calf Intestine Alkaline
Phosphatase for 30 minutes at 37°C. The stop reaction was performed at 85°C
for 15 minutes or by phenol/chloroform extraction followed by ethanol
precipitation. Dephosphorylation of the vector was controlled during the ligation
reaction by using vector-DNA without insert-DNA (cDNA of interest, �Self-
ligation�). The number of colonies in the vector-only reaction occurring after
transformation on the LB-agarose plate compared to the number of colonies
occuring in the vector-insert reaction were validating the dephosphorylation
process. If there were less colonies on the �vector-only-reaction� plate compared
to the �vector-insert reaction� plate, the ligation reaction was successful.
Ligation of DNA fragments (vector and insert) was performed at 22°C for
2-3 h using T4-DNA-ligase and T4-DNA Ligase buffer according to the
manufacturer�s instructions.
40
The inactivation of T4-DNA Ligase was accomplished by incubation at
65°C for 10 minutes. 50% of the ligation reaction was used for the transformation
process, the other 50% were stored at -20°C.
3.6.3 Gel electrophoresis
Plasmid-DNA and DNA-Fragments were separated on horizontal agarose gels
7*10*0.5 cm (width*length*thickness), in 1x TAE-buffer (Sambrook 1998).
Concentrations of agarose gels were dependent on the size of DNA-fragments to
be separated ranging from 0.7%(w/v) - 1.5%(w/v). Restricted DNA-samples were
mixed with loading buffer (CHAPTER 3.1.8) and loaded on the agarose gel. The
gels were run 1-3 hours with 80-100 V with a DNA-size marker 1kb DNA-ladder.
Agarose gels with ethidium bromide-stained DNA-fragments were visualized
under UV illumination (366 nm).
3.6.4 Isolation of restriction fragments from gel slices To obtain the desired DNA fragments the gel was cut by using a scalpel and
transferred to an Eppendorf tube.
3.6.5 Phenol extraction and ethanol precipitation of DNA
Separation of DNA solution from protein, which could disturb the transfection
process of mammalian cells, was performed by phenol-chloroform-isoamyl
alcohol (24:24:1, v/v/v) extraction. The aqueous phase was mixed with an equal
volume of TE saturated phenol-chloroform-isoamyl alcohol for 30 seconds. The
solution was centrifuged at 12,000rpm for 5 minutes and the upper aqueous
phase was mixed a second time with the phenol-chloroform-isoamyl alcohol
phase for 30 seconds and centrifuged again. To remove all remaining phenol the
upper phase was removed and placed in a new Eppendorf tube and extracted
with chloroform-isoamyl alcohol. After centrifugation at 12,000rpm for 5 minutes,
41
the transferred upper aqueous phase was precipitated by adding 1/10 volume
3M-sodium acetate (pH 5.2) and 2.5 fold volume of ethanol (96%, v/v). The
mixture was stored at �20°C for 30 minutes or by �80 _C for 10 minutes. After
centrifugation at 12,000 rpm for 15 min at 4°C, the pellet was washed with 70%
(v/v) ethanol, air dried and redissolved in TE (appropriate volume).
3.6.6 Quantiative determination of DNA concentration
To determine the amount and quality of the preparative DNA, 5µl were measured
spectro-photometrically at 260nm in a dilution of 1:500 in TE-buffer. The ratio
A260/A280 describes the purity of the sample. Because the DNA was intended to
be used for transfection of mammalian cells, the ratio needed to be >1.8.
3.6.7 Production of competent bacteria cells for transformation
Competent bacteria are needed to transform ligation products to select for the
right construct and to amplify the construct.
Using the classical method, competent cells were prepared by treatment
with CaCl2 as described by Janssen et al. 1994. 10 ml of an overnight culture of
DH-5alpha E.coli were inoculated in 300 ml LB-media and incubated again by
37°C and shaked until the OD600 reached 0.6. After incubation on ice for 10
minutes the culture was centrifuged at 4000 rpm at 4 °C for 5 minutes.
The supernatant was discarded and the pellet was resuspended in 40 ml
ice-cold 100mM CaCl2 buffer and incubated on ice for 10 minutes. This step was
repeated two times. Lastly, the pellet was resuspended in 8 ml ice-cold 100mM
CaCl2 buffer, incubated on ice for 10 minutes and aliquoted in Eppendorf tubes.
Aliquots of 100µl cell suspension were snap frozen in liquid nitrogen and stored
at �80°C until usage. Transformation efficiencies of 106 to 108 transformed cells
per supercoiled plasmid DNA were obtained. CaCl2 competent bacteria cells
were stored up to 6 months in 100mM CaCl2 at �80°C.
42
3.6.8 Transformation of vector or plasmid DNA in competent bacteria Competent bacteria cells (approximately 100µl) and 10µl of total 20µl ligation
reaction were gently mixed and incubated on ice for 30 min. The remaining 10µl
of each reaction were stored at �20°C. After 30min a heat shock was performed
at 42°C for 2 minutes. Addition of 900µl LB-Media without antibiotica and shaking
of the bacteria solution at 200 rpm (37°C) for 30 minutes led to a recovery and
continued growth. 100 µl of each bacteria culture were transferred to a LB-
agarose plate with antibioticum (dependent on the expression vector). The
remaining culture was centrifuged at 6000rpm and only the pellet was plated on a
LB-agarose plate with antibioticum. This step served to increase the number of
bacteria colonies per plate. All plates were incubated at 37°C overnight.
3.6.9 Mini-preparation Mini-preparation was used for analytical approaches. After transformation of the
desired plasmid or ligation reaction, one to 30 positive colonies were picked from
a LB-agarose plate with a toothpick and cultured in 2.5 ml liquid LB-medium with
antibioticum at 37°C and 220rpm overnight. 1.5ml of each culture, which
represent one plasmid/colony, were used to pellet the bacteria by centrifugation.
The pellet was resuspended in 400µl Stet-buffer, mixed with 32µl of Lysozyme
and boiled for 50 seconds. After bacteria cells were lysed, the sample was
centrifuged at 15,000rpm for 15 min and the pellet of lysed bacteria cells was
removed with a sterile toothpick. 400µl of isopropanol was added to the solution
and stored for 20 min at -20°C.
After precipitation of the DNA with isopropanol, the solution was
centrifuged for 15 minutes at the maximum speed (13,000rpm). The supernatant
was discarded and the resulting DNA-pellet was washed with 70% (v/v) ethanol.
After the pellets were dried, the DNA was resuspended in 10-30µl TE-Buffer
(CHAPTER 3.1.8) dependent on the size of the pellets (DNA yield). Mini-
preparation-DNA was used to screen for the right construct after cloning of
cDNAs, for example DN-AMPK into the pBABEpuro vector. Control restriction
protocols included the use of RNases, because RNA was still present in Mini-
preparation-DNA solution.
43
Stet-buffer
8% Saccharose (w/v), 5% Triton (v/v)
50 mM EDTA, 50 mM Tris HCl pH 8.0
3.6.10 Maxi-preparation
For preparative use, a Qiagen-kit Pack-500 tip was used according to the
manufacturer�s instructions.
1.5 ml overnight culture or Mini-Preparation-culture was inoculated to 250
ml LB-media with antibiotica and cultured at 37°C and 220rpm overnight. The
bacteria culture was centrifuged for 15 minutes at 6000 rpm at 4°C and the
supernatant was discarded. After resuspension of the bacteria pellet by vortexing
or pipetting up and down with 10 ml P1 buffer, 10ml P2 buffer (Qiagen-kit) was
added and mixed gently but thoroughly by inverting the tube 4-6 times. An
incubation time of 5 minutes allowed for lysis of the bacteria cells. Adding 10ml
P3 buffer and inverting the tube 4-6 times neutralized the solution. Incubation of
the solution for additional 20 minutes led to separation into two phases, one with
fluffy white material. The precipitated material contains genomic DNA, protein,
cell debris and SDS.
Centrifugation for 30 minutes at 20,000g at 4°C separated the fluffy white
material from the solution, at the same time a Qiagen-tip 500 column was
equilibrated by applying 10ml of QBT-buffer, and allowed to empty by gravity
force. The supernatant was transferred to the column and after the supernatant
passed through the column, QC-buffer was used to wash the resin two times by
applying 30ml each time. Using 15ml QF-buffer the DNA was eluted into a 50ml
Falcon tube, which contained 10.5ml isopropanol for precipitation of the DNA.
Immediately after precipitation the solution was mixed and centrifuged at 15000g
for 30 minutes at 4°C. The supernatant was removed and the pellet was carefully
washed with 70% (v/v) ethanol. Then, the air-dried pellet was redissolved in
205µl TE-buffer. To determine the amount and quality of the preparative DNA,
5µl were measured spectrophotometrically at 260nm in a dilution of 1:500 in TE-
buffer. The ratio A260/A280 describes the purity of the sample. Because the DNA
44
was intended to be used for transfection of mammalian cells, the ratio needed to
be >1.8. Otherwise, an additional phenol-chloroform-isoamyl alcohol extraction
(24:24:1, (v/v/v) had to be performed (CHAPTER 3.7.4). 3.7 Protein Methods 3.7.1 Whole-Cell Lysate Preparation Cells were washed with ice cold PBS after treatment and scraped into 1.5ml-
2.0ml Eppendorf tubes using a sterile cell lifter, centrifuged at 2000rpm for 2
minutes at 4°C and the supernatant was discarded. Cells (1-2x10⁶) were
resuspended in 100-200µl lysis buffer (20mM Tris HCl (pH 7.5), 100mM KCl, 20
mM beta-glycerolphosphate, 1mM DTT, 0.25mM Na3 VO4, 10mM NaF, 1mM
and protease inhibitor cocktail complete (Boehringer Ingelheim,
Mannheim/Germany), and the cell lysis was prepared by thaw-freeze-cycle
extraction. All working steps were performed on ice. Three thaw-freeze-cycles
have been carried out on dry ice and a 37°C waterbath in rotation, thereby the
cell debris was never warmed up over 4°C. The debris was centrifuged at 13,000
rpm at 4°C and the supernatant was transferred into new Eppendorf tubes;
aliquots for protein measurements were taken before the samples were stored at
-20°C.
6x SDS-Loading-buffer
1.95ml 1M Tris pH 6,8
0.9g SDS
1.5ml -Mercaptoethanol
5% Bromphenolblue
ad 5ml dd H2O
Lysis-buffer
20mM Tris HCl (pH 7.5)
100mM KCl
20mM beta-glycerolphosphate
1mM DTT, 0.25mM Na3 VO4
10mM NaF
1mM EDTA
1mM EGTA
1mM PMSF
10mM Na-pyrophosphate
10nM Okadaicacid and protease
inhibitor cocktail complete
45
After having determined protein concentrations of each sample using the
Bradford method, 6x SDS-Loading-buffer was added to the lysate. The suitable
amount of protein was loaded on a SDS-PAGE.
3.7.2 Quantification of proteins For the quantification of proteins the Bradford method was performed using a
ready mixed dye from BIO-Rad. The dye containing Coomassie brilliant blue
G250 binds to aromatic and basic amino acids. Each sample was measured 3 to
4 times and averages over all measurements were used to calculate the
concentration. 1-12µg BSA per ml were used for the standard curve. The color
has been allowed to develop for at least 5 minutes, but not longer than 30
minutes. The measurements were performed in a spectrophotometer at 595nm.
3.7.3 SDS-PAGE
Polyacrylamide-gel-electrophorese (SDS-PAGE) was used to separate proteins
by molecular weight. The SDS-PAGE contains a lower phase, separating-gel and
an upper phase, the stacking-gel. All ingredients needed for the chosen
percentage were mixed and poured quickly into the gel casting (Hoefer 600
vertical Amersham Bioscience). Approximately 2 centimeters below the bottom of
the comb were left for the stacking gel. For the polymerization process water
saturated butanol was used to layer the top of the gel. The layer also removed
the bubbles at the top of the gel and ensured that this part did not dry out. 30
minutes were needed for the gel to polymerize completely. The use of fresh
ammonium persulfate usually leads to a quick gel polymerization and is therefore
more reliable. While waiting for polymerization of the separating-gel or running-
gel, the reagents for the stacking-gel were mixed. After the running gel was
polymerized, butanol was washed out completely. Quickly after pouring the
stacking gel the combs were inserted and the gel polymerized within 30 minutes
46
to 1 hour. The percentage of acrylamide was chosen based on the molecular
weight range of the expected proteins:
% Gel M.W. Range
8 50 kDa - 500 kDa
10 20 kDa - 300 kDa
12 10 kDa - 200 kDa
15 3 kDa - 100 kDa
After polymerization the gel casting was stored at 4°C or used immediately. Before usage, the comb was removed and the pockets were washed with SDS-running buffer. The equipment used for electrophoresis was the electrophoresis system Hoefer 600 vertical from Amersham Bioscience. Samples and marker were loaded and 10-15mA were initially applied to collect the samples until they reached the border of the stacking-separation gel. Then, 20-30mA were used to separate the proteins. The cooling system of the electrophoresis system was used to avoid heating of the gel. A Rainbow marker (Amersham) was also loaded and used to determine the size of proteins and to observe the separation process. Unloaded gel pockets were filled with 1X SDS-loading buffer. For overnight electrophoresis, 40 volts were constitutively applied until the next morning. Examples of recipes for Polyacrylamide-gels:
1x SDS-Running buffer 25mM Tris Base pH 6.8 192mM Glycin 3.7mM SDS
47
3.7.4 Protein transfer Proteins were transferred to nitrocellulose membranes (0.2µm or 0.4µm) from Schleicher & Schuell (Dot Scientific, Inc.) using a protein wet transfer chamber from BIO-RAD (Trans-blot-cell wet transfer apparatus). 3 Liters of 1X transfer buffer were prepared and filter paper (4 sheets for each gel) was cut according to the size of the membrane. The gel was transferred for 1 minute in a plastic container containing 1X transfer buffer. The gel was then placed bubble-free in a sandwich-blotting chamber. Order:
Cathode Spanch-pad 2 times 3MM filter paperpolyacrylamid-gel nitrocellulose-membran 2 times 3MM filter paper Spanch-pad Anode
Transfer conditions used: 2 hours 75V and 14V overnight.
After transfer the blotted membrane was stained with Ponceau S solution from
Sigma to determine a successful delivery of proteins to the membrane. The
staining on the membrane was removed by using TBST-buffer for 10-15 minutes
on a shaker.
1X Transfer-buffer
25mM Tris Base
187mM Glycin
20% (v/v) Methanol
20x TBS
1M Tris/ HCl pH 7.4
3M NaCl
TBST
0.02% Tween-20 in
1x TBS
Proteins from lysates were separated by using 15% SDS-PAGE for 4EBP and
Akt immunoblotting, 12% SDS-PAGE for p70S6K, AMPK and S6 immunoblotting,
8% SDS-PAGE for TSC2 and 6% SDS-PAGE for mTOR immunoblotting.
48
3.7.5 Immunoblotting and Development The membrane was transferred to a small container containing blocking milk
solution and incubated for 1-1.5 hours at room temperature on a shaker to
decrease unspecific binding of the primary antibody. Immediately after blocking,
the diluted primary antibody-blotting solution was added and incubated in a
closed plastic container either at room temperature for 2 hours or at 4°C
overnight. The next step included three washing steps in TBST for 15 minutes.
After washing the membrane, the secondary antibody was incubated for 2
hours at 22°C and washed again three times with TBST for 15 minutes.
For developing the membrane the Western-Blot detection kit ECL reagent
1+2 from Amersham was used according to the manual.
Blocking solution
5% dry milk
1% BSA (fraction V, Sigma)
0.2% Tween-20 in 1X TBS
The phosphospecific antibody was always used in the first round of
immunoblotting. After stripping the membrane with stripping buffer (62mM Tris
HCl (pH 6.8), 100mM beta-mercaptoethanol, 2% SDS) the antibodies that
recognized the total amount of the specific protein were used.
The 0 to 45kD size range sections of the membranes were blotted with p-
4EBP1 or p-S6 and after stripping with 4EBP1-regular or S6-regular antibodies.
The 30-220kD sections of the membranes were blotted with p-Akt, p-p70S6K or
p-TSC2 antibodies. After stripping the membrane blots were immunoblotted
again with corresponding regular antibodies Akt, p70S6K and TSC2.
Immunobotting with beta-actin served as protein loading control.
49
3.7.6 Immunoprecipitation Immunoprecipitation is a technique that permits the purification of specific
proteins for which an antibody has been raised. This primary antibody is either
already bound to agarose or can be bound to protein A/G agarose beads during
the procedure in order to physically separate the antibody-antigen complex from
the remaining sample.
Adherent cells were washed twice on the plate with ice-cold PBS and
drained off PBS. Lysis-buffer (1-1.5ml) was added to the cells (1-1.5x10⁶) and
the adherent cells were scraped into a 2ml Eppendorf tube and the suspension
was incubated on either a rocker or an orbital shaker at 4°C for 15 minutes to
lyse the cells. The lysate was centrifuged at 14,000 x g in a pre-cooled centrifuge
at 4°C for 15 minutes. Immediately after transfer the supernatant fraction was
transferred to a fresh centrifuge tube and the pellet was discarded. To prepare
protein A or G agarose/sepharose, the beads were washed twice with PBS and
restored to a 50% (v/v) slurry with PBS solution.
The cell lysate was pre-cleared by adding 100 microliters of either protein
A or G agarose/sepharose beads slurry (50%) per 1 ml of cell lysate and
incubated at 4°C for 10 minutes on a rocker or orbital shaker. Pre-clearing the
lysate reduced non-specific binding of proteins to agarose or sepharose when it
was used later on in the assay. The protein A or G beads were removed by
centrifugation at 14,000xg at 4°C for 10 minutes and the supernatant was
transferred to a fresh centrifuge tube.
To determine the protein concentration of the cell lysate a Bradford assay
was performed (CHAPTER 3.7.2). The cell lysate was diluted at least 1:10 before
determining the protein concentration because of the interference of the
detergents in the lysis buffer with the Coomassie-based reagent. The cell lysate
was diluted to approximately 1mg/ml total cell protein with PBS to reduce the
concentration of the detergents in the buffer.
The recommended volume of the immunoprecipitating antibody was
added to 1ml of cell lysate. The optimal amount of antibody that quantitatively
immunoprecipitated the protein of interest was empirically determined for each
cell model. The cell lysate/antibody mixture was incubated overnight at 4°C using
50
an orbital shaker. Capturing the immunocomplex was performed by adding 100
microliters protein A or G agarose/sepharose bead slurry (50 microliters packed
beads) and gently rocking on an orbital shaker for 2 hours. The
agarose/sepharose beads were collected by pulse centrifugation (5 seconds in
the microcentrifuge at 14,000 rpm) and the supernatant fraction was discarded.
Beats were washed 3 times with 500µl ice-cold washing buffer. Agarose beads
were resuspended in 2x Laemmli sample buffer and boiled for 5 minutes to
dissociate the immunocomplexes from the beads.
The beads were then collected by centrifugation and an SDS-PAGE was
performed with the supernatant fraction. Alternatively, the supernatant fraction
was transferred to a fresh microcentrifuge tube and stored frozen at -20°C for
later use. Frozen supernatant fractions were reboiled for 5 minutes directly prior
to loading on a gel.
Lysis buffer:
20mM Tris
150mM NaCl
1mM MgCl2
1mM DTT
50mM beta-glycerolphosphate
50mM NaF
1mM PMSF
1% NP40
10% Glycerol
Protease inhibitor cocktail
Wash-buffer:
20mM HEPES
150mM NaCl
50mM NaF
1mM EDTA
1% NP 40
1mM DTT
50mM beta-
glycerolphosphate
Protease inhibitor cocktail
Immunoprecipitation and Immunoblotting of MEFs:
1.5x10⁶ primary DKO (Akt1-/-Akt2-/-) and WT (Akt1+/+Akt2+/+) MEFs (passage
3) were plated in 15-cm-plates in DMEM 10% FBS and deprived of serum for
24h. The cells were lysed after treatment for 30 min or 60 min with DMEM
containing 20% FBS. Cell lysates were prepared in 1000µl lysis buffer. Lysates
were incubated with the precipitating antibody TSC2/tuberin (1:200) overnight,
followed by 2h incubation with 30µl of protein A/G plus agarose affinity gel slurry
51
from Santa Cruz Biotechnology (Santa Cruz, CA). The immune complex was
then washed 5 times with wash buffer and boiled in 2x Laemmli sample buffer.
The whole sample volume was used to separate the proteins by a 6% SDS-
PAGE. Proteins were then transferred to nitrocellulose membranes (0.2µm), the
66-220kD sections of the membranes were blotted with Phospho-Akt-S/T-
substrate antibody and after stripping membranes were probed with TSC2-
regular.
3.8 Adenine nucleotide analysis
Adenine nucleotide measurements and statistical analysis:
1-2x10⁶ cells were quickly harvested into PBS buffer (100 mM Tris-HCl (pH
7.75), 4mM EDTA) and immediately centrifuged for 2 minutes at 1,000g (4ºC).
Pellets were resuspended in 150µl PCA (Perchloracetic acid, 4% (v/v) and
incubated on ice for 30 minutes. Within 1h the pH of the lysates was adjusted
between 6 and 8 using a solution made of 2M KOH/ 0.3M MOPS and incubated
for 30 minutes on ice. Precipitated salt was separated from the liquid phase by
centrifugation at 13,000g for 10 minutes. Aliquoted samples were stored at
-80°C.
Adenine nucleotide measurements were conducted using an HPLC (high
pressure liquid chromatography, HPLC-Pro Star from Varian, Walnut Creek, CA).
Samples were eluated after 17 min with a flow rate of 1.0mL/ min (isocratic
eluation) and nucleotides were detected spectrophotometrically at λ=254 nm
(separation column: Spherisorb, ODS II, 5 mm, 0.46 x 25 cm, Z22.697-1, Sigma).
The order of eluated nucleotides was ATP, ADP and AMP. Internal standards
with known nucleotide concentrations (7.5 µM ATP, ADP and AMP in ddH2O)
were used to quantify the samples. HPLC running buffer (mobile phase)
contained 25mM Na4P2O7, 10 H2O, 25mM H4P2O7, the pH was adjusted to 5.75
with a saturated solution of Na4P2O7.
52
4. Results
4.1 Cellular atrophy of skeletal muscle and impaired mTOR activity in Akt1/Akt2 DKO cells
4.1.1 Cellular atrophy of skeletal muscle in Akt1/Akt2 DKO cells
Embryos were dissected from anesthetized females. Embryos and newborn were
perfused and embedded in paraffin. Sections of 5-7 µm were stained with
hematoxylin and eosin. The muscle fiber cross-sectional area and fiber diameter
were measured from presternum, intercostal muscle and diaphragm. Digitized
muscle images were taken, and size (diameter) of individual cells were
determined by the number of pixel within manually outlined fiber boundaries
(Figure 6B, (Peng et al. 2003)).
The histopathological analysis revealed that skeletal muscle tissues in
DKO E18.5 embryos and newborn are significantly thinner than those of WT and
DHet (double heterozygote) littermates (Figure 6A, (Peng et al. 2003)). This is
mostly caused by cellular atrophy. Interestingly, there is not a significant
decrease in the number of muscle fiber, at least in the respiratory muscle,
whereas the size of the individual muscle is markedly decreased. Notable, the
diaphragm of the DKO mice is extremely thin. Calculation of the relative cross-
section area (described above) of individual muscle cells in the diaphragm and
presternum as well the diameter of the intercostal muscle showed that DKO
muscle are ~50% smaller than WT cells and DHet cells are of intermediate size.
These results established genetic evidence that Akt is required for
determining cell growth or cell mass in mammalian cells (Peng et al. 2003).
4.1.2 Status of mTOR-activity in AKT1/AKT2 DKO cells The results of the skeletal muscle DKO cells showed severe muscle atrophy. The
mTOR pathway has been shown to determine that cell mass in particularly
skeletal muscle (Bodine et al. 2001; Rommel et al. 2001; Fingar et al. 2002;
Pallafacchina et al. 2002).
53
Figure 6: Skeletal muscle atrophy in Akt1/Akt2 DKO mice. (A) Image of standard H&E-staining diaphragms from WT, DHet and DKO E18.5 littermate embryos (630x magnification). (B) Histograms show the size and diameter of muscle cells. Digitized images of skeletal muscle were analyzed as described in chapter 4.1.1. Results are mean±S.E.M., expressed as the number of pixels in cross-sectional areas of diaphragm and presternum muscle cells or within the width of intercostals muscle. Twenty cells in three random fields were analyzed for each. (The figure is part of Dr. Xiao-ding Peng�s results, (Peng et al. 2003)).
Gingras et al. have shown that Akt is upstream of mTOR (Gingras et al.
1998) and mTOR�s ability to determine the cell size is dependent on its
downstream effectors, 4EBP1 and S6K1, that regulate protein synthesis (Dufner
and Thomas 1999). Those facts are critical findings that led to the investigation of
mTOR activity in Akt1/Akt2 KO cells compared to WT cells. The neonatal lethality
54
of Akt1/Akt2 DKO mice precludes the analysis of the Akt-mTOR pathway in
skeletal muscles of DKO mice.
Mouse embryo fibroblasts were isolated using the protocol described in
Material and Methods (CHAPTER 3.4). Isolated MEFs (mouse embryo
fibroblasts) from WT and Akt1/Akt DKO cells were plated and expanded for 3-5
days before the mTOR activity experiment was conducted. For serum stimulation
of WT and Akt1/Akt DKO cells, 1.5x10⁶ primary MEFs (passage 4) were plated in
15-cm-plates in DMEM with 10% FBS and deprived of serum for 24h. Cells were
then stimulated with 20% FBS for 30 and 60 min. Cell lysates were subjected to
immunoblot analysis (CHAPTER 3.8).
Total Akt expression, measured by anti-Akt antibody that recognize all
three isoforms of Akt, in WT compared to Akt1/Akt2 DKO MEFs reflects the
status of knockout in MEFs on the protein level. The remaining Akt3 isoform is
expressed at a much lower level than Akt1 or Akt2 isoforms (Figure 7, compare
lane1 with lane 2, and lanes 3-5 with lanes 6-8. Akt activity, measured by anti-
phospho Akt Serine 473 in Akt1/Akt2 DKO MEFs, is almost diminished in
proliferating cells (Figure 7, compare lane 1 with lane 2) compared to the WT, but
after 30 minutes serum induction with DMEM/20% FBS, there was Akt activity
(phosphorylation) due to the remaining Akt3 isoform in Akt1/Akt2 DKO cells
(Figure 7, lane 7). After 60 minutes this phophorylation of Akt in Akt1/Akt2 DKO
cells was completely abolished (Figure 7, lane 8).
Using antibodies against phospho-Ser65 of 4EBP1 and phospho-Thr389
of S6K, the steady-state levels of phosphorylation 4EBP1 and S6K in
proliferating WT and Akt1/Akt2 DKO MEFs were examined. There is a marked
reduction of mTOR activity measured by phosphorylation status of 4EBP1 and
S6K in Akt1/Akt2 DKO cells (Figure 7, lanes 1 and 2).
55
Figure 7: mTOR activity in WT and Akt1/Akt2 DKO MEFs. Phosphorylation and protein levels were determined by immunoblotting. (Lanes 1/2) Proliferating (P) cells (passage 4) were plated in DMEM/10% FBS and analyzed 24h after plating. (Lanes 3,6) Primary wild type (WT) and Akt1/Akt2 DKO MEFs were plated in DMEM/10% FBS for 24 h, then deprived of serum for 24 h. (Lanes 4,5,7,8) after serum deprivation, cells were stimulated with DMEM/20% FBS for 30 or 60 min, respectively. Cell lysates isolated prior (0�) and 30� and 60� following serum stimulation were subjected to immunoblotting using anti-p-Akt-S473, anti-p4E-BP1-S65, anti-p-S6K-Th389, anti-pan-Akt, anti-pan-S6K, anti-pan-4EBP1 and anti-β-actin (loading control) antibodies.
The reduction in 4EBP1 phosphorylation was also visible by different
migrating forms of 4EBP1 or mobility shift detected by anti-4EBP1 antibodies.
Hyperphosphorylated 4EBP1 migrates slower on a SDS-Page than
hypophsphorylated 4EBP1. In proliferating Akt1/Akt2 DKO cells the faster
migrating, hypophosphorylated form of 4EBP1 was predominant, whereas in
56
proliferating WT cells the slower migrating form was more dominant (Figure 7,
lanes 1 and 2).
Stimulation of serum deprived WT and Ak1/Akt2 DKO cells with DMEM
containing 20% FCS for 30 and 60 min showed a severely impaired mTOR
activity in DKO cells, measured by 4EBP1 phosphorylation (Figure 7, lanes 6-8).
Under this condition the S6K1 phosphorylation was not impaired, suggesting
there may have been another kinase phosphorylating this kinase, or the
threshold of Akt activity for S6K1 phosphorylation was relatively low (Figure 7,
lane 6-8). It was recently shown that PDK1 and PKCζ are able to mediate Thr
389 phosphorylation in an mTOR dependent manner (Romanelli et al. 2002).
The total protein level was determined using method in chapter 3.8. by
anti-β-actin antibody to confirm equal protein levels in each sample (Figure 7,
lanes 1-2).
This result established the first genetic evidence that Akt is required for
mTOR-mediated phosphorylation.
4.1.3 Status of TSC2 phosphorylation by Akt in Akt1/Akt2 DKO MEFs Akt was shown to phosphorylate and inactivate TSC2 (Inoki et al. 2002; Manning
et al. 2002; Potter et al. 2002) and thereby activating mTOR. In Chapter 4.1.2.it
was shown that in mouse embryo fibroblasts (MEF), deficient for Akt1 and Akt2,
mTOR activity is impaired, as measured by 4E-BP1 phosphorylation following
serum stimulation (Figure 7). The same experimental set up as described in
chapter 4.1.2 was used to investigate TSC2 phosphorylation on Threonine 1462,
which is directly phosphorylated by Akt (Inoki et al. 2002) in Akt1/Akt2 DKO
MEFs compared to WT cells using immunoblotting analysis.
57
Figure 8: TSC2 phosphorylation in WT and Akt1/Akt2 DKO cells, immunoblotting. Phosphorylation and protein levels were determined by immunoblotting. (Lanes1,2) Proliferating (P) cells (passage 4) were plated in DMEM/10% FBS and analyzed 24h after plating. (Lanes 3,6) Primary wild type (WT) and Akt1/Akt2 DKO MEFs were plated in DMEM/10% FBS for 24 h, then deprived of serum for 24 h. (Lanes 4,5,7,8) after serum deprivation, cells were stimulated with DMEM/20% FBS for 30 or 60 min, respectively. Cells lysates isolated prior (0�) and 30� and 60� following serum stimulation were first subjected to immunoprecipitation with anti-phospho-TSC2-Thr 1452 and anti-pan-TSC2-antibodies.
Figure 9: TSC2 phosphorylation in WT and Akt1/Akt2 DKO cells, immunoprecipitation. Primary WT and Akt1/Akt2 DKO MEFs were deprived of serum for 24 h and then stimulated by addition of 20% FBS. Cells lysates isolated prior (0�) and 30� and 60� following serum stimulation were first subjected to immunoprecipitation with anti-TSC2 antibodies. Immunoprecipitates were then subjected to immunoblotting using anti-Akt-p-S/T substrate and anti-TSC2 anti-bodies.
58
Proliferating Akt1/Akt2 DKO cells have a decreased phosphorylation on this site,
measured by anti-phospho-TSC2-Thr1462 antibody (Figure 8, lanes 1 and 2),
correlating with the Akt activity shown in Figure 7, lanes 1 and 2. Induction of the
Akt-mTOR pathway after growth factor starvation with 20 % serum also showed
a correlating result of phosphorylation on TSC2 Threonine 1462 (Figure 8, lanes
3-8).
Because TSC2 displays four important phosphorylation sites for Akt
(Threonine 1462, Serine 939, Serine 1086 and Serine 1088, (Inoki et al. 2002)),
the measurement of only one site wouldn�t show the status of TSC2
phosphorylation by Akt. Therefore, TSC2 was immunoprecipitated by anti-TCS2
antibody in WT and Akt1/Akt2 DKO MEFs after 24 hours growth factor starvation
and induction with DMEM containing 20% serum for 30 and 60 minutes.
Equal amounts of protein were subjected to an SDS-Page and
immunoblotted with anti-phospho-Serine/Threonine Akt substrate antibody.
Figure 9 shows the results by measuring all Akt-phosphorylation sites on TSC2.
There was almost no reduction of phosphorylation of the Akt-sites on TSC2 in
Akt1/Akt2 DKO MEFs compared to the WT. The functions of those sites are not
clear yet (Hay and Sonenberg 2004), it was shown that the phosphorylation by
Akt disrupts the association of TSC2 with TSC1 and causes increased mTOR
activity (Dan et al. 2002; Inoki et al. 2002; Potter et al. 2002,; Tee et al. 2002). It
raises the question, of the importants of this step for the actual mTOR activity
and if there is another mechanism by which Akt affects mTOR activity. 4EBP1
phosphorylation was dramatically reduced in Akt1/Akt2 DKO cells (Figure 7), but
phosphorylation of all Akt-sites on TSC2 was not impaired (compare Figure 7
and Figure 9).
These results suggest; first, that the remaining Akt3 activity in Akt1/Akt2
DKO cells (Figure 7) is sufficient to elicit significant TSC2 phosphorylation and
second, that TSC2 phosphorylation may not be sufficient for Akt to fully activate
mTOR. Thus, these results led to the hypothesis that an additional function of
Akt, which was required to fully activate mTOR, and was impaired in Akt1/Akt2
DKO cells.
59
4.2 Akt maintains the intracellular level of ATP and regulates AMPK activity
4.2.1 Akt deficiency significantly reduce intracellular ATP level and increases AMP/ATP ratio
It was shown that mTOR activity is dependent on the intracellular ATP level
(Dennis et al. 2001), and it was suggested that this is due to the low KM of
mTOR-kinase-activity for its substrate ATP for. However, another recent
publication linked AMPK to TSC2, showing that TSC2 is phosphorylated by
activated AMPK, which in turn leads to inhibition of mTOR-activity (Inoki et al.
2002).
Figure 10: ATP level is reduced in Akt1/Akt2 DKO cells vs. WT. Primary WT and Akt1/Akt2 DKO MEFs were plated in 10% FBS and deprived of serum for 24h. Cells were stimulated with 10% FBS, 20% FBS for 60 min or insulin 1µg/ml, and intracellular ATP concentrations were analyzed by HPLC as described in Methods. Results represent the average of three independent experiments (Error bars indicate SD).
60
Figure 11: ATP level in cells expressing activated Akt vs. control cells. To eliminate the rate-limiting step in the activation of Akt, a myristoylation signal was linked in frame to the amino-terminus of Akt. This constitutively activated form of Akt, termed mAkt, still requires the phosphorylation of the serine and threonine residues for full activation. Proliferating Rat1a and Rat1a-mAkt cells were analyzed for intracellular ATP concentrations analyzed by HPLC as described in Methods. Results represent the average of three independent experiments (Error bars indicate SD).
It was also shown before, that cells expressing activated Akt have significantly
higher levels of ATP compared to control cells (Figure 11, (Gottlob et al. 2001)).
To underlie this observation the experiments were setup to determine whether
cells deficient for Akt have a reduced level of the intracellular ATP.
For serum or insulin stimulation of WT and Akt1/Akt2 DKO cells, 1.5x10⁶ primary
MEFs (passage 4) were plated in 15-cm-plates in DMEM with 10% FBS and
deprived of serum for 24h. Cells were stimulated with insulin (1µg/ml), 10% FBS
and 20% FBS for 60 min and intracellular ATP, ADP and AMP concentrations
were analyzed by HPLC (described in CHAPTER 3.9).
61
Figure 12: AMP/ATP ratio in Akt1/Akt2 DKO cells vs. WT. Primary WT and Akt1/Akt2 DKO MEFs were subjected to analysis as described in and AMP/ATP ratio was calculated using intracellular ATP and AMP concentration.
As shown in Figure 10, the ATP level is lower in serum deprived Akt1/Akt2
DKO cells when compared to WT cells. Following insulin or serum stimulation the
ATP level was increased in WT cells, whereas in Akt1/Akt2 DKO cells, it was
retained at a markedly reduced level, 2-3 fold lower than in WT cells.
The activity of AMPK is dependent on the AMP/ATP ratio (Hardie et al.
1998; Kemp et al. 1999). To determine a potential link for the regulation of AMPK
by Akt activity, the AMP/ATP ratio was more suitable than only the ATP
concentration. Figure 12 shows the ratio of AMP/ATP (under the same condition
as described above). Akt1/Akt2 DKO cells exhibited a higher AMP/ATP ratio
compared with WT under starvation condition and under serum/insulin
stimulation. The AMP/ATP ratio was consistent with the lower ATP level in
Akt1/Akt2 DKO cells (Figure 10), except under starvation conditions. The
AMP/ATP ratio in WT cells was also elevated. Under growth factor starvation Akt
was not active. These results demonstrate, that Akt is required to maintain the
intracellular level of ATP and thereby to decrease the AMP/ATP ratio.
The ratio of AMP/ATP was markedly higher in Akt1/Akt2 DKO cells in the
presence of growth factors when compared with WT cells (Figure 12).
Investigation of AMPK activity in Akt deficient cells in the presence of growth
factor and under growth factor withdrawal was the next step to establish a
functional link between Akt and AMPK.
1.5x10⁶ primary Akt1/Akt2 DKOs and WT MEFs (passage 4) were plated
in 15-cm-plates in DMEM with 10% FBS and deprived of serum for 24h. For
Western analysis Akt1/Akt2 DKO and WT MEFs were harvested under
proliferating conditions in the presence of growth factor and after growth factor
starvation. After quantification of the protein content, equal amounts of lysate
were subjected to a SDS-page and immunoblotted (CHAPTER 3.8) with different
antibodies (Figure 13).
Total Akt expression, measured with anti-Akt antibody that recognized all
three isoforms of Akt, reflects the knockout status in Akt1/Akt2 DKOs and WT
MEFs on the protein level (Figure 13 compare lanes 1-3 with lanes 2-4). The
remaining Akt expression in Akt1/Akt2 DKO MEFs was due to the Akt3 isoform.
In the presence of growth factor and using anti-phospho Akt Ser473 antibody,
Akt activity was retained in WT cells (Figure 13, lane1), whereby in Akt1/Akt2
DKO MEFs the phosphorylation on this site was abolished (Figure 13, lane2).
After growth factor starvation Akt-activity measured with anti-phospho Akt for
Serine 473 was abolished in both Akt1/Akt2 DKO and WT MEFs (Figure 13, lane
3-4).
The question was, if growth factor/serum withdrawal and decreased Akt-
activity had an impact on AMPK activity? Indeed, the AMPK activity, as
measured by its phosphorylation on Thr172 (Hawley et al. 1995) and by the
phosphorylation of the AMPK target Acetyl-CoA carboxylase (ACC) on Ser79 (Ha
et al. 1994), was markedly increased in Akt1/Akt2 DKO cells when compared
with WT cells in the presence of serum (Figure 13, lanes 1-2). Serum withdrawal
also increase of AMPK activity in WT MEFs, which established that this effect
was growth factor dependent, measured by the phosphorylation of the AMPK
target Acetyl-CoA carboxylase (ACC) on Ser79 (Ha et al. 1994). Results show
that Akt is required to maintain low AMPK activity.
63
Figure 13: AMPK activity in Akt1/Akt2 DKO cells vs. WT. Cell lysates from primary WT and Akt1/Akt2 DKO MEFs grown in 10% FBS or in 0.1% FBS (serum deprived) for 24h were subjecting to immunoblotting using anti-pan Akt, anti-p-Akt-S473, anti-p-ACC-S79, anti-p-AMPK-T172, and anti-AMPK antibodies.
4.2.3 Expression of activated Akt increases intracellular ATP level, reduces AMP/ATP ratio and affects AMPK activity
To eliminate the rate-limiting step in the activation of Akt, a myristoylation signal
was linked in frame to the amino-terminus of Akt. This constitutively activated
form of Akt, termed mAkt, still requires the phosphorylation of the serine and
threonine residues for full activation (Kandel and Hay 1999).
Cells that express activated myristoylated Akt have a significantly higher level of
ATP (Gottlob et al. 2001 , Figure 11) . To confirm this result, the intracellular level
of ATP in proliferating Rat1a cells was compared to Rat1a cells expressing the
myristoylated, activated form of Akt was measured by using HPLC (see
64
CHAPTER 3.9). Figure 11 shows an approximately 2-fold higher intracellular
level of ATP in Rat1a cells expressing activated Akt when compared to control
cells.
1.5x10⁶ Rat1a and Rat1mAkt were plated in 10-cm-plates in DMEM with
10% FBS. For western analysis and adenine nucleotide analysis, Rat1a and
Rat1mAkt cells were harvested under proliferating conditions in the presence of
growth factor and after growth factor starvation. After quantification of the protein
content, equal amounts of lysate were subjected to a SDS-page and
immunoblotted (CHAPTER 3.8) with several antibodies (Figure 15).
Adenine nucleotide analysis using HPLC showed that the AMP/ATP ratio in
Rat1a cells expressing activated Akt (Rat1a-mAkt) was about 3-fold lower than in
control cells (Figure 14) in the presence or in the absence of serum.
Comparison of Western analysis and adenine nucleotide analysis shows
that when control Rat1a cells were deprived of serum, the AMP/ATP ratio was
markedly increased with a concomitant increase in AMPK activity as measured
by phosphorylation of AMPK on Thr172 (Hawley et al. 1995) (Figure 14 and
Figure 15, lane 3).
Figure 14: AMP/ATP ratio in cells expressing activated Akt vs. control cells. Rat1a and Rat1a-mAkt cells grown in DMEM/10 % FBS or in DMEM/0.1% FBS (serum deprived) for 48 h were subjected to ATP and AMP analysis and AMP/ATP ratios were determined.
65
Figure 15: AMPK activity in cells expressing activated Akt vs. control cells and correlation with mTOR activity. Cell lysates from proliferating and serum deprived Rat1a and Rat1a-mAkt cells were subjected to immunoblotting using anti-p-Akt-S473, anti-p-TSC2-T1462, anti-pAMPK-T172, anti-AMPK, anti-p-S6K1-T389, anti-p-4EBP1-S65 , anti-4EBP1 and anti-β-actin antibodies.
66
However, although the AMP/ATP ratio was also increased in Rat1a-mAkt
cells, this increase did not significantly exceed the AMP/ATP ratio of the control
cells in the presence of serum. Thus, AMPK activity was not significantly
increased (Figures 14 and 15 lane 4), because cells that maintain an AMP/ATP
ratio below a certain threshold level also displayed high mTOR activity (Fig. 14
and 15 lanes 1, 2, 4). The increase in AMP/ATP ratio and AMPK activity
correlated with a decrease in mTOR activity, as determined by S6K1 and 4EBP1
phosphorylation and by 4EBP1 mobility shift (Figure 15, lane 3).
This result further established the role of Akt as a regulator of cellular ATP
and AMPK activity. Interestingly, TSC2 phosphorylation by Akt was not impaired
in Rat1-mAkt cells following serum deprivation, while S6K1 and 4EBP1
phosphorylation, although maintained at higher level, was only modestly impaired
(Figure 15 lanes 1 and 3).
4.3 ATP depletion and activation of AMPK attenuates Akts ability to
activate mTOR 4.3.1 ATP depletion in Rat1a cells expressing activated Akt
To find out whether the increase of the intracellular ATP level and the decrease
of the AMP/ATP ratio mediated by Akt is required for Akt to activate mTOR,
activated Akt expressing cells were subjected to ATP depletion using inhibitors of
glycolysis and oxidative phosphorylation.
1.0x10⁶ Rat1aMyAkt cells were plated in 10 cm plates in DMEM (5.5mM
Glucose) with 10% FBS. Before treatment with inhibitors to deplete ATP, cells
were starved for 24h with DMEM (5.5mM glucose) without serum (Figure 16,
lanes 1 and 6). Growth factor withdrawal did not decrease mTOR activity,
measured with anti-phospho-4EBP1 antibody (Figure16, lanes 1 and 6). In cells
expressing activated myristoylated Akt, mTOR was constitutively active even in
the absence of growth factors as determined by 4E-BP1 phosphorylation and
mobility shift ((Gingras et al. 1998) and Fig. 15, 16,18 and 19).
Akt was constitutively active even in the presence of inhibitors of
glycolysis and oxidative phosphorylation (Figure 16, lanes 1-10). The Akt-
67
mediated 4E-BP1 phosphorylation was inhibited when ATP was depleted
following addition of the glucose analogue 5-thioglucose (5,10, 20, 40mM 5-TG)
(Figure 16 lanes 2-5) or the oxidative phosphorylation inhibitor, rotenone (1, 5,
Akt was not changed under this condition (Figure 16).
These results suggest that Akt�s ability to mediate mTOR activity was
dependent on its function to increase the intracellular ATP level, which
subsequently down regulated AMPK.
Figure 16: ATP depletion attenuates the ability of activated Akt to activate mTOR. Rat1a-mAkt cells were plated in DMEM (5.5 mM glucose) with 10% FBS (dialyzed), deprived of serum for 24h, and treated with different concentrations of 5-thioglucose (5-TG) (lanes 1-5) and rotenone (lanes 6-10) for 30min. Cell lysates were prepared from serum starved or treated Rat1a-mAkt cells and subjected to immunoblotting using anti-p-4E-BP1-S65, anti-4E-BP1, anti-pTSC2-T1462, anti-TSC2, anti-p-Akt-S473, and anti-Akt antibodies.
68
4.3.2 ATP depletion of insulin-stimulated Rat1a cells
Proliferating Rat1a cells had a lower intracellular ATP level compared to Rat1 cell
expressing activated Akt (Figure 11). We expected that depletion of ATP in
Rat1a cells after insulin-stimulation would decrease mTOR activity to a higher
extent than in Rat-mAkt cells using the same concentration of inhibitor.
1.0x10⁶ Rat1a cells were plated in 10 cm plates in DMEM (5.5mM
Glucose) with 10% FBS. Before treatment with the inducer of ATP (5-TG)
depletion, cells were starved for 24h with DMEM (5.5mM glucose) without serum
(Figure 17, lane 1). Growth factor withdrawal decreased Akt and mTOR activity,
measured with anti phospho-Akt antibody and anti-phospho-4EBP1 antibody
(Figure 17, lane 1) and stimulation with DMEM (5mM glucose) with 1µg/ml Insulin
induced Akt and mTOR activity (Figure 17, lane 2). The induction of 4EBP1
phosphorylation by insulin was almost abolished by ATP depletion with 20 mM
and 40 mM 5-Thioglucose (Figure 17, lanes 3 �4).
Figure 17: ATP depletion of insulin-stimulated Rat1a cells, and its inhibition of the growth-factors-dependent activation of mTOR. Rat1a cells were plated in DMEM (5.5 mM glucose) with 10% FBS (dialyzed), then deprived of serum for 24h (lane 1). Cells were stimulated with insulin (1µg/ml) for 30min and (lane 2) then either untreated or treated with 5-thioglucose (5-TG) for additional 30min. (20mM�lane 3, 40mM-lane 4).
69
Higher concentrations of 5-TG were required to impair mTOR activity in
cells expressing activated Akt. 4E-BP1 phosphorylation mediated by insulin
stimulation in Rat1a cells was more severely impaired by ATP depletion (Figure
16, lanes 4-5). Furthermore, adding high levels of 2-deoxyglucose (2-DOG) to
cells expressing activated Akt inhibited mTOR activity (data not shown).
However, 100mM 2-DOG that impaired Akt-mediated mTOR activity
could also induce osmotic stress and therefore, we used 5-TG instead. 5-TG was
probably a more effective inhibitor because, unlike 2-DOG, 5-TG is a competitive
inhibitor that cannot be phosphorylated by hexokinase which leads to inhibition of
glycolysis and then ATP depletion.
4.3.3 Activation of AMPK by AICAR in Rat1a cells expressing activated Akt
Recent publications suggest that AMPK (AMP-activated proteinkinase) is
involved in the PI3K/PTEN/Akt pathway (Inoki et al. 2003b; Kimura et al. 2003). It
has been shown that AMPK suppressed protein synthesis through mTOR. For
this study, AICAR (5-aminoimidazole-4-carboxamide-riboside) has been used to
activate AMPK (treatment of animal skeletal muscle). AICAR-treatment resulted
in an activation of AMPK and a reduction in protein synthesis, this decline was
associated with the decreased activation of mTOR (Bolster et al. 2002).
AICAR (5-aminoimidazole-4-carboxamide-riboside) is an adenosine
analogue, which activates AMPK after its phosphorylation to 5-aminoimidazole-4-
carboxamide-ribotide, an AMP analogue. Incubation of the cells with AICAR has
the advantage of activating AMPK without affecting the adenine nucleotide level
(Meisse et al. 2002), thus allowing to investigate the effect on mTOR activity
without ATP depletion.
To determine the possibility that AMPK is a downstream effector of Akt
leading to mTOR activation, 1x10⁶ Rat1a-mAkt cells were deprived of serum and
treated with AICAR, which activates AMPK and was shown to impair insulin-
mediated phosphorylation of S6K1 (Kimura et al. 2003).
As shown in Figure 18, treatment of Rat1a-mAkt cells, in which mTOR is
constitutively active, with increasing concentrations of AICAR elevated AMPK
70
activity, as measured by AMPK and ACC phosphorylation using anti-phospho
Thr172 AMPK and anti-phospho Ser79 ACC antibodies, with a concomitant
decrease of 4E-BP1 phosphorylation.
These results demonstrated that activation of AMPK by AICAR impairs the
constitutive mTOR-activity in Rat1a-mAkt cells.
Figure 18: Dose-dependent activation of AMPK by AICAR. Rat1a-mAkt cells were deprived of serum for 24 h and then treated with increasing concentrations of AICAR for 60 min. Following treatment cell lysates were subjected to immunoblotting using anti-p-AMPK-T172, anti-p-ACC-S79, anti-p-Akt-S473, anti-p-4E-BP1-S65, anti-4EBP1 and anti-β-actin antibodies.
71
4.3.4 Co-expression experiment with constitutively activated AMPK and
4EBP1 A co-expression experiment with a constitutively active form of AMPK (pcDNA3-
Myc-AMPK1312T172D) and 4EBP1 (pcDNA3-HA-4E-BP1), both in pcDNA3
expression vectors using HEK293 and HEK293-mAkt cells expressing activated
myristolyated Akt, was performed. The plasmid pcDNA3-HA-4E-BP1 has been
previously described (Gingras et al. 1998).
The expression vector for the Myc-tagged activated AMPK, pcDNA3-Myc-
AMPK1312T172D was obtained from D. Carling (Woods et al. 2000). This
experiment was performed to further establish the role of AMPK in mediating
mTOR activity by Akt�s ability to increase the intracellular level of ATP.
For transient transfection of HEK293 and HEK293-mAkt cells, 1x10⁶ cells
per 6-cm-plate were plated in DMEM with 10% FBS and transfected without and
with increasing concentrations of pcDNA3-Myc-AMPK1 312Thr172D (15, 20 µg
DNA) and 2.5 µg pcDNA-4EBP1-HA per 1x10⁶ cells using Lipofectamine 2000
(CHAPTER 3.5.2). Lysates were prepared 24 hours after transfection under
proliferation condition in DMEM with 10% FBS.
Whether an activated form of AMPK can alleviate the ability of Akt to
activate mTOR as measured by phosphorylayion of 4EBP1 or 4EBP�s different
migrating forms or mobility shift detected with anti-HA antibody.
Hyperphosphorylated 4EBP1 migrates slower on a SDS-Page than
hypophosphorylated 4EBP1.
In contrast to control HEK293 cells, HEK293-mAkt cells showed
constitutively phosphorylated 4E-BP1 even in the absence of insulin stimulation
(Gingras et al. 1998), compare Figure 19 lanes 1 and 4). Following expression of
form) was impaired (Figure 19 lanes 2-3 and lanes 5-6). Due to higher ATP level
in HEK293-mAkt cells, the effect on 4EBP1 (downshift and phosphorylation) was
less pronounced in HEK293-mAkt cells compared to 293 cells. This result
established the down-regulation of AMPK by Akt as function of increasing ATP-
levels. Activated AMPK inhibits the ability of Akt to activate mTOR.
72
Figure 19: Co-expression of activated AMPK and 4EBP1 in HEK293 and HEK293MAkt cells. HEK293 cells with mAkt (lanes 1-3) or without mAkt (lanes 4-6), were transfected with increasing amounts of constitutively activated AMPK mutant (CA-AMPK) (lanes 2 and 5, 15µg and lanes 3 and 6, 20µg) and HA-4EBP1 (lanes 1-6 2.5µg). Downshift of co-transfected HA-4EBP1 was determined by using anti-HA-antibody. CA-AMPK expression induced, a fast migrating 4EBP1 isoform.
4.4 Reduced AMPK activity by over expression of dominant negative
MEF were infected with high titer pBabe-eGFP-AMPKalpha2-K45R or control
pBabe-eGFP followed by sorting with FACS (using facility at the UIC).
If Akt�s ability to activate mTOR was dependent on its ability to increase the ATP
level and to inhibit AMPK kinase activity, it was expected that inhibition of AMPK
activity in Akt1/Akt2 DKO cells would partially restore the impaired in vivo mTOR
activity as measured by 4E-BP1 phosphorylation (determined by shift of different
forms of 4EBP1 using anti-4EBP1 antibody).
To explore this possibility, cell lines of immortalized Akt1/Akt2 DKO, DKO
(DN-AMPK) and WT MEFs were plated in 15 cm plates in DMEM with 10% FBS.
After one day of proliferation, cells were harvested and lysed.
Immortalized WT and Akt1/Akt2 DKO MEFs (expression of dominant-
negative form of p53) were used. As in primary cells (Figure 7, lanes 1-2), mTOR
activity was impaired in Akt1/Akt2 DKO immortalized cells (Figure 20, lanes 1-2).
74
Figure 20: Expression of dominant-negative AMPK in Akt1/Akt2 DKO cells vs. WT. Cells lysates from proliferating immortalized WT, Akt1/Akt2 DKO, and Akt1/Akt2 DKO expressing Myc-tagged DN�AMPK were subjecting to immunoblotting using anti-Myc 9E10, anti-p-ACC S79, anti-ACC, anti-pS6K1-T389, anti-S6K, anti-pS6-S235/236, anti-S6 and anti-4E-BP1 antibodies.
75
As shown in Figure 20, expression of DN-AMPK in Akt1/Akt2 DKO MEFs
almost restored mTOR activity in proliferating cells as determined by S6K1, S6
and 4EBP1 phosphorylation/shift (Figure 20, lanes 2-3) compared to WT (Figure
20, lane 1).
These results demonstrated that mTOR activity in Akt1/Akt2 DKO cells
was also impaired because of the inability to sufficiently increase the intracellular
ATP level by insulin and growth factors and to decrease AMPK activity.
4.4.2 Increasing expression of dominant negative AMPK in Akt1/Akt2 DKO MEFs restores mTOR activity
To investigate dose dependability in restoring mTOR activity, dominant negative
AMPK and 4EBP1 were co-expressed in AKT1/AKT2 DKO MEFs by using
increasing concentrations of pcDNA3-Myc-AMPKalpha2-K45R (Mu et al. 2001)
and pcDNA3-HA-4EBP1 (Gingras et al. 1998), shown in Figure 18. The amount
of 2.5 µg pcDNA3-HA-4EBP1 and 10, 15 and 20 µg pcDNA3-Myc-AMPKalpha2-
K45R per 1x10⁶ cells were transfected using Lipofectamine 2000 (CHAPTER
3.5.2).
In the absence of DN-AMPK, mTOR activity was reduced (Figure 21, lane
1), measured by phospho-shifting of exogenous HA-4EBP1 using anti-HA
antibody. Increasing expression of DN-AMPK restores mTOR activity, visible by
an up-shift of the hyperphosphorylated form of exogenous HA-4EBP1 (Figure 21,
lanes 2-4).
These results further established a role for AMPK in mediating the energy
response on mTOR under a decreased level of intracellular ATP in Akt1/Akt2
DKO MEFs.
76
Figure 21: Dose-dependent co-expression of dominant-negative AMPK and 4EBP1 in Akt1/Akt2 DKO MEFs. Akt1 and Akt2 DKO MEFs were transfected with increasing amounts of dominant negative AMPK mutant (DN-AMPK) and HA-4EBP1. Up-shift of co-transfected HA-4EBP1 was determined by using anti-HA-antibody. DN-AMPK expression induced slowly migrating 4EBP1-form.
4.5 Akt�s ability to activate mTOR by inhibiting AMPK is dependent on
TSC2 4.5.1 TSC2 deficiency renders cells almost resistant to ATP depletion
It was recently shown that TSC2 is phosphorylated and activated by AMPK,
establishing one potential mechanism by which ATP and AMPK regulate mTOR
activity (Inoki et al. 2003b).
To further confirm this finding of TSC2 as a mediator of cellular energy,
MEFs, which were deficient for TSC2 (TSC2-/-/p53-/- MEFs and TSC2+/-/p53-/-
MEFs), were used to study the Akt-mTOR pathway. TSC2+/-/p53-/- MEFs
expressing TSC2 were used as control cell line, because the wild type was not
available (Figure 22).
A very similar experiment to the experimental set-up in chapter 4.3.1 was
carried out with a TSC2 deficient cell line. 1.0x10⁶ TSC2-/-/p53-/- and TSC2+/-
77
/p53-/- MEFs were plated in 10 cm plates in DMEM (5.5mM Glucose) with 10%
FBS.
Before treatment with inhibitor for ATP depletion (5-Thioglucose and 2-
Deoxyglucose), cells were starved for 24h with DMEM (5.5mM glucose) without
serum (Figure 22, lanes 1 and 5). Growth factor withdrawal decreased Akt and
mTOR activity in TSC2+/-/p53-/- MEFs, measured with anti-phospho-Akt, anti-
phospho-S6K1, anti-phospho-S6, and anti-4EBP1 antibody (Figure 22, lane 5). In
TSC2-/-/p53-/- MEFs, however, there was no reduction of mTOR activity (Figure
22, lane 1) and Akt activity (anti-phospho-Akt antibody) was reduced even in the
presence of insulin (Figure 22, lanes 1-4).
Under stimulation conditions with 1µg Insulin per ml DMEM (5.5mM
glucose), Akt and mTOR activity in TSC2+/-/p53-/- MEFs were induced (Figure
22, lane 6). The induction of 4EBP1 phosphorylation by insulin was highly
reduced by ATP depletion with 50 mM 2-Deoxyglucose and 50 mM 5-
Thioglucose in TSC2+/-/p53-/- MEFs (Figure 22, lanes 7�8). ATP depletion had
only a moderate effect on mTOR activity in TSC2-/-/p53-/- MEFs under these
conditions, suggesting that the ATP level regulates mTOR activity predominantly
through TSC2 (Figure 22, lanes 3-4).
These results clearly demonstrate, that TSC2-/-/p53-/- MEFs are almost
resistant to ATP depletion in comparison to TSC2+/-/p53-/- MEFs, and
furthermore, TSC2 mediates the energy response, which is consistent with
previous results (Inoki et al. 2003b).
78
Figure 22: mTOR activity in TSC2-/- vs. control cells following ATP depletion . mTOR activity in TSC2-/- cells is refractive to ATP depletion. TSC2-/- and TSC2 +/- MEF were plated in DMEM (5.5 mM glucose) with 10% FBS (dialyzed), deprived of serum for 24h. Cells were stimulated with insulin (1µg/ml) for 30min and then either untreated or treated with 2-deoxyglucose (2-DOG, 50mM) or 5-thioglucose (5-TG, 50 mM) for additional 30min. Cell lysates from serum deprived cells (lanes 1 and 5), insulin stimulated cells (lanes 2 and 6), insulin stimulated, 2-DOG treated cells (lanes 3 and 7), and from insulin stimulated 5-TG treated cells (lanes 4 and 8) were subjected to immunoblotting using anti-p-Akt-473, anti-pan-Akt, anti-p-TSC2-T1462, anti-pS6K1-T389, anti-S6K, anti-pS6-S235/236, anti-S6, anti-4E-BP1 and anti-β-actin antibodies.
79
4.5.2 TSC2 KO cells exert a high AMP/ATP ratio and the expression of activated Akt is able to decrease this ratio
Interestingly, in TSC2-/-/p53-/- MEFs, there was a pronounced reduction of Akt
activity (see Figure 22, lanes 1-4). Akt activity mediated by insulin and growth
factors has been found to be significantly diminished in cells lacking TSC1
(Kwiatkowski et al. 2002) or TSC2 (Jaeschke et al. 2002).
If Akt activity was required to maintain the intracellular level of ATP, it was
expected that the AMP/ATP ratio in TSC2-/-/p53-/- MEFs compared to control
cells would be increased and that over expression of the activated form of mAkt
in TSC2-/-/p53-/- MEFs would restore the AMP/ATP ratio to the level of control
cells.
Figure 23: AMP/ATP ratio in TSC2-/-, mAkt-TSC2-/- and TSC2-/+ cells. ATP and AMP levels were analyzed in a TSC2-/- MEF, TSC2-/- polyclonal MEF cell line expressing mAkt, and TSC2+/- MEFs as described in Fig. 14. AMP/ATP ratios were determined and the results represent the average of three independent experiments (+/-SD).
80
Figure 24: Akt and AMPK activity in TSC2-/-, mAkt-TSC2-/- and TSC2-/+ cells. Cells lysates from TSC2-/- MEFs, a TSC2-/- polyclonal MEF cell line expressing mAkt, and TSC2+/- MEFs were subjected to immunoblotting using anti-TSC2, anti-pan-Akt, anti-p-Akt-S473, anti-p-AMPK-T172, anti-AMPK, anti-p-ACC-S79, anti-p-S6K1-T389, anti-p-4E-BP1-S65, anti-4E-BP1, and anti-β-actin antibodies.
Figure 23 shows the AMP/ATP ratio of TSC2-/-/p53-/-, mAkt-TSC2-/-/p53-
/- and TSC2-/+/p53-/- MEFs under proliferating condition in DMEM (5.5mM
Glucose) with 10% FBS, measured by HPLC (see CHAPTER 3.9). In addition,
cells under this condition were taken and lysed for immunoblotting analysis as
81
shown in Figure 24.
The AMP/ATP ratio and AMPK activity, measured by anti-phospho-AMPK
antibody at Threonine172 (Hawley et al. 1995), was markedly higher in TSC2-/-
/p53-/- cells when compared to TSC2+/--/-/p53-/- cells (Fig. 23 and Fig. 24, lanes
1 and 3). The higher AMP/ATP ratio and higher AMPK activity in TSC2 -/-/p53-/-
cells could be due to a reduced Akt activity in these cells (Figure 22, lanes1-2
and 5-6, Figure 24, lanes 1 and 3) due to a feedback loop mechanism (Jaeschke
et al. 2002; Zhang et al. 2003a). Indeed, when activated Akt was stably
expressed in TSC2 -/-/p53-/- cells, the AMP/ATP ratio was restored with
concomitant decrease in AMPK activity similar to that in TSC+/-/p53-/- cells
(Figure 23 and 24, lane 2). These results further established a role of Akt to
mediate and maintain a low AMP/ATP ratio and to inhibit AMPK activity.
In TSC2-deficient cells mTOR was constitutively active, measured by the
phosphorylation status of 4EBP1, p70S6K and S6, despite a high AMP/ATP ratio
and AMPK kinase activity (Figure 24, lane 1). This furthermore established the
role for TSC2 to mediate the energy response downstream of AMPK.
4.5.3 Inhibition of AMPK by Akt despite TSC2 phosphorylation is also
required for mTOR activiy
It has been demonstrated that TSC1-TSC2 act to antagonize the insulin-signaling
pathway through inhibition of S6K, which is downstream of mTOR (McManus and
Alessi 2002) and several groups have shown that Akt directly targets TSC2 by
phosphorylation in vitro and in vivo. Identified sites are Serine 939, Serine
1086/1088 and Threonine 1462/1422 rat-short cDNA (Tee et al. 2002). A
consistent finding among all studies in mammalian cells is that TSC1 and TSC2
form a complex (van Slegtenhorst et al. 1997; Nellist et al. 2002); however, the
consequences of Akt-mediated TSC2 phosphorylation are not clear. There are
reports supporting a model that Akt phosphorylation of TSC2 disrupts the TSC1-
TSC2 complex (Inoki et al. 2002).
Is TSC2 phosphorylation by Akt sufficient to activate mTOR or is the
inhibition of AMPK by Akt, leading to reduced AMP/ATP ratios, also required for
mTOR activation?
82
To address this question, an Akt-phosphomimetic mutant of TSC2 HA-
tagged TSC2 (S939D/S1086D/S1088D/T1422E) in pcDNA3 (rat-short cDNA
(Tee et al. 2002) was used (obtained from K. Inoki and K-L Guan) (Inoki et al.
2002). In this mutant four residues that are phosphorylated by Akt were
substituted by acidic amino acids (Inoki et al. 2002).
Figure 25: Expression of Akt-phosphomimetic mutant of TSC2 in TSC2-/- cells. Immunoblot shows the expression of exogenous HA-tagged TSC2 phosphomimetic mutant, TSC2(S939D/S1086D/S1088E/T1422E) (TSC2(2D,2E)), and Akt in control TSC2-/- MEFs, a polyclonal TSC2-/- MEFs cell line expressing HA-TSC2(2D,2E), and a polyclonal TSC2-/- MEFs cell line expressing HA-TSC2(2D,2E), and mAkt.
The retroviral vector pLPCX-HA-TSC2 (S939D/S1086D/S1088D/T1422E) was
constructed by inserting TSC2 (S939D/S1086D/S1088D/T1422E) into the Not1
site of pLPCX (retroviral vector). To generate a TSC2-/- polyclonal cell line
expressing HA-TSC2 (S939D/S1086D/S1088D/T1422E), TSC2-/- MEFs were
infected with high titer pLPCX-HA-TSC2 (S939D/S1086D/S1088D/T1422E) or
control pLPCX retrovirus followed by selection with puromycin. To generate
polyclonal TSC2 cell lines expressing both HA-TSC2 (S939D/S1086D/
S1088D/T1422E) and mAkt, TSC2-/- MEFs expressing HA-TSC2
(S939D/S1086D/S1088D/T1422E) were re-infected with pBabe-eGFP- mAkt
retrovirus followed by sorting with FACS.
83
Figure 26: Expression of Akt-phosphomimetic mutant of TSC2 in TSC2-/- cells sensitizes mTOR activity to ATP depletion, which is restored by activated Akt. Cell lysates from untreated or 2-DOG treated TSC2-/- MEFs (lanes 1, 4, and 7), a polyclonal TSC2-/- MEF cell line expressing HA-TSC2(2D,2E) (lanes 2, 5, and 8), and a polyclonal TSC2-/- MEF cell line expressing HA-TSC2(2D,2E) and mAkt (lanes 3, 6, and 9) were subjected to immunoblotting using anti-p-Akt-S473, anti-p-S6K1-T389, anti-S6K, anti-p-S6-S240/244, anti-p-4E-BP1-S65, anti-4E-BP1 and anti-β-actin a
The expression of the introduced HA-TSC2(3D,1E) into TSC2-/-/p53-/- cells
by retrovirus infection was analysed by immunoblotting with anti-HA and anti-
TSC2 antibodies (Figure 25 lanes 1-3) and compared to TSC2-/-/p53-/- cells.
1.0x10⁶ HA-TSC2(3D,1E)TSC2-/-/p53-/-, mAkt-HA-TSC2(3D,1E)TSC2-/-/p53-/- and
TSC2-/-/p53-/- cells were plated in 10 cm plates in DMEM (5.5mM Glucose).
Before treatment with inhibitor for ATP depletion, cells were plated for 24h in
DMEM (5.5 mM Glucose) with 10% FBS. ATP was depleted for 30 minutes using
25 and 50 mM 2-Deoxyglucose in DMEM (5.5 mM Glucose).
Figure 26 shows (lanes 2, 5, and 8), that TSC2(3D,1E) rendered mTOR
activity in TSC2-/- cells more sensitive to ATP depletion. The phosphorylation of
84
TSC2 by Akt was not sufficient to render mTOR activity resistant to ATP
depletion. When mAkt was co-expressed, mTOR activity was restored to the
level observed in TSC2-/-/p53-/- cells (Figure 26, lanes 3, 6 and 9).
This result finally demonstrated that Akt regulates AMPK activity and
supported previous results, which showed that TSC2 is a target for AMPK (Inoki
et al. 2003b). Akt leads to the activation of mTOR through both phosphorylation
and inactivation of TSC2 and through inhibition of AMPK activity, which has been
shown to activate TSC2 (Inoki et al. 2003b). Therefore, the phosphorylation of
TSC2 by Akt is not sufficient to fully activate mTOR.
85
5. Discussion
5.1 Akt can determine the cell mass and is required for mTOR activity
Results in chapter 4.1.1 show the occurrence of severe atrophy and a decrease
in cell size of skeletal muscle cells in Akt1/Akt2 DKO mice. In previous studies
Akt has been involved in determining skeletal hypertrophy (Bodine et al. 2001;
Rommel et al. 2001; Fingar et al. 2002; Pallafacchina et al. 2002). Furthermore,
expression of activated Akt has been shown to increase organ cell and organ
size (Shioi et al. 2002). This finding is consistent with the studies in Drosophila
that the loss of Akt reduced cell size (Scanga et al. 2000). These results
established for the first time genetic evidence that Akt is required for determining
the cell size in mammalian organisms (Peng et al. 2003). Furthermore, this result
prompted to investigate the signaling pathways that underlie in these findings.
Akt is required for the phosphorylation and inhibition of 4EBP1 by mTOR
(Gingras et al. 1998) and mTOR is responsible for the phosphorylation of
p70S6K and activates it, whereas 4EBP1 activity is inhibited by phosphorylation
of mTOR. Both 4EBP1 and p70S6K have been implicated in determining the cell
size as well (Kozma and Thomas 2002). This study placed mTOR as a central
regulator of cell growth (size) and proliferation.
The neonatal lethality of Akt1/Akt2 DKO mice precluded the analysis of
the Akt�mTOR pathway in skeletal muscle of Akt1/Akt2 DKO mice. Using
Akt1/Akt2 DKO MEFs, intracellular activity of mTOR was determined by the
phosphorylation status of 4EBP1 and S6K.
The results in chapter 4.1.2 demonstrate that, upon serum stimulation,
there was a significant reduction in 4EBP1 phosphorylation in Akt1/Akt2 DKO
cells. In addition, Akt1/Akt2 DKO cells displayed a reduced expression level of
4EBP1, probably as a compensatory mechanism for the inability to efficiently
phosphorylate 4EBP1. Under this condition, the S6K1 phosphorylation was not
impaired, suggesting there might be another kinase that phosphorylates S6K1, or
the threshold of Akt activity for S6K1 phosphorylation is relatively low. It was
recently shown that PDK1 and PKCζ are able to mediate Threonine 389
phosphorylation in an mTOR dependent manner (Romanelli et al. 2002). Genetic
86
analyses in Drosophila have shown that dS6K can function independently of Akt
(Radimerski et al. 2002).
However, under steady-state level in proliferating cells, the
phosphorylation of both 4EBP1 and S6K1 was markedly reduced in Akt1/Akt2
DKO MEFs; how this occurred needed further examination. This result also
established the first genetic evidence that Akt is required for mTOR-mediated
phosphorylation.
Akt directly phosphorylates TSC2 (Potter et al. 2001; Inoki et al. 2002;
Manning et al. 2002). However, results in chapter 4.1.3 showed there was not
always a direct correlation between TSC2 phosphorylation and reduced mTOR
activity, as measured by 4EBP1 phosphorylation in Akt1/Akt2 DKO cells. This
finding and the observation that over expression of an activated form of mAkt
increased the intracellular level of ATP ((Gottlob et al. 2001), and Figure 10) led
to further investigation of another potential pathway, by which Akt affects mTOR
activity. A previous study showed that the intracellular level of ATP modulated
mTOR activity (Dennis et al. 2001).
5.2 Akt is a key regulator for energy metabolism and regulates indirectly
AMPK activity
In Rat1a-mAkt ((Gingras et al. 1998), and Fig. 15, 16, 18) and 293-mAkt cells
(Fig.16), expressing activated Akt, mTOR was constitutively active even in the
absence of growth factors as determined by 4EBP1 phosphorylation and mobility
shift. The serine/threonine kinase Akt is a key regulator of energy metabolism
induced by growth factors and has been shown to phosphorylate and induce
activity of the 6-phosphofructo-2-kinase (PFK-2) in heart, which in turn stimulates
glycolysis (Deprez et al. 1997). Also, Akt was shown to regulate glucose
metabolism at several levels by enhancing glucose uptake in insulin-responsive
tissues. This is mainly due to an effect on the glucose transporters GLUT1,
GLUT3 and GLUT4. Akt has been found to increase the expression of the
glucose transporters (Mazure et al. 1997; Barthel et al. 1999) and the
translocation of GLUT4 to the plasma membrane (Kohn et al. 1996; Cong et al.
1997; Tanti et al. 1997).
87
Interestingly, it has been shown that Akt localized into the mitochondria,
where it was found to reside in the matrix and the inner and outer membranes.
Additionally, the level of mitochondrial Akt is regulated very dynamically.
Stimulation of a variety of cell types with insulin-like growth factor-1, insulin, or
stress (heat shock) induced translocation of Akt to the mitochondria within
several minutes of stimulation, causing increases of nearly eight- to 12-fold.
Mitochondrial Akt was found to be in its phosphorylated, active state and two
mitochondrial proteins were identified to be phosphorylated following stimulation,
the β-subunit of ATP synthase and glycogen synthase kinase-3β (Bijur and Jope
2003).
In Akt1/Akt2 DKO cells the level of intracellular ATP was significantly
reduced (2-3 fold) after serum deprivation and following stimulation with insulin or
serum (Figure 10, CHAPTER 4.2.1), whereas over expression of activated mAkt
in Rat1a cells induced a 2 to 3-fold increase in ATP (Figure 11). The effect of Akt
on the generation of ATP is mediated via an increase in glycolysis and oxidative
phosphorylation (Gottlob et al. 2001). Although the exact mechanism(s), by
which Akt affects these processes, are still unknown, Akt can potentially affect
glycolysis through multiple mechanisms including glucose transporter expression
and translocation (Kohn et al. 1996; Hajduch et al. 1998; Barthel et al. 1999;
Rathmell et al. 2003), and increased activity and expression of glycolytic
enzymes (Deprez et al. 1997; Gottlob et al. 2001; Majumder et al. 2004). The
ability of Akt to increase glycolytic fluxes could also affect oxidative
phosphorylation in the mitochondria by increasing the availability of substrates for
oxidative phosphorylation.
AMPK is a heterotrimeric complex comprised of a catalytic (α) subunit and
two regulatory (β and γ) subunits. AMP elicits allosteric changes that activate
AMPK and promote phosphorylation of Thr172 in the activation loop of the α
subunit by AMPK kinase, which was recently identified as LKB1 (reviewed in
(Carling 2004)).
Figure 12 (CHAPTER 4.2.1) also shows that the ratio of AMP/ATP is
markedly increased in Akt1/Akt2 DKO cells after stimulation when compared to
the wildtype, which is mainly due to the insufficient ATP level. Figure 14
(CHAPTER 4.2.3) shows that in the presence and absence of growth factor,
88
Rat1a exhibited a 3-fold higher AMP/ATP ratio when compared to Rat1a cells
expressing activated Akt. The AMP/ATP ratio reflects the status of activation of
AMPK, measured by phosphorylation status of AMPK on Thr172 (Figure 15,
(Hardie et al. 1998)). Figure 13 (CHAPTER 4.2.2) shows that expression and
status of activation of Akt affected AMPK activity and Akt-deficiency induced
phosphorylation of Thr172 as well as the in vivo activity of AMPK, as measured
by the phosphorylation of ACC. The effect of Akt on the ATP level caused a
concomitant reduction of the AMP/ATP ratio, and therefore reduced AMPK
activity. As a kinase, Akt could potentially affect AMPK activity via
phosphorylation of AMPK itself or its upstream regulator LKB1. Indeed, Thr366 of
LKB1 lies in a consensus for the optimal phosphorylation motif for Akt. However,
it has been reported that Akt couldn�t phosphorylate LKB1 in vitro (Sapkota et al.
2001; Sapkota et al. 2002).
Rat1a cells expressing activated Akt were subjected to ATP depletion
experiments using inhibitors of glycolysis and oxidative phosphorylation
(CHAPTER 4.3.1). As discussed above, cells with activated Akt exert
constitutively activated mTOR even in the absence of growth factors as
determined by 4EBP1 phosphorylation and mobility shift. Figure 16 shows that
Akt was constitutively active in the presence of both inhibitors and did not affect
TSC2 phosphorylation. However, Akt-mediated mTOR activity was inhibited,
when ATP was depleted in a dose-dependent manner. Inhibition of mTOR
activity by ATP depletion was less effective in Rat1a-mAkt cells than in Rat1a
cells induced by insulin using the same concentration of 5-thioglucose (compare
Figures 16 and 17).
The results strongly suggest that the ability of Akt to mediate mTOR
activity is dependent on its ability to increase the intracellular ATP level, which
subsequently down regulates AMPK.
To underline the finding that AMPK is down regulated by Akt, experiments
were designed to activate endogenous AMPK using AICAR and to over/co-
express CA-AMPK (constitutively activated form of AMPK) or DN-AMPK
(dominant negative form of AMPK). Kimura et al. have shown that activation of
AMPK decreased mTOR activity (Kimura et al. 2003). AICAR, widely used as an
AMPK activator, induced AMPK activity and impaired insulin-mediated
phosphorylation of S6K. In addition, over expression of dominant negative AMPK
89
increased S6K phosphorylation, whereas a constitutively active AMPK decreased
S6K activity (Kimura et al. 2003).
The treatment of Rat1a-mAkt cells with AICAR, in which mTOR is
constitutive active, induced endogenous AMPK activity in a dose-dependent
manner with a concomitant decrease in mTOR activity (CHAPTER 4.3.3, Figure
18). Co-expression of constitutively active AMPK and 4EBP1 in 293 cells and in
293-mAkt cells proved the down regulation of AMPK by Akt as a function of
different ATP levels and that activated AMPK antagonized this process
(CHAPTER 4.3.4, Figure 19).
Characterization of Akt1/Akt2 DKO MEFs compared to wildtype revealed
impaired mTOR activity. Using dominant negative AMPK to generate
clearly demonstrated that Akt�s ability to increase mTOR activity is dependent on
its function to down regulate AMPK (Figure 20, CHAPTER 4.4.1). These results
demonstrate that mTOR activity in Akt1/Akt2 DKO MEFs was impaired as well
because of the inability to sufficiently increase the level of intracellular ATP by
insulin and growth factor. Over-expression of DN-AMPK in immortalized
Akt1/Akt2 DKO MEFs increased mTOR activity in a dose-dependent manner and
supported this result (CHAPTER 4.4.2, Figure 21).
Taken together, these results further established a role for Akt as a key
regulator for energy metabolism and indirect regulator of AMPK activity.
5.3 Akt-mediated phosphorylation of TSC2 is not sufficient to fully activate mTOR
It was shown that AMPK impairs the induction of mTOR activity by growth factors
(Kimura et al. 2003) and that AMPK directly phosphorylates and activates TSC2,
thereby inhibiting mTOR activity (Inoki et al. 2003b). In chapter 4.5, it has been
shown that in order to fully inhibit TSC2 and to activate mTOR, Akt needs to
directly phosphorylate TSC2 and inhibit AMPK to prevent it from activating TSC2.
In cells deficient for Akt1 and Akt2, mTOR activity was impaired without
a substantial effect on TSC2 phosphorylation by Akt (CHAPTER 4.1.2 and 4.1.3).
However, Figure 13 (CHAPTER 4.2.2) shows that AMPK activity was elevated in
90
Akt1/Akt2 deficient cells suggesting that the residual Akt activity mediated by
Akt3 is sufficient to phosphorylate TSC2 but insufficient to maintain a �normal�
ATP level and thus, leading to the activation of AMPK. Indeed, expression of DN-
AMPK in Akt1/Akt2 deficient cells restored mTOR activity (CHAPTER 4.4).
Furthermore, expression of an Akt-phosphomimetic mutant of TSC2 in
TSC2 deficient cells, in which mTOR activity is relatively refractive to ATP
depletion, restored sensitivity of mTOR to ATP depletion implying that TSC2
phosphorylation by Akt did not prevent the activation of TSC2 by AMPK
(CHAPTER 4.5.3, Figure 23). However, expression of activated Akt together
with the Akt-phosphomimetic TSC2 mutant reversed the sensitivity of mTOR
activity to ATP depletion similar to that observed in TSC2 deficient cells. In TSC2
deficient cells AMPK activity was elevated (Figure 24) and expression of
activated Akt inhibits the elevated AMPK activity in these cells (Figures 24 and
26).
Thus, taken together, these results clearly demonstrate that Akt, in
addition to inhibiting TSC2 via direct phosphorylation, also inhibits TSC2 and
activates mTOR through inhibition of AMPK, establishing a new mechanism for
the activation of mTOR by growth factors and Akt.
mRNA translation and ribosomal biogenesis, two processes that are
mediated by mTOR, consume high levels of cellular energy. Thus, high
consumption of ATP in TSC2-deficient cells together with the reduced Akt activity
due to a negative feed back loop (Jaeschke et al. 2002; Zhang et al. 2003a)
could contribute to the elevated AMP/ATP ratio and AMPK activity observed in
these cells (CHAPTER 4.5.2, Figures 23 and 24).
Although mTOR activity in TSC2 deficient cells was relatively refractive
to ATP depletion, it was still reduced to some extent in these cells in response to
ATP depletion (CHAPTER 4.5.1, Figures 22 and 26). This suggests that ATP
level and AMPK activity can also affect mTOR activity in a TSC2-independent
manner. One possibility is that AMPK can directly phosphorylate and inactivate
mTOR (Figure 24). It was recently shown that AMPK can phosphorylate Thr2446
of mTOR (Cheng et al. 2004), which resides in the putative negative regulatory
domain of mTOR (Sekulic et al. 2000). Phosphorylation of Thr2446 by AMPK
inhibited phosphorylation of Thr2448 by Akt and thus, could potentially inhibit
mTOR activity (Cheng et al. 2004). However, so far it has not been demonstrated
91
that Thr2448 phosphorylation by Akt has any impact on mTOR activity (Cheng et
al. 2004).
5.4 New mechanism by which growth factors activate mTOR
Both TSC2 and LKB1 appear to act as tumor suppressors and their deficiency
leads to the development of benign tumors and hamartomas (Hemminki et al.
1998; Jenne et al. 1998; Cheadle et al. 2000b). It is therefore possible that LKB1
exerts its tumor suppressor activity through activation of AMPK and inhibition of
TSC2. Akt is frequently activated in human cancers mainly through the
inactivation of the tumor suppressor PTEN; its deficiency can also lead to the
development of benign tumors and hamartomas (Parsons and Simpson 2003).
Figure 27: Proposed model for the regulation of mTOR activity by Akt. Activation of Akt leads to the direct phosphorylation of TSC2. In addition, Akt also regulates mTOR by inhibition of AMPK due to regulation/maintaining energy homeostasis. The downstream target for this regulation is TSC2 (energy response point). AMPK might also act further downstream of TSC2, which should be addressed in further investigations. Abbreviations: IR (Insulin-receptor), (PI3K-phophatidylinositol-3-kinase), Akt (serine /threonine activated protein kinase), TSC1 (tuberose scleroses complex1-hamartine), TSC2 (tuberose scleroses complex2-tuberin), AMPK (AMP-activated kinase), LKB1 (AMPK-kinase), Rheb (Ras homolog enriched in brain), mTOR (mammalian target of rapamycin).
92
Our results strongly suggest that the phosphorylation of TSC2 by Akt could not
be sufficient to overcome the activity of LKB1 as a tumor suppressor. However,
the ability of Akt to negate AMPK activity could be sufficient to overcome the
tumor suppressor activity of LKB1. Thus, PTEN deficiency should be capable of
overcoming the tumor suppressor activities of both TSC2 and LKB1.
5.5 Concluding Remarks
The regulation of mTOR by Akt was shown in vitro using primary cells/ cell lines.
However, the regulation of mTOR by Akt through inhibition of AMPK could also
be determined in vivo, e.g., in a mouse model, by obtaining Akt1/Akt 2 DKO mice
crossed with transgenic mice for dominant negative AMPK. This model would be
suitable to show whether the growth retardation might be reversed in Akt1/Akt2
DKO mice by measuring body weight and skeletal muscle size. In addition, the
analysis of the Akt-TSC2-mTOR pathway in MEFs of Akt1/Akt2 DKO miceTG-DN-
AMPK would clarify if DN-AMPK activates mTOR in Akt deficient cells in vivo.
Furthermore, questions about the regulation of the Akt-TSC2-mTOR pathway
during the development of Akt1/Akt 2 DKO miceTG-DN-AMPK compared to Akt1/Akt
2 DKO mice could be addressed as well as issues regarding the organ specificity
of the pathway regulation.
In vitro studies could further investigate the �differential� regulation of
TSC2 by Akt between the two pathways: (1) direct phosphorylation of TSC2 and
deactivation of the TSC1/TSC2 complex and (2) inhibition or activation of the
phosphorylation of TSC2 by AMPK through AMP/ATP ratios. As shown in Figure
27, both pathways have different effects on TSC2. For example, one may
determine mTOR activity after overexpressing Akt-phosphomimetic TSC2 mutant
with Serine 1345 and Threonine 1227 converted to Alanine in Akt1/Akt2 DKO
cells. These two phosphorylation sites on TSC2 are AMPK-dependent and have
been shown to play an important role in the cellular energy response (Inoki et al.
2003b).
Furthermore, it would be interesting to determine if Akt�s effect on the
intracellular ATP level is due to the global effect on glycolysis and oxidative
93
phosphorylation, or due to a specific mechanism, for example suggested by Bijur
et al., where Akt may locate into the mitochondria and phosphorylate the ATP
synthase β-subunit (Bijur and Jope 2003).
94
6. Summary
The serine/threonine kinase Akt was shown to activate the mammalian target of
rapamycin (mTOR) through direct phosphorylation and inhibition of tuberous
sclerosis complex 2 (TSC2). Recent reports show that mTOR activity is also
dependent on the intracellular level of ATP and reduced AMPK activity, thereby
AMPK inhibits mTOR through the phosphorylation and inactivation of TSC2.
Skeletal muscle cells of Akt1/Akt2 DKO mice show severe atrophy and a
decrease in cell size. This result established that Akt is required for determining
the cell growth or cell mass in mammalian (skeletal muscle) cells. Increasing
body of evidence placed mTOR as a central regulator of cell growth (size) and
proliferation. The kinase mTOR affects its downstream targets 4EBP1 and S6K1,
both are phosphorylated by its kinase activity and increasing protein synthesis.
Biochemical experiments in this thesis show that the activity of mTOR is
impaired in Akt1/Akt2 DKO cells, and this provided first genetic evidence that Akt
is required for mTOR activity. TSC2 has been shown to be directly
phosphorylated by Akt, however, it appears that phosphorylation of TSC2 by Akt
is not sufficient to fully activate mTOR.
Genetic and biochemical approaches have been applied to establish that
Akt is a regulator of energy homeostasis and is required to maintain a threshold
level of ATP in the cell. AMPK activity is dependent on AMP/ATP ratios and not
solely on the ATP level. Although it has been demonstrated before that cells
over-expressing activated Akt display a higher ATP level, it has never been
established that the AMP/ATP level is reduced in those cells, neither their low
AMPK activity. This thesis provided for the first time genetic evidence that Akt is
required to maintain the intracellular level of ATP, a low AMP/ATP ratio and low
AMPK activity. This function of Akt is required in order to fully activate mTOR.
Expression of DN-AMPK in Akt deficient cells that display a high AMPK activity
restored mTOR activity in those cells.
Additionally, it has been observed for the first time that the ATP level is
low and AMPK activity is up-regulated due to a low Akt activity in TSC2-null cells.
Finally, the results have proven that direct phosphorylation of TSC2 by Akt is not
sufficient to fully activate mTOR and that Akt activates mTOR through an
95
additional pathway that inhibits AMPK. Using expression of an Akt-
phosphomimetic mutant of TSC2 in TSC2-null cells showed that this mutant is
not inert to ATP depletion and still inhibits mTOR activity. However, ectopically
expression of activated Akt inhibits the activity of the phosphomimetic mutant of
TSC2 via downregulation of AMPK.
In summary, this work revealed a linear pathway downstream of Akt that
inhibits AMPK, which otherwise activated the TSC2-mTOR pathway. Currently,
the activation of mTOR via inhibition of AMPK and through phosphorylation of
TSC2 by Akt are viewed as two separate pathways leading to the activation of
mTOR.
The findings establish a new pathway from Akt via AMPK to mTOR and
challenged the current knowledge by showing that Akt is activating mTOR
through both AMPK and through direct phosphorylation of TSC2. The regulation
of the Akt-TSC2-mTOR pathway is demonstrated in the scheme in Figure 27
CHAPTER 6.4.
96
7. Zusammenfassung
Es wurde gezeigt, dass die Serine/Threonine-Kinase Akt, oder auch PKB
genannt, mTOR (mammalian target of rapamycin) durch direkte
Phosphorylierung aktiviert. Kuerzlich erschienene Reporte zeigten, das mTOR
Aktivitaet vom intrazellulaeren ATP-Level und von der AMPK-Aktivitaet
abhaengt. AMPK- Aktivitaet inhibiert dabei mTOR durch Phosphorylierung von
TSC2.
In Skelettmuskelzellen von Akt1/Akt2 DKO Maeusen konnte starke
Muskelatrophie und eine Reduzierung der Zellgroesse festgestellt werden.
Dieses Ergebnis etabliert, dass die Kinase Akt notwendig fuer das Zellwachstum
und die Zellmasse in Saeugetierzellen (Skelettmuskelzellen) ist.
mTOR ist ein zentraler Regulator von Zellwachstum und Proliferation, das
haben zunehmende Beweise in letzter Zeit deutlich gezeigt. Die Kinase mTOR
phosphoryliert die beiden �downstream� gelegenen Proteine 4EBP und S6K,
deren Phosphorylierung zur erhoehten Proteinsynthese fuehrt.
Unter Verwendung von biochemischen Experimenten konnte gezeigt
werden, dass mTOR-Aktivitaet in Akt1/Akt2 DKO MEFs sehr stark reduziert ist,
und das liefert den ersten genetischen Beweis, dass Akt notwendig ist fuer
mTOR-Aktivierung. Es hat sich auch gezeigt, dass die Phosphorylierung von
TSC2 durch Akt nicht ausreicht, um mTOR vollenstaendig zu aktivieren.
Genetische und biochemische Methoden wurden verwendet, um Akt als
einen Regulator des Energiegleichgewichtes zu etablieren. Zusaetzlich konnte in
dieser Arbeit gezeigt werden, dass Akt unbedingt notwendig fuer die
Beibehaltung eines basalen Levels von intrazellulaerem ATP ist. AMPK-Aktivitaet
ist abhaengig vom AMP/ATP-Verhaeltnis und nicht ausschliesslich vom ATP-
Level. Obwohl bereits demonstriert worden ist, dass Ueberexprimieren von
aktiviertem Akt zu einem erhoehten intrazellularen ATP-Level fuehrt, wurde nicht
gezeigt, welche Auswirkungen dieses auf das AMP/ATP-Verhaeltnis und die
AMPK-Aktivitaet hat. In dieser Promotion wurde der erste genetische Beweiss
erbracht, dass Akt fuer die Erhaltung des intrazellulaeren ATP-Levels, zur
Herunterregulierung des AMP/ATP-Verhaeltnisses und zur Deaktivierung von
AMPK notwendig ist. Die Funktion von Akt ist notwendig fuer die vollstaendige
97
Aktivierung von mTOR. Expression von dominant negativer AMPK fuehrte zur
fast vollstaendigen Wiederherstellung der mTOR-Aktivitaet in Akt1/Akt2 DKO
Zellen.
Zusaetzlich wurden wichtige Beobachtungen in TSC2-KO Zellen gemacht,
denn es zeigte sich, dass in diesen Zellen auf Grund stark reduzierter Akt-
Aktivitaet der intrazellulaere ATP-Level reduziert und die AMPK-Aktivitaet
dadurch stark erhoeht ist.
Weiterhin ist festzustellen, dass TSC2 Phosphorylierung durch Akt nicht
ausreicht, um mTOR vollstaendig zu aktivieren; ein zusaetzlicher Pathway, der
AMPK-Aktivitaet inhibiert, wurde notwendig. Um diesen Mechanismus zu
untermauern, wurde ein fuer Akt konstitutiv aktiviertes TSC2 Protein in TSC2-KO
Zellen ueberexprimiert. Diese Zelllinie war nicht inert gegenueber ATP
Reduzierung hervorgerufen durch Inhibitoren im Vergleich zur TSC2-KO Zelllinie.
Interessanterweise konnte ein zusaetzliches Ueberexpremieren von aktiviertem
Akt in dieser Zelllinie, durch Deaktivierung der AMPK, diesen Effekt umkehren.
Die in dieser Forschungsarbeit herausgestellten Informationen haben zur
Entdeckung einer neuen Verbindung im Pathway Akt-TSC2-mTOR gefuehrt, der
linear von Akt zur Inhibierung von AMPK fuehrt. In der Literatur wird die
Aktivierung von mTOR durch die Inhibierung von AMPK und durch die direkte
Phosphorylierung von TSC2 als zwei separate Pathways dargestellt. Es wurde
gezeigt, dass Akt mTOR durch AMPK und direkte Phosphorylierung von TSC2
aktiviert. Ein Schema des etablierten Akt-TSC2-mTOR Pathways ist in Abbildung
27, Kapitel 6.4., dargestellt.
98
III. References
Alessi, D.R., M. Andjelkovic, B. Caudwell, P. Cron, N. Morrice, P. Cohen, and B.A. Hemmings. 1996. Mechanism of activation of protein kinase B by insulin and IGF-1. Embo J 15: 6541-51.
Altomare, D.A., K. Guo, J.Q. Cheng, G. Sonoda, K. Walsh, and J.R. Testa. 1995. Cloning, chromosomal localization and expression analysis of the mouse Akt2 oncogene. Oncogene 11: 1055-60.
Altomare, D.A., G.E. Lyons, Y. Mitsuuchi, J.Q. Cheng, and J.R. Testa. 1998. Akt2 mRNA is highly expressed in embryonic brown fat and the AKT2 kinase is activated by insulin. Oncogene 16: 2407-11.
Anderson, K.E., J. Coadwell, L.R. Stephens, and P.T. Hawkins. 1998. Translocation of PDK-1 to the plasma membrane is important in allowing PDK-1 to activate protein kinase B. Curr Biol 8: 684-91.
Andjelkovic, M., D.R. Alessi, R. Meier, A. Fernandez, N.J. Lamb, M. Frech, P. Cron, P. Cohen, J.M. Lucocq, and B.A. Hemmings. 1997. Role of translocation in the activation and function of protein kinase B. J Biol Chem 272: 31515-24.
Andrade, M.A. and P. Bork. 1995. HEAT repeats in the Huntington's disease protein. Nat Genet 11: 115-6.
Barbet, N.C., U. Schneider, S.B. Helliwell, I. Stansfield, M.F. Tuite, and M.N. Hall. 1996. TOR controls translation initiation and early G1 progression in yeast. Mol Biol Cell 7: 25-42.
Barthel, A., S.T. Okino, J. Liao, K. Nakatani, J. Li, J.P. Whitlock, Jr., and R.A. Roth. 1999. Regulation of GLUT1 gene transcription by the serine/threonine kinase Akt1. J Biol Chem 274: 20281-6.
Bellacosa, A., J.R. Testa, S.P. Staal, and P.N. Tsichlis. 1991. A retroviral oncogene, akt, encoding a serine-threonine kinase containing an SH2-like region. Science 254: 274-7.
Bijur, G.N. and R.S. Jope. 2003. Rapid accumulation of Akt in mitochondria following phosphatidylinositol 3-kinase activation. J Neurochem 87: 1427-35.
Bodine, S.C., T.N. Stitt, M. Gonzalez, W.O. Kline, G.L. Stover, R. Bauerlein, E. Zlotchenko, A. Scrimgeour, J.C. Lawrence, D.J. Glass, and G.D. Yancopoulos. 2001. Akt/mTOR pathway is a crucial regulator of skeletal muscle hypertrophy and can prevent muscle atrophy in vivo. Nat Cell Biol 3: 1014-9.
Bolster, D.R., S.J. Crozier, S.R. Kimball, and L.S. Jefferson. 2002. AMP-activated protein kinase suppresses protein synthesis in rat skeletal muscle through down-regulated mammalian target of rapamycin (mTOR) signaling. J Biol Chem 277: 23977-80.
Boudeau, J., A. Kieloch, D.R. Alessi, A. Stella, G. Guanti, and N. Resta. 2003a. Functional analysis of LKB1/STK11 mutants and two aberrant isoforms found in Peutz-Jeghers Syndrome patients. Hum Mutat 21: 172.
Boudeau, J., G. Sapkota, and D.R. Alessi. 2003b. LKB1, a protein kinase regulating cell proliferation and polarity. FEBS Lett 546: 159-65.
Brazil, D.P., J. Park, and B.A. Hemmings. 2002. PKB binding proteins. Getting in on the Akt. Cell 111: 293-303.
99
Brodbeck, D., P. Cron, and B.A. Hemmings. 1999. A human protein kinase Bgamma with regulatory phosphorylation sites in the activation loop and in the C-terminal hydrophobic domain. J Biol Chem 274: 9133-6.
Brown, E.J., M.W. Albers, T.B. Shin, K. Ichikawa, C.T. Keith, W.S. Lane, and S.L. Schreiber. 1994. A mammalian protein targeted by G1-arresting rapamycin-receptor complex. Nature 369: 756-8.
Brown, E.J., P.A. Beal, C.T. Keith, J. Chen, T.B. Shin, and S.L. Schreiber. 1995. Control of p70 s6 kinase by kinase activity of FRAP in vivo. Nature 377: 441-6.
Burgering, B.M. and P.J. Coffer. 1995. Protein kinase B (c-Akt) in phosphatidylinositol-3-OH kinase signal transduction. Nature 376: 599-602.
Cafferkey, R., M.M. McLaughlin, P.R. Young, R.K. Johnson, and G.P. Livi. 1994. Yeast TOR (DRR) proteins: amino-acid sequence alignment and identification of structural motifs. Gene 141: 133-6.
Cardone, M.H., N. Roy, H.R. Stennicke, G.S. Salvesen, T.F. Franke, E. Stanbridge, S. Frisch, and J.C. Reed. 1998. Regulation of cell death protease caspase-9 by phosphorylation. Science 282: 1318-21.
Carling, D. 2004. Ampk. Curr Biol 14: R220. Castro, A.F., J.F. Rebhun, G.J. Clark, and L.A. Quilliam. 2003. Rheb binds
tuberous sclerosis complex 2 (TSC2) and promotes S6 kinase activation in a rapamycin- and farnesylation-dependent manner. J Biol Chem 278: 32493-6.
Chan, T.O., S.E. Rittenhouse, and P.N. Tsichlis. 1999. AKT/PKB and other D3 phosphoinositide-regulated kinases: kinase activation by phosphoinositide-dependent phosphorylation. Annu Rev Biochem 68: 965-1014.
Cheadle, J.P., L. Dobbie, S. Idziaszczyk, A.K. Hodges, A.J. Smith, J.R. Sampson, and J. Young. 2000a. Genomic organization and comparative analysis of the mouse tuberous sclerosis 1 (Tsc1) locus. Mamm Genome 11: 1135-8.
Cheadle, J.P., M.P. Reeve, J.R. Sampson, and D.J. Kwiatkowski. 2000b. Molecular genetic advances in tuberous sclerosis. Hum Genet 107: 97-114.
Chen, C., J. Jack, and R.S. Garofalo. 1996. The Drosophila insulin receptor is required for normal growth. Endocrinology 137: 846-56.
Chen, J., X.F. Zheng, E.J. Brown, and S.L. Schreiber. 1995. Identification of an 11-kDa FKBP12-rapamycin-binding domain within the 289-kDa FKBP12-rapamycin-associated protein and characterization of a critical serine residue. Proc Natl Acad Sci U S A 92: 4947-51.
Chen, W.S., P.Z. Xu, K. Gottlob, M.L. Chen, K. Sokol, T. Shiyanova, I. Roninson, W. Weng, R. Suzuki, K. Tobe, T. Kadowaki, and N. Hay. 2001. Growth retardation and increased apoptosis in mice with homozygous disruption of the Akt1 gene. Genes Dev 15: 2203-8.
Cheng, J.Q., A.K. Godwin, A. Bellacosa, T. Taguchi, T.F. Franke, T.C. Hamilton, P.N. Tsichlis, and J.R. Testa. 1992. AKT2, a putative oncogene encoding a member of a subfamily of protein-serine/threonine kinases, is amplified in human ovarian carcinomas. Proc Natl Acad Sci U S A 89: 9267-71.
100
Cheng, S.W., L.G. Fryer, D. Carling, and P.R. Shepherd. 2004. Thr2446 is a novel mammalian target of rapamycin (mTOR) phosphorylation site regulated by nutrient status. J Biol Chem 279: 15719-22.
Chiu, M.I., H. Katz, and V. Berlin. 1994. RAPT1, a mammalian homolog of yeast Tor, interacts with the FKBP12/rapamycin complex. Proc Natl Acad Sci U S A 91: 12574-8.
Choi, J., J. Chen, S.L. Schreiber, and J. Clardy. 1996. Structure of the FKBP12-rapamycin complex interacting with the binding domain of human FRAP. Science 273: 239-42.
Coffer, P.J. and J.R. Woodgett. 1991. Molecular cloning and characterisation of a novel putative protein-serine kinase related to the cAMP-dependent and protein kinase C families. Eur J Biochem 201: 475-81.
Cong, L.N., H. Chen, Y. Li, L. Zhou, M.A. McGibbon, S.I. Taylor, and M.J. Quon. 1997. Physiological role of Akt in insulin-stimulated translocation of GLUT4 in transfected rat adipose cells. Mol Endocrinol 11: 1881-90.
Corradetti, M.N., K. Inoki, N. Bardeesy, R.A. DePinho, and K.L. Guan. 2004. Regulation of the TSC pathway by LKB1: evidence of a molecular link between tuberous sclerosis complex and Peutz-Jeghers syndrome. Genes Dev 18: 1533-8.
Cross, D.A., D.R. Alessi, P. Cohen, M. Andjelkovich, and B.A. Hemmings. 1995. Inhibition of glycogen synthase kinase-3 by insulin mediated by protein kinase B. Nature 378: 785-9.
Dan, H.C., M. Sun, L. Yang, R.I. Feldman, X.M. Sui, C.C. Ou, M. Nellist, R.S. Yeung, D.J. Halley, S.V. Nicosia, W.J. Pledger, and J.Q. Cheng. 2002. Phosphatidylinositol 3-kinase/Akt pathway regulates tuberous sclerosis tumor suppressor complex by phosphorylation of tuberin. J Biol Chem 277: 35364-70.
Datta, S.R., H. Dudek, X. Tao, S. Masters, H. Fu, Y. Gotoh, and M.E. Greenberg. 1997. Akt phosphorylation of BAD couples survival signals to the cell-intrinsic death machinery. Cell 91: 231-41.
Day, S.J. and P.A. Lawrence. 2000. Measuring dimensions: the regulation of size and shape. Development 127: 2977-87.
del Peso, L., M. Gonzalez-Garcia, C. Page, R. Herrera, and G. Nunez. 1997. Interleukin-3-induced phosphorylation of BAD through the protein kinase Akt. Science 278: 687-9.
Dennis, P.B., A. Jaeschke, M. Saitoh, B. Fowler, S.C. Kozma, and G. Thomas. 2001. Mammalian TOR: a homeostatic ATP sensor. Science 294: 1102-5.
Deprez, J., D. Vertommen, D.R. Alessi, L. Hue, and M.H. Rider. 1997. Phosphorylation and activation of heart 6-phosphofructo-2-kinase by protein kinase B and other protein kinases of the insulin signaling cascades. J Biol Chem 272: 17269-75.
Downward, J. 1999. How BAD phosphorylation is good for survival. Nat Cell Biol 1: E33-5.
Dufner, A. and G. Thomas. 1999. Ribosomal S6 kinase signaling and the control of translation. Exp Cell Res 253: 100-9.
Efstratiadis, A. 1998. Genetics of mouse growth. Int J Dev Biol 42: 955-76. Eves, E.M., W. Xiong, A. Bellacosa, S.G. Kennedy, P.N. Tsichlis, M.R. Rosner,
and N. Hay. 1998. Akt, a target of phosphatidylinositol 3-kinase, inhibits apoptosis in a differentiating neuronal cell line. Mol Cell Biol 18: 2143-52.
101
Fingar, D.C., S. Salama, C. Tsou, E. Harlow, and J. Blenis. 2002. Mammalian cell size is controlled by mTOR and its downstream targets S6K1 and 4EBP1/eIF4E. Genes Dev 16: 1472-87.
Franke, T.F., S.I. Yang, T.O. Chan, K. Datta, A. Kazlauskas, D.K. Morrison, D.R. Kaplan, and P.N. Tsichlis. 1995. The protein kinase encoded by the Akt proto-oncogene is a target of the PDGF-activated phosphatidylinositol 3-kinase. Cell 81: 727-36.
Frech, M., M. Andjelkovic, E. Ingley, K.K. Reddy, J.R. Falck, and B.A. Hemmings. 1997. High affinity binding of inositol phosphates and phosphoinositides to the pleckstrin homology domain of RAC/protein kinase B and their influence on kinase activity. J Biol Chem 272: 8474-81.
Fujio, Y., K. Guo, T. Mano, Y. Mitsuuchi, J.R. Testa, and K. Walsh. 1999. Cell cycle withdrawal promotes myogenic induction of Akt, a positive modulator of myocyte survival. Mol Cell Biol 19: 5073-82.
Garami, A., F.J. Zwartkruis, T. Nobukuni, M. Joaquin, M. Roccio, H. Stocker, S.C. Kozma, E. Hafen, J.L. Bos, and G. Thomas. 2003. Insulin activation of Rheb, a mediator of mTOR/S6K/4E-BP signaling, is inhibited by TSC1 and 2. Mol Cell 11: 1457-66.
Gingras, A.C., S.G. Kennedy, M.A. O'Leary, N. Sonenberg, and N. Hay. 1998. 4E-BP1, a repressor of mRNA translation, is phosphorylated and inactivated by the Akt(PKB) signaling pathway. Genes Dev 12: 502-13.
Gingras, A.C., B. Raught, and N. Sonenberg. 2001. Regulation of translation initiation by FRAP/mTOR. Genes Dev 15: 807-26.
Goncharova, E.A., D.A. Goncharov, A. Eszterhas, D.S. Hunter, M.K. Glassberg, R.S. Yeung, C.L. Walker, D. Noonan, D.J. Kwiatkowski, M.M. Chou, R.A. Panettieri, Jr., and V.P. Krymskaya. 2002. Tuberin regulates p70 S6 kinase activation and ribosomal protein S6 phosphorylation. A role for the TSC2 tumor suppressor gene in pulmonary lymphangioleiomyomatosis (LAM). J Biol Chem 277: 30958-67.
Gottlob, K., N. Majewski, S. Kennedy, E. Kandel, R.B. Robey, and N. Hay. 2001. Inhibition of early apoptotic events by Akt/PKB is dependent on the first committed step of glycolysis and mitochondrial hexokinase. Genes Dev 15: 1406-18.
Gregory, C.R., X. Huang, R.E. Pratt, V.J. Dzau, R. Shorthouse, M.E. Billingham, and R.E. Morris. 1995. Treatment with rapamycin and mycophenolic acid reduces arterial intimal thickening produced by mechanical injury and allows endothelial replacement. Transplantation 59: 655-61.
Ha, J., S. Daniel, S.S. Broyles, and K.H. Kim. 1994. Critical phosphorylation sites for acetyl-CoA carboxylase activity. J Biol Chem 269: 22162-8.
Hajduch, E., D.R. Alessi, B.A. Hemmings, and H.S. Hundal. 1998. Constitutive activation of protein kinase B alpha by membrane targeting promotes glucose and system A amino acid transport, protein synthesis, and inactivation of glycogen synthase kinase 3 in L6 muscle cells. Diabetes 47: 1006-13.
Hanada, M., J. Feng, and B.A. Hemmings. 2004. Structure, regulation and function of PKB/AKT--a major therapeutic target. Biochim Biophys Acta 1697: 3-16.
Hara, K., Y. Maruki, X. Long, K. Yoshino, N. Oshiro, S. Hidayat, C. Tokunaga, J. Avruch, and K. Yonezawa. 2002. Raptor, a binding partner of target of rapamycin (TOR), mediates TOR action. Cell 110: 177-89.
102
Hara, K., K. Yonezawa, Q.P. Weng, M.T. Kozlowski, C. Belham, and J. Avruch. 1998. Amino acid sufficiency and mTOR regulate p70 S6 kinase and eIF-4E BP1 through a common effector mechanism. J Biol Chem 273: 14484-94.
Hardie, D.G., D. Carling, and M. Carlson. 1998. The AMP-activated/SNF1 protein kinase subfamily: metabolic sensors of the eukaryotic cell? Annu Rev Biochem 67: 821-55.
Hawley, S.A., M.A. Selbert, E.G. Goldstein, A.M. Edelman, D. Carling, and D.G. Hardie. 1995. 5'-AMP activates the AMP-activated protein kinase cascade, and Ca2+/calmodulin activates the calmodulin-dependent protein kinase I cascade, via three independent mechanisms. J Biol Chem 270: 27186-91.
Hay, N. and N. Sonenberg. 2004. Upstream and downstream of mTOR. Genes Dev 18: 1926-45.
Hemminki, A., D. Markie, I. Tomlinson, E. Avizienyte, S. Roth, A. Loukola, G. Bignell, W. Warren, M. Aminoff, P. Hoglund, H. Jarvinen, P. Kristo, K. Pelin, M. Ridanpaa, R. Salovaara, T. Toro, W. Bodmer, S. Olschwang, A.S. Olsen, M.R. Stratton, A. de la Chapelle, and L.A. Aaltonen. 1998. A serine/threonine kinase gene defective in Peutz-Jeghers syndrome. Nature 391: 184-7.
Inoki, K., Y. Li, T. Xu, and K.L. Guan. 2003a. Rheb GTPase is a direct target of TSC2 GAP activity and regulates mTOR signaling. Genes Dev 17: 1829-34.
Inoki, K., Y. Li, T. Zhu, J. Wu, and K.L. Guan. 2002. TSC2 is phosphorylated and inhibited by Akt and suppresses mTOR signalling. Nat Cell Biol 4: 648-57.
Inoki, K., T. Zhu, and K.L. Guan. 2003b. TSC2 mediates cellular energy response to control cell growth and survival. Cell 115: 577-90.
Jaeschke, A., J. Hartkamp, M. Saitoh, W. Roworth, T. Nobukuni, A. Hodges, J. Sampson, G. Thomas, and R. Lamb. 2002. Tuberous sclerosis complex tumor suppressor-mediated S6 kinase inhibition by phosphatidylinositide-3-OH kinase is mTOR independent. J Cell Biol 159: 217-24.
James, S.R., C.P. Downes, R. Gigg, S.J. Grove, A.B. Holmes, and D.R. Alessi. 1996. Specific binding of the Akt-1 protein kinase to phosphatidylinositol 3,4,5-trisphosphate without subsequent activation. Biochem J 315 ( Pt 3): 709-13.
Jenne, D.E., H. Reimann, J. Nezu, W. Friedel, S. Loff, R. Jeschke, O. Muller, W. Back, and M. Zimmer. 1998. Peutz-Jeghers syndrome is caused by mutations in a novel serine threonine kinase. Nat Genet 18: 38-43.
Jones, P.F., T. Jakubowicz, F.J. Pitossi, F. Maurer, and B.A. Hemmings. 1991. Molecular cloning and identification of a serine/threonine protein kinase of the second-messenger subfamily. Proc Natl Acad Sci U S A 88: 4171-5.
Kandel, E.S. and N. Hay. 1999. The regulation and activities of the multifunctional serine/threonine kinase Akt/PKB. Exp Cell Res 253: 210-29.
Kemp, B.E., K.I. Mitchelhill, D. Stapleton, B.J. Michell, Z.P. Chen, and L.A. Witters. 1999. Dealing with energy demand: the AMP-activated protein kinase. Trends Biochem Sci 24: 22-5.
Kennedy, S.G., E.S. Kandel, T.K. Cross, and N. Hay. 1999. Akt/Protein kinase B inhibits cell death by preventing the release of cytochrome c from mitochondria. Mol Cell Biol 19: 5800-10.
103
Kennedy, S.G., A.J. Wagner, S.D. Conzen, J. Jordan, A. Bellacosa, P.N. Tsichlis, and N. Hay. 1997. The PI 3-kinase/Akt signaling pathway delivers an anti-apoptotic signal. Genes Dev 11: 701-13.
Kim, D.H., D.D. Sarbassov, S.M. Ali, J.E. King, R.R. Latek, H. Erdjument-Bromage, P. Tempst, and D.M. Sabatini. 2002. mTOR interacts with raptor to form a nutrient-sensitive complex that signals to the cell growth machinery. Cell 110: 163-75.
Kim, D.H., D. Sarbassov dos, S.M. Ali, R.R. Latek, K.V. Guntur, H. Erdjument-Bromage, P. Tempst, and D.M. Sabatini. 2003. GbetaL, a positive regulator of the rapamycin-sensitive pathway required for the nutrient-sensitive interaction between raptor and mTOR. Mol Cell 11: 895-904.
Kimura, N., C. Tokunaga, S. Dalal, C. Richardson, K. Yoshino, K. Hara, B.E. Kemp, L.A. Witters, O. Mimura, and K. Yonezawa. 2003. A possible linkage between AMP-activated protein kinase (AMPK) and mammalian target of rapamycin (mTOR) signalling pathway. Genes Cells 8: 65-79.
Kitamura, T., Y. Kitamura, S. Kuroda, Y. Hino, M. Ando, K. Kotani, H. Konishi, H. Matsuzaki, U. Kikkawa, W. Ogawa, and M. Kasuga. 1999. Insulin-induced phosphorylation and activation of cyclic nucleotide phosphodiesterase 3B by the serine-threonine kinase Akt. Mol Cell Biol 19: 6286-96.
Kohn, A.D., K.S. Kovacina, and R.A. Roth. 1995. Insulin stimulates the kinase activity of RAC-PK, a pleckstrin homology domain containing ser/thr kinase. Embo J 14: 4288-95.
Kohn, A.D., S.A. Summers, M.J. Birnbaum, and R.A. Roth. 1996. Expression of a constitutively active Akt Ser/Thr kinase in 3T3-L1 adipocytes stimulates glucose uptake and glucose transporter 4 translocation. J Biol Chem 271: 31372-8.
Kozma, S.C. and G. Thomas. 2002. Regulation of cell size in growth, development and human disease: PI3K, PKB and S6K. Bioessays 24: 65-71.
Krymskaya, V.P. 2003. Tumour suppressors hamartin and tuberin: intracellular signalling. Cell Signal 15: 729-39.
Kwiatkowski, D.J., H. Zhang, J.L. Bandura, K.M. Heiberger, M. Glogauer, N. el-Hashemite, and H. Onda. 2002. A mouse model of TSC1 reveals sex-dependent lethality from liver hemangiomas, and up-regulation of p70S6 kinase activity in Tsc1 null cells. Hum Mol Genet 11: 525-34.
Li, D.M. and H. Sun. 1998. PTEN/MMAC1/TEP1 suppresses the tumorigenicity and induces G1 cell cycle arrest in human glioblastoma cells. Proc Natl Acad Sci U S A 95: 15406-11.
Li, Y., M.N. Corradetti, K. Inoki, and K.L. Guan. 2004. TSC2: filling the GAP in the mTOR signaling pathway. Trends Biochem Sci 29: 32-8.
Liang, J., J. Zubovitz, T. Petrocelli, R. Kotchetkov, M.K. Connor, K. Han, J.H. Lee, S. Ciarallo, C. Catzavelos, R. Beniston, E. Franssen, and J.M. Slingerland. 2002. PKB/Akt phosphorylates p27, impairs nuclear import of p27 and opposes p27-mediated G1 arrest. Nat Med 8: 1153-60.
Loewith, R., E. Jacinto, S. Wullschleger, A. Lorberg, J.L. Crespo, D. Bonenfant, W. Oppliger, P. Jenoe, and M.N. Hall. 2002. Two TOR complexes, only one of which is rapamycin sensitive, have distinct roles in cell growth control. Mol Cell 10: 457-68.
104
Maehama, T. and J.E. Dixon. 1998. The tumor suppressor, PTEN/MMAC1, dephosphorylates the lipid second messenger, phosphatidylinositol 3,4,5-trisphosphate. J Biol Chem 273: 13375-8.
Majewski, N., V. Nogueira, R.B. Robey, and N. Hay. 2004. Akt inhibits apoptosis downstream of BID cleavage via a glucose-dependent mechanism involving mitochondrial hexokinases. Mol Cell Biol 24: 730-40.
Majumder, P.K., P.G. Febbo, R. Bikoff, R. Berger, Q. Xue, L.M. McMahon, J. Manola, J. Brugarolas, T.J. McDonnell, T.R. Golub, M. Loda, H.A. Lane, and W.R. Sellers. 2004. mTOR inhibition reverses Akt-dependent prostate intraepithelial neoplasia through regulation of apoptotic and HIF-1-dependent pathways. Nat Med 10: 594-601.
Manning, B.D., A.R. Tee, M.N. Logsdon, J. Blenis, and L.C. Cantley. 2002. Identification of the tuberous sclerosis complex-2 tumor suppressor gene product tuberin as a target of the phosphoinositide 3-kinase/akt pathway. Mol Cell 10: 151-62.
Mayo, L.D. and D.B. Donner. 2001. A phosphatidylinositol 3-kinase/Akt pathway promotes translocation of Mdm2 from the cytoplasm to the nucleus. Proc Natl Acad Sci U S A 98: 11598-603.
Mazure, N.M., E.Y. Chen, K.R. Laderoute, and A.J. Giaccia. 1997. Induction of vascular endothelial growth factor by hypoxia is modulated by a phosphatidylinositol 3-kinase/Akt signaling pathway in Ha-ras-transformed cells through a hypoxia inducible factor-1 transcriptional element. Blood 90: 3322-31.
McManus, E.J. and D.R. Alessi. 2002. TSC1-TSC2: a complex tale of PKB-mediated S6K regulation. Nat Cell Biol 4: E214-6.
Meisse, D., M. Van de Casteele, C. Beauloye, I. Hainault, B.A. Kefas, M.H. Rider, F. Foufelle, and L. Hue. 2002. Sustained activation of AMP-activated protein kinase induces c-Jun N-terminal kinase activation and apoptosis in liver cells. FEBS Lett 526: 38-42.
Morgenstern, J.P. and H. Land. 1990. Advanced mammalian gene transfer: high titre retroviral vectors with multiple drug selection markers and a complementary helper-free packaging cell line. Nucleic Acids Res 18: 3587-96.
Mu, J., J.T. Brozinick, Jr., O. Valladares, M. Bucan, and M.J. Birnbaum. 2001. A role for AMP-activated protein kinase in contraction- and hypoxia-regulated glucose transport in skeletal muscle. Mol Cell 7: 1085-94.
Myers, M.P., I. Pass, I.H. Batty, J. Van der Kaay, J.P. Stolarov, B.A. Hemmings, M.H. Wigler, C.P. Downes, and N.K. Tonks. 1998. The lipid phosphatase activity of PTEN is critical for its tumor supressor function. Proc Natl Acad Sci U S A 95: 13513-8.
Nave, B.T., M. Ouwens, D.J. Withers, D.R. Alessi, and P.R. Shepherd. 1999. Mammalian target of rapamycin is a direct target for protein kinase B: identification of a convergence point for opposing effects of insulin and amino-acid deficiency on protein translation. Biochem J 344 Pt 2: 427-31.
Nellist, M., M.A. Goedbloed, C. de Winter, B. Verhaaf, A. Jankie, A.J. Reuser, A.M. van den Ouweland, P. van der Sluijs, and D.J. Halley. 2002. Identification and characterization of the interaction between tuberin and 14-3-3zeta. J Biol Chem 277: 39417-24.
Ossovskaya, V.S., I.A. Mazo, M.V. Chernov, O.B. Chernova, Z. Strezoska, R. Kondratov, G.R. Stark, P.M. Chumakov, and A.V. Gudkov. 1996. Use of
105
genetic suppressor elements to dissect distinct biological effects of separate p53 domains. Proc Natl Acad Sci U S A 93: 10309-14.
Paduch, M., F. Jelen, and J. Otlewski. 2001. Structure of small G proteins and their regulators. Acta Biochim Pol 48: 829-50.
Pallafacchina, G., E. Calabria, A.L. Serrano, J.M. Kalhovde, and S. Schiaffino. 2002. A protein kinase B-dependent and rapamycin-sensitive pathway controls skeletal muscle growth but not fiber type specification. Proc Natl Acad Sci U S A 99: 9213-8.
Pan, D., J. Dong, Y. Zhang, and X. Gao. 2004. Tuberous sclerosis complex: from Drosophila to human disease. Trends Cell Biol 14: 78-85.
Parsons, R. and L. Simpson. 2003. PTEN and cancer. Methods Mol Biol 222: 147-66.
Peng, X.D., P.Z. Xu, M.L. Chen, A. Hahn-Windgassen, J. Skeen, J. Jacobs, D. Sundararajan, W.S. Chen, S.E. Crawford, K.G. Coleman, and N. Hay. 2003. Dwarfism, impaired skin development, skeletal muscle atrophy, delayed bone development, and impeded adipogenesis in mice lacking Akt1 and Akt2. Genes Dev 17: 1352-65.
Peterson, R.T. and S.L. Schreiber. 1999. Kinase phosphorylation: Keeping it all in the family. Curr Biol 9: R521-4.
Podsypanina, K., R.T. Lee, C. Politis, I. Hennessy, A. Crane, J. Puc, M. Neshat, H. Wang, L. Yang, J. Gibbons, P. Frost, V. Dreisbach, J. Blenis, Z. Gaciong, P. Fisher, C. Sawyers, L. Hedrick-Ellenson, and R. Parsons. 2001. An inhibitor of mTOR reduces neoplasia and normalizes p70/S6 kinase activity in Pten+/- mice. Proc Natl Acad Sci U S A 98: 10320-5.
Potter, C.J., H. Huang, and T. Xu. 2001. Drosophila Tsc1 functions with Tsc2 to antagonize insulin signaling in regulating cell growth, cell proliferation, and organ size. Cell 105: 357-68.
Potter, C.J., L.G. Pedraza, and T. Xu. 2002. Akt regulates growth by directly phosphorylating Tsc2. Nat Cell Biol 4: 658-65.
Proud, C.G. 2002. Regulation of mammalian translation factors by nutrients. Eur J Biochem 269: 5338-49.
Radimerski, T., J. Montagne, M. Hemmings-Mieszczak, and G. Thomas. 2002. Lethality of Drosophila lacking TSC tumor suppressor function rescued by reducing dS6K signaling. Genes Dev 16: 2627-32.
Ravichandran, L.V., H. Chen, Y. Li, and M.J. Quon. 2001. Phosphorylation of PTP1B at Ser(50) by Akt impairs its ability to dephosphorylate the insulin receptor. Mol Endocrinol 15: 1768-80.
Reynolds, T.H.t., S.C. Bodine, and J.C. Lawrence, Jr. 2002. Control of Ser2448 phosphorylation in the mammalian target of rapamycin by insulin and skeletal muscle load. J Biol Chem 277: 17657-62.
Romanelli, A., V.C. Dreisbach, and J. Blenis. 2002. Characterization of phosphatidylinositol 3-kinase-dependent phosphorylation of the
106
hydrophobic motif site Thr(389) in p70 S6 kinase 1. J Biol Chem 277: 40281-9.
Rommel, C., S.C. Bodine, B.A. Clarke, R. Rossman, L. Nunez, T.N. Stitt, G.D. Yancopoulos, and D.J. Glass. 2001. Mediation of IGF-1-induced skeletal myotube hypertrophy by PI(3)K/Akt/mTOR and PI(3)K/Akt/GSK3 pathways. Nat Cell Biol 3: 1009-13.
Rossi, D.J., A. Ylikorkala, N. Korsisaari, R. Salovaara, K. Luukko, V. Launonen, M. Henkemeyer, A. Ristimaki, L.A. Aaltonen, and T.P. Makela. 2002. Induction of cyclooxygenase-2 in a mouse model of Peutz-Jeghers polyposis. Proc Natl Acad Sci U S A 99: 12327-32.
Ryazanov, A.G., M.D. Ward, C.E. Mendola, K.S. Pavur, M.V. Dorovkov, M. Wiedmann, H. Erdjument-Bromage, P. Tempst, T.G. Parmer, C.R. Prostko, F.J. Germino, and W.N. Hait. 1997. Identification of a new class of protein kinases represented by eukaryotic elongation factor-2 kinase. Proc Natl Acad Sci U S A 94: 4884-9.
Sabatini, D.M., H. Erdjument-Bromage, M. Lui, P. Tempst, and S.H. Snyder. 1994. RAFT1: a mammalian protein that binds to FKBP12 in a rapamycin-dependent fashion and is homologous to yeast TORs. Cell 78: 35-43.
Sabers, C.J., M.M. Martin, G.J. Brunn, J.M. Williams, F.J. Dumont, G. Wiederrecht, and R.T. Abraham. 1995. Isolation of a protein target of the FKBP12-rapamycin complex in mammalian cells. J Biol Chem 270: 815-22.
Sambrook, J., Frisch,E.F., Maniatis,T. 1998. Molecular Cloning: A Laboratory Manuel.2nd ed,. Cold Spring Harbor Laboratory Press.
Sanchez-Cespedes, M., P. Parrella, M. Esteller, S. Nomoto, B. Trink, J.M. Engles, W.H. Westra, J.G. Herman, and D. Sidransky. 2002. Inactivation of LKB1/STK11 is a common event in adenocarcinomas of the lung. Cancer Res 62: 3659-62.
Sapkota, G.P., J. Boudeau, M. Deak, A. Kieloch, N. Morrice, and D.R. Alessi. 2002. Identification and characterization of four novel phosphorylation sites (Ser31, Ser325, Thr336 and Thr366) on LKB1/STK11, the protein kinase mutated in Peutz-Jeghers cancer syndrome. Biochem J 362: 481-90.
Sapkota, G.P., A. Kieloch, J.M. Lizcano, S. Lain, J.S. Arthur, M.R. Williams, N. Morrice, M. Deak, and D.R. Alessi. 2001. Phosphorylation of the protein kinase mutated in Peutz-Jeghers cancer syndrome, LKB1/STK11, at Ser431 by p90(RSK) and cAMP-dependent protein kinase, but not its farnesylation at Cys(433), is essential for LKB1 to suppress cell vrowth. J Biol Chem 276: 19469-82.
Saucedo, L.J. and B.A. Edgar. 2002. Why size matters: altering cell size. Curr Opin Genet Dev 12: 565-71.
Saucedo, L.J., X. Gao, D.A. Chiarelli, L. Li, D. Pan, and B.A. Edgar. 2003. Rheb promotes cell growth as a component of the insulin/TOR signalling network. Nat Cell Biol 5: 566-71.
Scanga, S.E., L. Ruel, R.C. Binari, B. Snow, V. Stambolic, D. Bouchard, M. Peters, B. Calvieri, T.W. Mak, J.R. Woodgett, and A.S. Manoukian. 2000. The conserved PI3'K/PTEN/Akt signaling pathway regulates both cell size and survival in Drosophila. Oncogene 19: 3971-7.
Schalm, S.S. and J. Blenis. 2002. Identification of a conserved motif required for mTOR signaling. Curr Biol 12: 632-9.
107
Scott, P.H. and J.C. Lawrence, Jr. 1998. Attenuation of mammalian target of rapamycin activity by increased cAMP in 3T3-L1 adipocytes. J Biol Chem 273: 34496-501.
Sekulic, A., C.C. Hudson, J.L. Homme, P. Yin, D.M. Otterness, L.M. Karnitz, and R.T. Abraham. 2000. A direct linkage between the phosphoinositide 3-kinase-AKT signaling pathway and the mammalian target of rapamycin in mitogen-stimulated and transformed cells. Cancer Res 60: 3504-13.
Shaw, R.J., N. Bardeesy, B.D. Manning, L. Lopez, M. Kosmatka, R.A. DePinho, and L.C. Cantley. 2004. The LKB1 tumor suppressor negatively regulates mTOR signaling. Cancer Cell 6: 91-9.
Shin, I., F.M. Yakes, F. Rojo, N.Y. Shin, A.V. Bakin, J. Baselga, and C.L. Arteaga. 2002. PKB/Akt mediates cell-cycle progression by phosphorylation of p27(Kip1) at threonine 157 and modulation of its cellular localization. Nat Med 8: 1145-52.
Shioi, T., J.R. McMullen, P.M. Kang, P.S. Douglas, T. Obata, T.F. Franke, L.C. Cantley, and S. Izumo. 2002. Akt/protein kinase B promotes organ growth in transgenic mice. Mol Cell Biol 22: 2799-809.
Stambolic, V., A. Suzuki, J.L. de la Pompa, G.M. Brothers, C. Mirtsos, T. Sasaki, J. Ruland, J.M. Penninger, D.P. Siderovski, and T.W. Mak. 1998. Negative regulation of PKB/Akt-dependent cell survival by the tumor suppressor PTEN. Cell 95: 29-39.
Stephens, L., K. Anderson, D. Stokoe, H. Erdjument-Bromage, G.F. Painter, A.B. Holmes, P.R. Gaffney, C.B. Reese, F. McCormick, P. Tempst, J. Coadwell, and P.T. Hawkins. 1998. Protein kinase B kinases that mediate phosphatidylinositol 3,4,5-trisphosphate-dependent activation of protein kinase B. Science 279: 710-4.
Stocker, H., T. Radimerski, B. Schindelholz, F. Wittwer, P. Belawat, P. Daram, S. Breuer, G. Thomas, and E. Hafen. 2003. Rheb is an essential regulator of S6K in controlling cell growth in Drosophila. Nat Cell Biol 5: 559-65.
Tanti, J.F., S. Grillo, T. Gremeaux, P.J. Coffer, E. Van Obberghen, and Y. Le Marchand-Brustel. 1997. Potential role of protein kinase B in glucose transporter 4 translocation in adipocytes. Endocrinology 138: 2005-10.
Tee, A.R., D.C. Fingar, B.D. Manning, D.J. Kwiatkowski, L.C. Cantley, and J. Blenis. 2002. Tuberous sclerosis complex-1 and -2 gene products function together to inhibit mammalian target of rapamycin (mTOR)-mediated downstream signaling. Proc Natl Acad Sci U S A 99: 13571-6.
Tokunaga, C., K. Yoshino, and K. Yonezawa. 2004. mTOR integrates amino acid- and energy-sensing pathways. Biochem Biophys Res Commun 313: 443-6.
van Slegtenhorst, M., R. de Hoogt, C. Hermans, M. Nellist, B. Janssen, S. Verhoef, D. Lindhout, A. van den Ouweland, D. Halley, J. Young, M. Burley, S. Jeremiah, K. Woodward, J. Nahmias, M. Fox, R. Ekong, J. Osborne, J. Wolfe, S. Povey, R.G. Snell, J.P. Cheadle, A.C. Jones, M. Tachataki, D. Ravine, D.J. Kwiatkowski, and et al. 1997. Identification of the tuberous sclerosis gene TSC1 on chromosome 9q34. Science 277: 805-8.
Vanhaesebroeck, B. and M.D. Waterfield. 1999. Signaling by distinct classes of phosphoinositide 3-kinases. Exp Cell Res 253: 239-54.
Viglietto, G., M.L. Motti, P. Bruni, R.M. Melillo, A. D'Alessio, D. Califano, F. Vinci, G. Chiappetta, P. Tsichlis, A. Bellacosa, A. Fusco, and M. Santoro. 2002.
108
Cytoplasmic relocalization and inhibition of the cyclin-dependent kinase inhibitor p27(Kip1) by PKB/Akt-mediated phosphorylation in breast cancer. Nat Med 8: 1136-44.
Vousden, K.H. and X. Lu. 2002. Live or let die: the cell's response to p53. Nat Rev Cancer 2: 594-604.
Walker, K.S., M. Deak, A. Paterson, K. Hudson, P. Cohen, and D.R. Alessi. 1998. Activation of protein kinase B beta and gamma isoforms by insulin in vivo and by 3-phosphoinositide-dependent protein kinase-1 in vitro: comparison with protein kinase B alpha. Biochem J 331 ( Pt 1): 299-308.
Williams, M.R., J.S. Arthur, A. Balendran, J. van der Kaay, V. Poli, P. Cohen, and D.R. Alessi. 2000. The role of 3-phosphoinositide-dependent protein kinase 1 in activating AGC kinases defined in embryonic stem cells. Curr Biol 10: 439-48.
Woods, A., D. Azzout-Marniche, M. Foretz, S.C. Stein, P. Lemarchand, P. Ferre, F. Foufelle, and D. Carling. 2000. Characterization of the role of AMP-activated protein kinase in the regulation of glucose-activated gene expression using constitutively active and dominant negative forms of the kinase. Mol Cell Biol 20: 6704-11.
Xu, G., G. Kwon, W.S. Cruz, C.A. Marshall, and M.L. McDaniel. 2001. Metabolic regulation by leucine of translation initiation through the mTOR-signaling pathway by pancreatic beta-cells. Diabetes 50: 353-60.
Zhang, H., G. Cicchetti, H. Onda, H.B. Koon, K. Asrican, N. Bajraszewski, F. Vazquez, C.L. Carpenter, and D.J. Kwiatkowski. 2003a. Loss of Tsc1/Tsc2 activates mTOR and disrupts PI3K-Akt signaling through downregulation of PDGFR. J Clin Invest 112: 1223-33.
Zhang, Y., X. Gao, L.J. Saucedo, B. Ru, B.A. Edgar, and D. Pan. 2003b. Rheb is a direct target of the tuberous sclerosis tumour suppressor proteins. Nat Cell Biol 5: 578-81.
Zhou, B.P., Y. Liao, W. Xia, Y. Zou, B. Spohn, and M.C. Hung. 2001. HER-2/neu induces p53 ubiquitination via Akt-mediated MDM2 phosphorylation. Nat Cell Biol 3: 973-82.
109
Lebenslauf
05.12.1968 geboren in Burg
Vater: Dieter Hahn, Landwirt
Mutter: Renate Hahn, Versicherungskauffrau
1975-1985 Allgemeinbildene Oberschule in Tucheim
1985-1987 Ausbildung zum Facharbeiter Anlagen-und Prozess technik bei der Henkel AG in Genthin
1987-1988 Erziehungsurlaub fuer meinen Sohn Sebastian
1988-1991 Fachschulausbildung in Gerwisch (Hochschulzugangsberechtigung)
1991-1996 Mitarbeiter bei der Firma Herbstreith & Fox in Werder und Wyeth Pharmaceutical in Leipzig
1996-2001 Studium der Biotechnology an der Technischen Universitaet Berlin Abschluss als Diplom-Ingenieurin Diplomarbeit am Max-Delbrueck-Institut in Berlin
Im Fachbereich Biochemie und molekulare Genetik an der University of Illinois in Chicago in der Arbeitsgruppe von Prof. Dr. Nissim Hay. Betreuung der Dissertation durch Prof. Dr. Ulf Stahl an der Technischen Universitaet Berlin.

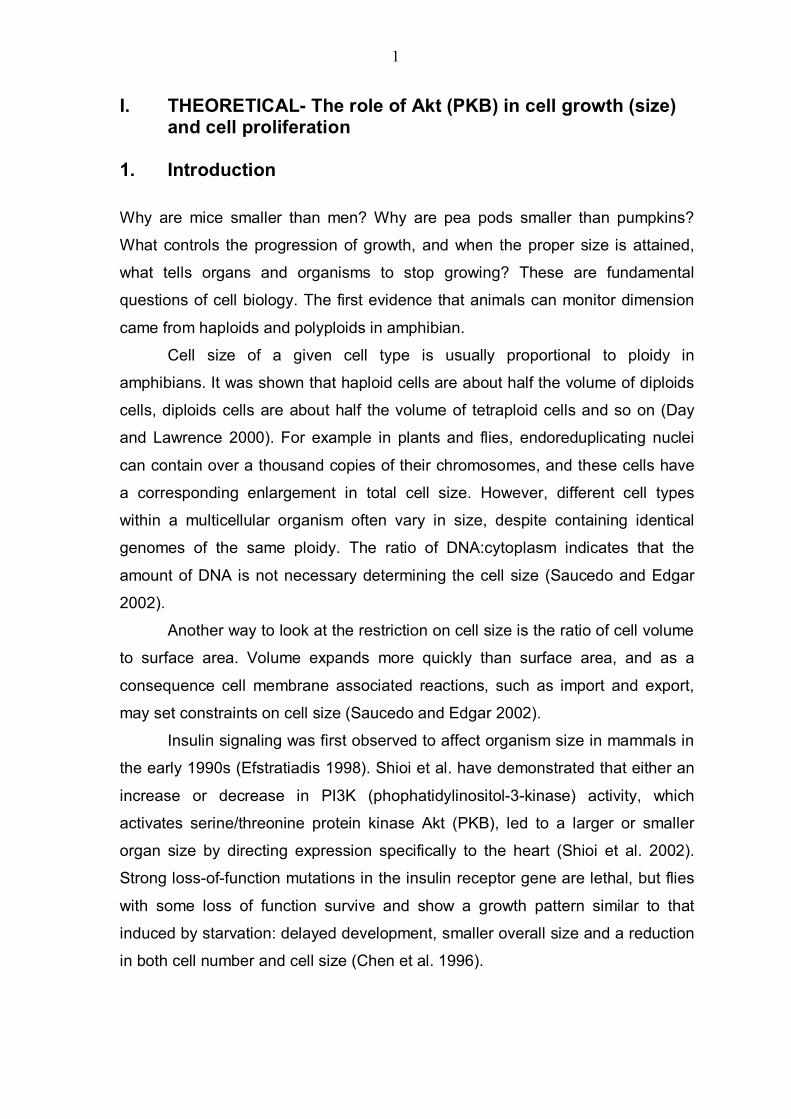
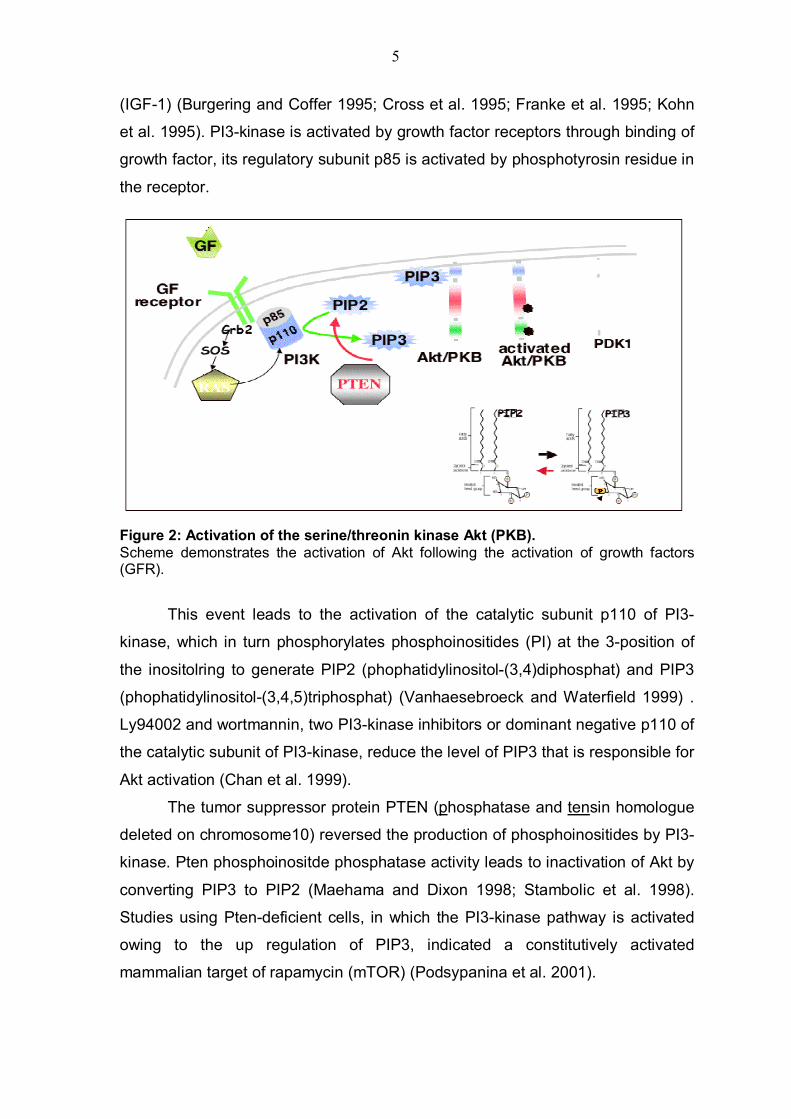

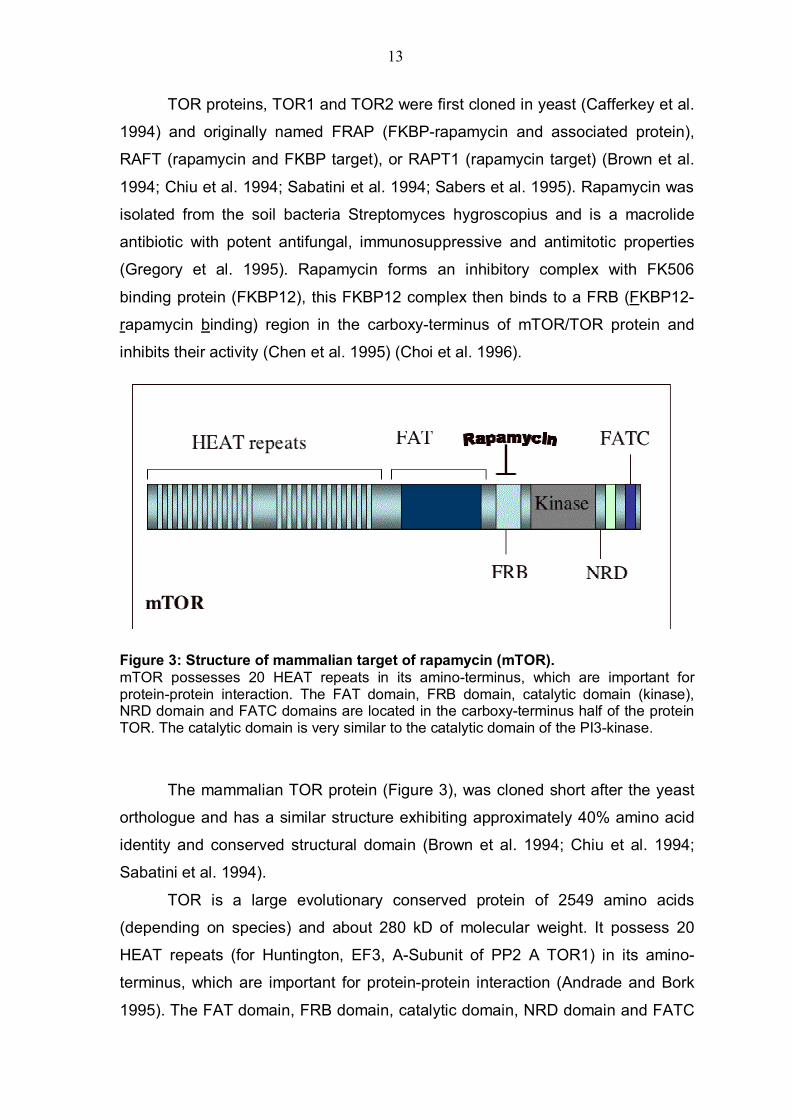

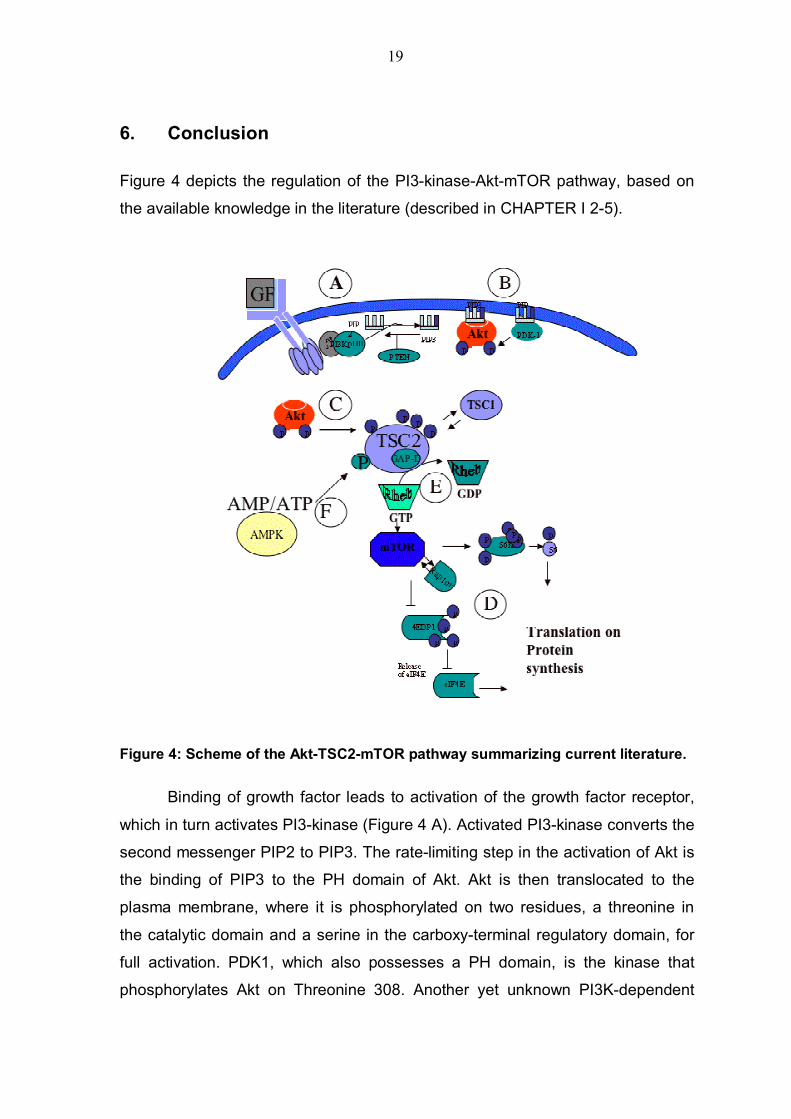
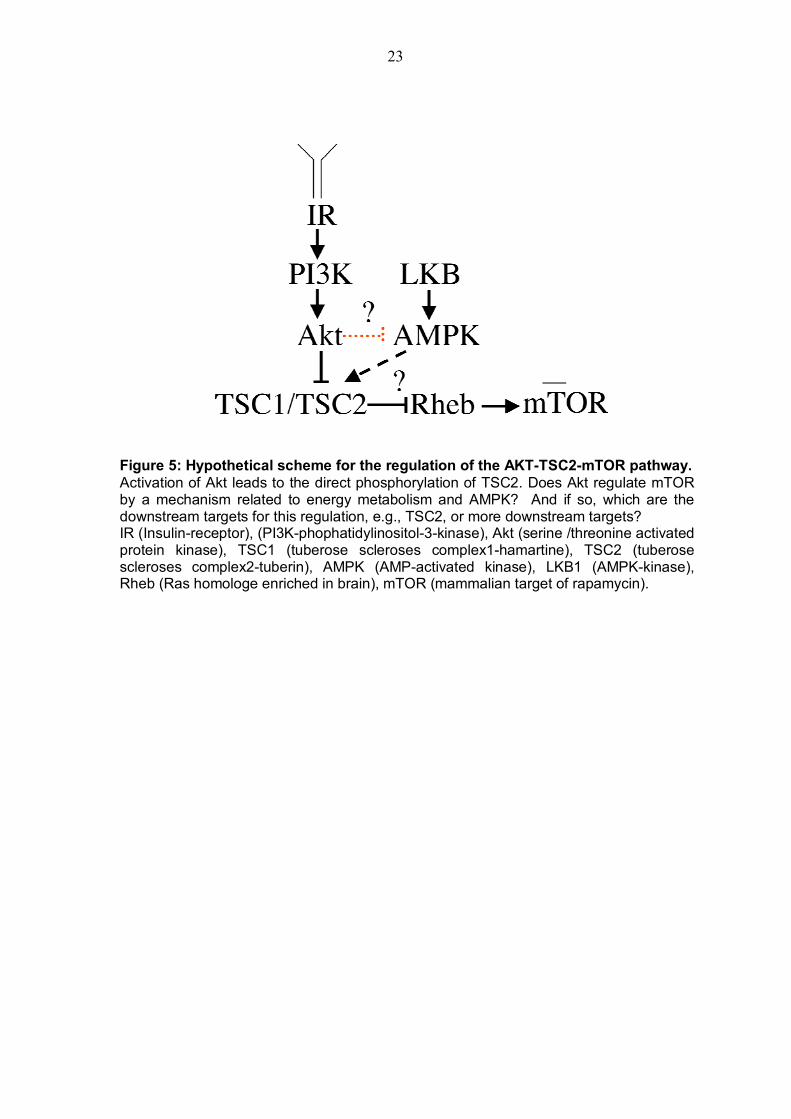
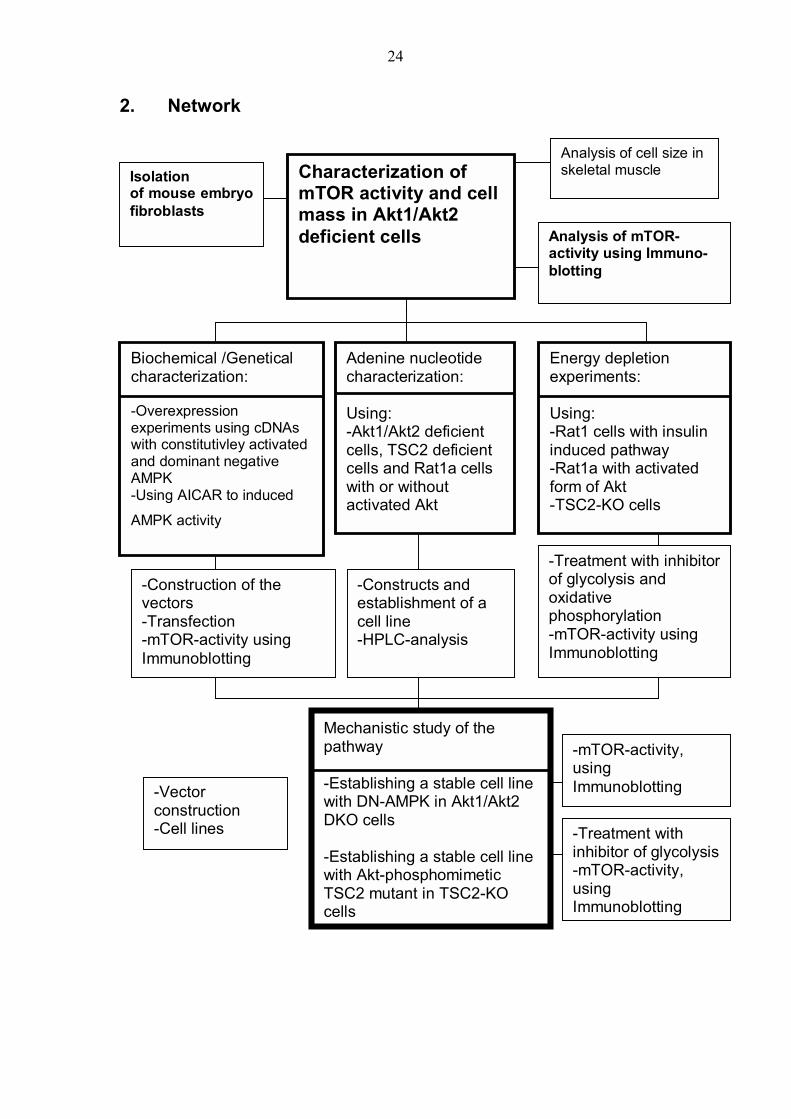
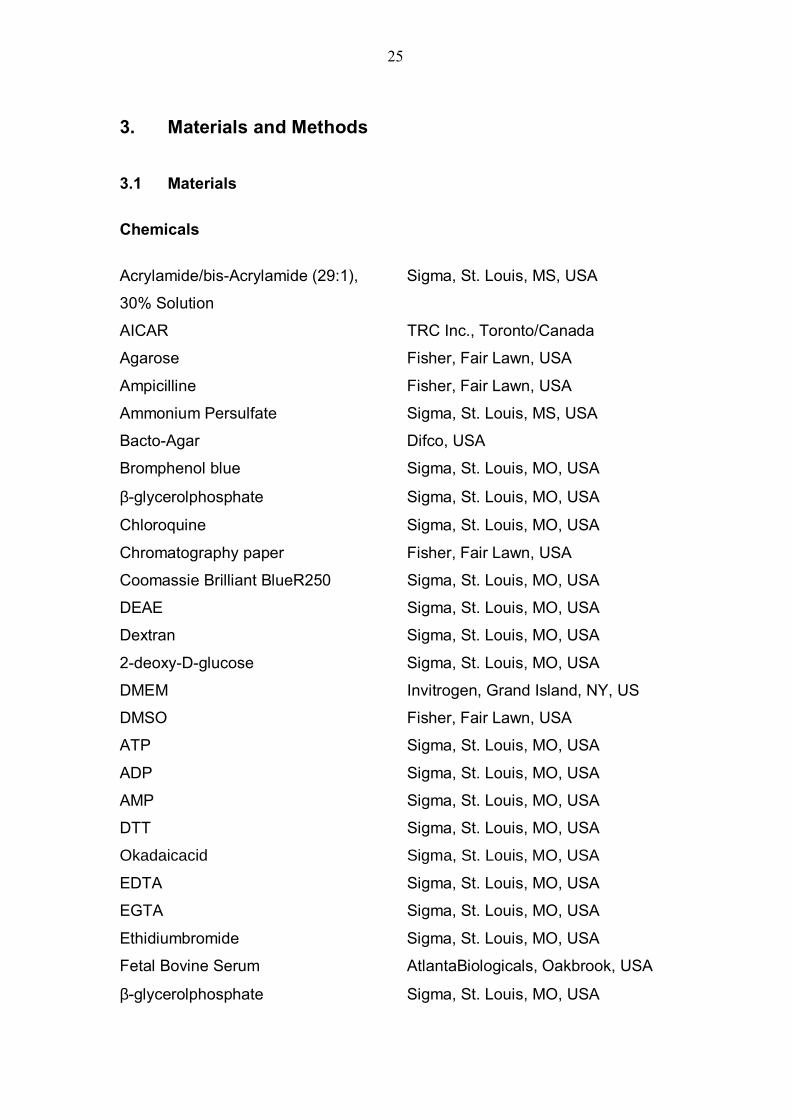
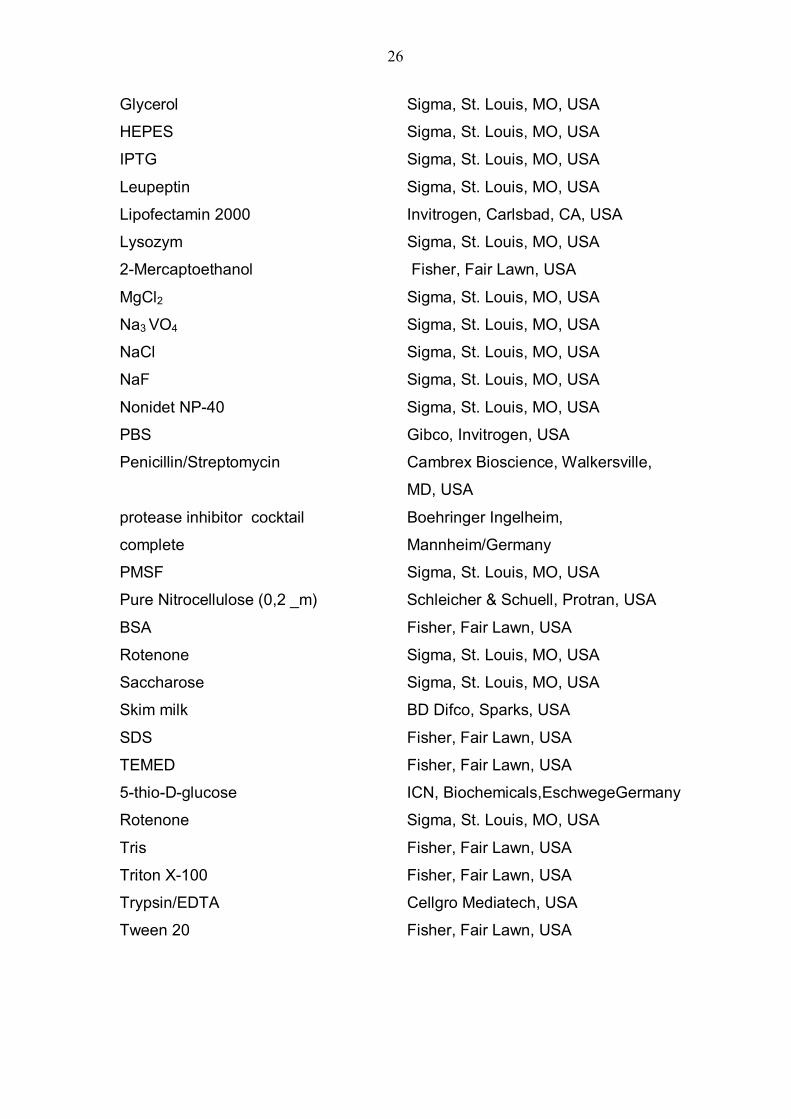
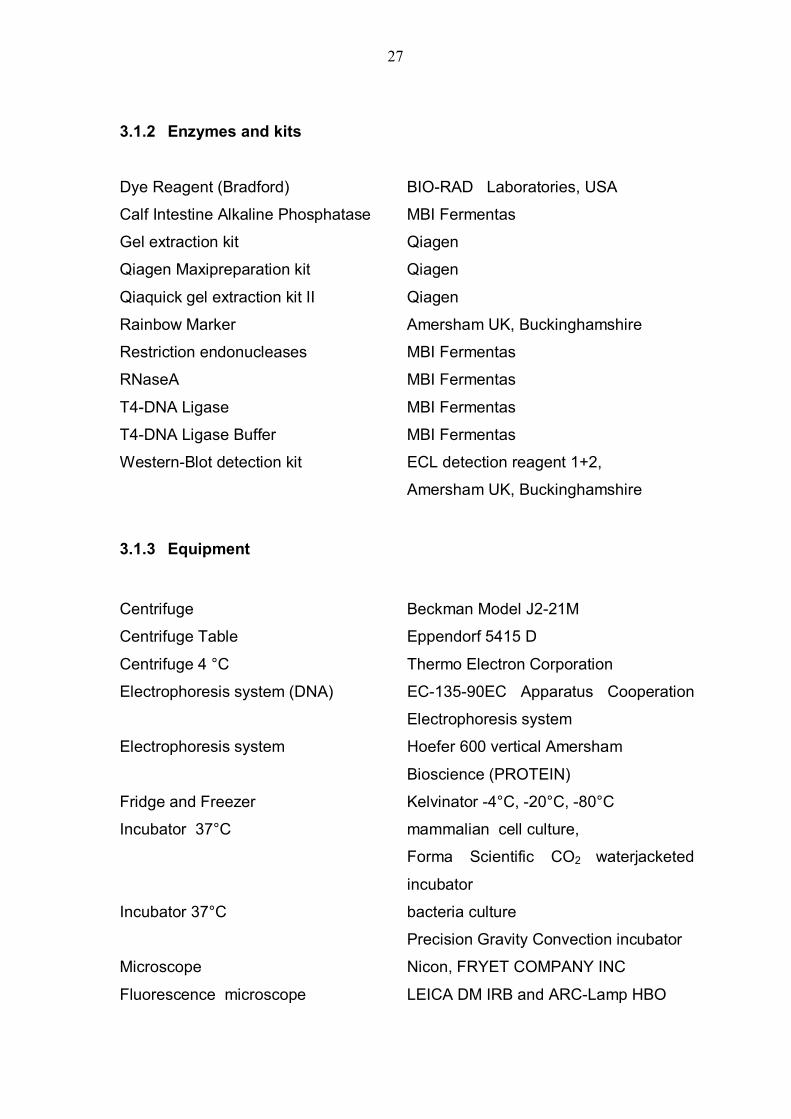
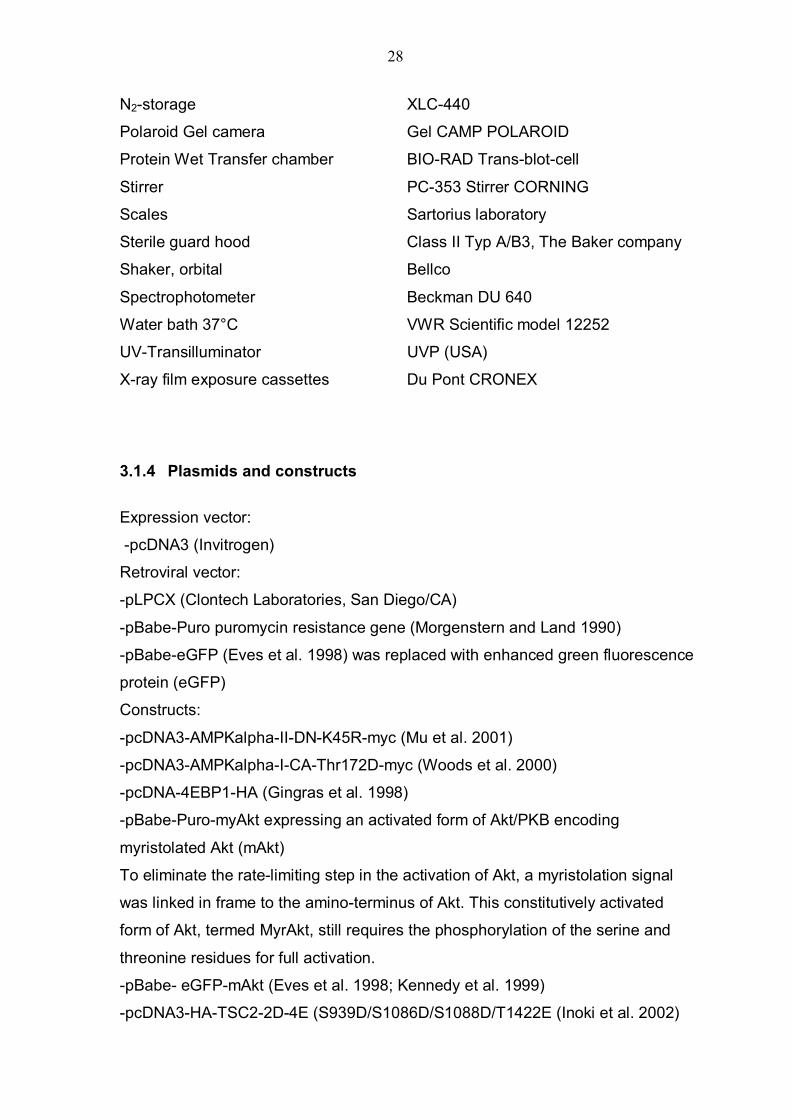
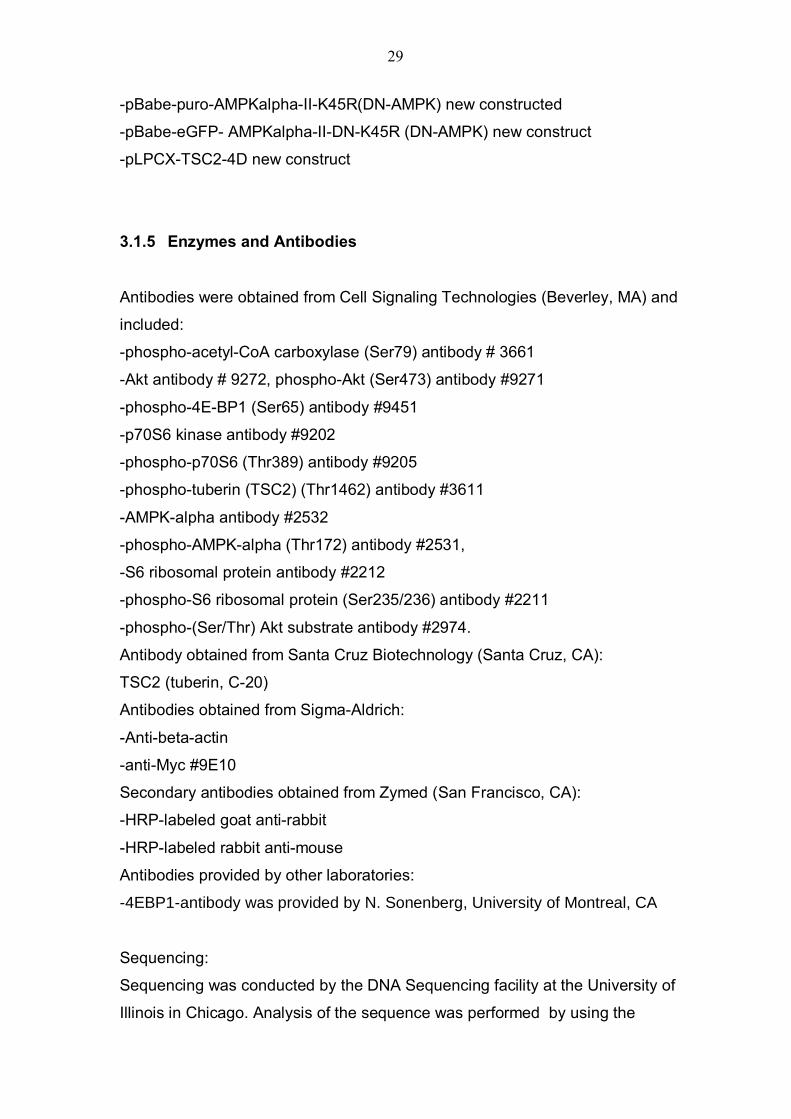
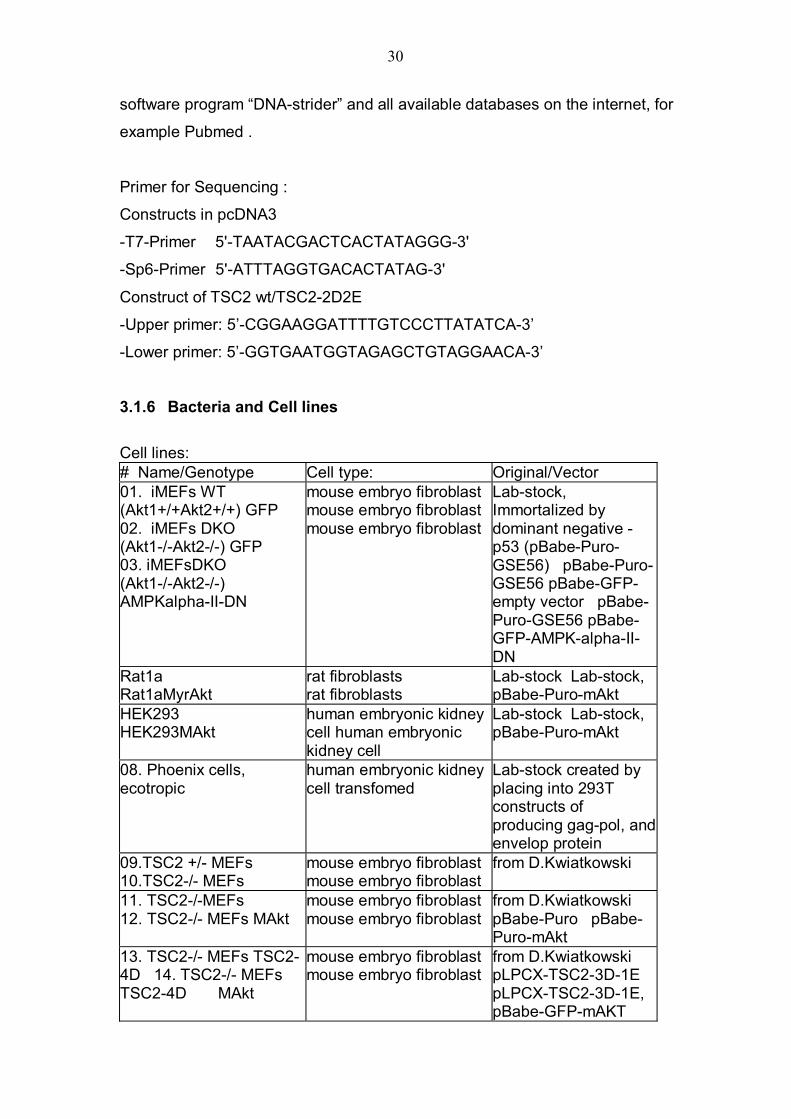
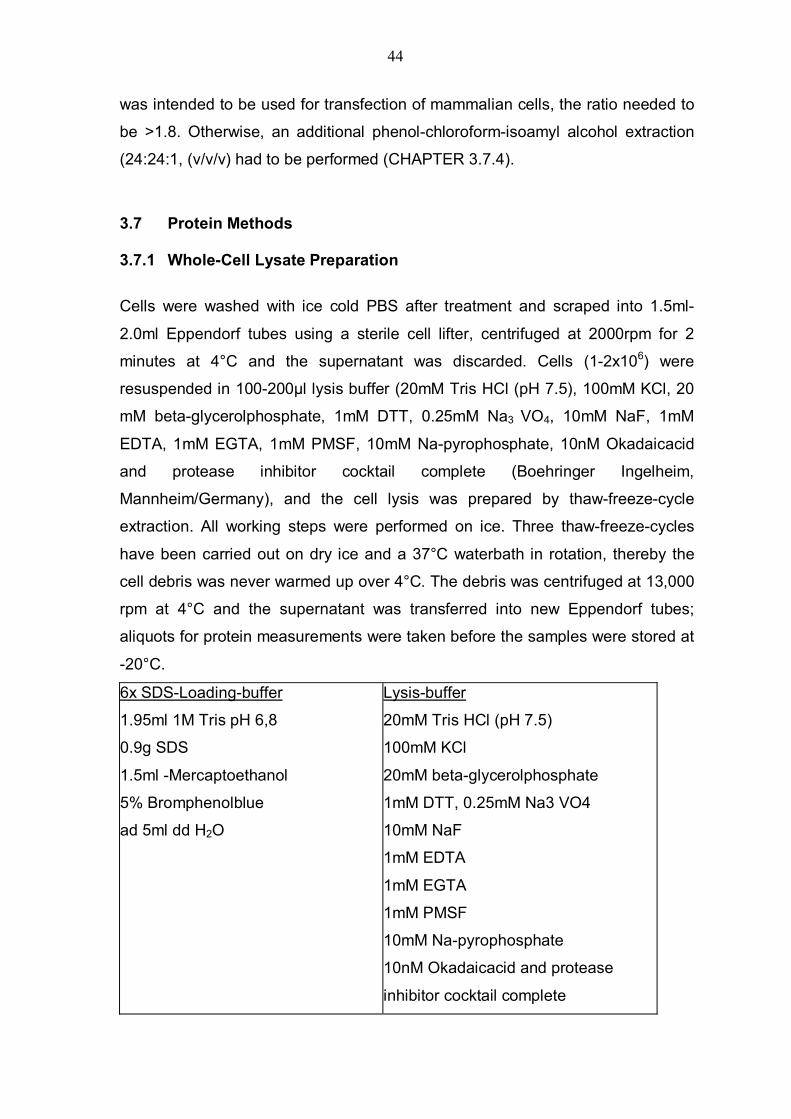
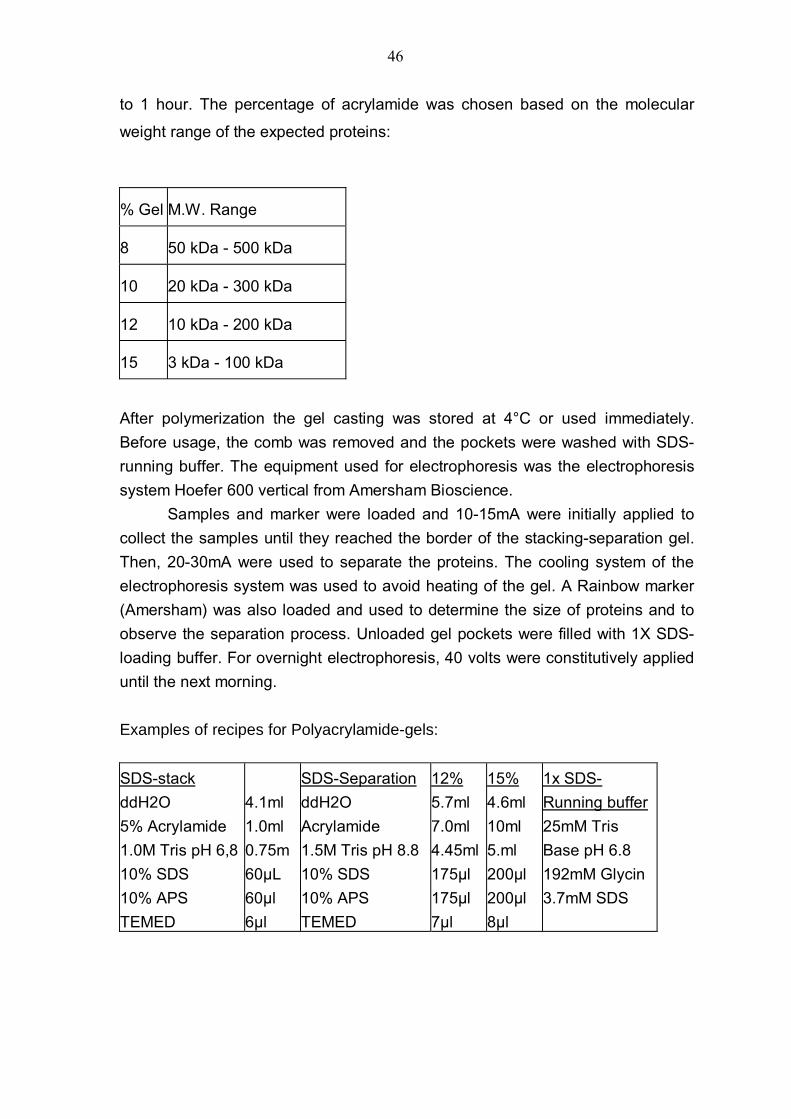

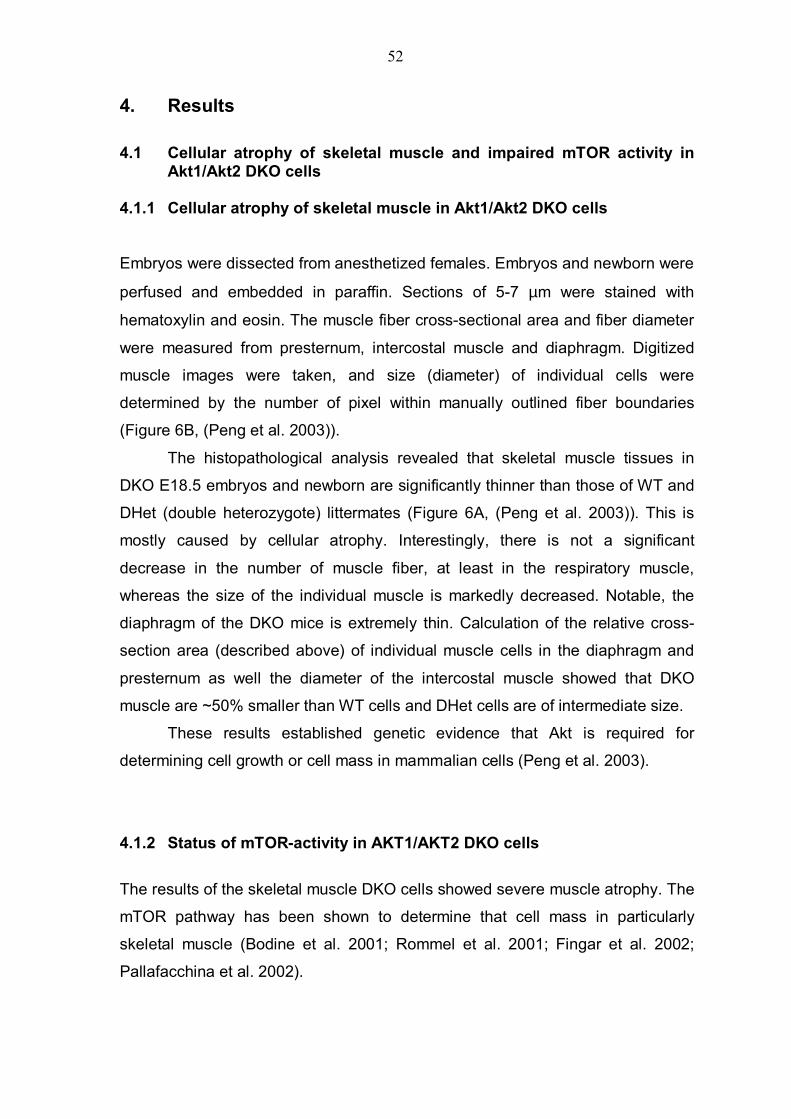
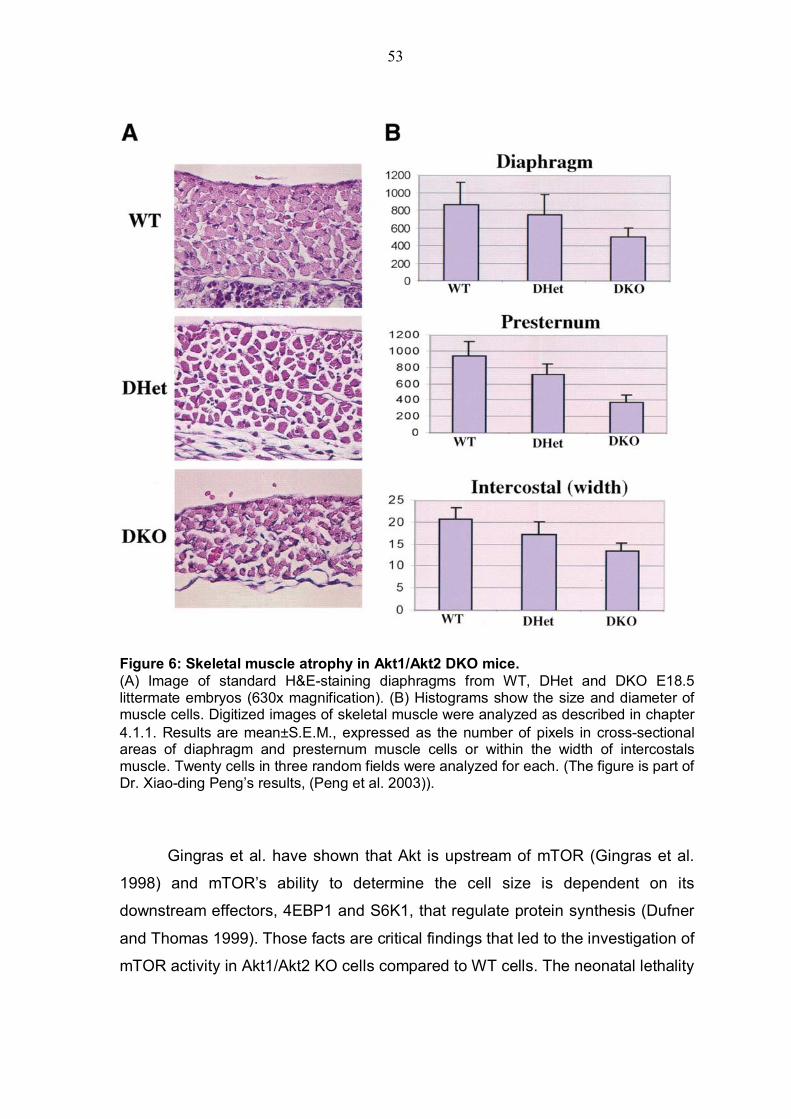
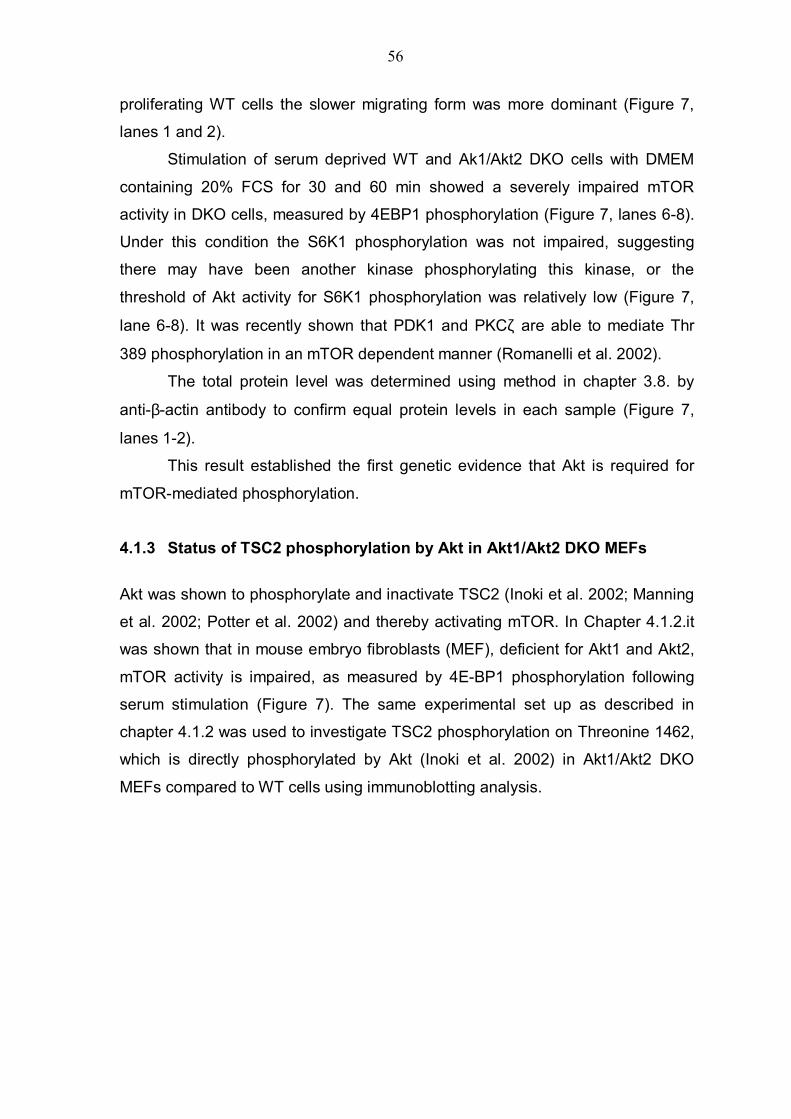
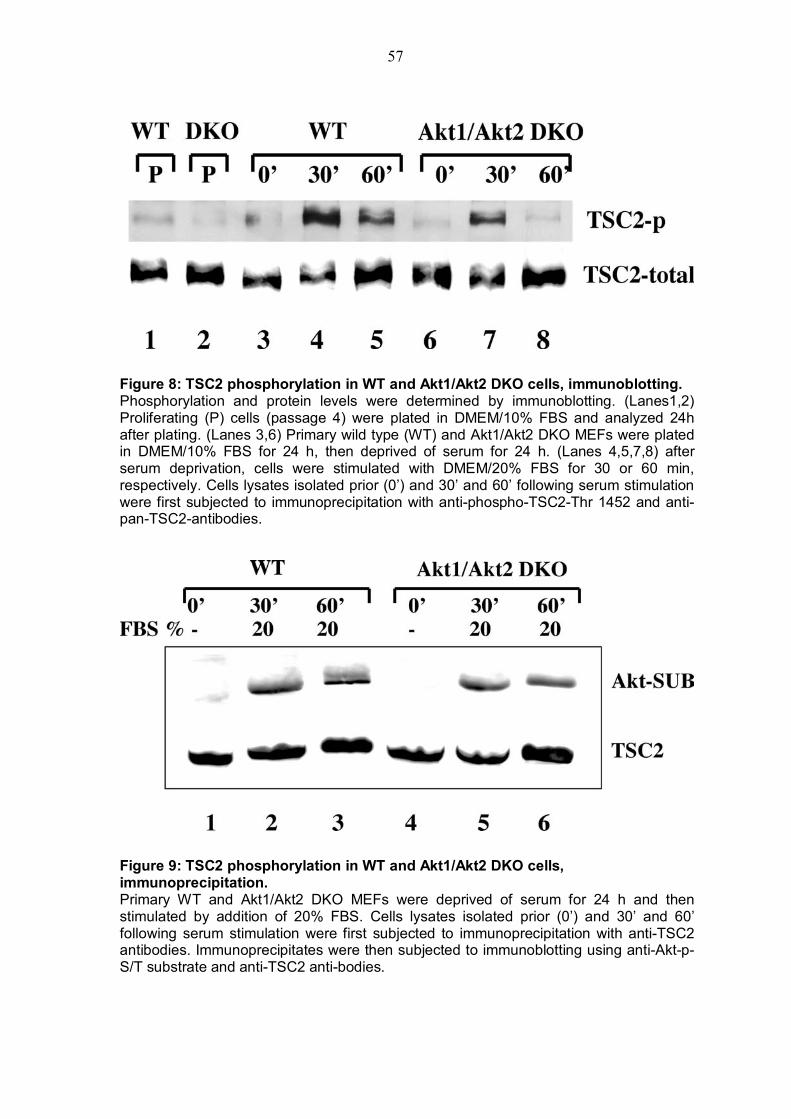
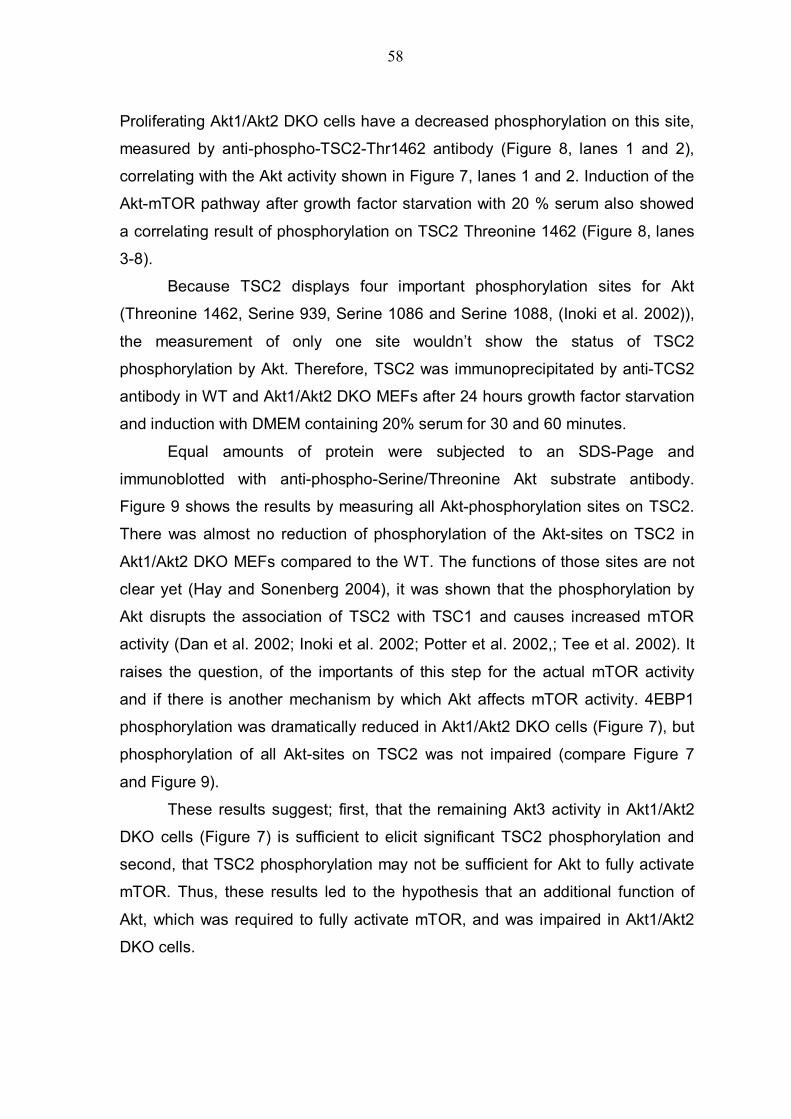

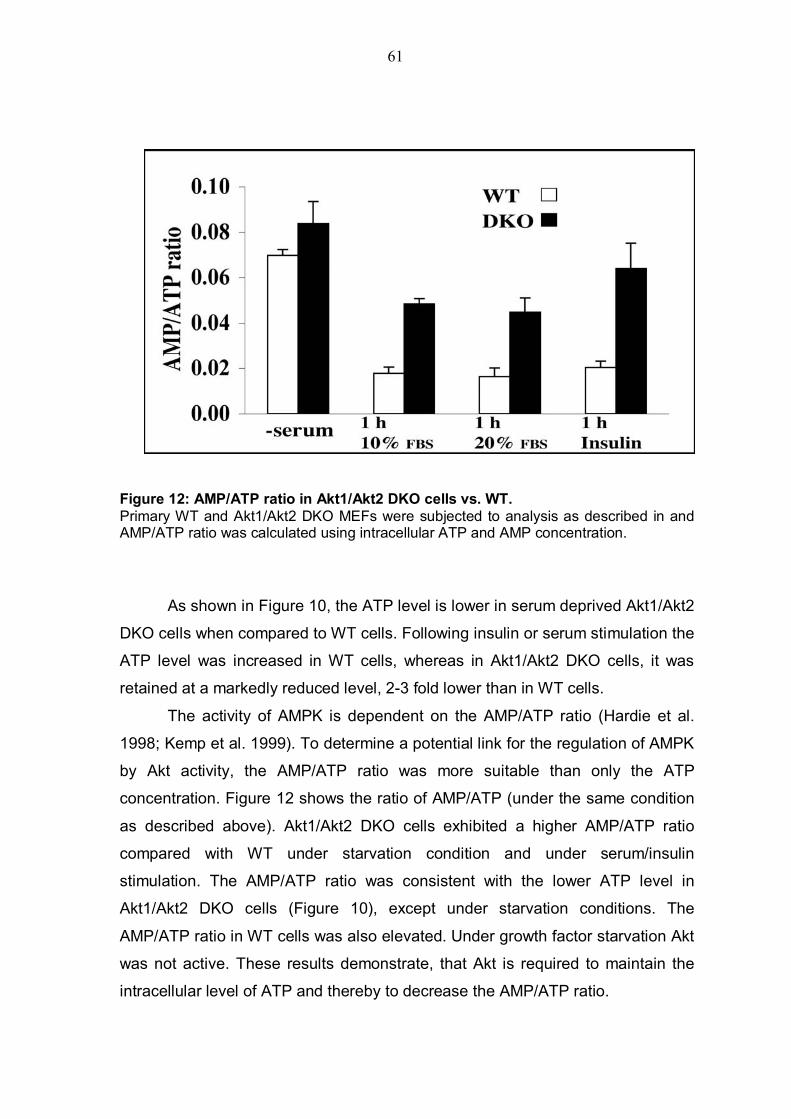
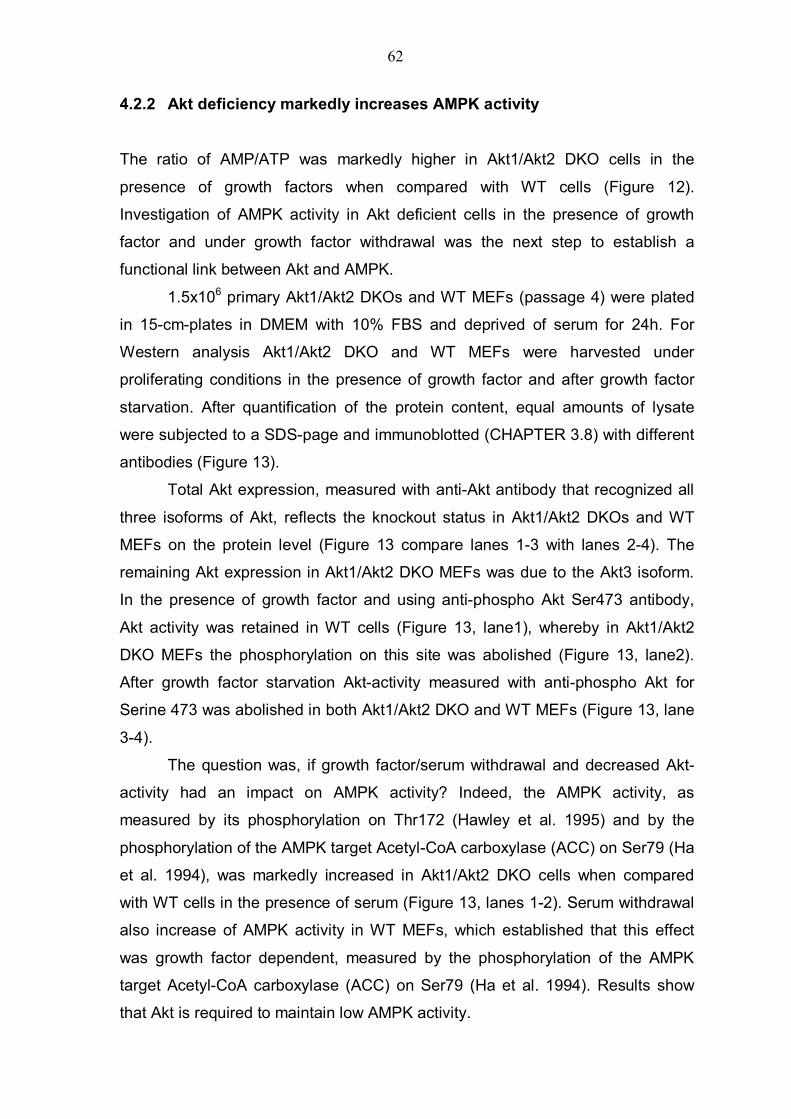
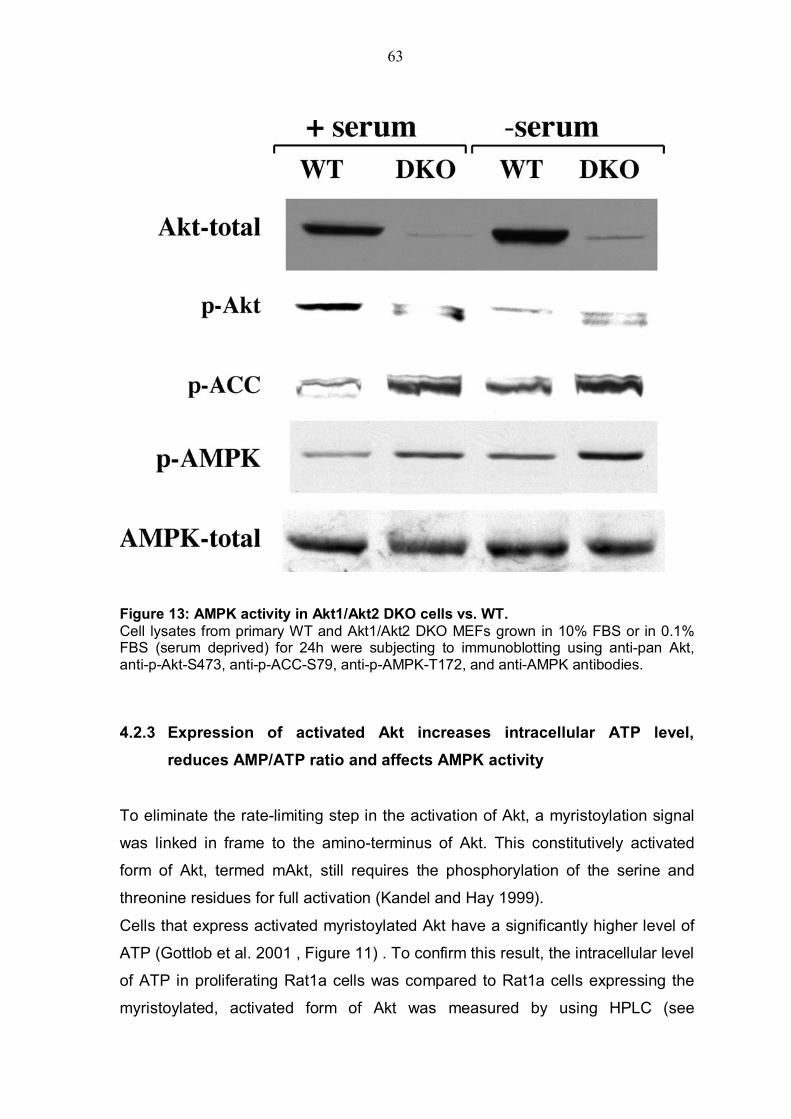
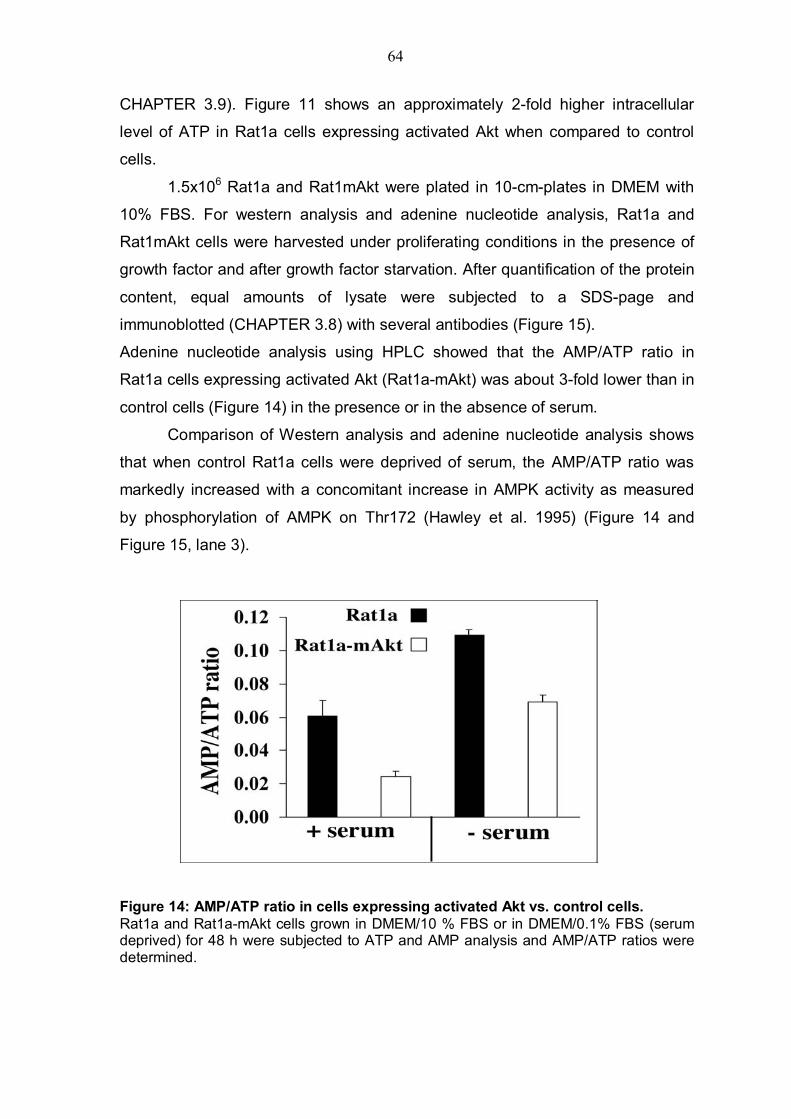
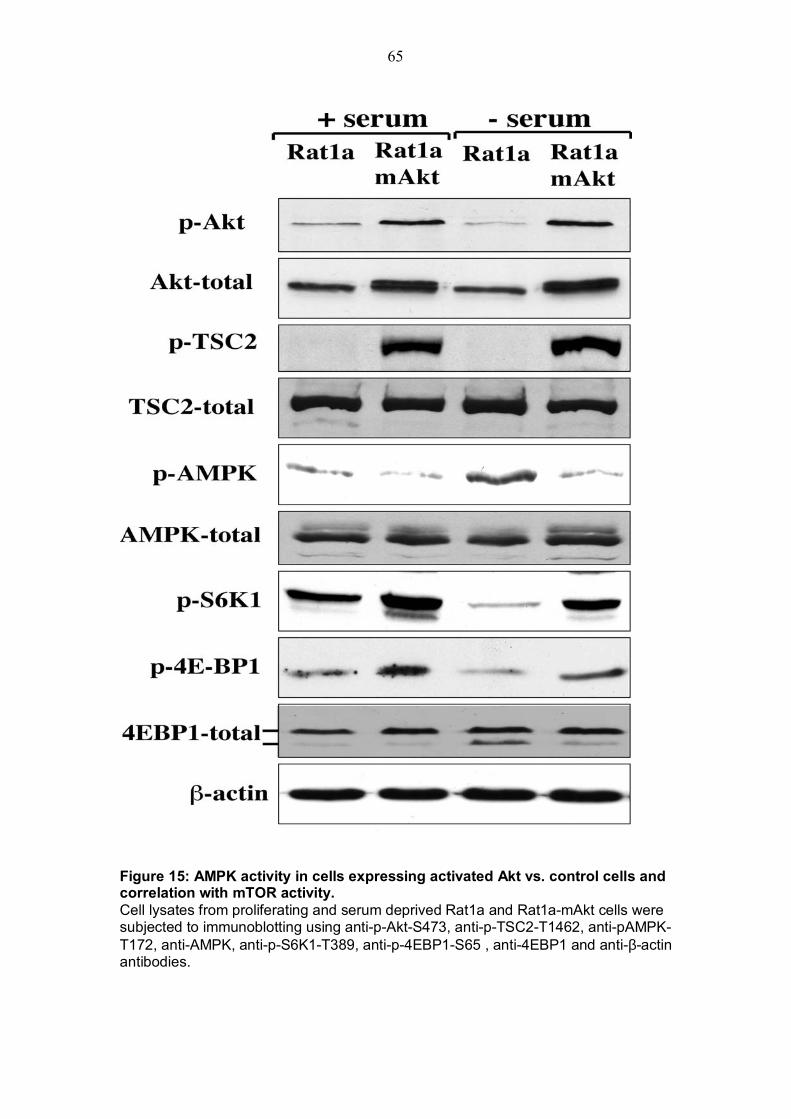
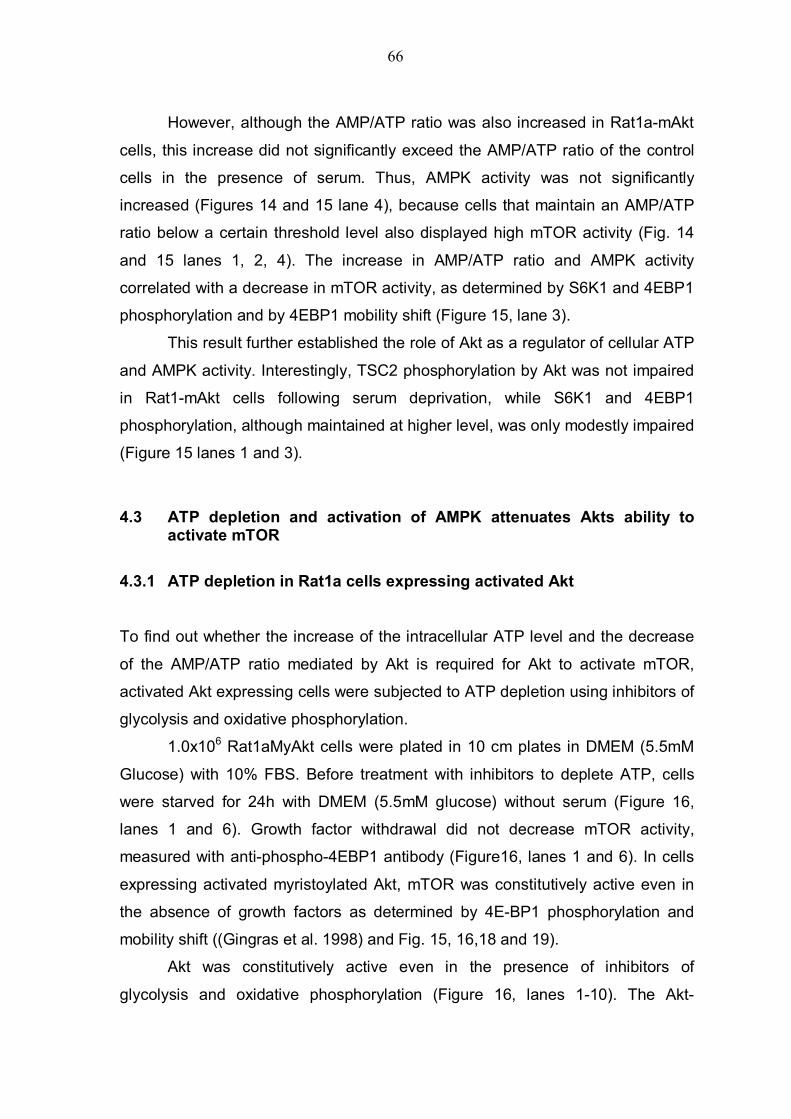
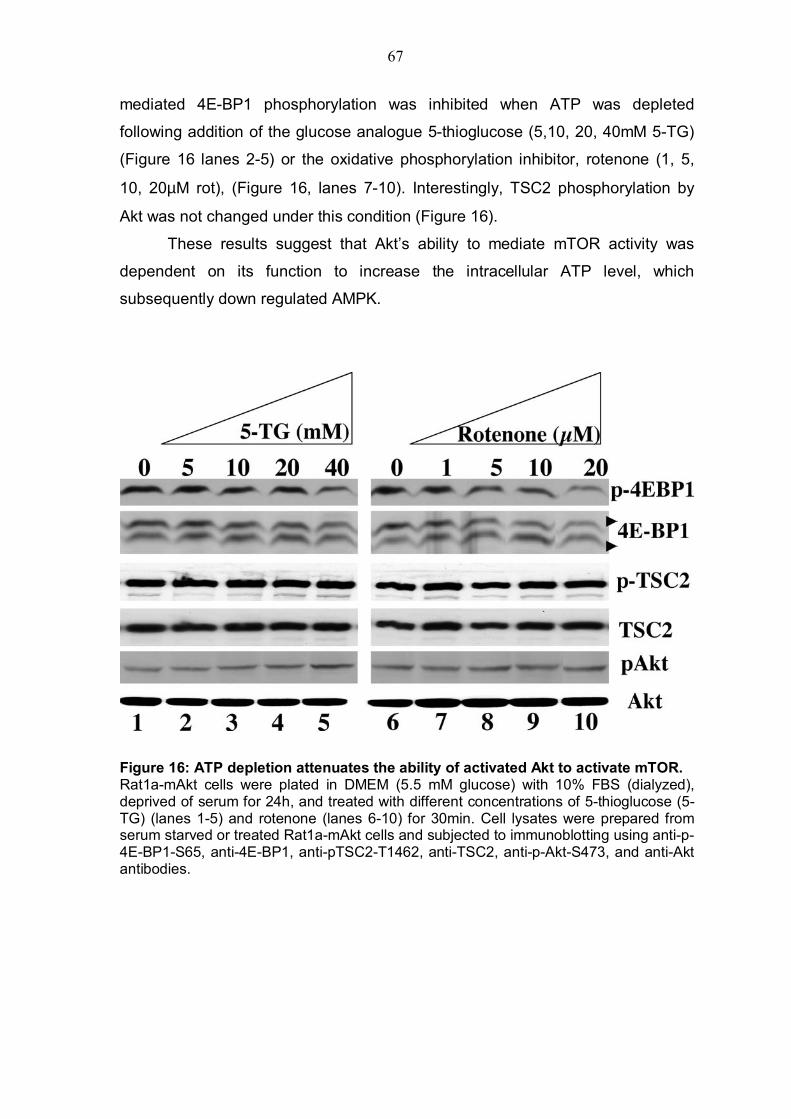
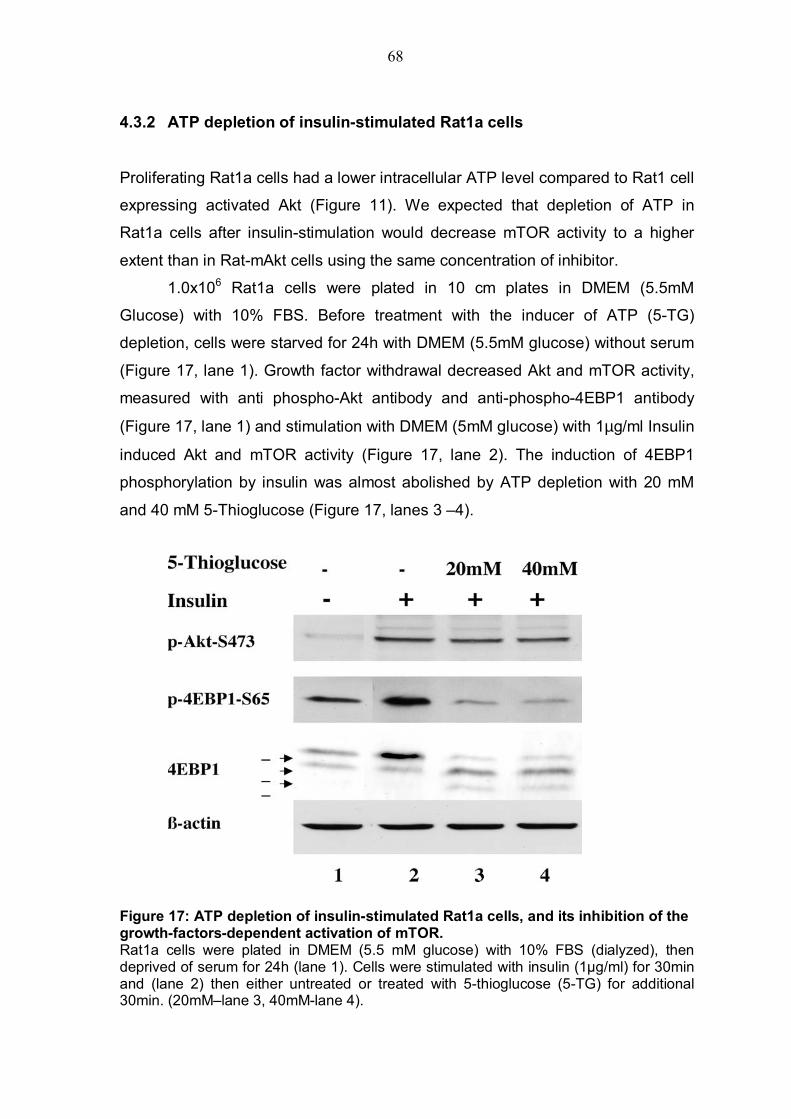
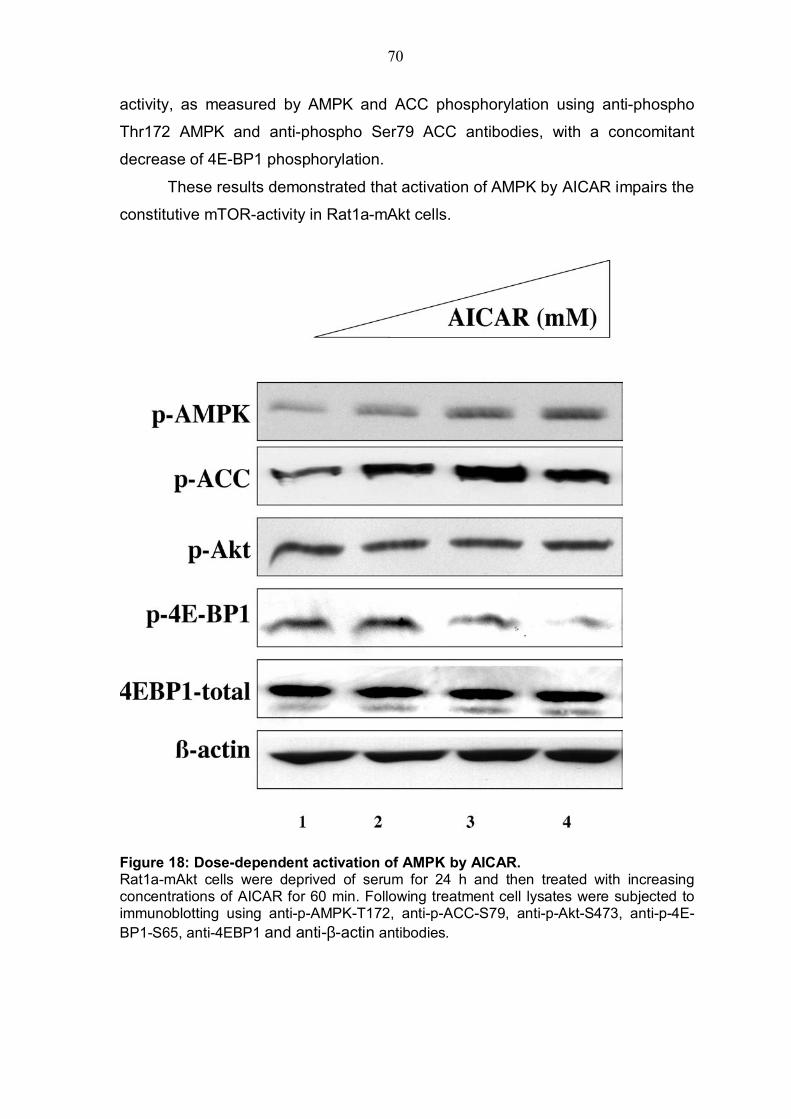

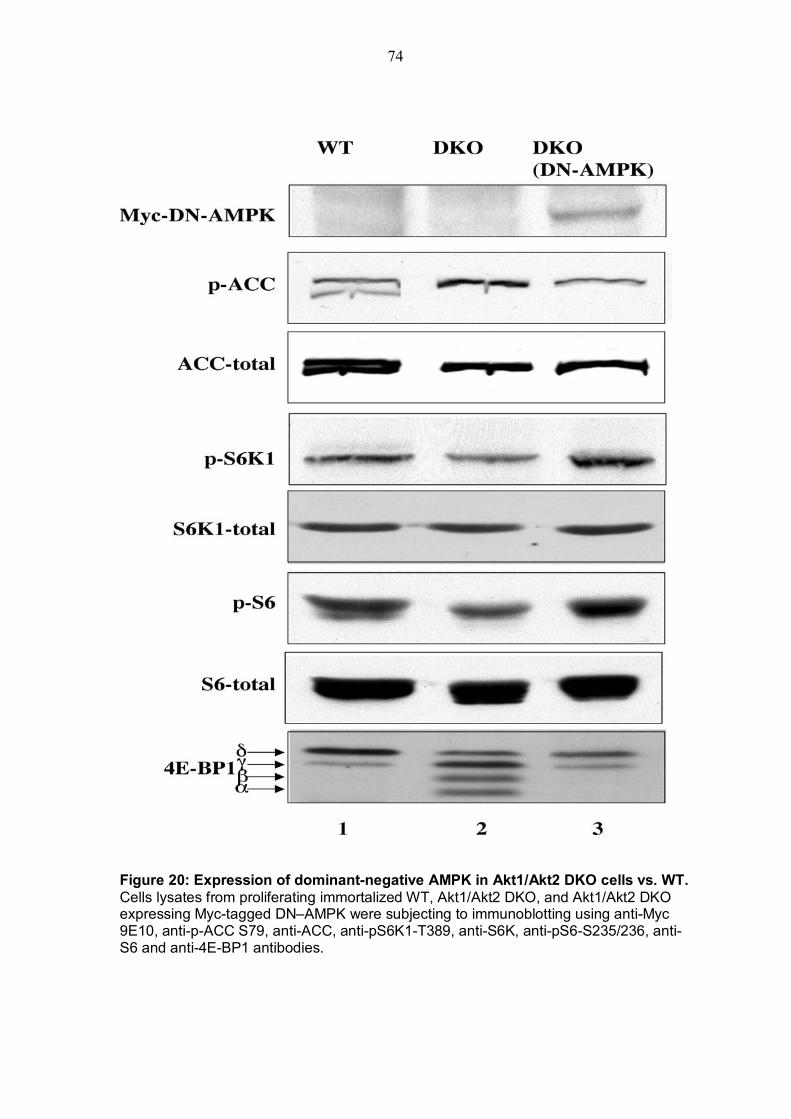
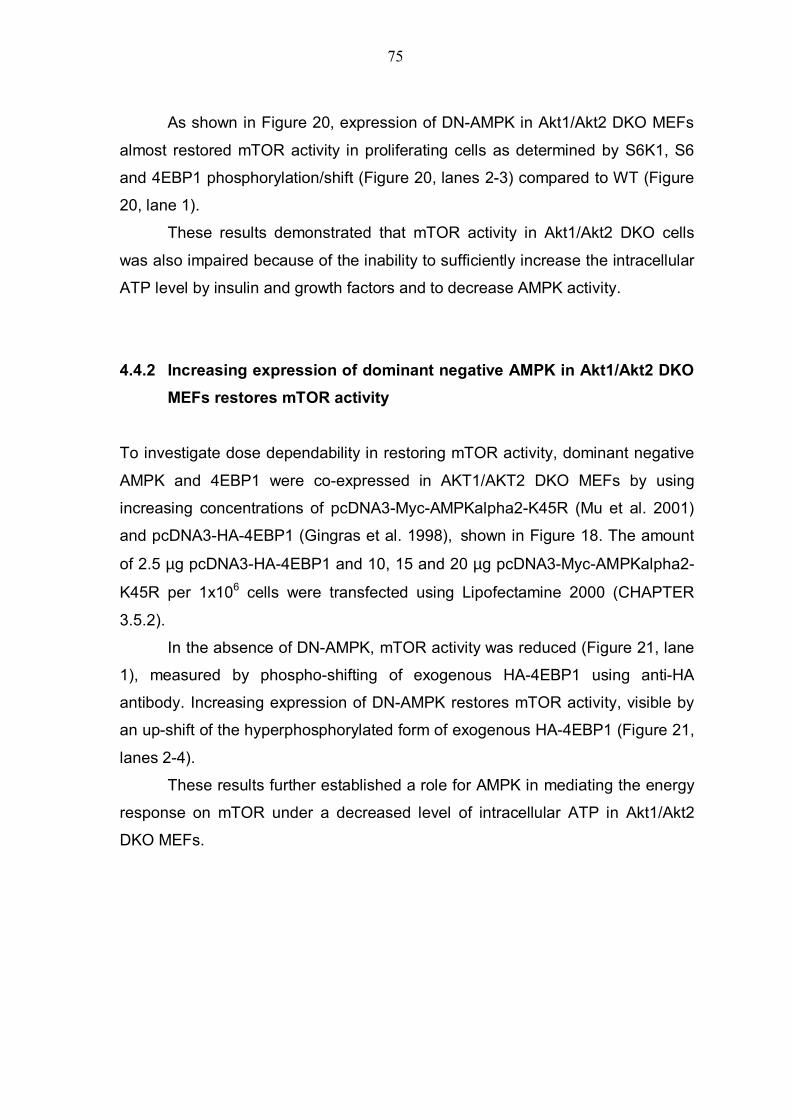
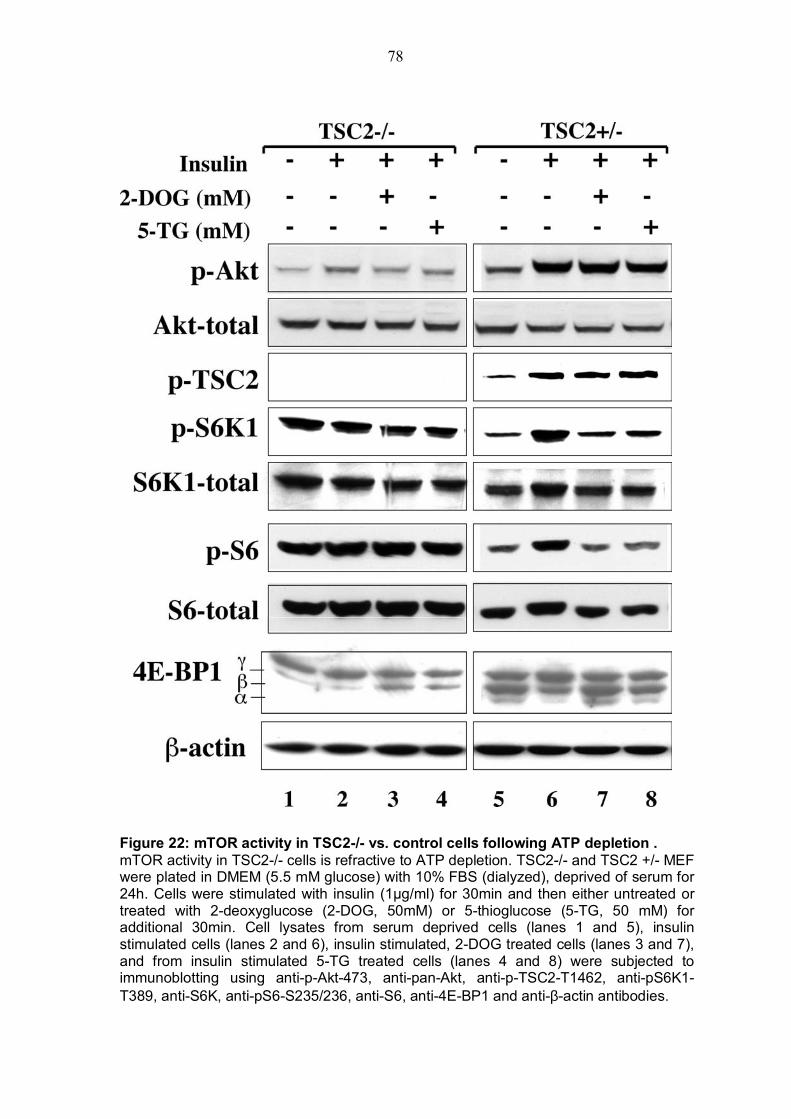
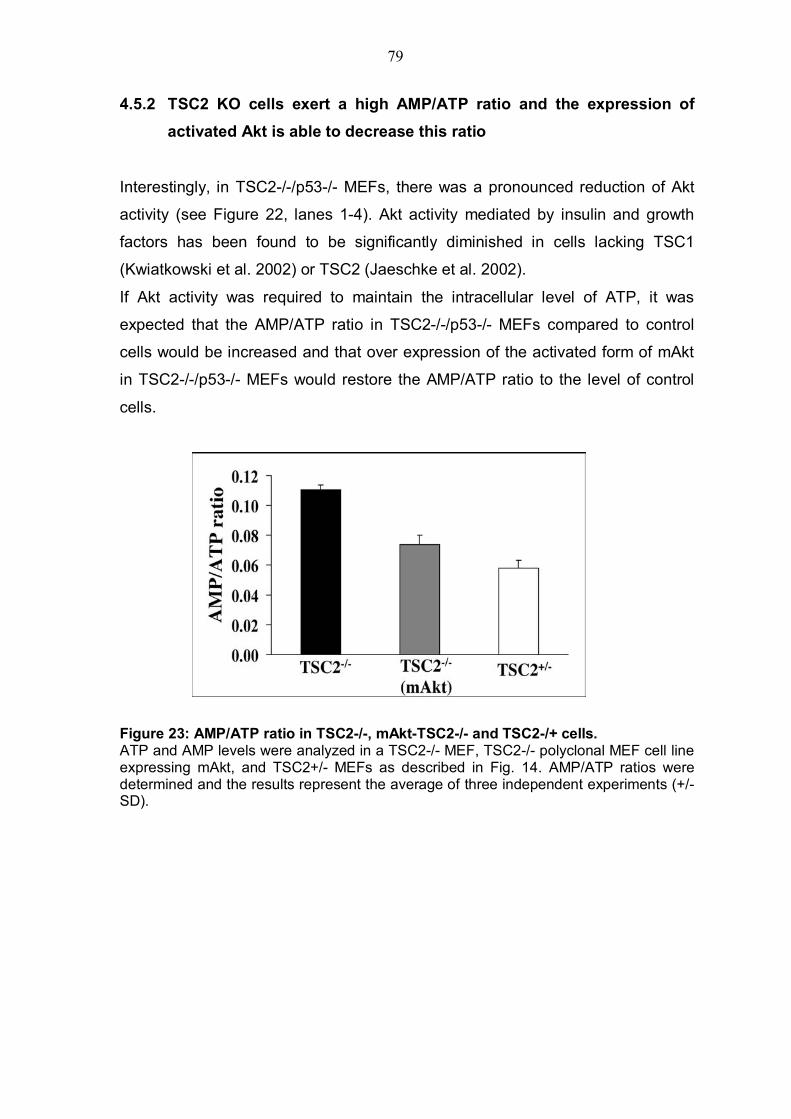
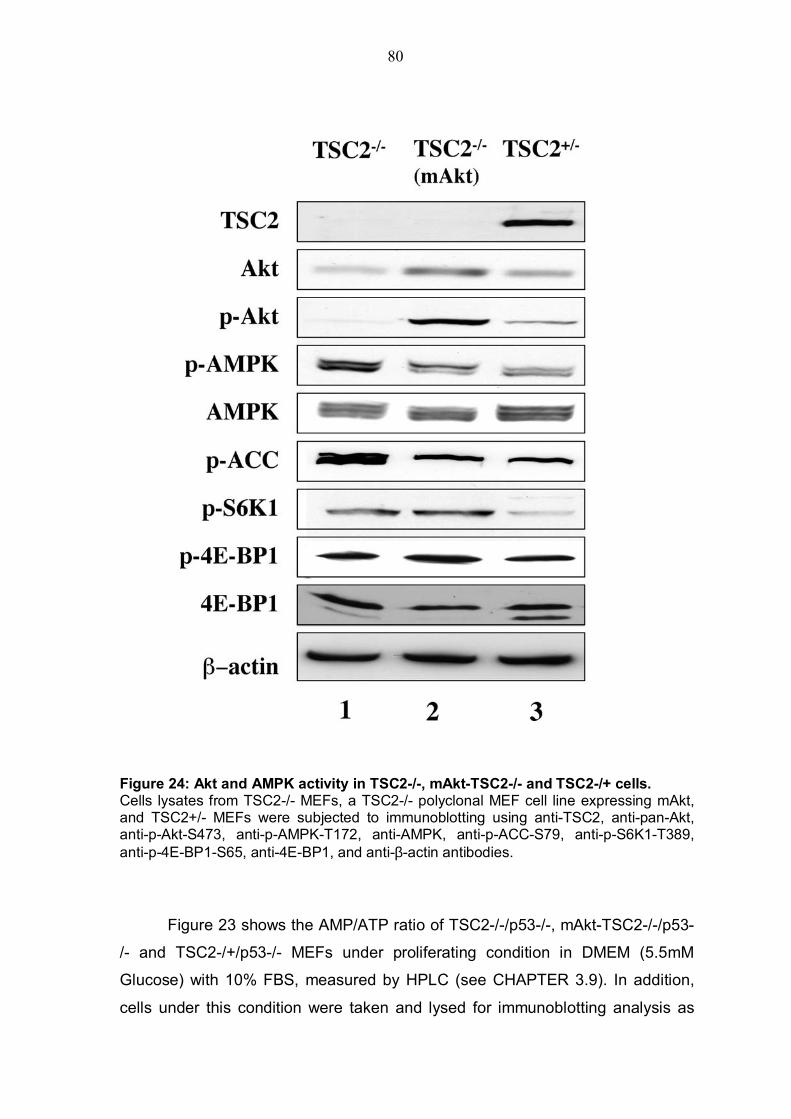

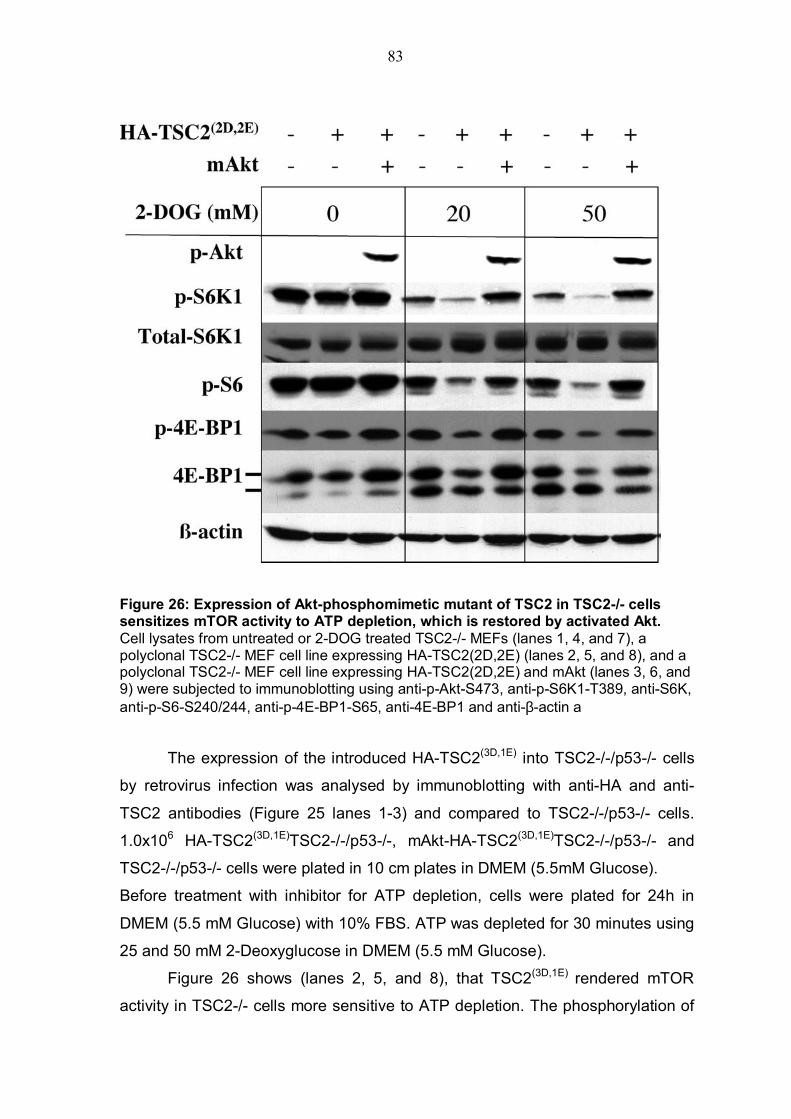


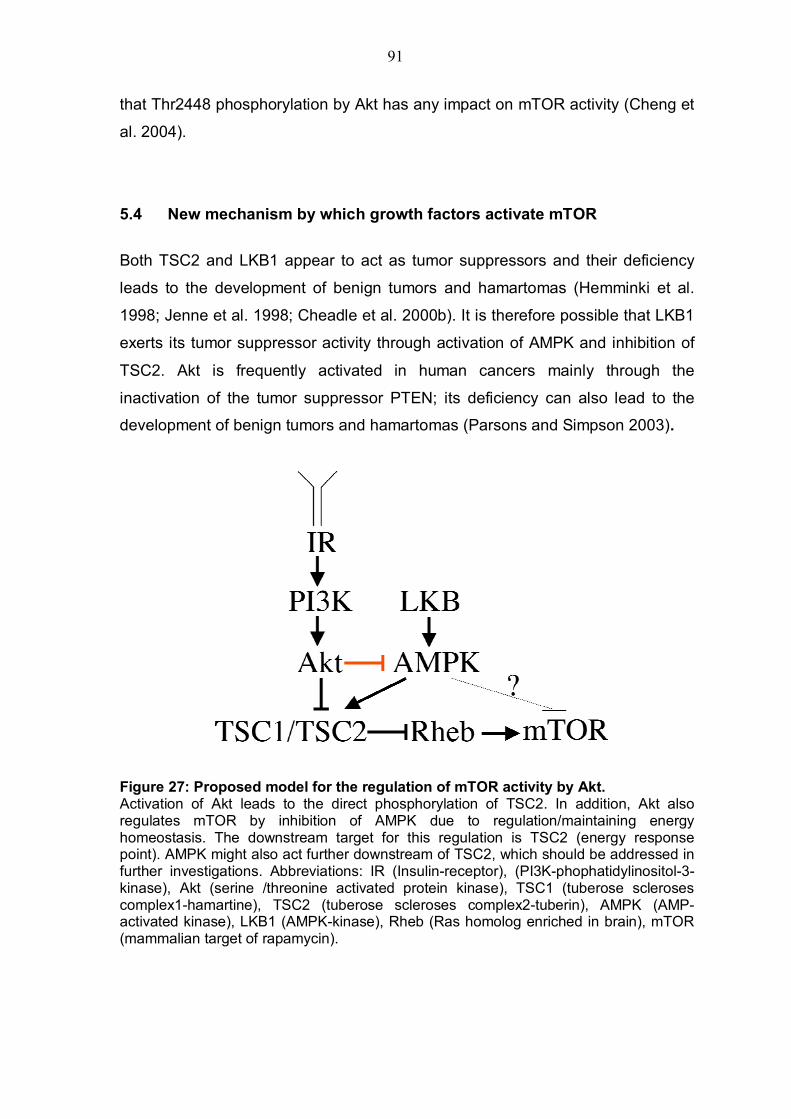


![Targeting of PI3K/AKT/mTOR pathway to inhibit T cell activation … · 2017. 8. 25. · AKT/mammalian target of rapamycin (PI3K/AKT/ mTOR) [1]. This pathway controls numerous cellular](https://static.documents.pub/doc/80x56/60af5eaa6ab71f4bc15363aa/targeting-of-pi3kaktmtor-pathway-to-inhibit-t-cell-activation-2017-8-25-aktmammalian.jpg)


![Clarification of the molecular pathway of Taiwan local ... · esis by the suppression of NF-κB, MAP kinase pathways and mammalian target of rapamycin (mTOR) signaling [7]. In addition](https://static.documents.pub/doc/80x56/5f8f66d323a64242934b82bc/clarification-of-the-molecular-pathway-of-taiwan-local-esis-by-the-suppression.jpg)


