Effect of antenna aircraft interaction on phased-array radar performance B.N. Suresh Babu T.P. Guella Indexing terms: Geometrical theory of diffraction, Microwave radar, AircrNi interaction effects, Antenna configuration Abstract: Large ultralow sidelobe airborne array antennas are required for detection of low radar cross section targets against a background of complex clutter and jammer interference. One of the critical factors which limits the clutter and jammer suppression performance of adaptive phased-array radars is the impact of the aircraft in the near-field of a high gain antenna. The authors describe a simulation which provides a cost effec- tive method of predicting performance. They describe the modelling of the aircraft and airborne radar simulation, and compare the performances attainable in the airborne environment for two possible antenna-aircraft platform configurations using the Ohio State University’s geometrical theory of diffraction numerical code. 1 Introduction New surveillance radars for strategic and tactical applica- tions are needed to detect small targets. This requires a large power-aperture product which, in turn, increases the level of the clutter and jammer signals received from the antenna sidelobe region. Receiving antennas with ultralow sidelobe patterns and adaptive sidelobe can- cellers have been proposed for large phased-array radars to suppress these interference signals. One of the critical factors which limits the clutter and jammer suppression performance of the adaptive phased-array radars is the impact of the aircraft in the near field of a high gain antenna. Degradation in the pattern sidelobes increases sidelobe clutter and jamming. We model the antenna/ airframe using a geometrical theory of diffraction (GTD) analysis to predict the performance that can be expected when an antenna array is placed in a complicated plat- form environment. However, when the aircraft body is in the near field of the array, their interaction will raise the sidelobes of the pattern, thereby increasing the level of the received clutter and jamming signals beyond the capability of an adaptive sidelobe canceller. It is difficult to evaluate the system performance deg- radation using only the degraded antenna patterns. To quantify the degradation to system performance we perform a simulation which integrates the clutter return as seen by a pulse-Doppler radar with the on-platform antenna patterns. We predict the performance degrada- tion that will result from the additional clutter returns 0 IEE, 1994 Paper 1236F (ElS), first received 17th June 1993 and in revised form 18th February 1994 The authors are with The MITRE Corporation, Bedford, MA 01730, USA IEE Proc.-Radar, Sonar Navig., Vol. 141, No. 5, October 1994 caused by the aircraft interaction effects. We provide examples to illustrate the sensitivity of detection per- formance to platform blockage and scattering effects for different antenna configurations. This paper describes the modelling of the aircraft and airborne radar simulation, and presents performance curves for a microwave radar with two different antenna configurations (cupola-mounted and raised pod). The examples presented illustrate that the aircraft interaction effects cause degradation in sidelobe clutter performance. 2 On-platform modelling This paper describes the on-platform radar performance for ultralow sidelobe array antennas mounted on a large aircraft platform. For this example, the array antennas are approximately 22.86 m x 2.13 m in width and height, respectively. Therefore a significant portion of the aircraft structure lies in the near field of these antennas. The on- platform antenna pattern performance of these antennas is quantified by using the Ohio State University’s GTD numerical code, NEC-BSC [l, 21. The GTD is an ana- lytical method using geometical optics and diffraction theory to simulate on-platform effects on the radiation field in a user-defined operating environment. The scat- tering structure which comprises the antenna platform is modelled by appropriate combinations of perfectly con- ducting plates and cylinders. The main limitation on the accuracy of this calculation is the accuracy of NEC-BSC, including the fidelity of the antenna and airplane models and the completeness of the algorithms. The accuracy of the GTD code has been validated for sidelobe levels down to approximately 45 dB below the beam peak. However, validation of the code accuracy is required for predicting the performance for sidelobes below -45 dB. As an illustrative example, Fig. 1 shows the aircraft model with a raised pod array as constructed by the code. For this arrangement, wing interference begins at about 30 degrees aft of broadside in azimuth. Since G T D is essentially a ray tracing method, one of the requirements of NEC-BSC is that the scatterer lie in the far field of the on-platform source. The full-array This work was supported by the US Air Force Electronic Systems Center, Hanscom An Force Base, MA. A preliminary version of the paper was presented at the 1993 IEEE National Radar Conference (Lynnfield, MA, USA, 20-22 April 1993). The authors thank A.A. Sahraouia for run- ning different scenarios on the computer, E.C. Barile for helping to generate the 3-D plots, D.H. Durkin for her editing services, and S.A. Lamoureux for her expert typing. 279
Transcript
Effect of antenna aircraft interaction on phased-array radar performance
B.N. Suresh Babu T.P. Guella
Indexing terms: Geometrical theory of diffraction, Microwave radar, AircrNi interaction effects, Antenna configuration
Abstract: Large ultralow sidelobe airborne array antennas are required for detection of low radar cross section targets against a background of complex clutter and jammer interference. One of the critical factors which limits the clutter and jammer suppression performance of adaptive phased-array radars is the impact of the aircraft in the near-field of a high gain antenna. The authors describe a simulation which provides a cost effec- tive method of predicting performance. They describe the modelling of the aircraft and airborne radar simulation, and compare the performances attainable in the airborne environment for two possible antenna-aircraft platform configurations using the Ohio State University’s geometrical theory of diffraction numerical code.
1 Introduction New surveillance radars for strategic and tactical applica- tions are needed to detect small targets. This requires a large power-aperture product which, in turn, increases the level of the clutter and jammer signals received from the antenna sidelobe region. Receiving antennas with ultralow sidelobe patterns and adaptive sidelobe can- cellers have been proposed for large phased-array radars to suppress these interference signals. One of the critical factors which limits the clutter and jammer suppression performance of the adaptive phased-array radars is the impact of the aircraft in the near field of a high gain antenna. Degradation in the pattern sidelobes increases sidelobe clutter and jamming. We model the antenna/ airframe using a geometrical theory of diffraction (GTD) analysis to predict the performance that can be expected when an antenna array is placed in a complicated plat- form environment. However, when the aircraft body is in the near field of the array, their interaction will raise the sidelobes of the pattern, thereby increasing the level of the received clutter and jamming signals beyond the capability of an adaptive sidelobe canceller.
It is difficult to evaluate the system performance deg- radation using only the degraded antenna patterns. To quantify the degradation to system performance we perform a simulation which integrates the clutter return as seen by a pulse-Doppler radar with the on-platform antenna patterns. We predict the performance degrada- tion that will result from the additional clutter returns
0 IEE, 1994 Paper 1236F (ElS), first received 17th June 1993 and in revised form 18th February 1994 The authors are with The MITRE Corporation, Bedford, MA 01730, USA
I E E Proc.-Radar, Sonar Navig., Vol. 141, No. 5, October 1994
caused by the aircraft interaction effects. We provide examples to illustrate the sensitivity of detection per- formance to platform blockage and scattering effects for different antenna configurations.
This paper describes the modelling of the aircraft and airborne radar simulation, and presents performance curves for a microwave radar with two different antenna configurations (cupola-mounted and raised pod). The examples presented illustrate that the aircraft interaction effects cause degradation in sidelobe clutter performance.
2 On-platform modelling
This paper describes the on-platform radar performance for ultralow sidelobe array antennas mounted on a large aircraft platform. For this example, the array antennas are approximately 22.86 m x 2.13 m in width and height, respectively. Therefore a significant portion of the aircraft structure lies in the near field of these antennas. The on- platform antenna pattern performance of these antennas is quantified by using the Ohio State University’s GTD numerical code, NEC-BSC [l, 21. The GTD is an ana- lytical method using geometical optics and diffraction theory to simulate on-platform effects on the radiation field in a user-defined operating environment. The scat- tering structure which comprises the antenna platform is modelled by appropriate combinations of perfectly con- ducting plates and cylinders. The main limitation on the accuracy of this calculation is the accuracy of NEC-BSC, including the fidelity of the antenna and airplane models and the completeness of the algorithms. The accuracy of the GTD code has been validated for sidelobe levels down to approximately 45 dB below the beam peak. However, validation of the code accuracy is required for predicting the performance for sidelobes below -45 dB. As an illustrative example, Fig. 1 shows the aircraft model with a raised pod array as constructed by the code. For this arrangement, wing interference begins at about 30 degrees aft of broadside in azimuth.
Since GTD is essentially a ray tracing method, one of the requirements of NEC-BSC is that the scatterer lie in the far field of the on-platform source. The full-array
This work was supported by the US Air Force Electronic Systems Center, Hanscom An Force Base, MA. A preliminary version of the paper was presented at the 1993 IEEE National Radar Conference (Lynnfield, MA, USA, 20-22 April 1993). The authors thank A.A. Sahraouia for run- ning different scenarios on the computer, E.C. Barile for helping to generate the 3-D plots, D.H. Durkin for her editing services, and S.A. Lamoureux for her expert typing.
279
antenna patterns are obtained by summing the far field contributions from each of the subarrays that together comprise the full-array antenna. The subarray sizes are
Fig. 1 G T D platform model o f a raised pod abovefuselage
chosen so that the far field requirement is met. The on- platform antenna patterns are computed for two different antenna-aircraft geometries. In the cupola-mounted con- figuration, the array is positioned on top of the fuselage over the wing section, about 0.61 m above the fuselage crown. In the raised pod design, the base of the array is positioned 3.66 m above the fuselage crown. The cupola- mounted antenna suffers from the effects of increased antenna-aircraft interactions, whereas the raised pod antenna mitigates the antenna-aircraft interactions because of the increased antenna height, as illustrated in the following Section. In addition, the GTD code can also be used as a diagnostic tool to determine the domi- nant sources of interference from the aircraft platform.
3 Airborne radar simulation
A simulation [ 3 ] has been developed which integrates the clutter return as seen by a pulse-Doppler radar with the
frequency, pulse length, PRF, platform speed, transmitter power
- constant gamma - constant sigma
on-platform antenna patterns. The structure of the simu- lation is shown in Fig. 2. Using the radar system input parameters, the simulation program computes the clutter-to-noise ratio (CNR) for each radar resolution cell and determines the Doppler frequency at the centre of the cell. The clutter is then summed across each range ring applying the antenna pattern gain. Range folding is accounted for by summing over each range ring that folds over the selected pulse repetition frequency (PRF). The Doppler ambiguities are also included in the simula- tion. The clutter model for the examples used in this paper is either a constant Gamma model, resulting in a clutter backscatter coefficient that is a function of grazing angle, or a constant sigma model; however, the simula- tion has other clutter models. The system losses are divided into categories of range-independent losses which are common losses for clutter, jamming and target; target-only losses; and range-dependent losses for clutter and target. This allows us to calculate performance as a function of range in a clutter background. The program computes the atmospheric and lens losses as a function of range. It computes the elevation beamshape loss based on the free-space or GTD antenna pattern and depres- sion angle. We can generate the CNR, signal-to-noise ratio (SNR) and signal-to-interference ratio (SIR) as func- tions of Doppler frequency. The resulting CNR per- formance versus Doppler is dependent on range, elevation pattern, grazing angle of the clutter patch and range and Doppler ambiguities which are based on the radar waveform.
4 Illustrative examples
To illustrate the features of this simulation tool, we present examples of a microwave radar which uses a medium-PRF waveform. For a known antenna-platform geometry, a set of on-platform azimuthal pattern cuts is generated using the GTD code.
This example has range ambiguities and additional contributions from several range rings. Radar input parameters such as target range, PRF and platform alti- tude determine the set of depression angles (i.e. ranges) for which azimuthal conical cuts of the on-platform pattern must be made using the GTD code. This set of pattern cuts for a high- or medium-PRF radar corre- sponds to the unambiguous ranges and all of the ambigu- ous ranges which would contribute to the radar performance in a given scenario. Table 1 shows depres- sion angles for these different range rings. For a medium- PRF radar waveform with a target range of 200 km the --
atmospheric model - multipath - effective radius - atomspheric loss - lens loss
antenna pattern antenna oarameters
h -free space - GTD - excitation errors I
target model ECM model - constant sigma jammer
- CNR SNR. 8 SIR vs.
- antenna patterns - detection range
with jamming - Doppler 20 plot - 3-0 range Doppler plot - cumulative detection
Doppler
Fig. 2
280
Airborne radar simulation model
I E E Proc.-Radar, Sonar Navig., Vol. 141, No. 5, October I994
Table 1 : Depression angle for different range rings
Range Depression Grazing (krn) angle (deg.) Angle (deg.)
Range = 200 km Target altitude = 0.1524 krn Mainbeam depression angle = 3.29"
clutter contribution is from five different ranges, so we generate five different pattern cuts corresponding to the depression angle of five clutter rings.
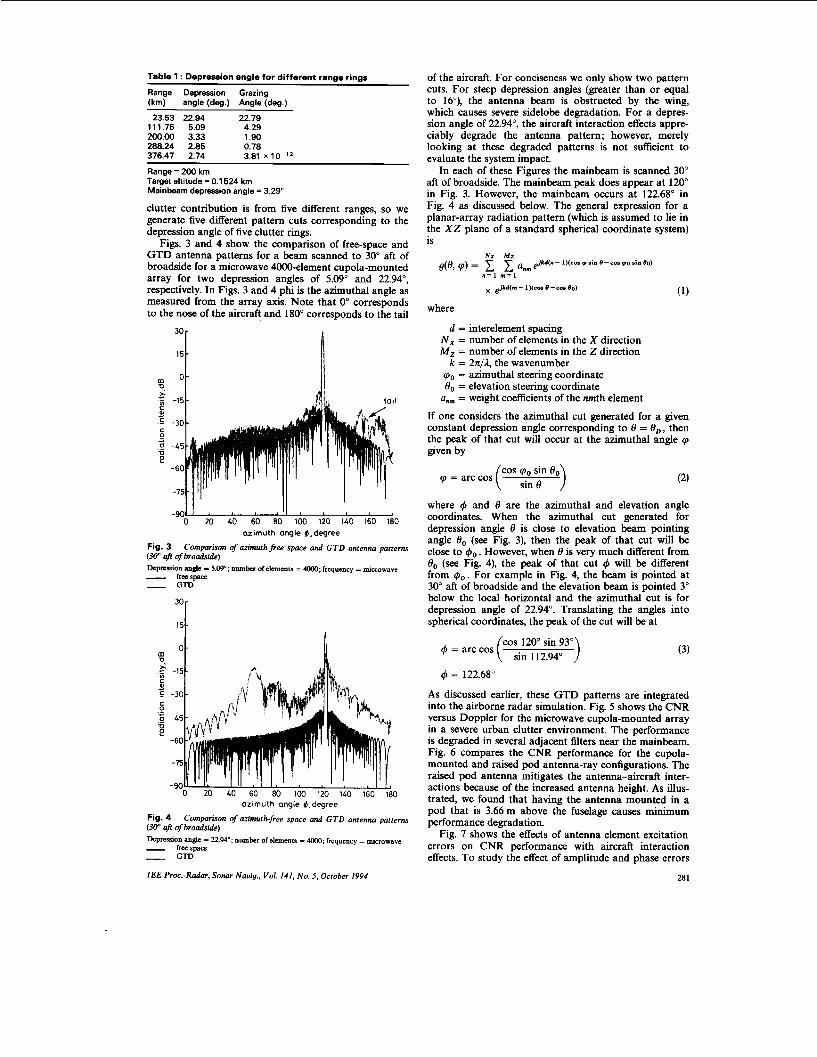
Figs. 3 and 4 show the comparison of free-space and GTD antenna patterns for a beam scanned to 30" aft of broadside for a microwave 4000-element cupola-mounted array for two depression angles of 5.09" and 22.94", respectively. In Figs. 3 and 4 phi is the azimuthal angle as measured from the array axis. Note that 0" corresponds to the nose of the aircraft and 180" corresponds to the tail
Fig. 3 (30" Mi of broadside) Depression angle = 5.09"; number ofelmcnts = 4ooo; frquency = mimowavc _. frcspace __ GTD
Comparison of azimuth free space and GTD antenna patterns
151
0
-15
m : C e
E 0
.5 -30
.-
.- 5 -45 D e
-60
-75
- 90 0 20 40 60 80 100 120 140 160 180
azimuth angle @,degree Fig. 4 (30" Mi ofbroadside)
Compmison of azimuth-free space and GTD antenna patterns
Depression angle = 22.94'; number of elmenis = 4ooo; frequency = microwave - frcespaa __ GTD
I E E Proc.-Radar, Sonar Navig., Vol. 141, No. 5 , October 1994
of the aircraft. For conciseness we only show two pattern cuts. For steep depression angles (greater than or equal to 16"), the antenna beam is obstructed by the wing, which causes severe sidelobe degradation. For a depres- sion angle of 22.94", the aircraft interaction effects appre- ciably degrade the antenna pattern; however, merely looking at these degraded patterns is not sufficient to evaluate the system impact.
In each of these Figures the mainbeam is scanned 30" aft of broadside. The mainbeam peak does appear at 120" in Fig. 3. However, the mainbeam occurs at 122.68" in Fig. 4 as discussed below. The general expression for a planar-array radiation pattern (which is assumed to lie in the X Z plane of a standard spherical coordinate system) is
where
d = interelement spacing N, = number of elements in the X direction M , = number of elements in the Z direction
If one considers the azimuthal cut generated for a given constant depression angle corresponding to 0 = Bo, then the peak of that cut will occur at the azimuthal angle cp given by
cos cpo sin Bo ( sin e ) cp = arc cos
where 4 and 0 are the azimuthal and elevation angle coordinates. When the azimuthal cut generated for depression angle 0 is close to elevation beam pointing angle Bo (see Fig. 3), then the peak of that cut will be close to r$o . However, when 0 is very much different from Bo (see Fig. 4), the peak of that cut r$ will be different from r $ o . For example in Fig. 4, the beam is pointed at 30" aft of broadside and the elevation beam is pointed 3" below the local horizontal and the azimuthal cut is for depression angle of 22.94". Translating the angles into spherical coordinates, the peak of the cut will be at
cos 120" sin 93" sin 112.94"
4 = arc cos (3)
4 = 122.68"
As discussed earlier, these GTD patterns are integrated into the airborne radar simulation. Fig. 5 shows the CNR versus Doppler for the microwave cupola-mounted array in a severe urban clutter environment. The performance is degraded in several adjacent filters near the mainbeam. Fig. 6 compares the CNR performance for the cupola- mounted and raised pod antenna-ray configurations. The raised pod antenna mitigates the antenna-aircraft inter- actions because of the increased antenna height. As illus- trated, we found that having the antenna mounted in a pod that is 3.66 m above the fuselage causes minimum performance degradation.
Fig. 7 shows the effects of antenna element excitation errors on CNR performance with aircraft interaction effects. To study the effect of amplitude and phase errors
281
on the array performance, errors (root mean square amplitude and phase errors of 0.25 dB and 2", respectively) are introduced randomly to the array ele- ments. As expected, the random errors on the element
Fig. 5 Comparison of clutter-to-noise ratio versus Doppler with and without aircraft interaction effects Range = 200 km, gamma = -9 dB; frequency = microwave; antenna type = cupola-mounted; azimuth beam position = 30" aft of broadside, elevation beam position = -3"; PRF = medium __ freespace __ GTD
Fig. 6 Comparison of clutter-to-noise ratio versus Doppler for the cupola-mounted and raised pod antenna-array configurations Range = 200 km; gamma = -9 dB; frequency = microwave; admuth beam position = 30" aft of broadside; elevation beam position = -3"; PRF = medrum - cupola-mounted - raisedpod
Fig. 7 Comparison of clutter-to-noise ratio versus Doppler with exci- tation errors for cupola-mounted and raised pod configurations Range = 2W km; gamma = -9 dB; frequency = miaowavc; azimuth beam position = 30" aft of broadside; elevation beam position = -3"; PRF = medium; amplitude error = 0.25 dB; phasc error = 2.0" - cupola-mounted - raised pod
282
excitations affect the antenna sidelobes and, as a result, the radar performance as well. With these errors the sensitivity is degraded uniformly by about 4 dB across all of the Doppler bins. These examples illustrate the insight this tool can provide radar system engineers. The addi- tional sidelobe clutter contributions due to aircraft inter- action effects need to be mitigated using adaptive antenna techniques to achieve the needed sensitivity for the cupola-mounted antenna system. The above on- platform CNR performance results were computed for a 200 km target range using a medium-PRF radar wave- form. Fig. 8a and b show the three-dimensional CNR
Fig. 8 without aircrafl interaction noise LI Freespace b On-platform Gamma = -9 dB; frequency = microwave; azimuth beam = broadside; elevation beam = -3"; PRF =medium
Comparison of clutter-to-noise ratio versus Doppler with and
versus range-Doppler for the medium-PRF cupola- mounted radar for a broadside beam and target ranges from 100 km to 350 km, taken in increments of 25 km, without and with aircraft interaction effects. As can be seen, there is no significant phased-array radar per- formance degradation due to aircraft interaction effects. However, significant degradation in radar performance would be observed when the beam is scanned in the direction of the wing, as shown in Fig. 9b. Fig. 9a and b show the three-dimensional, CNR versus range-Doppler plot for the medium-PRF cupola-mounted radar for a beam scanned to 30" aft of broadside and target ranges from 100 to 350 km at 25 km increments, with and
IEE Proc.-Radar, Sonar Nauig., Vol. 141, No. 5, October 1994
without aircraft interaction effects. Fig. 10 shows a contour plot of the differences in CNR between these two plots. As shown in the plot, there is a degradation of approximately 12 dB in CNR for Dopplers correspond- ing to near-in sidelobes and a 20 dB degradation in CNR for Dopplers corresponding to far sidelobes, it would not
b
Fig. 9 a Freespace b With aircraft interaction effects Gamma = -9 dB: frequency = microwave; azimuth beam = 30" aft of braad- side; elevation beam = - 3": PRF = medium
Comparison of clutter-to-noise ratio versus range and Doppler
0.0 100 150 200 250 300 350 375
range, krn
Fig. 10 Aircraft interaction effects on clutter-to-noise ratio \
impact the signal-to-clutter-plus-noise ratio (SCNR) in those filters since their performance is noise-limited, as shown in Fig. 11. However, since the performance in
main beam -location
L I
0.0 I00 150 200 250 300 350 375
range, km
Fig. 11 Contour plots of SCNR difference in dB
Aircraft interaction effects on signal-to-clutter plus noise ratio
Doppler for filters corresponding to near-in sidelobes is clutter-limited, a 12 dB performance degradation in SCNR is observed in those filters. Although for this example moderate performance degradation for Dopplers corresponding to near-in sidelobes is observed due to air- craft interaction effects, at other microwave frequencies severe performance degradation can occur in all Doppler filters for a phased-array radar.
5 Summary
The aircraft interaction effects on phased-array per- formance are primarily dependent on radar parameters such as frequency, waveform, aircraft platform and antenna configuration. The simulation tool described in this paper quantifies the effects of aircraft interactions on sidelobe clutter cancellation performance, allowing system engineers to assess the antenna performance without actually building it. Performance trade-offs can be made concerning the position in which the array should be placed to avoid blockage and diffraction caused by the platform structures, and which frequency range should be used for operation. In this paper, for purposes of illustration, we only present an example of one microwave radar with two different antenna configu- rations to demonstrate the attributes of this simulation tool. The simulation provides a cost-effective method of predicting the performance because it determines the best antenna location on a specified platform to minimise additional sidelobe clutter due to aircraft interaction effects. It is the first step in providing valuable insight into determining if adaptive antenna techniques are required to solve the problem and achieve the needed sensitivity. However, as discussed earlier, the cost- effectiveness of this approach is dependent on validating the code accuracy for predicting the performance for sidelobes below -45 dB. The alternative approach of using a high-gain antenna performance prediction based on flight tests would be very expensive. Although we pre- sented in this paper the aircraft interaction effects on phased-array performance, these effects are not limited to
283
airborne systems. These interaction effects can also Electroscience Laboratory, Department of Electrical Engineering, impact the performance of mobile ground radars and ~ ~ & K ~ ~ ‘ ~ ~ ~ a l electromagnetic - Basic scat- ship-based radars. tering code (Version 2). Part 11: Code manual‘. Technical Report
8 References 712242-15, The Ohio State University Electroscicnce Laboratory, Department of Electrical Engineering, OH, USA, December 1982
3 SURESH BABU. B.N.. and TORRES. J.A.: ‘Airborne radar simula- 1 BURNSIDE, W.D., and MARHEFKA, R,J,: “me,.ical electromag-
netic code - Basic scattering code (version 2). part I : users’ manual’. Technical Report 712242-14, The Ohio State University of
tion with adaptive antema techniques’. b&hp Of the Summer Computer Simulation Conlermce, 1992, pp. 484-490


![1 Phased-MIMO Radar: A Tradeoff Between Phased-Array and ... 0908.2153v1 [cs.IT] 15 Aug 2009 1 Phased-MIMO Radar: A Tradeoff Between Phased-Array and MIMO Radars Aboulnasr Hassanien, Member, IEEE and Sergiy A ...](https://static.documents.pub/doc/80x56/5a78d5a77f8b9a83238d2139/1-phased-mimo-radar-a-tradeoff-between-phased-array-and-09082153v1-csit.jpg)


