Effect of bidirectional internal flow on fluid–structure interaction dynamics of conveying marine riser model subject to shear current
Zheng-Shou Chen1,2 and Wu-Joan Kim3 1School of Naval Architecture and Civil Engineering, Zhejiang Ocean University, Zhoushan, Zhejiang, China
2State Key laboratory of Ocean Engineering, Shanghai Jiao Tong University, Shanghai, China 3Department of Ocean Engineering, Mokpo National University, Mokpo, Jeonnam, Korea
ABSTRACT: This article presents a numerical investigation concerning the effect of two kinds of axially progressing internal flows (namely, upward and downward) on fluid–structure interaction (FSI) dynamics about a marine riser model which is subject to external shear current. The CAE technology behind the current research is a proposed FSI solution, which combines structural analysis software with CFD technology together. Efficiency validation for the CFD software was carried out first. It has been proved that the result from numerical simulations agrees well with the observation from relating model test cases in which the fluidity of internal flow is ignorable. After verifying the num-erical code accuracy, simulations are conducted to study the vibration response that attributes to the internal progre-ssive flow. It is found that the existence of internal flow does play an important role in determining the vibration mode (/dominant frequency) and the magnitude of instantaneous vibration amplitude. Since asymmetric curvature along the riser span emerges in the case of external shear current, the centrifugal and Coriolis accelerations owing to up- and downward internal progressive flows play different roles in determining the fluid–structure interaction response. The discrepancy between them becomes distinct, when the velocity ratio of internal flow against external shear current is relatively high.
KEY WORDS: Internal progressive flow; Upward and downward; Fluid-structure interaction; Top tension; Velocity ratio.
INTRODUCTION
With the development of modern ocean engineering, various cylindrical structures, e.g., flexible risers, pipelines, mooring lines and underwater cables have been widely adopted in deepwater oil production and offshore wind energy utilization industries. Those flexible risers/pipes are easily subject to shear or oscillatory flows. When the frequency of vortex shedding in the wake approaches some natural/ intrinsic frequency of marine risers/pipelines, the structural vibration easily takes control of the vortex shedding process, causing the vortices to shed at a frequency very close or even equal to the structural frequency. Subsequently, the phenomenon of ‘lock-in/synchronization’ emerges. On the other hand, for current and wave are often charac-terized by high degree of complexity, considerable intensity and multi-direction along water depth, the observed VIV processes are usually more intricate than our estimation.
The practical significance of vortex-induced vibration has led to a large number of fundamental studies. Although there are so many works carried out for the VIV research relating flexible pipe/riser systems which are subject to uniform, shear or even nonlinear-patterned external current, hitherto, the contribution of internal progressive flow to FSI response of flexible riser had rarely been considered. In fact, the curvature of flexible pipes/risers and the relative motion of axial internal flow to the time-dependent pipe/riser motion are crucial factors to the safety design of marine riser system (Mukundan, et al., 2010). According
to the dynamics principle, the internal progressive flow experiences centrifugal and Coriolis accelerations, when conveying along the curved path of deflected pipe/riser (Païdoussis, 1998). Those accelerations induced by internal flow inside the flexible pipe/riser systems, affect the dynamic behavior of pipe/riser structures in turn. It may cause the happening of multi-modal coexistence or even the emergence of vibration modal transition subsequently. As a result, the riser vibration might be ‘locked-in’ within a special reduced velocity range in which large deflection or high vibration modes may be induced (Lopes, et al., 2002; Semler, et al., 2002). This may consequently lead to structure failure of marine riser systems prematurely.
Now that the effect of internal progressive flow has been mentioned, its conveying direction and the corresponding influence on the FSI response of flexible pipe/riser systems should be paid much attention, especially in the case of non-uniform external current. Generally speaking, there are two kinds of conveying directions which are opposite to each other for the fluid conveying along riser/pipe system. An end may be regarded as inlet in some situations, but it may be regarded as outlet in others. On the other hand, the diversity of structural assembly, e.g., two ends unequally restrained, and the variety of dynamic loading, e.g., the external current non-uniformly patterned, might lead to the emergence of asymmetrical vibration response along riser span. In such kinds of situations, the contrastive cases in which opposite progressive directions of internal flow are imposed would experience different centrifugal and Coriolis accelerations.
Because of practical complexity and difficulty, it is not easy to perform experiments concerning the effect validation of internal progressive flow on FSI response of flexible riser systems (Guo and Lou, 2008), thus the numerical simulation used to be a candidate for this kind of coupled problem. Unfortunately, most of the relating numerical methods adopted in previous studies were depending upon insufficient physical models, for instance, a simple oscillator model adopted by Hong (1994) and a simplified mathematical model developed by Hong and Huh (1999). So complicated as the actual effect of internal pro-gressive flow on VIV response is, it still remains much unsolved.
In this paper, the dynamic effect of internal progressive flow on FSI response of riser models has been investigated by means of a well-designed numerical method. The external shear current and internal progressive flow with opposite progressive directions were taken into account simultaneously. Particularly, the achievement of different conveying directions was actua-lized by pumping fluid into one end as inlet and sucking fluid from it as outlet, respectively.
NUMERICAL SOLUTION
Numerical method for VIV
The numerical simulation of flow past a circular cylinder is complicated by some of the most difficult problems concerning fluid mechanics, such as the separation excursion and coherence length based on coupling mechanism between the dynamics of near-wake and structure. Numerous contributions to flow-induced oscillations in general and to VIV in particular have collectively defined the objectives of the current VIV research and then guided the acquisition of design data through physical and numerical experiments, theoretical analysis and physical insight. In the field of numerical simulation, semi-experimental models, discrete vortex method (DVM) and industrially significant FSI solution packages have been introduced for practical calculation. They were performed partly through the use of direct numerical simulations (DNS) (Dong and Karniadakis, 2005), large eddy simulations (LES) (with improved sub-grid scale models) (Al-Jamal and Dalton, 2004; Fujisawa, et al., 2005), unsteady Reynolds-averaged Navier–Stokes equations (URANS) (Saghafian, et al., 2003; Guilmineau and Queutey, 2004; Wanderley, et al., 2006), vortex element methods (VEM) (Mittal and Kumar, 2001; Nobari and Naredan, 2006) and their various combinations. Recent years, with the rapid development of computer technology and CFD software, it becomes prac-ticable to conduct the FSI simulation about flexible riser with highly resolved flow models.
Generally speaking, FSI occurs when fluid interacts with a solid structure, exerting pressure that may cause the structure deformed, and then alter the flow conformation in turn. The reason that some numerical simulations of vortex-induced vibration have been failing to accurately duplicate experimental processes is mostly due to the complexity of physics involved in the real problem. In addition, the grid topology, mesh density, boundary condition, and coupling scheme between the flow governing equations and structure motion equations commonly have strong influence on the quality of numerical results (Holmes, et al., 2006). Due to calculation disability and some deficiencies of CFD software package itself, most numerical results depended on 2D vortex simulation and then integrate the hydrodynamic forces to 3D fluid domain (Yamamotoa, et al., 2004). Some attempts to simulate vortex-induced vibration with very large aspect ratio are indeed a 2D numerical simulation (Holmes, et al., 2006).
With risers presenting high aspect ratio (i.e. length/diameter) and complex inflow pattern around them, a considerate 3D
Inter J Nav Archit Oc Engng (2012) 4:57~70 59
simulation which can deal well with fluid-structure interaction solution should be looked for. Menter and Sharkey (Menter and Sharkey, 2006) has successfully simulated two kinds of FSI cases using ANSYS multi-physics software. They preliminarily verified the capability of ANSYS MFX solver to deal with coupling fluid-structure problems. By means of MFX solution approach and 3D large eddy simulation (LES) model, FSI simulation dealing with the dynamic effect of oppositely progressing internal flow on FSI response would be solved in this paper. Before the effort to apply the CFD method arbitrarily, numerical simulation for the related VIV experiment with still internal flow inside has been carried out first to validate the efficiency of the proposed numerical method.
FSI solution
ANSYS MFX solver has been adopted to solve the FSI problems in this paper. This FSI solution scheme provides tight integration between hydrodynamics and structure physics, offering users a flexible and advanced structure–fluid analysis tool. Coupled simulations begin with the execution of the ANSYS Mechanical application and CFX field solvers. The Mechanical application solver acts as a coupling master process to which the CFX-solver connects. Once that connection is established, the solvers advance through a sequence of pre-defined synchronization points (SP). At each of these SPs, field solver gathers the data it requires from another solver in order to advance to the next point. The coupled simulation proceeds in time during the outer loop. Stagger iterations are repeated until a maximum number of stagger iterations is reached or until the data transferred between solvers and all field equations have converged. The adoption of implicit coupling iteration ensures that fluid and struc-ture solution fields are consistent with each other at the end of each multi-field step, leading to improved numerical solution stability (ANSYS, 2007). More information about that coupled process may refer to ANSYS user manual (ANSYS, 2007) and our previous works (Chen, 2010).
Turbulence model
The selection of turbulence model is extremely critical for numerical simulation. Most of the disagreements between experiments and numerical simulations are attributable to the disability of turbulence model to exactly repeat the physics com-plexity. Modeling errors are hardly to avoid, for they can not be reduced systematically. The best way is to reduce it as much as possible. The reduction of modeling errors depends on the quality of turbulence models available in the CFD package, as well as the experience of users.
In general, isotropic turbulence models are often fail to predict the onset and the amount of flow separation under adverse pressure gradient conditions, leading to underestimate the amount of separation later on. LES model seems to be an appropriate choice for the cases with large scale flapping of shear layers or vortex shedding. By far, LES model has been used for a wide Reynolds number range. Saltara, et al. (1998) used DVM and LES for a 1-dof VIV at Re =1000; Zhang and Dalton (1996) performed a two-dimensional LES study for a transversely oscillating cylinder system at Re=13000. Their numerical results showed good agreement with the observation from experimental results of Feng (1968). Tutar and holdo (2000) used LES model in conjunction with the finite element method for a cylinder subjected to forced oscillation at Re= 42 10× and found that three-dimensional representation is necessary to obtain accurate results. Michelassi, et al. (2003) stated that LES is able to pro-vide a much deeper insight in the wake-boundary layer interaction mechanism when comparing to two-dimensional unsteady RANS simulations.
In the authors’ previous research works, LES smagorinsky model had been used to solve the numerical simulation of a flexible riser model which is subject to external shear current (Chen, 2010) and forced oscillation (Chen, et al., 2009). The obtained results agrees with experiment observation fairly well. In the following simulation task, LES smagorinsky model with automatic wall function has been adopted to solve the FSI problem about flexible riser model in which up- and backward progressing internal flow is considered, with Re ranging from 0 to 44.8 10× . In addition, some special measure has been taken to satisfy the requirement for LES model, such as keeping near wall spacing 1y+ < and aspect ratio of mesh in an acceptable value.
Mesh topology
The common purpose of mesh design for these simulation tasks is to provide adequate flow resolution with a number of mesh nodes which is computable. Therefore, multi-blocked mesh topology with fine mesh deployed in the wake and near
60 Inter J Nav Archit Oc Engng (2012) 4:57~70
cylinder was adopted, aiming at improving calculation accuracy. On the other hand, coarse mesh with lower resolution level in other fields was introduced, prone to deal with some unexpected large mesh deformation.
In the following cases, the computational domain has been divided into two fluid domains, i.e., an external domain surrounding the riser model and an internal domain inside the model riser. The basic numerical setting in the whole computational domain is almost same, except for the difference of flow direction and profile between external current and internal fluid. In addition, special technique for mesh control has also been adopted, by means of User-Fortran and CFX expression language (CEL).With regard to mesh density, some compromise must be made between accuracy requirement and calculation ability. In this paper, the total node number in each case is much enough for the requirement of calculation convergence.
EFFICIENCY VALIDATION OF FSI SOLUTION
Before applying the ANSYS MFX scheme to investigate the dynamic effect of internal progressive flow on riser model system, two series of numerical simulations have been accomplished, aiming at validating its efficiency for two-way FSI solution. The first one relates to a published model test carried out by MARINETEK (Lehn, 2003), in which a naked brass pipe is subject to uniform and shear currents. The experiment and numerical simulation about it is described in our previous work (Chen and Kim, 2010). The second one relates to the model test of a long FRP pipe which was carried out by KORDI. The corresponding description would be given in the following section.
FRP riser subject to shear current with still flow inside
Model test description Table 1 The key figure of the large-scale FRP pipe.
Emblematic list Value
Length 16 m
Inside diameter of FRP pipe 25.4 mm
External diameter of FRP pipe 34.8 mm
External diameter of Rubber outer thimble 39.75 mm
Young’s modulus of FRP pipe 12.4×10⁹ Pa
Fig. 1 The primary description about the flexible riser model.
In the model test executed by KORDI, the riser model was made of a FRP pipe, with outer diameter of 34.80mm and wall
thickness of 4.70mm. Outer rubber thimble covers around the FRP pipe to protect the embedded strain gauges and accelero-meters from damaging. Other key characters of the riser model are presented in Table 1. Linear shear current was actualized by fixing one end of the pipe (namely, ‘clamped end’ or ‘A’ in the latter) and towing another (namely, ‘rotating end’ or ‘B’) by CPMC for a semicircular movement. The schematic view of the experimental is shown in Fig. 1. Although the riser model is filled with water, its fluidity might be ignorable.
Inter J Nav Archit Oc Engng (2012) 4:57~70 61
Numerical simplification and setup
Referring to model test, the corresponding numerical model was designed as follows: 1) let the linearly shear inflow attack the riser system in the direction of positive X-axis, instead of the method to rotate the riser model to produce shear current in experiment; 2) the ‘clamped end’ (/’A’) used in model test has been entirely clamped in numerical simulation, rather than the universal joint used in VIV experiment. The ‘rotating end’(/’B’) keeps pinned. That is to say the constraint style has been changed from pinned-pinned to clamped-pinned; 3) constant top tension is imposed on the ‘rotating end’ in the direction of positive Y-axis.
The adoption of clamped supporting type imposed on riser ‘clamped end’ is helpful to accelerate the calculation convergence, superior to the original supporting type constrained by universal joint. It is confirmed that the obtained eigenfre-quencies of the modified riser model are nearly equivalent to those of the very system in which both ends are constrained by universal joints. Moreover, when both the aspect ratio (length/diameter) of riser model and the magnitude of top tension are comparatively large, the disagreement between the corresponding eigenfrequencies of modified and unmodified systems is negligible (Chen, et al., 2008; Chen, 2010). Since the riser model is horizontally installed in the towing tank, the direction of gravity acceleration g was set to work in the Z-axial direction. The static pressure level at the two ends was set to be equal and the progressive velocity of internal flow was set to be zero in the numerical simulation. The bottom of the towing tank was regarded as free slip wall boundary (where the shear stress at the wall is zero τ = 0, and the velocity of the fluid near the wall is not retarded by wall friction effect). The outer and inner surfaces of the pipe were regarded as FSI interfaces between CFX and ANSYS Mechanical solutions. Proper time step has been adopted in the simulations to make sure that the average Courant number ranges from 0.5 to 1.
The determination of grid density was referred to the calculation task accomplished in our previous work (Chen, 2010). The total node number of proposed mesh in this paper is of 1,045,760, with 160 layers along the riser model span. Proper mesh number enables adequate resolution for boundary layer flow. Structured mesh topology for fluid and structure domains have been adopted, shown in Figs. 2 and 3, respectively. According to the wall unites describedy by Brandt (2006), the size of the grid cell in wall units is x z+ +Δ = Δ =60. Therefore, the grid density is suit for the application of Smagorinsky LES model in fluid field.
Fig. 2 Mesh topology of the computational domain. Fig. 3 Structured mesh for solid domain.
Analysis of vibration mode
As it is well known, the response of riser model is often affected or determined by some uncertainties in experiment, instead of the idealized constraint and boundary assumption adopted in numerical simulation. It would be convenient if the data of instantaneous displacement could be collected in model experiment, and then compares with those obtained by numerical method. Unfortunately, there are only few initiatives to measure the displacement of flexible riser, due to the complexity of VIV response itself and the inscrutability of some randomly induced vibration modes (Yamamotoa, et al., 2004). In general, it is possible to derive the instantaneous displacement along the riser span by double numerically integrating the riser’s surface strain. Because there is no any well-performed strain-displacement transform method and an acceptable method to eliminating measurement noise, the attempt to give accurate estimation of the riser displacement whenever and everywhere along the riser
62 Inter J Nav Archit Oc Engng (2012) 4:57~70
span is still difficult for practical application (Lie and Kaasen, 2006). In this paper, strain (unit:με ) and displacement (unit: m) along the riser model were provided by model test and numerical
simulation, respectively. Since different measure units were adopted, the direct comparison of power distribution between them is meaningless, except for the attempt to discern the dominant frequency by means of Fourier power spectrum. If numerical method might repeat the VIV process experienced in model test fairly well, the patterns of their power spectrum should be approximately similar.
Here, the simulated results concerning two cases are presented, where the top tension topT =981N and the maximum vel-ocities of shear current EV =0.5m/s and 1.0m/s, respectively. The selected position for demonstration is exactly located at the midspan of FRP riser model. The spectral comparison between measured (unit: με ) and simulated (nondimensional, quan-tified by /A D ) results is shown in Figs. 4 and 5. In those figures, the blue-dashed line (namely, line 1) and red-solid line (namely, line 2) represent the spectral density functions of cross-flow and in-line vibrations processes observed in model test. The green-circle-dotted line (namely, line 3) and magenta-square-solid line (namely, line 4) denote the spectral density function of cross-flow and in-line vibration processes obtained in numerical simulation.
Fig. 4 Spectral comparison between measured and numerical results, when EV =0.5 m/s.
Fig. 5 Spectral comparison between measured and numerical results, when EV =1.0 m/s.
As it is illustrated, the patterns of Fourier power spectra along the riser model are very similar. There is no evidence that the
VIV process along the riser model occurs, obeying the Strouhal function /t vS f D U= or any other linear relationship. From the frequency analysis concerning the two cases, it may be found that the dominant frequency of cross-flow vibration is mainly
Inter J Nav Archit Oc Engng (2012) 4:57~70 63
determined by towing speed in model test. In the same way, the maximum velocity of shear flow plays an important role in determining the dominant vibration mode in numerical simulation. As shown in Fig. 4, when the maximum velocity of shear flow is relatively low, e.g., EV =0.5m/s, the power spectral density functions of cross-flow vibration process observed in numerical simulation (‘3’) and experiment (‘1’) are nearly of single-modal distribution. When the shear current rises, e.g., EV=1.0m/s, some subordinate vibration modes are excited with considerable instantaneous amplitude, shown in Fig. 5. Never-theless, the vibration power of subordinate modes in cross-flow is still not comparable to the dominant one. In general, from the spectral comparison shown in Figs. 4 and 5, one can promptly draw a conclusion that the apparent frequencies/modes observed in numerical simulation are consistent with those from VIV experiment.
Combining with the foregoing numerical simulation result which is related to brass riser model (Chen, 2010), the efficiency validation for the proposed CFD method could be described as follows. In a word, the estimation from numerical simulation shows good agreement with VIV experiment from the viewpoint of engineering accuracy requirement. Slight dis-agreement (in magnitude, position and dominant mode estimation) between simulated and observed experiment data is partially associated with the unpredictable effect of the rotation rig system, and partially due to some setup discrepancy between model test and numerical method. In fact, when the external current velocity rises, even tiny influencing factors can easily be enlarged or dominant. Those phenomena are more distracted in model test than numerical simulation where some assumption and sim-plification are usually adopted (Huang and Chen, 2009; Chen, 2010).
FRP RISER SUBJECT TO UP- AND DOWNWARD PROGRESSING INTERNAL FLOW
Problem descriptions and model modifications
The consideration of dynamic effect concerning opposite internal progressive flow on curved riser system is tightly related to engineering practices. Generally speaking, ocean current increases from zero to its peak value from sea bottom to its free surface, despite of some nonlinear or non-uniform distribution pattern. Here, the fluid type of ‘upward’ internal progressive flow is commonly encountered in ocean oil exploitation where the internal flow conveys along the riser span from well (with low current speed) to platform (with high current speed). Similarly, the fluid type of ‘downward’ internal progressive flow is usually encountered in some developing ocean industries, e.g., 2CO deep sea deposition, where the liquefied 2CO conveys along the flexible riser span from floating storage vessel to deep water deposition site. In the numerical simulation accom-plished in this paper, upward direction refers to internal flow conveying from the clamped end (‘A’) to the rotating end (‘B’), shown in Fig. 1. It also means that the clamped end (‘A’) is pumped as inlet. Downward direction refers to internal flow conveying from the rotating end (‘B’) to the clamped end (‘A’). It denotes that the clamped end (‘A’) is sucked as outlet.
Although the non-uniform-patterned velocity distribution is representative and prevalent in offshore engineering, most researchers were reluctant to confront problems concerning it. Complicated as the vibration response induced by non-uniform ocean current is, it finally results in some dilemma, where people have to analyze some incidental vibration characteristics asso-ciated with the contribution of non-uniform-patterned external current. When more than two kinds of dynamic loads are imposed on a riser system at the same time, it is usually hard to distinguish what kind of function each load has and how im-portantly it works. To make the dynamic effect identification of internal progressive flow on riser model as clear as possible, only the shear-patterned velocity distribution of external current has been taken into account in this paper.
It has been verified above that the numerical simulation performed by the ANSYS MFX multi-field solver could give acceptable FSI estimation for flexible riser model. By means of this FSI solution method, dynamic effect of internal progressive flow on FSI response of riser model subject to shear current has been calculated.
The riser model is similar with that described in the aforementioned section, which is a long FRP riser model subject to shear current. Considering the requirement for rigorous investigation about the dynamic effect of internal progressive flow on FSI response of riser model, two kinds of critical modifications have been made. One is to change the direction of gravity acceleration to the axis of riser model, i.e., the Y-axial direction shown in Fig. 1. This modification is mainly focused on alleviating the influence from some subordinate factors, such as gravity and buoyancy. Another is to actualize the additional internal progressive flow to the original riser model design, which is demonstrated in Fig. 1. Two kinds of practical modi-fications tend to regard the riser system as a downscaled marine riser model, making the accurate investigation about dynamic responses of different internal progressive flow practicable.
64 Inter J Nav Archit Oc Engng (2012) 4:57~70
Dynamic response comparison
Table 2 Key parameters of the simulation cases.
Case No. topT EV _U IV _D IV
Case 1
784N 0.5m/s
/ /
Case 2 0.5m/s /
Case 3 / 0.5 m/s
Case 4 1.0 m/s /
Case 5 / 1.0 m/s
Case 6
981N 0.5m/s
/ /
Case 7 0.5 m/s /
Case 8 / 0.5 m/s
Case 9 1.0 m/s /
Case 10 / 1.0 m/s
Case 11
981N 1.0m/s
/ /
Case 12 0.5 m/s /
Case 13 / 0.5 m/s
Case 14 1.0 m/s /
Case 15 / 1.0 m/s
Aiming at a direct comparison with the observations from riser model test, a series of numerical simulations with different
combinations of external current velocities EV (0.5m/s and 1.0m/s), up- and downward progressing internal flow _U IV , _D IV (0.0m/s, 0.5m/s and 1.0m/s), and top tensions topT (784N and 981N) have been performed. Totally, fifteen simulation
cases have been performed in this paper, and the detailed information about them is shown in Table 2. Here, the expression 0.0m/s (abbreviated as ‘/’ in Table 2) means that the water inside riser model is still, that is, the fluidity of internal flow being ignorable. _U IV and _D IV denote the magnitude of up- and downward progressing internal flow respectively.
In the following figures from Figs. 6 to 11, systematic comparison of vibration response has been made between cases with same top tension and external shear current, but different internal progressive flow velocities, i.e., 0.0m/s, 0.5m/s and 1.0m/s, respectively.
Among those contrastive figures, the curves denoted as No. ‘1’, ‘3’, ‘5’ represent the in-line vibration responses along the riser span concerning the cases with still, upward and downward internal flows, respectively. The curves denoted as No. ‘2’, ‘4’, ‘6’ represent the cross-flow vibration responses corresponding to those three kinds of cases. In order to compare the vibration response attributing to different directions of internal progressive flow directly, the cases with equivalent _U IV and _D IV has been demonstrated in the same figure. Here, the vibration response denoted by curves No. ‘1’ to ‘6’ in each contrastive figure is quantified by the RMS value of normalized instantaneous amplitude A/D, where A represents the instantaneous envelope of any VIV process and D denotes the riser’s diameter. Particularly, the contrastive illustrations shown in Figs. 6 (concerning Cases 1, 2 and 3) and 7 (Cases 1, 4 and 5) relate to the cases in which up- and downward internal flow pair _ _U I D IV V= is equal to 0.5m/s and 1.0m/s, respectively, but topT =784N and EV =0.5m/s invariably. Similarly, Figs. 8 (Cases 6, 7 and 8) and 9 (Case 6, 9 and 10) show the cases in which _ _U I D IV V= =0.5m/s and 1.0m/s, with topT =981N and EV =0.5m/s, while the cases of
_ _U I D IV V= =0.5m/s and 1.0m/s, with topT =981N and EV =1.0m/s are presented in Figs. 10 (Cases 11, 12 and 13) and 11(Cases 11, 14 and 15).
From the comparison between grouped cases, the dynamic effect of up- and downward progressing internal flow on this tensioned riser model can be distinctly observed with particular characteristics.
Inter J Nav Archit Oc Engng (2012) 4:57~70 65
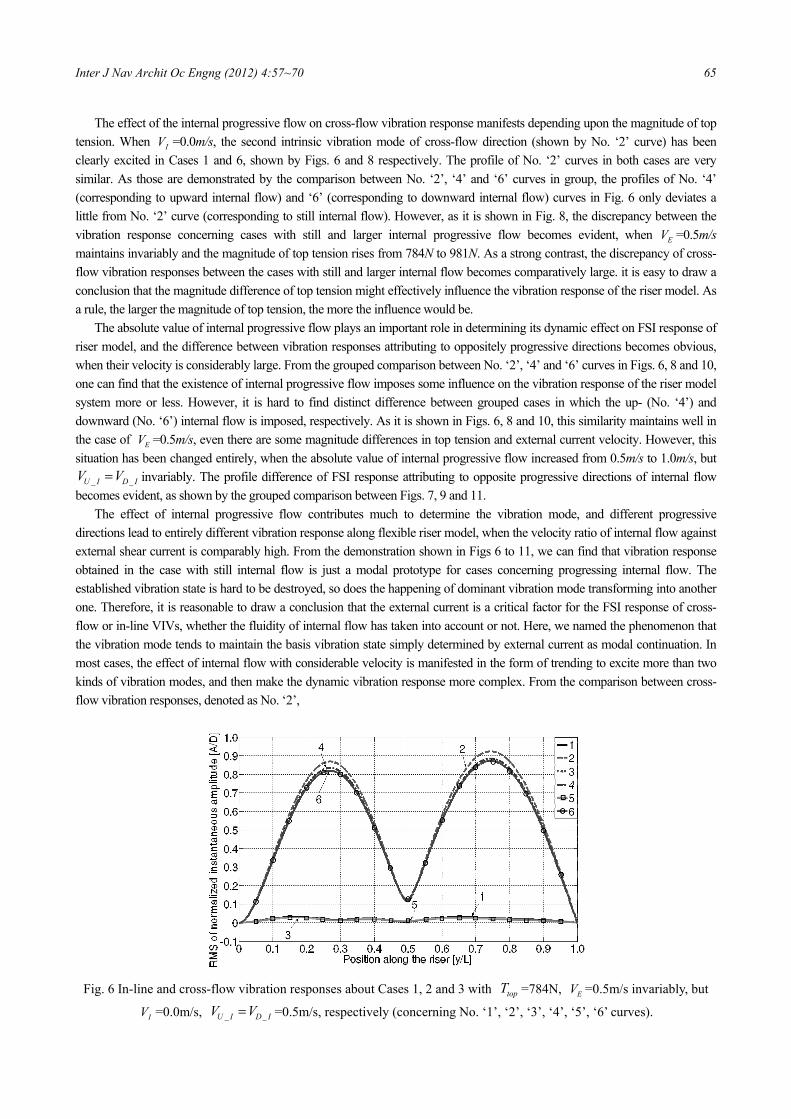
The effect of the internal progressive flow on cross-flow vibration response manifests depending upon the magnitude of top tension. When IV =0.0m/s, the second intrinsic vibration mode of cross-flow direction (shown by No. ‘2’ curve) has been clearly excited in Cases 1 and 6, shown by Figs. 6 and 8 respectively. The profile of No. ‘2’ curves in both cases are very similar. As those are demonstrated by the comparison between No. ‘2’, ‘4’ and ‘6’ curves in group, the profiles of No. ‘4’ (corresponding to upward internal flow) and ‘6’ (corresponding to downward internal flow) curves in Fig. 6 only deviates a little from No. ‘2’ curve (corresponding to still internal flow). However, as it is shown in Fig. 8, the discrepancy between the vibration response concerning cases with still and larger internal progressive flow becomes evident, when EV =0.5m/s maintains invariably and the magnitude of top tension rises from 784N to 981N. As a strong contrast, the discrepancy of cross-flow vibration responses between the cases with still and larger internal flow becomes comparatively large. it is easy to draw a conclusion that the magnitude difference of top tension might effectively influence the vibration response of the riser model. As a rule, the larger the magnitude of top tension, the more the influence would be.
The absolute value of internal progressive flow plays an important role in determining its dynamic effect on FSI response of riser model, and the difference between vibration responses attributing to oppositely progressive directions becomes obvious, when their velocity is considerably large. From the grouped comparison between No. ‘2’, ‘4’ and ‘6’ curves in Figs. 6, 8 and 10, one can find that the existence of internal progressive flow imposes some influence on the vibration response of the riser model system more or less. However, it is hard to find distinct difference between grouped cases in which the up- (No. ‘4’) and downward (No. ‘6’) internal flow is imposed, respectively. As it is shown in Figs. 6, 8 and 10, this similarity maintains well in the case of EV =0.5m/s, even there are some magnitude differences in top tension and external current velocity. However, this situation has been changed entirely, when the absolute value of internal progressive flow increased from 0.5m/s to 1.0m/s, but
_ _U I D IV V= invariably. The profile difference of FSI response attributing to opposite progressive directions of internal flow becomes evident, as shown by the grouped comparison between Figs. 7, 9 and 11.
The effect of internal progressive flow contributes much to determine the vibration mode, and different progressive directions lead to entirely different vibration response along flexible riser model, when the velocity ratio of internal flow against external shear current is comparably high. From the demonstration shown in Figs 6 to 11, we can find that vibration response obtained in the case with still internal flow is just a modal prototype for cases concerning progressing internal flow. The established vibration state is hard to be destroyed, so does the happening of dominant vibration mode transforming into another one. Therefore, it is reasonable to draw a conclusion that the external current is a critical factor for the FSI response of cross-flow or in-line VIVs, whether the fluidity of internal flow has taken into account or not. Here, we named the phenomenon that the vibration mode tends to maintain the basis vibration state simply determined by external current as modal continuation. In most cases, the effect of internal flow with considerable velocity is manifested in the form of trending to excite more than two kinds of vibration modes, and then make the dynamic vibration response more complex. From the comparison between cross-flow vibration responses, denoted as No. ‘2’,
Fig. 6 In-line and cross-flow vibration responses about Cases 1, 2 and 3 with topT =784N, EV =0.5m/s invariably, but
IV =0.0m/s, _ _U I D IV V= =0.5m/s, respectively (concerning No. ‘1’, ‘2’, ‘3’, ‘4’, ‘5’, ‘6’ curves).
66 Inter J Nav Archit Oc Engng (2012) 4:57~70
Fig. 7 In-line and cross-flow vibration responses about Cases 1, 4 and 5 with topT =784N, EV =0.5m/s invariably, but
IV =0.0m/s, _ _U I D IV V= =1.0m/s, respectively (concerning No. ‘1’, ‘2’, ‘3’, ‘4’, ‘5’, ‘6’ curves).
Fig. 8 In-line and cross-flow vibration responses about Cases 6, 7 and 8 with topT =981N, EV =0.5m/s invariably, but
IV =0.0m/s, _ _U I D IV V= =0.5m/s, respectively (concerning No. ‘1’, ‘2’, ‘3’, ‘4’, ‘5’, ‘6’ curves).
‘4’ and ‘6’ curves in Fig. 7, it can be found that the existence of internal progressive flow effectively leads to distinct
attenuation of the second vibration mode in cross-flow VIV. Although the second vibration mode is still dominant in both cases which are subject to up- and downward internal flow, the similarity between them has been attenuated a little, when the internal flow rises from 0.5m/s to 1.0m/s. It results from the fact that the first vibration mode component in cross-flow VIV concerning downward internal flow is a little apparent than the observation relating upward internal flow. In the case of topT =981N, EV=0.5m/s, and _ _U I D IV V= =1.0m/s, shown in Fig. 9, the discrepancy between the vibration responses related to opposite internal flow becomes considerably notable. For the similarity observed at low internal flow and the modal continuation observed at low top tension have been changed entirely. Here, the vibration response along the riser model became more complex. As it is illustrated by No. ‘4’ curve in Fig. 9, the first vibration mode has dominated the cross-flow vibration process, rather than the second mode. It means that free motion of the riser model has been damped, which is typical dynamic effect due to the Coriolis forces (Païdoussis, 1998; Païdoussis, 2004). On the other hand, the phenomenon that the vibration intensity of the first and second vibration modes is comparable to each other has been observed in the case of _D IV =1.0m/s, demonstrated by No. ‘6’ curve in Fig. 9. When _U IV =1.0m/s and EV rises to 1.0m/s, the fourth vibration mode denoted by No. ‘4’ curve in Fig. 11, is dominating the vibration process, rather than the original third mode. Although the third mode is still of the dominant vibration mode in cross-flow direction, shown by No. ‘6’ curve, the vibration intensity has been obviously decreased and the
Inter J Nav Archit Oc Engng (2012) 4:57~70 67
emergence of the fourth mode can be faintly observed, when _D IV =1.0m/s. From the comparison of cross-flow vibration responses between Figs. 6, 9 and 11 in group, it can be found that obvious discrepancy between cases with upward and down-ward internal flows attributes much to the coupling effect of considerable top tension and high velocity ratio of internal flow against external shear current.
The dynamic effect of opposite direction concerning internal progressive flow on FSI response of riser model attributes to different centrifugal and Coriolis accelerations, as asymmetric curvature emerges along the riser model span. It could be observed easily that the profile of vibration response is asymmetric in all the numerical simulations, owing to the fact that the riser model is subject to external shear current. The peak value of the left crest which is located in low external current is dis-tinctly less than that of the right crest which is determined by high external current. By comparison with the vibration response relating case with still internal flow, one can also find that the discrepancy of dominant vibration mode and vibration intensity between the cases concerning up- and downward progressing internal flow mostly attributes to the vibration asynchrony and asymmetry against midspan. And undoubtedly, the so-called vibration asynchrony and asymmetry results from the shear pattern of external current along the flexible riser model.
Fig. 9 In-line and cross-flow vibration responses about Cases 6, 9 and 10 with topT =981N, EV =0.5m/s invariably, but
IV =0.0m/s, _ _U I D IV V= =1.0m/s, respectively (concerning No. ‘1’, ‘2’, ‘3’, ‘4’, ‘5’, ‘6’ curves).
Fig. 10 In-line and cross-flow vibration responses about Cases 11, 12 and 13 with topT =981N, EV =1.0m/s invariably,
but IV =0.0m/s, _ _U I D IV V= =0.5m/s, respectively (concerning No. ‘1’, ‘2’, ‘3’, ‘4’, ‘5’, ‘6’ curves).
68 Inter J Nav Archit Oc Engng (2012) 4:57~70
Fig. 11 In-line and cross-flow vibration responses about Cases 11, 14 and 15 with topT =981N, EV =1.0m/s invariably,
but IV =0.0m/s, _ _U I D IV V= =1.0m/s, respectively (concerning No. ‘1’, ‘2’, ‘3’, ‘4’, ‘5’, ‘6’ curves).
As it was mentioned above, the emergence of asymmetrical vibration response along riser span usually attributes much to
the diversity of structural assembly, and the variety of dynamic loading on riser model. The dynamic effect of upward progressing internal flow on FSI response of this marine riser model is more notable than
that concerning downward internal flow. In all of those simulations, the original vibration process has not been changed into another state, despite the phenomenon that vibration intensity might be distinctly attenuated, when downward internal pro-gressive flow is imposed. In the same way, the modal continuation maintains fairly well, when upward internal progressive flow is relatively small, e. g., _U IV ≤0.5m/s in this paper. However, this phenomena might be destroyed entirely, in the form of modal transition and multi-modal concomitance taking place widely, when the magnitude of top tension, external current and upward progressing internal flow are considerably high at the same time. In the field of ocean engineering, the current velocity near the sea surface is generally larger than that near seabed. Through the analysis results performed above, we might speculate that the phenomena of multi-modal concomitance and modal transition are popular in deepwater oil production industry, when the progressive velocity of oil flow from the sea bed to FPSO is relatively large. On the other hand, the dynamic effect of internal flow seems have a little effect on the FSI response of slender riser which is often used to transport the liquid 2CO to ocean deposition field, despite the damping of vibration amplitude attributing to it.
CONCLUDING REMARKS
This paper presents a series of 3D numerical investigation about the dynamic effect of upward and downward progressing internal flow on the fluid-structure interaction response of flexible riser model which is subject to external shear current. By pro-cessing the FSI analysis, the following conclusions can be drawn.
The magnitudes of top tension, external flow and internal flow influence the FSI response of riser model distinctly in common, but characteristically in special. As a rule, the vibration mode of cross-flow VIV is mainly determined by the mag-nitude of external current velocity. The effect of internal progressive flow on cross-flow vibration process manifests on the basis of the magnitude of top tension and external current. Only in the case that its magnitude is large, the difference between the vibration responses relating cases with still and progressing internal flow becomes considerable.
Different centrifugal and Coriolis accelerations experienced by opposite (i.e., up- and downward) internal progressive flow contributes much to the vibration mode transition and even the final vibration state. It means that the effect of internal pro-gressive flow may determine the vibration mode of the flexible riser model, as well as the dynamic effect on FSI response of riser model. In the case that the velocity ratio of internal flow against external shear current is considerably high, the difference of vibration responses attributing to up- and downward progressing internal flow become obvious. As a rule, the dynamic effect owing to progressing internal flow is more evident than that relating downward internal flow. However, the difference between them might be ignorable, if their velocity ratio of internal flow against external shear current is low. Although the modal con-
Inter J Nav Archit Oc Engng (2012) 4:57~70 69
tinuation varies with the increase of external current, top tension and absolute value of internal flow, the dynamic effect of opposite internal flow on riser model manifests itself depending upon the premise that the magnitude of the former two are considerably large.
ACKNOWLEDGEMENTS This work was financially supported by the National Natural Science Foundation of China (41106077), Zhejiang Provincial
Natural Science Foundation of China (R5110036), Scientific Research Foundation of Science Technology Department of Zhe-jiang Province (2011C24005), Korea Research Foundation (KRF-2008-D00556), Scientific Research Foundation of State Key laboratory of Ocean Engineering of Shanghai Jiao Tong University (1101) and Scientific Research Foundation of Zhejiang Ocean University.
REFERENCES ANSYS, 2007. ANSYS CFX-Solver Modeling Guide (V11). Al-Jamal, H. and Dalton, C., 2004. Vortex induced vibrations using large eddy simulation at a moderate Reynolds number.
Journal of Fluids and Structure, 19(1), pp.73-92. Brandt, T.T., 2006. Study of Large Eddy Simulation and Smagorinsky Model using Explicit Filtering. 36th AIAA Fluid
Dynamics Conference and Exhibit. San Francisco, California, AIAA-2006-3541. Chen, Z.S., 2010. Numerical simulation and signal analysis method for vortex-induced vibration of flexible risers. Doctoral
dissertation. Mokpo National University. Mokpo, Korea. Chen, Z.S. and Kim, W.J., 2010. Numerical investigation of vortex shedding and vortex-induced vibration for flexible riser
models. International Journal of Naval Architecture and Ocean Engineering, 2(2), pp.112-118. Chen, Z.S., Kim, W.J. and Choi, Y.R., 2009. Numerical simulation of a short flexible pipe subject to forced motion and
vortex-induced vibration. Acta Oceanologica Sinica, 28(6), pp.70-83. Chen, Z.S., Kim, W.J. and Yu, D.Y., 2008. Numerical simulation of a large-scale riser with vortex-induced vibration.
Proceedings of the Eighth ISOPE Pacific/Asia Offshore Mechanics Symposium, Bangkok, Thailand. pp.121-128. Dong, S. and Karniadakis, G.E., 2005. DNS of flow past a stationary and oscillating cylinder at Re=10000. Journal of Flu-
ids and Structure, 20(4), pp.19-31. Feng, C.C., 1968. The measurement of vortex induced effects in flow past stationary and oscillating circular and D-section
cylinders. Master's dissertation. University of British Columbia. Vancouver, B.C., Canada. Fujisawa, N., Asano, Y., Arakawa, C. and Hashimoto, T., 2005. Computational and experimental study on flow around a
rotationally oscillating circular cylinder in a uniform flow. J Wind Eng Ind Aerodyn, 93(2), pp.37-53. Guo, H.Y. and Lou, M., 2008. Effect of internal flow on vortex-induced vibration of risers. Journal of Fluids and Struc-
tures, 24(4), pp.469-504. Guilmineau, E. and Queutey, P., 2004. Numerical simulation of vortex-induced vibration of a circular cylinder with low
mass-damping in a turbulent flow. Journal of Fluids and Structures, 19, pp.449-466. Hong, N.S., 1994. The effect of internal flow on marine riser dynamics. Doctoral dissertation. University of Florida at Ga-
inesville, USA. Hong, N. and Huh, T., 1999. The effect of internal flow on vortex-induced vibration of riser. Proceedings of the Ninth
International Offshore and Polar Engineering Conference, Brest, France, pp.688-693. Huang, K. and Chen, H.C., 2009. Vertical Riser VIV Simulation in Sheared Current. ISOPE, Osaka, Japan, pp.1369-1376. Holmes, S., Owen, H., Oakley, J. and Yiannis, C., 2006. Simulation of Riser VIV Using Fully Three Dimensional CFD
Simulations. 25th International Conference on Offshore Mechanics and Arctic Engineering, Hamburg, Germany, OMAE-2006-92124.
Lehn, E., 2003. VIV suppression tests on high L/D flexible cylinders, ExxonMobil upstream research company. Lie, H. and Kaasen, K.E., 2006. Modal analysis of measurements from a large-scale VIV model test of a riser in linearly
sheared flow. Journal of Fluids and Structures, 22(4), pp.557-575. Lopes, J.L., Paidoussiss, M.P. and Semiler, C., 2002. Linear and nonlinear dynamics of cantilevered cylinders in axial flow,
Part 2: The equations of motion. Journal of Fluids and Structures, 16(6), pp.615-737.
70 Inter J Nav Archit Oc Engng (2012) 4:57~70
Mittal, S. and Kumar, V., 2001. Flow-induced vibrations of a light circular cylinder at Reynolds numbers 103 to 104. Jour-nal of Sound and Vibration, 245(5), pp.23-46.
Mukundan, H., Hovera, F.S. and Triantafylloua, M.S., 2010. A systematic approach to riser VIV response reconstruction. Journal of Fluids and Structures, 26(5), pp.722-746.
Menter, F. and Sharkey, P., 2006. Overview of Fluid-structure coupling in ANSYS-CFX. 25th International Conference on Offshore Mechanics and Arctic Engineering, Hamburg, Germany, OMAE2006-92145.
Michelassi, V., Wissink, J.G., Frohlich, J. and Rodi, W., 2003. Large-eddy simulation of flow around low-pressure turbine blade with incoming wakes. AIAA Journal, 41(11), pp.2143-2156.
Nobari, M.R.H. and Naredan, H., 2006. A numerical study of flow past a cylinder with cross flow and inline oscillation. Computer Fluids, 35(4), pp.393-415.
Païdoussis, M.P., 1998. Fluid-Structure Interactions: Slender Structures and Axial Flow-Volume 1. California, USA, Aca-demic Press.
Païdoussis, M.P., 2004. Fluid-Structure Interactions: Slender Structures and Axial Flow-Volume 2. California, USA, Elser-vier Academic Press.
Saghafian, M., Ansby, P.K., idi, M.S. and sley, D.D., 2003. Simulation of turbulent flows around a circular cylinder using nonlinear eddy viscosity modelling: steady and oscillatory ambient flows. Journal Fluids and Structures, 17(8), pp.13-36.
Semler, C., Lopes, J.L., Augu, N. and Paidoussis, M.P., 2002. Linear and nonlinear dynamics of cantilevered cylinders in axial flow, Part 3: Nonlinear dynamics. Journal of Fluids and Structures, 16(6), pp.739-759.
Saltara, F., Meneghini, J.R., Siqueira, C.R. and Bearman, P.W., 1998. The simulation of vortex shedding from an oscil-lating circular cylinder with turbulence modeling. ASME, Atlanta, USA.
Tutar, M. and Holdo, A.E., 2000. Large eddy simulation of a smooth circular cylinder oscillating normal to a uniform flow. ASME Journal of Fluids Engineering, 122(4), pp.694-702.
Wanderley, J.B.V., Souza, G.H.B. and Levi, C., 2006. Numerical Simulation of Vortex Induced Vibration Using the κ-ε Model. 25th International Conference on Offshore Mechanics and Arctic Engineering, Hamburg, Germany, OMAE 2006-92164.
Yamamotoa, C.T., Meneghinib, J.R., Saltarab, F. and Fregonesib, R.A., 2004. Numerical simulations of vortex-induced vibration on flexible cylinders. Journal of Fluids and Structures, 19(4), pp.467-489.
Zhang, J. and Dalton, C., 1996. Interaction of vortex-induced vibration of a circular cylinder and a steady approach flow at a Reynolds number of 13,000. Computers and Fluids, 25(3), pp.283-294.