Page 1
Copyright © 2020 IJAIR, All right reserved
326
International Journal of Agriculture Innovations and Research
Volume 8, Issue 4, ISSN (Online) 2319-1473
Effect of Blended Fertilizer Types and Rates on
Growth, Yield and Yield Components of Bread
Wheat (Triticum aestivum L.) in Wondo District,
Southern Ethiopia
Haji Jewaro Beketa 1*, Demelash Kefale 2 and Tarekegn Yoseph 3 1 Wondo District Agricultural and Natural Resource Office, Southern Ethiopia.
2 Hawassa University College of Agriculture, Hawassa, Ethiopia. 3 Hawassa University College of Agriculture, Hawassa, Ethiopia.
Abstract – Soil fertility decline is one of the principal factors contributing to low productivity of crops and food
insecurity in Ethiopia. The information available with regards to effect of blended fertilizer type and rates on growth
and yield performance of bread wheat (Triticum aestivum L.) for optimum production on loam soils of Wondo district
is very limited. Therefore, a field experiment was conducted on loam soils of Wondo district Bachel Gigissa Peasant
Association Farmers training center during 2018 cropping season to assess the effect of different blended fertilizer
types and rates on growth, yield and yield components of bread wheat. The treatments studied consist of: control and
three blended fertilizer formula NPS, NPSB, and NPSBZn each with four different rates (50, 100, 150 and 200 kg ha-
1). Recommended rate of Urea (100 kg ha-1) was used equally for all treatments in spilt application and Danda’a variety
was used as a test crop. The treatments were laid out in a Randomized Complete Block Design with three replications.
Soil and crop data were collected and analyzed using the SAS statistical package program version 9.4 and LSD at 5%
probability level was used to establish the difference among the means. The soil result revealed that the experimental
soil site texture was classified as loam. The highest (30.06 kg-1) agronomic efficiency obtained from150 kg ha-1 NPSB.
The results revealed that application of blended fertilizers (NPS, NPSB and NPSBZn) delayed days to flowering, and
physiological maturity by (13, 9, 10) and (15, 14 and 11) days, respectively as compared to control plot. Leaf Area Index
and Straw yield were significantly (p≤0.01) affected by the application of different blended fertilizer rates and
significantly (p≤0.05) by the main effect of blended fertilizer types and interaction effect. Grains per spike and grain
yield were significantly (p≤0.01) affected due to the main effects of blended fertilizer types and rates, they were also
significantly (p≤0.05) affected due to the interaction effect. Above ground biomass was significantly (p≤0.01) affected
due to main effect of blended fertilizer rates and the interaction effect however, non-significant (p>0.05) due to blended
fertilizer types. This study also revealed that, blended fertilizer types and rates significantly (p≤0.05) affected DH,
NFTm-2, DPM, PH, SL and HI while TSW was significantly (p≤0.05) affected only by the main effect of blended
fertilizer rates. Blended fertilizers had improved Agronomic nutrient use efficiency of wheat as compared to the control
treatment. The highest (6.17t ha-1) grain yield was obtained from 200 kg ha-1NPSB +100 kg ha-1 urea application
followed by (6.11 t ha-1) from 150 kg ha-1 NPSB + 100 kg ha-1urea, while minimum (1.95t ha-1) grain yield was attained
from the control treatment. However, the application of 150 kg ha-1 NPSB + 100 kg ha-1 urea had highest marginal rate
of return (MRR %) and Net benefit. Therefore, it would be advisable to use blended fertilizer 150 kg ha-1 NPSB + 100
kg ha-1, for wheat production in Wondo area. Furthermore, based on yield, net benefit and relatively low total cost of
production the farmers of Wondo area also can use 100 kg ha-1 NPSB+ 100 kg ha-1 urea. However, since the experiment
was conducted only for one season and one site, repeating the trial at different site as well as in the same experimental
site would be important in order to draw sound recommendation.
Keywords – Blended Fertilizer, Grain Yield, Net Benefit, Nutrient Use Efficiency.
I. INTRODUCTION
Wheat is one of the world’s leading cereal grains serving as a staple food for more than one-third of the global
Manuscript Processing Details (dd/mm/yyyy):
Received: 12/12/2019 | Accepted on: 08/01/2020 | Published: 23/01/2020
Page 2
Copyright © 2020 IJAIR, All right reserved
327
International Journal of Agriculture Innovations and Research
Volume 8, Issue 4, ISSN (Online) 2319-1473
population. Globally, it is cultivated on approximately 218 million hectares of land with average yields of 3.3 t
ha-1 (FAO, 2015a). Wheat is one of major cereal crops grown in the highlands at altitudes ranging from 1500-
3000 m a.s.l., situated between 6 –16oN and 35 – 42oE; however, the most suitable agro ecological zones for wheat
production fall between 1900-2700 m a.s.l. (Hailu, 1991).
Cereal grains are major contributors to human nutrition throughout of the world and covers about 87.42% (about
25,384,723.96 tones) of the grain production in Ethiopia. Among cereals, wheat took up to 13.49% (1,696,082.59
hectares) with production of 15.63% (4,537,852.34 tones). Ethiopia is the second largest wheat producer in sub-
Saharan Africa, next to South Africa (Demeke et al., 2013), with annual average bread (60%) and durum wheat
(40%) production of about 1.6 million hectares (CSA 2015). It ranks 4th after tef (Eragrostis tef), maize (Zea
mays) and sorghum (Sorghum bicolor) in area coverage and 3rd in total production for 2016/17 summer season
that play a substantial role in assuring food security (CSA, 2017). The national average yield of bread wheat in
the country is 2.7tha-1 (CSA, 2017). The major wheat producing regions of the country are: Oromia region,
Amhara, Tigray and SNNPR region (CSA, 2017) that share more than 83% of wheat production.
The total areas of wheat production in the Oromia Region in 2017 were reported as 898,455.57 ha with average
yields of 2.97 t ha-1 (CSA, 2017). Wheat in Wondo district is the 3rd most important crop during main cropping
season in terms of total production after maize and tef with total land coverage of more than 1200 ha with average
yields of 2.73 t ha-1 (Wondo District Agricultural Office, 2018) which is below the regional average yield of 2.96
t ha-1 (CSA, 2017). Soil fertility depletion and blanket fertilizer application to correct the fertility problem are the
major constraints of wheat production in Ethiopia (MoARD, 2008). Complete removal of crop residues from farm
lands for fodder and fuel, low level of fertilizer application, limited use of manure, lack of appropriate soil
conservation practices and cropping systems are among the main factors contributing to the decline in soil
productivity (Haileselassie et al., 2005).
Based on the national soil data base, in addition to the macro-nutrients, some of the micro-nutrients like Zn, B
and Cu are depleted from the soil of the major crop producing area of the country mainly due to prolonged years
of cultivation (Ethio SIS, 2016). Balanced fertilization not only guarantees optimal crop production, better food
quality and benefits for the growers, but is also the best solution for minimizing the risk of nutrient losses to the
environment.
Thus, this experiment was conducted to evaluate the effect of three different blended fertilizers containing 3-5
nutrient each with four levels on growth, yield and yield performance of bread wheat and to determine the
economic feasibility as compared to the control treatment in Wondo District, West Arsi Zone of Southern Ethiopia
with the following specific objectives:
To determine the effect of different types of blended fertilizer rates on growth and yield performance of bread
wheat.
To identify the type and optimum rate of blended fertilizer for wheat production.
To estimate the economic feasibility of the blended fertilizer type and rates for wheat production in the study
area.
Page 3
Copyright © 2020 IJAIR, All right reserved
328
International Journal of Agriculture Innovations and Research
Volume 8, Issue 4, ISSN (Online) 2319-1473
II. MATERIALS AND METHODS
Description of the Study Area
The experiment was conducted under rain-fed condition during the main cropping season from August –
December, 2018 at Wondo District, West Arsi Zone, Oromia Regional state. The specified study area is located
at 7o4’42’’N and 38o41’59’’ E having an altitude of 2538m a.s.l. The topography of the district is slightly
undulating estimated to be 5% mountainous, 60% valley and 35% plain with an altitudinal range of 1600 – 2580
m.a.s.l (Wondo District annual report, 2018). Its annual rainfalls are around 900-1200 mm and mean annual
temperature fall between 10oc and 21 oc. The average annual rainfall in 2009-2018 and the average total rainfall
during the growing season were 1105.8 mm and 472.1 mm, respectively. The dominant soil type of Wondo district
is sandy loam and the farming system in the area is crop and livestock mixed agriculture.
Treatments and Experimental Design
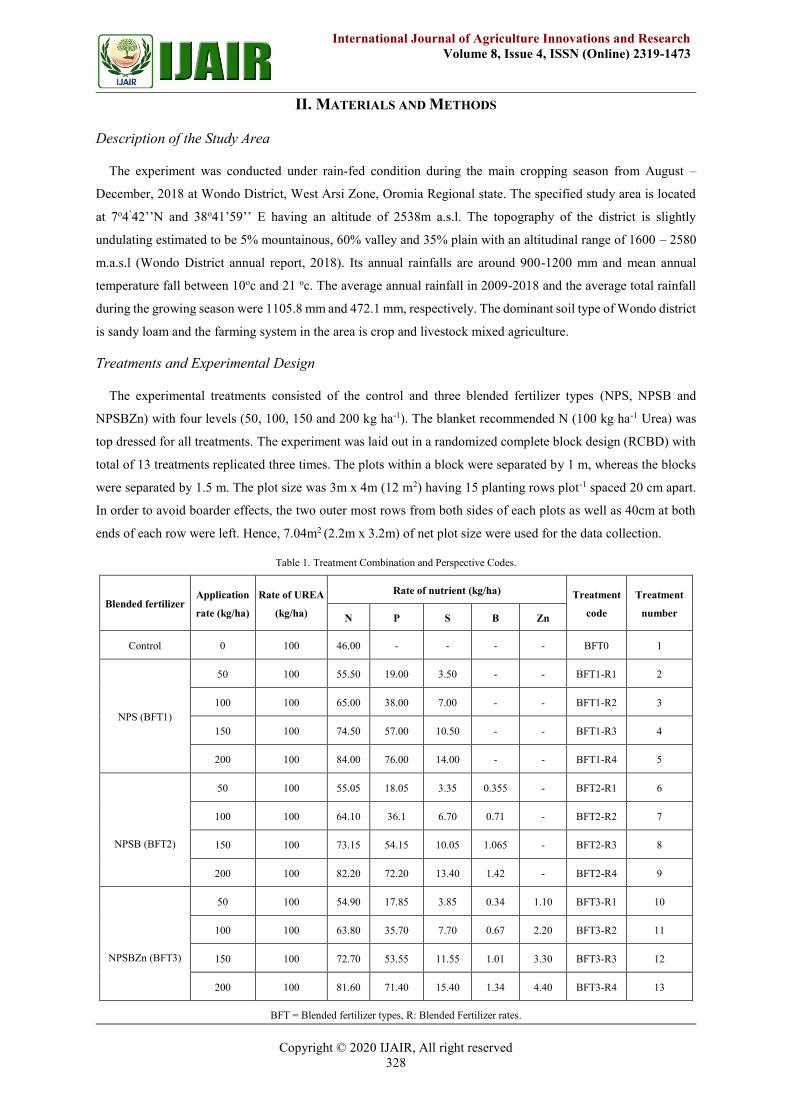
The experimental treatments consisted of the control and three blended fertilizer types (NPS, NPSB and
NPSBZn) with four levels (50, 100, 150 and 200 kg ha-1). The blanket recommended N (100 kg ha-1 Urea) was
top dressed for all treatments. The experiment was laid out in a randomized complete block design (RCBD) with
total of 13 treatments replicated three times. The plots within a block were separated by 1 m, whereas the blocks
were separated by 1.5 m. The plot size was 3m x 4m (12 m2) having 15 planting rows plot-1 spaced 20 cm apart.
In order to avoid boarder effects, the two outer most rows from both sides of each plots as well as 40cm at both
ends of each row were left. Hence, 7.04m2 (2.2m x 3.2m) of net plot size were used for the data collection.
Table 1. Treatment Combination and Perspective Codes.
Blended fertilizer Application
rate (kg/ha)
Rate of UREA
(kg/ha)
Rate of nutrient (kg/ha) Treatment
code
Treatment
number N P S B Zn
Control 0 100 46.00 - - - - BFT0 1
NPS (BFT1)
50 100 55.50 19.00 3.50 - - BFT1-R1 2
100 100 65.00 38.00 7.00 - - BFT1-R2 3
150 100 74.50 57.00 10.50 - - BFT1-R3 4
200 100 84.00 76.00 14.00 - - BFT1-R4 5
NPSB (BFT2)
50 100 55.05 18.05 3.35 0.355 - BFT2-R1 6
100 100 64.10 36.1 6.70 0.71 - BFT2-R2 7
150 100 73.15 54.15 10.05 1.065 - BFT2-R3 8
200 100 82.20 72.20 13.40 1.42 - BFT2-R4 9
NPSBZn (BFT3)
50 100 54.90 17.85 3.85 0.34 1.10 BFT3-R1 10
100 100 63.80 35.70 7.70 0.67 2.20 BFT3-R2 11
150 100 72.70 53.55 11.55 1.01 3.30 BFT3-R3 12
200 100 81.60 71.40 15.40 1.34 4.40 BFT3-R4 13
BFT = Blended fertilizer types, R: Blended Fertilizer rates.
Page 4
Copyright © 2020 IJAIR, All right reserved
329
International Journal of Agriculture Innovations and Research
Volume 8, Issue 4, ISSN (Online) 2319-1473
The experiment was conducted using improved bread wheat variety Danda’a (Damphae-1) as a test crop which
was released from Kulumsa agricultural research center in 2010.
Experimental Procedure and Management
The experimental field was prepared using oxen plow as farmer’s conventional farm practices. In order to create
good seed bed for proper crop growth, the experimental plots were plowed three times to a depth of 25–30 cm.
Seeds of bread wheat were sown by hand drilling on August 7, 2018 with the recommended seed rate of 125 kg
ha-1. All blended fertilizers were applied at planting time as per treatments while N in the form of Urea was applied
in split doses 1/3 at planting and the remaining 2/3 top dressed 35 days after sowing and all agronomic practices
were carried out according to recommendation for wheat.
Data Collection and Analysis
Soil Sampling and Analysis
The soil samples of the experimental site were collected before planting from 0-20 cm plough depth. A
representative soil samples were taken from an experimental field randomly and composited to one sample for
soil characterization.
The collected soil samples were analyzed for the selected chemical properties cation exchangeable capacity
(CEC), Electrical conductivity (EC), Organic Carbon, Total N, exchangeable K, available (P, S, B, and Zn). Soil
samples were analyzed for texture with a hydrometer (Bouyoucos, 1962). The pH of the soil is determined with
the potentiometer method (1:2.5 soil: water as described by Chopra and Kanwar (1976). Available P in soil was
determined by Olsen et al. (1954) extraction procedures, with a sodium bicarbonate solution. Total nitrogen was
measured using Kjeldhal method (Rainst et al., 1999).
Agronomic Data Collection
For grain yield, above ground biomass and straw yield, all the wheat discarding the outside rows and the end
40cm of the plot both sides 2.2m x 3.2m = 7.04 m2 area was harvested. Randomly 10 plants were collected from
each plot for growth and yield component Plant height and Spike length data measurement but, for Leaf area index
and Grain per spike 5 plants were used. Finally, the grain yield and yield component parameters were recorded.
Sampling, harvesting and data collection and recording for each parameter were explained as follows:
Phenological parameters (Days to 50% heading, Days to 90% physiological maturity): Growth parameters (Leaf
area index, Plant height (cm), Spike length (cm): Yield and yield components (Number of fertile spikes m-2 ,
Number of grains per spike, Total above ground biomass (t ha-1, Grain Yield (t ha-1), Straw yield (t ha-1), Thousand
kernels weight (g) and Harvest index.
Agronomic Nutrient use Efficiency (NUE) in Wheat
Agronomic efficiency (AE) =
Yield obtained from
fertilized plot (kg ha-1) -
Yield obtained from
control plot (kg ha-1)
(1) Quantity of nutrient applied (Fa) (kg)
Statistical Analysis
The mean values of the parameters recorded were subjected to Analysis of Variance (ANOVA) using statistical
Page 5
Copyright © 2020 IJAIR, All right reserved
330
International Journal of Agriculture Innovations and Research
Volume 8, Issue 4, ISSN (Online) 2319-1473
analysis Software (SAS version 9.4) with proc-mixed model of SAS. Treatment mean separated were done using
least significance difference (LSD) test at 5% probability level and simple Pearson correlations were done in
determining association of parameters by using correlation analysis. Graphical presentation of the data was carried
out by using Microsoft Excel.
Economic Analysis of Treatment Effects
Economic analysis was performed to investigate the economic feasibility of the treatments by using partial and
marginal profit analyses according to CIMMYT (1988). To make a rational choice of alternative blended
fertilizers based on their economic benefit the partial budget and marginal rate of return (MRR) were analyzed for
wheat production (CIMMYT, 1988).
MRR (%) = (NB/TVC)*100 (2)
Where: NB = Net benefit, TVC = Total variable cost and MRR = marginal rate of return.
III. RESULTS AND DISCUSSIONS
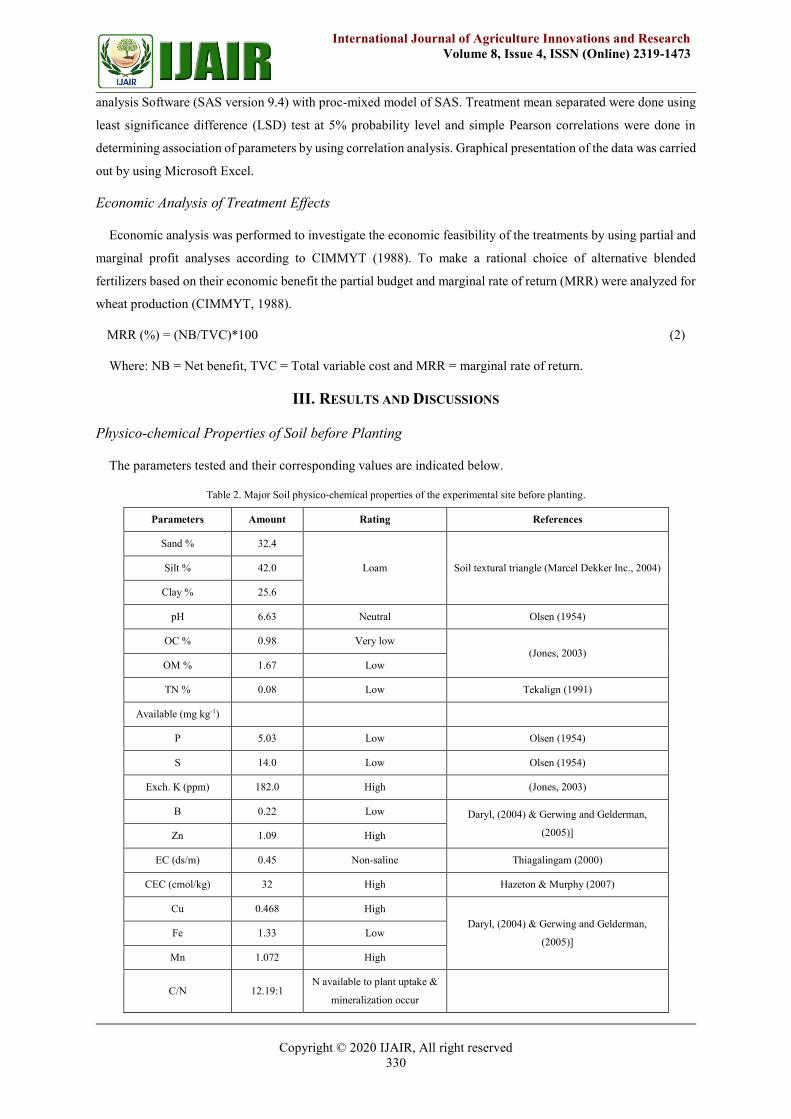
Physico-chemical Properties of Soil before Planting
The parameters tested and their corresponding values are indicated below.
Table 2. Major Soil physico-chemical properties of the experimental site before planting.
Parameters Amount Rating References
Sand % 32.4
Loam Soil textural triangle (Marcel Dekker Inc., 2004) Silt % 42.0
Clay % 25.6
pH 6.63 Neutral Olsen (1954)
OC % 0.98 Very low
(Jones, 2003) OM % 1.67 Low
TN % 0.08 Low Tekalign (1991)
Available (mg kg-1)
P 5.03 Low Olsen (1954)
S 14.0 Low Olsen (1954)
Exch. K (ppm) 182.0 High (Jones, 2003)
B 0.22 Low Daryl, (2004) & Gerwing and Gelderman,
(2005)] Zn 1.09 High
EC (ds/m) 0.45 Non-saline Thiagalingam (2000)
CEC (cmol/kg) 32 High Hazeton & Murphy (2007)
Cu 0.468 High
Daryl, (2004) & Gerwing and Gelderman,
(2005)] Fe 1.33 Low
Mn 1.072 High
C/N 12.19:1 N available to plant uptake &
mineralization occur
Page 6
Copyright © 2020 IJAIR, All right reserved
331
International Journal of Agriculture Innovations and Research
Volume 8, Issue 4, ISSN (Online) 2319-1473
OM = Organic matter, TN = Total nitrogen, Av P, Av S, Av B, Av Zn = Available (phosphorus, sulfur, boron
and zinc) respectively, Exch. K (Exchangeable potassium), EC = Electrical conductivity, CEC = Cation
exchangeable capacity, ppm = parts per million.
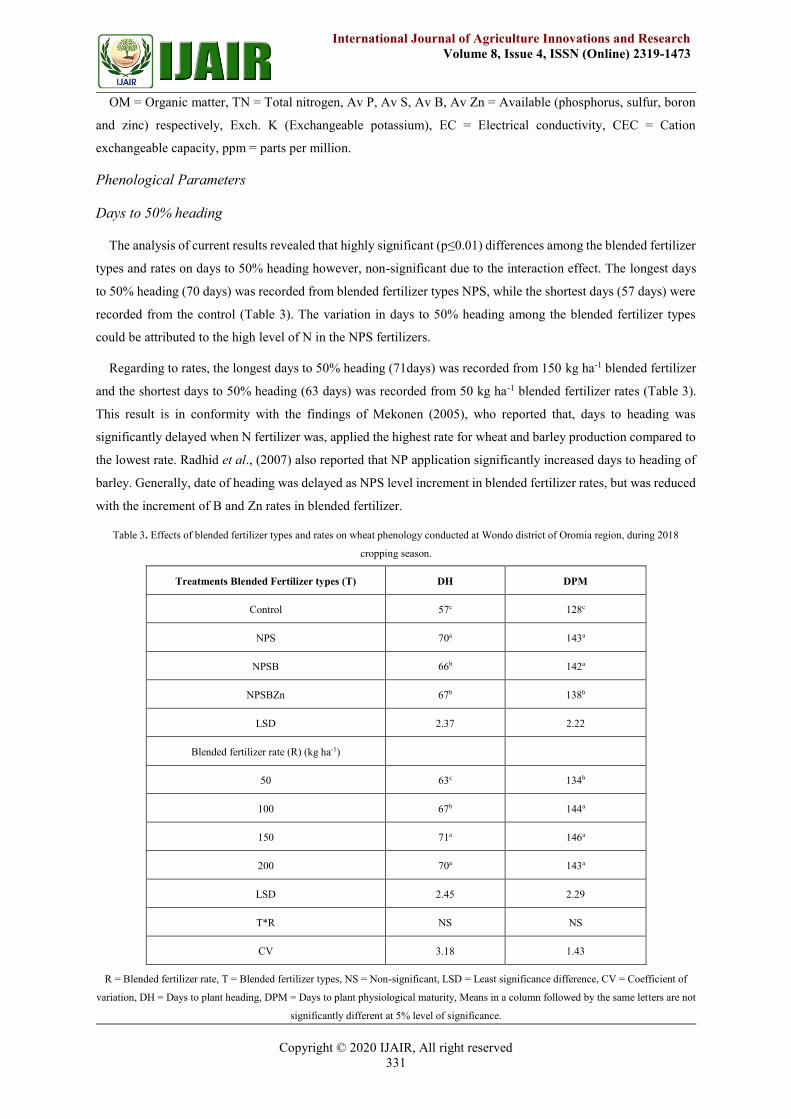
Phenological Parameters
Days to 50% heading
The analysis of current results revealed that highly significant (p≤0.01) differences among the blended fertilizer
types and rates on days to 50% heading however, non-significant due to the interaction effect. The longest days
to 50% heading (70 days) was recorded from blended fertilizer types NPS, while the shortest days (57 days) were
recorded from the control (Table 3). The variation in days to 50% heading among the blended fertilizer types
could be attributed to the high level of N in the NPS fertilizers.
Regarding to rates, the longest days to 50% heading (71days) was recorded from 150 kg ha-1 blended fertilizer
and the shortest days to 50% heading (63 days) was recorded from 50 kg ha-1 blended fertilizer rates (Table 3).
This result is in conformity with the findings of Mekonen (2005), who reported that, days to heading was
significantly delayed when N fertilizer was, applied the highest rate for wheat and barley production compared to
the lowest rate. Radhid et al., (2007) also reported that NP application significantly increased days to heading of
barley. Generally, date of heading was delayed as NPS level increment in blended fertilizer rates, but was reduced
with the increment of B and Zn rates in blended fertilizer.
Table 3. Effects of blended fertilizer types and rates on wheat phenology conducted at Wondo district of Oromia region, during 2018
cropping season.
Treatments Blended Fertilizer types (T) DH DPM
Control 57c 128c
NPS 70a 143a
NPSB 66b 142a
NPSBZn 67b 138b
LSD 2.37 2.22
Blended fertilizer rate (R) (kg ha-1)
50 63c 134b
100 67b 144a
150 71a 146a
200 70a 143a
LSD 2.45 2.29
T*R NS NS
CV 3.18 1.43
R = Blended fertilizer rate, T = Blended fertilizer types, NS = Non-significant, LSD = Least significance difference, CV = Coefficient of
variation, DH = Days to plant heading, DPM = Days to plant physiological maturity, Means in a column followed by the same letters are not
significantly different at 5% level of significance.
Page 7
Copyright © 2020 IJAIR, All right reserved
332
International Journal of Agriculture Innovations and Research
Volume 8, Issue 4, ISSN (Online) 2319-1473
Days to 90% of Physiological Maturity
The analysis of the current study revealed that, days to 90% of physiological maturity of wheat was significantly
(p≤0.01) affected by the application of blended fertilizer types and rates. However, their interaction did not show
significant effect on days to physiological maturity. The earliest days to physiological maturity (128 days) was
recorded from the control and the latest maturity date (143 days) was recorded from NPS blended fertilizer types
(Table 3).
Regarding to rates, the longest days to physiological maturity (146 days) was recorded from 150 kg ha-1 blended
fertilizer rates which had statistically similar with 100 and 200 kg ha-1 blended fertilizer rates. However, the
shortest (134 days) was recorded from 50 kg ha-1 (Table 3). This result agrees with the findings of Hussein and
Leitch (2007) indicated that applications of higher doses of N enhanced vegetative growth and increased days to
maturity. Similarly, Woineshet (2007) reported that increasing N rates delayed days to maturity of wheat.
Growth Parameters
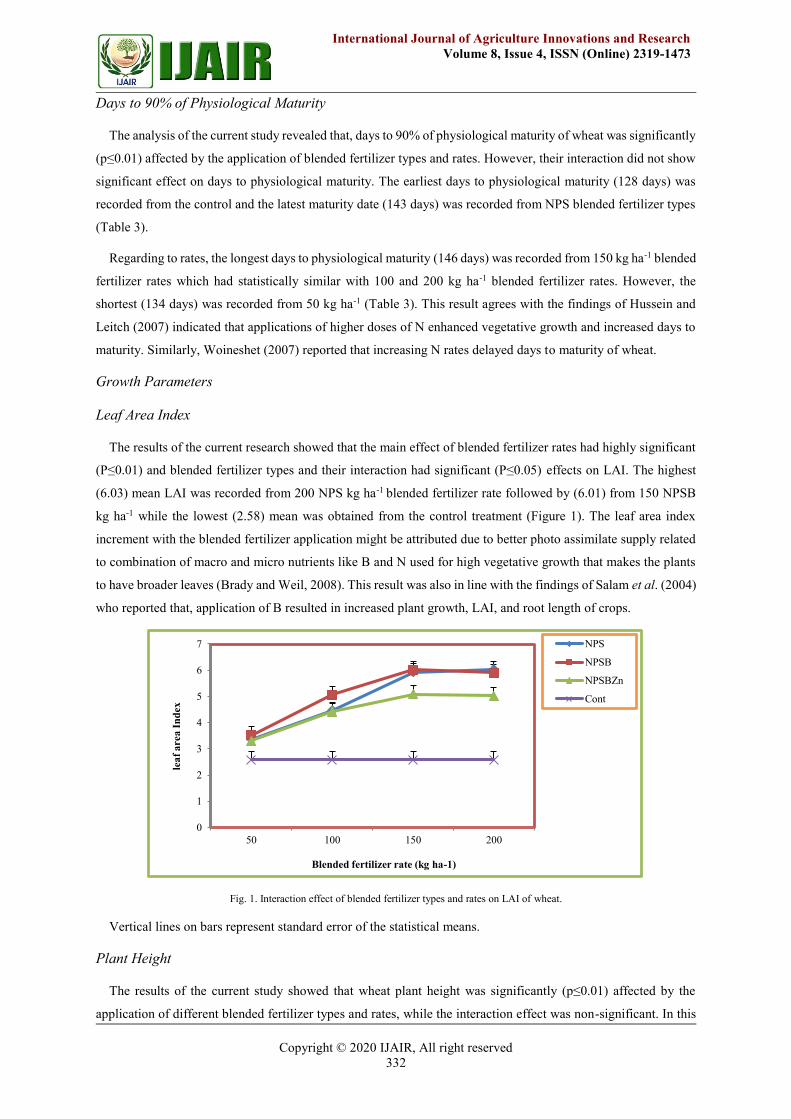
Leaf Area Index
The results of the current research showed that the main effect of blended fertilizer rates had highly significant
(P≤0.01) and blended fertilizer types and their interaction had significant (P≤0.05) effects on LAI. The highest
(6.03) mean LAI was recorded from 200 NPS kg ha-1 blended fertilizer rate followed by (6.01) from 150 NPSB
kg ha-1 while the lowest (2.58) mean was obtained from the control treatment (Figure 1). The leaf area index
increment with the blended fertilizer application might be attributed due to better photo assimilate supply related
to combination of macro and micro nutrients like B and N used for high vegetative growth that makes the plants
to have broader leaves (Brady and Weil, 2008). This result was also in line with the findings of Salam et al. (2004)
who reported that, application of B resulted in increased plant growth, LAI, and root length of crops.
Fig. 1. Interaction effect of blended fertilizer types and rates on LAI of wheat.
Vertical lines on bars represent standard error of the statistical means.
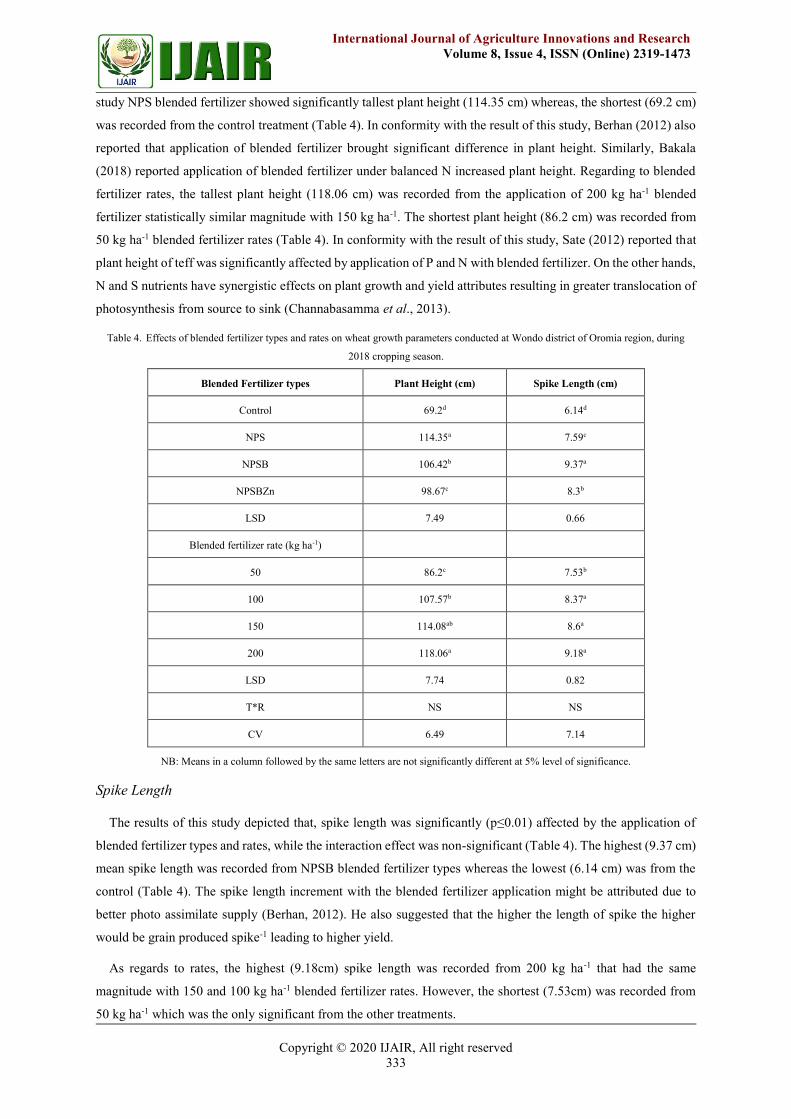
Plant Height
The results of the current study showed that wheat plant height was significantly (p≤0.01) affected by the
application of different blended fertilizer types and rates, while the interaction effect was non-significant. In this
0
1
2
3
4
5
6
7
50 100 150 200
lea
f a
rea
In
dex
Blended fertilizer rate (kg ha-1)
NPS
NPSB
NPSBZn
Cont
Page 8
Copyright © 2020 IJAIR, All right reserved
333
International Journal of Agriculture Innovations and Research
Volume 8, Issue 4, ISSN (Online) 2319-1473
study NPS blended fertilizer showed significantly tallest plant height (114.35 cm) whereas, the shortest (69.2 cm)
was recorded from the control treatment (Table 4). In conformity with the result of this study, Berhan (2012) also
reported that application of blended fertilizer brought significant difference in plant height. Similarly, Bakala
(2018) reported application of blended fertilizer under balanced N increased plant height. Regarding to blended
fertilizer rates, the tallest plant height (118.06 cm) was recorded from the application of 200 kg ha-1 blended
fertilizer statistically similar magnitude with 150 kg ha-1. The shortest plant height (86.2 cm) was recorded from
50 kg ha-1 blended fertilizer rates (Table 4). In conformity with the result of this study, Sate (2012) reported that
plant height of teff was significantly affected by application of P and N with blended fertilizer. On the other hands,
N and S nutrients have synergistic effects on plant growth and yield attributes resulting in greater translocation of
photosynthesis from source to sink (Channabasamma et al., 2013).
Table 4. Effects of blended fertilizer types and rates on wheat growth parameters conducted at Wondo district of Oromia region, during
2018 cropping season.
Blended Fertilizer types Plant Height (cm) Spike Length (cm)
Control 69.2d 6.14d
NPS 114.35a 7.59c
NPSB 106.42b 9.37a
NPSBZn 98.67c 8.3b
LSD 7.49 0.66
Blended fertilizer rate (kg ha-1)
50 86.2c 7.53b
100 107.57b 8.37a
150 114.08ab 8.6a
200 118.06a 9.18a
LSD 7.74 0.82
T*R NS NS
CV 6.49 7.14
NB: Means in a column followed by the same letters are not significantly different at 5% level of significance.
Spike Length
The results of this study depicted that, spike length was significantly (p≤0.01) affected by the application of
blended fertilizer types and rates, while the interaction effect was non-significant (Table 4). The highest (9.37 cm)
mean spike length was recorded from NPSB blended fertilizer types whereas the lowest (6.14 cm) was from the
control (Table 4). The spike length increment with the blended fertilizer application might be attributed due to
better photo assimilate supply (Berhan, 2012). He also suggested that the higher the length of spike the higher
would be grain produced spike-1 leading to higher yield.
As regards to rates, the highest (9.18cm) spike length was recorded from 200 kg ha-1 that had the same
magnitude with 150 and 100 kg ha-1 blended fertilizer rates. However, the shortest (7.53cm) was recorded from
50 kg ha-1 which was the only significant from the other treatments.
Page 9
Copyright © 2020 IJAIR, All right reserved
334
International Journal of Agriculture Innovations and Research
Volume 8, Issue 4, ISSN (Online) 2319-1473
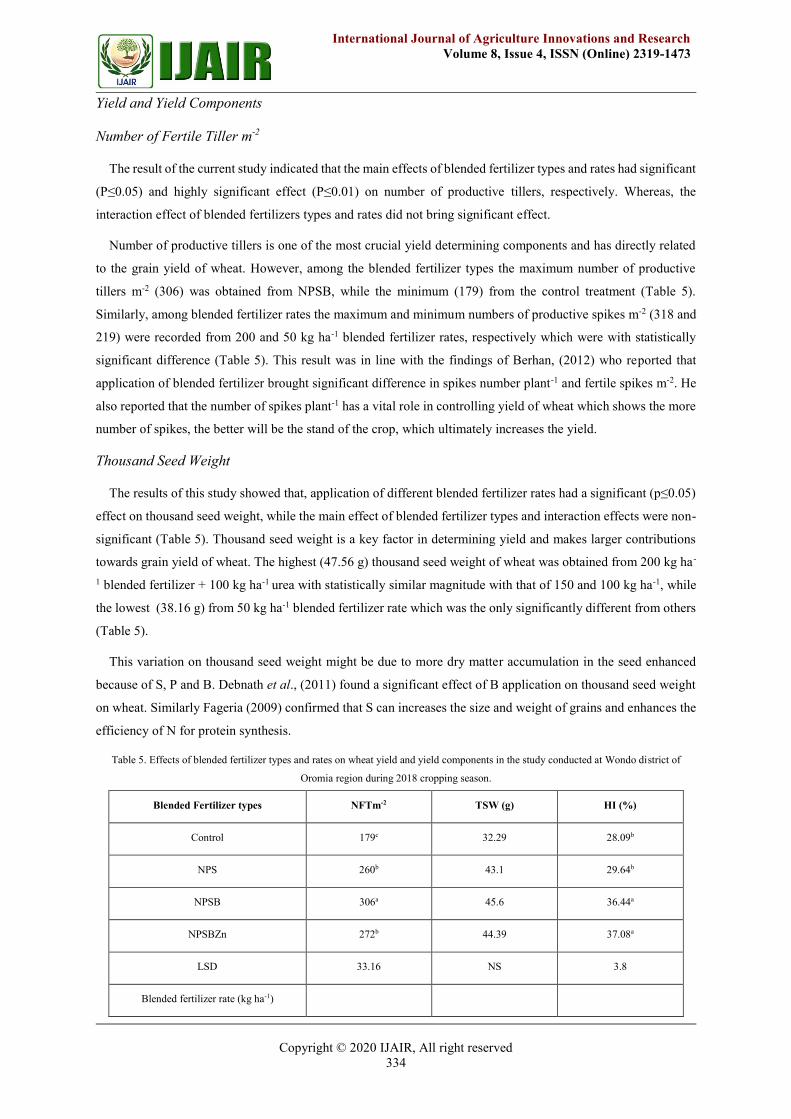
Yield and Yield Components
Number of Fertile Tiller m-2
The result of the current study indicated that the main effects of blended fertilizer types and rates had significant
(P≤0.05) and highly significant effect (P≤0.01) on number of productive tillers, respectively. Whereas, the
interaction effect of blended fertilizers types and rates did not bring significant effect.
Number of productive tillers is one of the most crucial yield determining components and has directly related
to the grain yield of wheat. However, among the blended fertilizer types the maximum number of productive
tillers m-2 (306) was obtained from NPSB, while the minimum (179) from the control treatment (Table 5).
Similarly, among blended fertilizer rates the maximum and minimum numbers of productive spikes m-2 (318 and
219) were recorded from 200 and 50 kg ha-1 blended fertilizer rates, respectively which were with statistically
significant difference (Table 5). This result was in line with the findings of Berhan, (2012) who reported that
application of blended fertilizer brought significant difference in spikes number plant-1 and fertile spikes m-2. He
also reported that the number of spikes plant-1 has a vital role in controlling yield of wheat which shows the more
number of spikes, the better will be the stand of the crop, which ultimately increases the yield.
Thousand Seed Weight
The results of this study showed that, application of different blended fertilizer rates had a significant (p≤0.05)
effect on thousand seed weight, while the main effect of blended fertilizer types and interaction effects were non-
significant (Table 5). Thousand seed weight is a key factor in determining yield and makes larger contributions
towards grain yield of wheat. The highest (47.56 g) thousand seed weight of wheat was obtained from 200 kg ha-
1 blended fertilizer + 100 kg ha-1 urea with statistically similar magnitude with that of 150 and 100 kg ha-1, while
the lowest (38.16 g) from 50 kg ha-1 blended fertilizer rate which was the only significantly different from others
(Table 5).
This variation on thousand seed weight might be due to more dry matter accumulation in the seed enhanced
because of S, P and B. Debnath et al., (2011) found a significant effect of B application on thousand seed weight
on wheat. Similarly Fageria (2009) confirmed that S can increases the size and weight of grains and enhances the
efficiency of N for protein synthesis.
Table 5. Effects of blended fertilizer types and rates on wheat yield and yield components in the study conducted at Wondo district of
Oromia region during 2018 cropping season.
Blended Fertilizer types NFTm-2 TSW (g) HI (%)
Control 179c 32.29 28.09b
NPS 260b 43.1 29.64b
NPSB 306a 45.6 36.44a
NPSBZn 272b 44.39 37.08a
LSD 33.16 NS 3.8
Blended fertilizer rate (kg ha-1)
Page 10
Copyright © 2020 IJAIR, All right reserved
335
International Journal of Agriculture Innovations and Research
Volume 8, Issue 4, ISSN (Online) 2319-1473
50 219c 38.16b 31.67bc
100 271b 44.32a 33.12ab
150 308a 47.4a 35.8ab
200 318a 47.56a 36.96a
LSD 34.25 5.68 3.93
T*R NS NS NS
CV 10.96 11.36 10.07
NFTm-2 = Number of fertile tiller per square meter, TSW = Thousand seed weight, HI= Harvest index.
Harvest Index
The analysis result of the current study showed that application of blended fertilizer types and rates had a
significant (p≤0.01, p≤0.05) effect on wheat harvest index, respectively however, non-significant due to
interaction effect (Table 5). The highest (37.08%) harvest index was recorded from NPSBZn followed by
(36.44%) that was obtained from NPSB blended fertilizer which were statistically similar while the lowest
(28.09%) was obtained from the control treated plot (Table 5). Regarding to blended fertilizer rates, the highest
(36.96%) harvest index was recorded from 200 kg ha-1 blended fertilizer that had the same magnitude with 150
kg ha-1 and the minimum (31.67%) was recorded from 50 kg ha-1 blended fertilizer (Table 5). Tahir et al., (2009)
articulated that a higher transfer of assimilates to the grain would maximize the harvest index and reduce the
proportion of dry matter produced. Similarly this result is supported by the findings of Tagesse et al., (2018), who
reported that harvest index was significantly affected by the interaction of blended NPS and supplemental N rates.
Mengel and Kirkby (1996) also reported that harvest indices of modern wheat cultivars normally range from 35.0
to 40.0% which were almost in consistent with this study that ranges harvest index from 28.09 to 37.08% (Table
5). Comparable reports by Berhan (2012) also showed that treatments received blended fertilizers had high harvest
index compared with the control treatments.
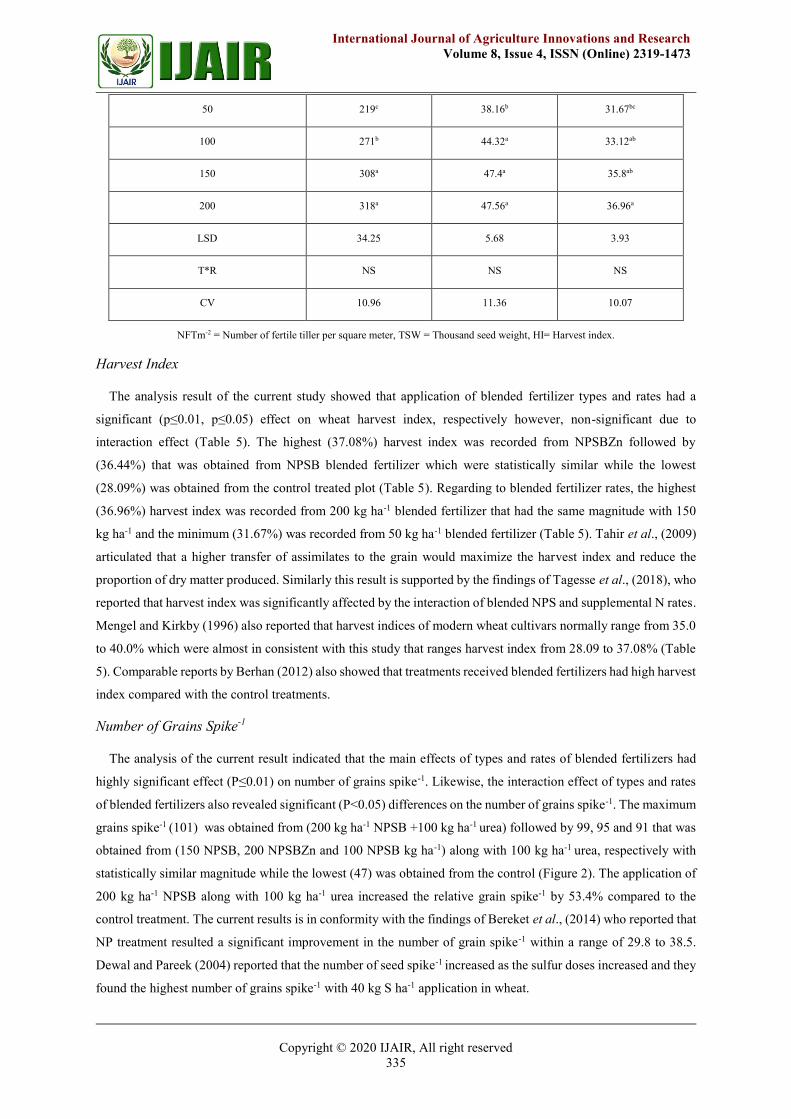
Number of Grains Spike-1
The analysis of the current result indicated that the main effects of types and rates of blended fertilizers had
highly significant effect (P≤0.01) on number of grains spike-1. Likewise, the interaction effect of types and rates
of blended fertilizers also revealed significant (P<0.05) differences on the number of grains spike-1. The maximum
grains spike-1 (101) was obtained from (200 kg ha-1 NPSB +100 kg ha-1 urea) followed by 99, 95 and 91 that was
obtained from (150 NPSB, 200 NPSBZn and 100 NPSB kg ha-1) along with 100 kg ha-1 urea, respectively with
statistically similar magnitude while the lowest (47) was obtained from the control (Figure 2). The application of
200 kg ha-1 NPSB along with 100 kg ha-1 urea increased the relative grain spike-1 by 53.4% compared to the
control treatment. The current results is in conformity with the findings of Bereket et al., (2014) who reported that
NP treatment resulted a significant improvement in the number of grain spike-1 within a range of 29.8 to 38.5.
Dewal and Pareek (2004) reported that the number of seed spike-1 increased as the sulfur doses increased and they
found the highest number of grains spike-1 with 40 kg S ha-1 application in wheat.
Page 11
Copyright © 2020 IJAIR, All right reserved
336
International Journal of Agriculture Innovations and Research
Volume 8, Issue 4, ISSN (Online) 2319-1473
Fig. 2. Interaction effect of blended fertilizer types and rates on Grain per Spike of wheat.
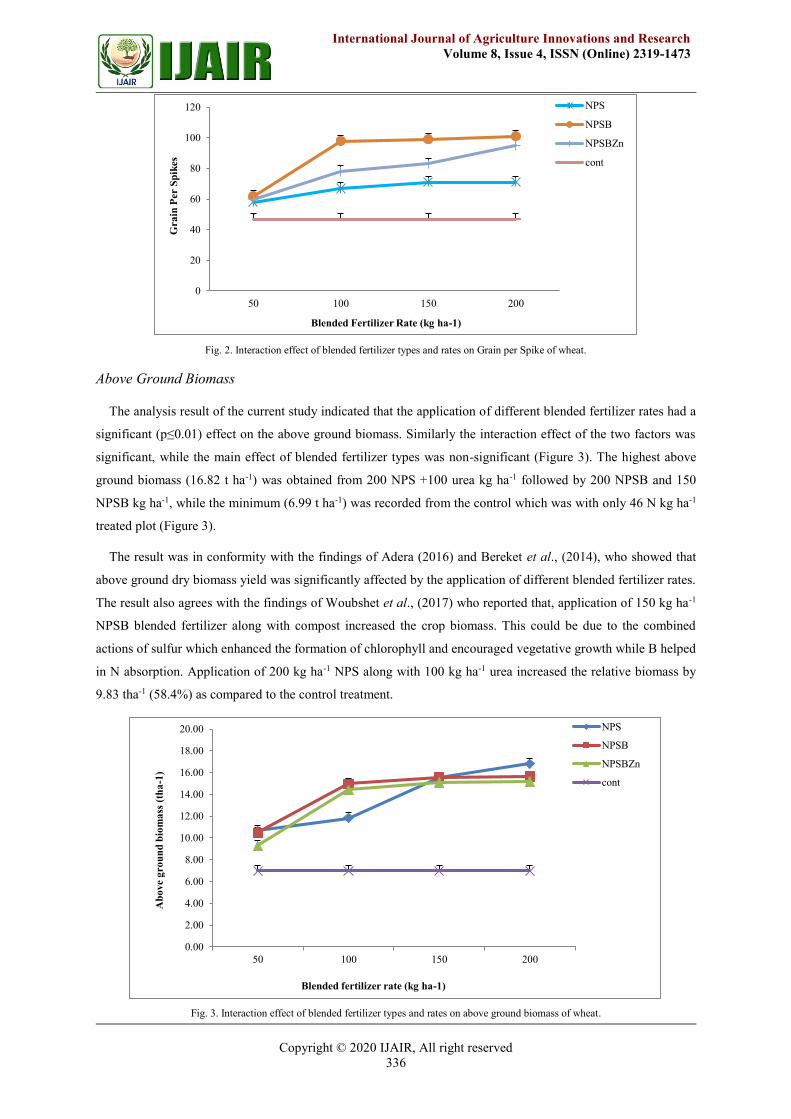
Above Ground Biomass
The analysis result of the current study indicated that the application of different blended fertilizer rates had a
significant (p≤0.01) effect on the above ground biomass. Similarly the interaction effect of the two factors was
significant, while the main effect of blended fertilizer types was non-significant (Figure 3). The highest above
ground biomass (16.82 t ha-1) was obtained from 200 NPS +100 urea kg ha-1 followed by 200 NPSB and 150
NPSB kg ha-1, while the minimum (6.99 t ha-1) was recorded from the control which was with only 46 N kg ha-1
treated plot (Figure 3).
The result was in conformity with the findings of Adera (2016) and Bereket et al., (2014), who showed that
above ground dry biomass yield was significantly affected by the application of different blended fertilizer rates.
The result also agrees with the findings of Woubshet et al., (2017) who reported that, application of 150 kg ha-1
NPSB blended fertilizer along with compost increased the crop biomass. This could be due to the combined
actions of sulfur which enhanced the formation of chlorophyll and encouraged vegetative growth while B helped
in N absorption. Application of 200 kg ha-1 NPS along with 100 kg ha-1 urea increased the relative biomass by
9.83 tha-1 (58.4%) as compared to the control treatment.
Fig. 3. Interaction effect of blended fertilizer types and rates on above ground biomass of wheat.
0
20
40
60
80
100
120
50 100 150 200
Gra
in P
er S
pik
es
Blended Fertilizer Rate (kg ha-1)
NPS
NPSB
NPSBZn
cont
0.00
2.00
4.00
6.00
8.00
10.00
12.00
14.00
16.00
18.00
20.00
50 100 150 200
Ab
ove g
ro
un
d b
iom
ass
(th
a-1
)
Blended fertilizer rate (kg ha-1)
NPS
NPSB
NPSBZn
cont
Page 12
Copyright © 2020 IJAIR, All right reserved
337
International Journal of Agriculture Innovations and Research
Volume 8, Issue 4, ISSN (Online) 2319-1473
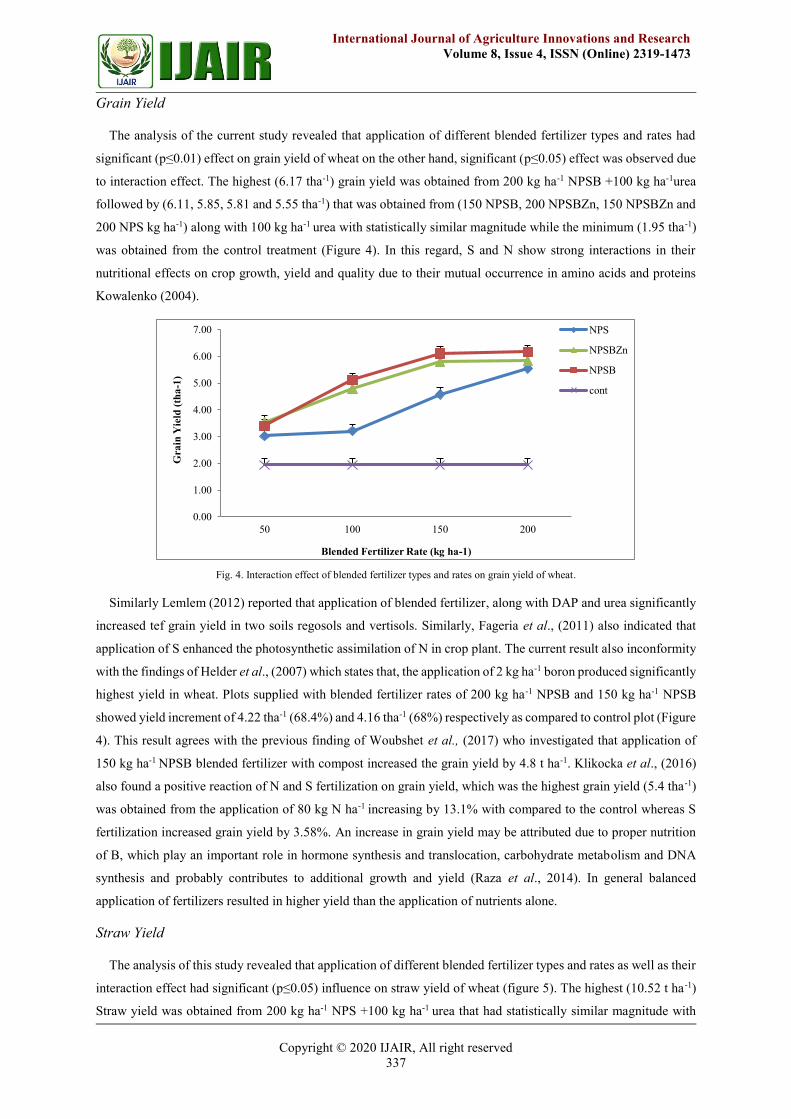
Grain Yield
The analysis of the current study revealed that application of different blended fertilizer types and rates had
significant (p≤0.01) effect on grain yield of wheat on the other hand, significant (p≤0.05) effect was observed due
to interaction effect. The highest (6.17 tha-1) grain yield was obtained from 200 kg ha-1 NPSB +100 kg ha-1urea
followed by (6.11, 5.85, 5.81 and 5.55 tha-1) that was obtained from (150 NPSB, 200 NPSBZn, 150 NPSBZn and
200 NPS kg ha-1) along with 100 kg ha-1 urea with statistically similar magnitude while the minimum (1.95 tha-1)
was obtained from the control treatment (Figure 4). In this regard, S and N show strong interactions in their
nutritional effects on crop growth, yield and quality due to their mutual occurrence in amino acids and proteins
Kowalenko (2004).
Fig. 4. Interaction effect of blended fertilizer types and rates on grain yield of wheat.
Similarly Lemlem (2012) reported that application of blended fertilizer, along with DAP and urea significantly
increased tef grain yield in two soils regosols and vertisols. Similarly, Fageria et al., (2011) also indicated that
application of S enhanced the photosynthetic assimilation of N in crop plant. The current result also inconformity
with the findings of Helder et al., (2007) which states that, the application of 2 kg ha-1 boron produced significantly
highest yield in wheat. Plots supplied with blended fertilizer rates of 200 kg ha-1 NPSB and 150 kg ha-1 NPSB
showed yield increment of 4.22 tha-1 (68.4%) and 4.16 tha-1 (68%) respectively as compared to control plot (Figure
4). This result agrees with the previous finding of Woubshet et al., (2017) who investigated that application of
150 kg ha-1 NPSB blended fertilizer with compost increased the grain yield by 4.8 t ha-1. Klikocka et al., (2016)
also found a positive reaction of N and S fertilization on grain yield, which was the highest grain yield (5.4 tha-1)
was obtained from the application of 80 kg N ha-1 increasing by 13.1% with compared to the control whereas S
fertilization increased grain yield by 3.58%. An increase in grain yield may be attributed due to proper nutrition
of B, which play an important role in hormone synthesis and translocation, carbohydrate metabolism and DNA
synthesis and probably contributes to additional growth and yield (Raza et al., 2014). In general balanced
application of fertilizers resulted in higher yield than the application of nutrients alone.
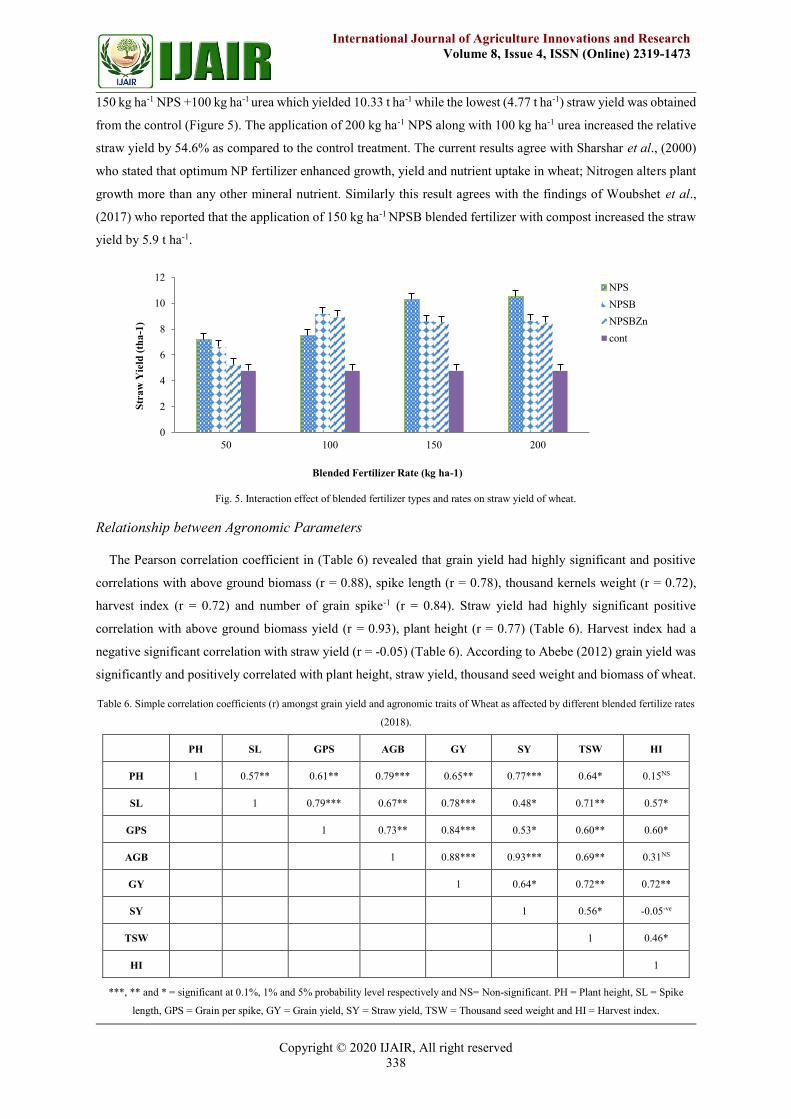
Straw Yield
The analysis of this study revealed that application of different blended fertilizer types and rates as well as their
interaction effect had significant (p≤0.05) influence on straw yield of wheat (figure 5). The highest (10.52 t ha-1)
Straw yield was obtained from 200 kg ha-1 NPS +100 kg ha-1 urea that had statistically similar magnitude with
0.00
1.00
2.00
3.00
4.00
5.00
6.00
7.00
50 100 150 200
Gra
in Y
ield
(th
a-1
)
Blended Fertilizer Rate (kg ha-1)
NPS
NPSBZn
NPSB
cont
Page 13
Copyright © 2020 IJAIR, All right reserved
338
International Journal of Agriculture Innovations and Research
Volume 8, Issue 4, ISSN (Online) 2319-1473
150 kg ha-1 NPS +100 kg ha-1 urea which yielded 10.33 t ha-1 while the lowest (4.77 t ha-1) straw yield was obtained
from the control (Figure 5). The application of 200 kg ha-1 NPS along with 100 kg ha-1 urea increased the relative
straw yield by 54.6% as compared to the control treatment. The current results agree with Sharshar et al., (2000)
who stated that optimum NP fertilizer enhanced growth, yield and nutrient uptake in wheat; Nitrogen alters plant
growth more than any other mineral nutrient. Similarly this result agrees with the findings of Woubshet et al.,
(2017) who reported that the application of 150 kg ha-1 NPSB blended fertilizer with compost increased the straw
yield by 5.9 t ha-1.
Fig. 5. Interaction effect of blended fertilizer types and rates on straw yield of wheat.
Relationship between Agronomic Parameters
The Pearson correlation coefficient in (Table 6) revealed that grain yield had highly significant and positive
correlations with above ground biomass (r = 0.88), spike length (r = 0.78), thousand kernels weight (r = 0.72),
harvest index (r = 0.72) and number of grain spike-1 (r = 0.84). Straw yield had highly significant positive
correlation with above ground biomass yield (r = 0.93), plant height (r = 0.77) (Table 6). Harvest index had a
negative significant correlation with straw yield (r = -0.05) (Table 6). According to Abebe (2012) grain yield was
significantly and positively correlated with plant height, straw yield, thousand seed weight and biomass of wheat.
Table 6. Simple correlation coefficients (r) amongst grain yield and agronomic traits of Wheat as affected by different blended fertilize rates
(2018).
PH SL GPS AGB GY SY TSW HI
PH 1 0.57** 0.61** 0.79*** 0.65** 0.77*** 0.64* 0.15NS
SL 1 0.79*** 0.67** 0.78*** 0.48* 0.71** 0.57*
GPS 1 0.73** 0.84*** 0.53* 0.60** 0.60*
AGB 1 0.88*** 0.93*** 0.69** 0.31NS
GY 1 0.64* 0.72** 0.72**
SY 1 0.56* -0.05-ve
TSW 1 0.46*
HI 1
***, ** and * = significant at 0.1%, 1% and 5% probability level respectively and NS= Non-significant. PH = Plant height, SL = Spike
length, GPS = Grain per spike, GY = Grain yield, SY = Straw yield, TSW = Thousand seed weight and HI = Harvest index.
0
2
4
6
8
10
12
50 100 150 200
Str
aw
Yie
ld (
tha
-1)
Blended Fertilizer Rate (kg ha-1)
NPS
NPSB
NPSBZn
cont
Page 14
Copyright © 2020 IJAIR, All right reserved
339
International Journal of Agriculture Innovations and Research
Volume 8, Issue 4, ISSN (Online) 2319-1473
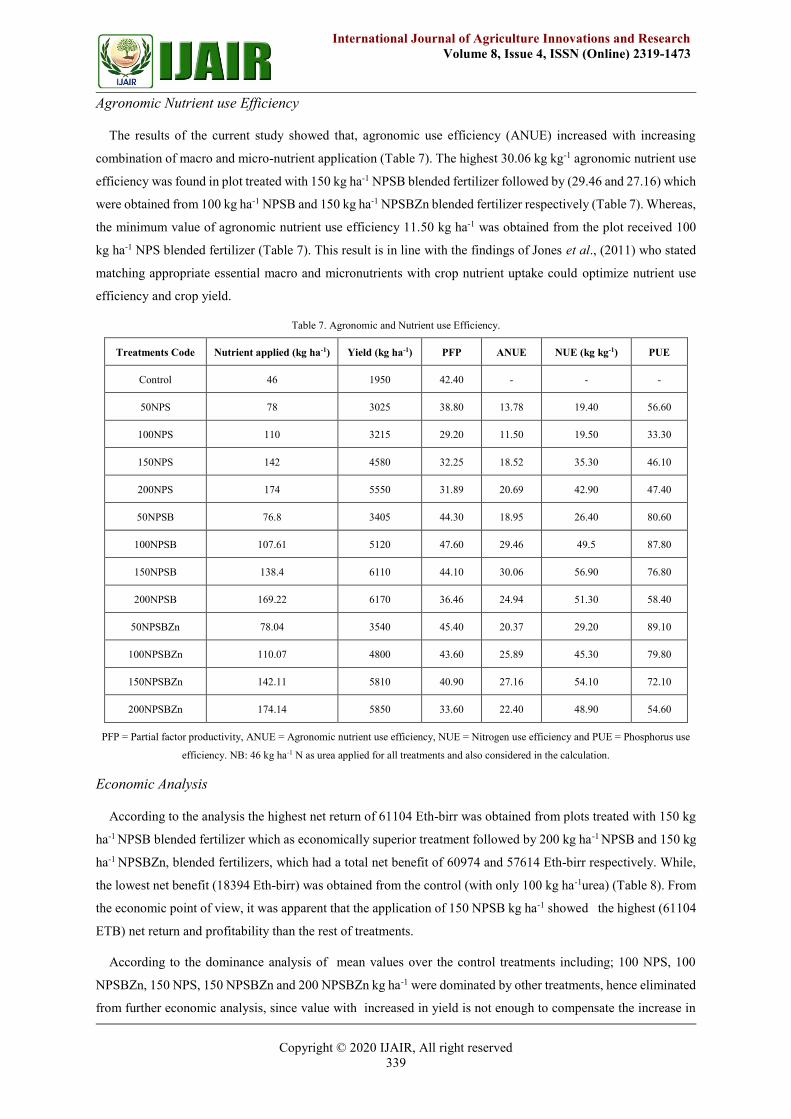
Agronomic Nutrient use Efficiency
The results of the current study showed that, agronomic use efficiency (ANUE) increased with increasing
combination of macro and micro-nutrient application (Table 7). The highest 30.06 kg kg-1 agronomic nutrient use
efficiency was found in plot treated with 150 kg ha-1 NPSB blended fertilizer followed by (29.46 and 27.16) which
were obtained from 100 kg ha-1 NPSB and 150 kg ha-1 NPSBZn blended fertilizer respectively (Table 7). Whereas,
the minimum value of agronomic nutrient use efficiency 11.50 kg ha-1 was obtained from the plot received 100
kg ha-1 NPS blended fertilizer (Table 7). This result is in line with the findings of Jones et al., (2011) who stated
matching appropriate essential macro and micronutrients with crop nutrient uptake could optimize nutrient use
efficiency and crop yield.
Table 7. Agronomic and Nutrient use Efficiency.
Treatments Code Nutrient applied (kg ha-1) Yield (kg ha-1) PFP ANUE NUE (kg kg-1) PUE
Control 46 1950 42.40 - - -
50NPS 78 3025 38.80 13.78 19.40 56.60
100NPS 110 3215 29.20 11.50 19.50 33.30
150NPS 142 4580 32.25 18.52 35.30 46.10
200NPS 174 5550 31.89 20.69 42.90 47.40
50NPSB 76.8 3405 44.30 18.95 26.40 80.60
100NPSB 107.61 5120 47.60 29.46 49.5 87.80
150NPSB 138.4 6110 44.10 30.06 56.90 76.80
200NPSB 169.22 6170 36.46 24.94 51.30 58.40
50NPSBZn 78.04 3540 45.40 20.37 29.20 89.10
100NPSBZn 110.07 4800 43.60 25.89 45.30 79.80
150NPSBZn 142.11 5810 40.90 27.16 54.10 72.10
200NPSBZn 174.14 5850 33.60 22.40 48.90 54.60
PFP = Partial factor productivity, ANUE = Agronomic nutrient use efficiency, NUE = Nitrogen use efficiency and PUE = Phosphorus use
efficiency. NB: 46 kg ha-1 N as urea applied for all treatments and also considered in the calculation.
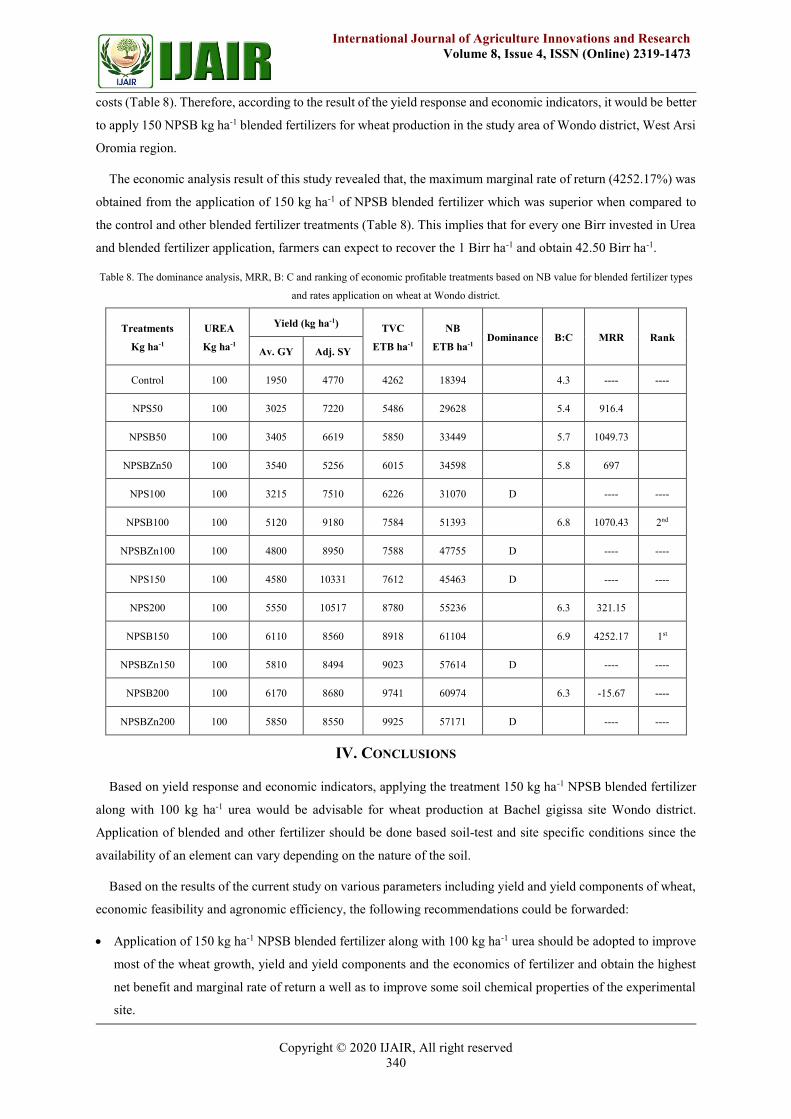
Economic Analysis
According to the analysis the highest net return of 61104 Eth-birr was obtained from plots treated with 150 kg
ha-1 NPSB blended fertilizer which as economically superior treatment followed by 200 kg ha-1 NPSB and 150 kg
ha-1 NPSBZn, blended fertilizers, which had a total net benefit of 60974 and 57614 Eth-birr respectively. While,
the lowest net benefit (18394 Eth-birr) was obtained from the control (with only 100 kg ha-1urea) (Table 8). From
the economic point of view, it was apparent that the application of 150 NPSB kg ha-1 showed the highest (61104
ETB) net return and profitability than the rest of treatments.
According to the dominance analysis of mean values over the control treatments including; 100 NPS, 100
NPSBZn, 150 NPS, 150 NPSBZn and 200 NPSBZn kg ha-1 were dominated by other treatments, hence eliminated
from further economic analysis, since value with increased in yield is not enough to compensate the increase in
Page 15
Copyright © 2020 IJAIR, All right reserved
340
International Journal of Agriculture Innovations and Research
Volume 8, Issue 4, ISSN (Online) 2319-1473
costs (Table 8). Therefore, according to the result of the yield response and economic indicators, it would be better
to apply 150 NPSB kg ha-1 blended fertilizers for wheat production in the study area of Wondo district, West Arsi
Oromia region.
The economic analysis result of this study revealed that, the maximum marginal rate of return (4252.17%) was
obtained from the application of 150 kg ha-1 of NPSB blended fertilizer which was superior when compared to
the control and other blended fertilizer treatments (Table 8). This implies that for every one Birr invested in Urea
and blended fertilizer application, farmers can expect to recover the 1 Birr ha-1 and obtain 42.50 Birr ha-1.
Table 8. The dominance analysis, MRR, B: C and ranking of economic profitable treatments based on NB value for blended fertilizer types
and rates application on wheat at Wondo district.
Treatments
Kg ha-1
UREA
Kg ha-1
Yield (kg ha-1) TVC
ETB ha-1
NB
ETB ha-1 Dominance B:C MRR Rank
Av. GY Adj. SY
Control 100 1950 4770 4262 18394 4.3 ---- ----
NPS50 100 3025 7220 5486 29628 5.4 916.4
NPSB50 100 3405 6619 5850 33449 5.7 1049.73
NPSBZn50 100 3540 5256 6015 34598 5.8 697
NPS100 100 3215 7510 6226 31070 D ---- ----
NPSB100 100 5120 9180 7584 51393 6.8 1070.43 2nd
NPSBZn100 100 4800 8950 7588 47755 D ---- ----
NPS150 100 4580 10331 7612 45463 D ---- ----
NPS200 100 5550 10517 8780 55236 6.3 321.15
NPSB150 100 6110 8560 8918 61104 6.9 4252.17 1st
NPSBZn150 100 5810 8494 9023 57614 D ---- ----
NPSB200 100 6170 8680 9741 60974 6.3 -15.67 ----
NPSBZn200 100 5850 8550 9925 57171 D ---- ----
IV. CONCLUSIONS
Based on yield response and economic indicators, applying the treatment 150 kg ha-1 NPSB blended fertilizer
along with 100 kg ha-1 urea would be advisable for wheat production at Bachel gigissa site Wondo district.
Application of blended and other fertilizer should be done based soil-test and site specific conditions since the
availability of an element can vary depending on the nature of the soil.
Based on the results of the current study on various parameters including yield and yield components of wheat,
economic feasibility and agronomic efficiency, the following recommendations could be forwarded:
Application of 150 kg ha-1 NPSB blended fertilizer along with 100 kg ha-1 urea should be adopted to improve
most of the wheat growth, yield and yield components and the economics of fertilizer and obtain the highest
net benefit and marginal rate of return a well as to improve some soil chemical properties of the experimental
site.
Page 16
Copyright © 2020 IJAIR, All right reserved
341
International Journal of Agriculture Innovations and Research
Volume 8, Issue 4, ISSN (Online) 2319-1473
Therefore, it is advisable to farmers to use the treatment (150 NPSB + 100 urea) kg ha-1 which contains NPSB
proportion of (N = 73.15, P2O5 = 54.15, S = 10.05, B = 1.065) kg ha-1 with highest yield, high marginal rate of
return, high net benefit and relatively small total cost of production for wheat in the study area. Furthermore, based
on yield, net benefit and relatively low total cost of production the farmers of Wondo area also can use 100 kg ha-
1 NPSB + 100 kg ha-1 urea.
Furthermore, emphasis and consideration required to the issue in the future research study,
Since the experiment was conducted only for one growing season at one site, repeating the trial at different
location as well as in the same trial site should be important in order to draw sound recommendation.
REFERENCE
[1] Abebe Getu. 2012. Soil characterization and evaluation of slow release urea fertilizer rates on yield components and grain yields of
wheat and teff on Vertisols of jamma district of south wollo zone, amhara region. MSc Thesis, Haramaya University, Haramaya,
Ethiopia. [2] Adera sisay. 2016. Response of Tef [(Eragrostis tef (zucc.) Trotter] to different blended fertilizer rates on vertisols in Jama district, North
eastern Ethiopia. MSc. Thesis, Haramaya university, Haramaya, Ethiopia.
[3] Bakala Anbessa, 2018. Soil characterization and response of maize (Zeamays L.) to application of blended fertilizer types and rates in Asossa district, Western Ethiopia. MSc. Thesis, Hawassa University, Hawassa, Ethiopia.
[4] Bereket H, Dawit H, Mehretab H, Gebremedhin G. 2014. Effects of mineral nitrogen and phosphorus fertilizer on yield and nutrient
utilization of Bread wheat (Triticum aestivum L.) on the sandy soils of Hawzen district, Northern Ethiopia, Agriculture, Forestry and Fisheries, Vol.3 (3); pp. 189-198.
[5] Berhan Abayu. 2012. Agronomic and economic effects of blended fertilizers under planting method on yield and yield components of
Tef: MSc Thesis, Mekelle University, Mekelle, Ethiopia. [6] Bouyoucos, G.J. 1962. Hydrometer method improved for making particle size analysis of soils. Agronomy Journal, 54: 464-465.
[7] Brady, N.C. and R.R. Weil, 2008. The Nature and Properties of Soils. 13th $ 14th Edition. Prentice-Hall. Per Saddle River, New Jersey;
USA.
[8] Channabasamma, A., Habsur, N.S., Bangaremma, S.W and Akshaya, M.C. 2013. Effect of nitrogen and sulfur levels and ratios on
growth and yield of maize. Molecular Plant Breeding. : Vol. 4, No. 37, pp 292-296.
[9] Chopra, S.H. and J.S. Kanwar (1976). Analytical agricultural chemistry. New Delhi: Kalyani publisher Ludhiana. 518 p. [10] CIMMYT, 1988. From Agronomic data to farmers recommendation: economic training manual completely revised edition. CIMMYT,
Mexico, D.F. 79-82p.
[11] CSA (Central statistical agency) 2015 $ 2017. Agricultural sample survey 2015/2017. Vol. II, III. Report on farm management practices (private peasant holdings, meher season). Statistical Bulletin 532, Central Statistical Agency. Addis Ababa, Ethiopia.
[12] Daryl. 2004. Soil test interpretations and recommendation hand book. University of Missouri-College of Agriculture Division of Plant
Science Revised 5/2004. [13] Debnath, M.R., Jahiruddin M., Rahman, M.M. and Haque, M.A. 2011. Determining optimum rate of boron application for higher yield
of wheat in Old Brahmaputra Floodplain soil. /J. Bangladesh Agril. Univ. 9(2): 205–210/.
[14] Demeke. M. and F. Di Marcantonio. 2013. Analysis of incentives and disincentives for wheat in Ethiopia. Technical notes series, MAFAP, FAO, Rome.
[15] Dewal, G.S., and Pareek, R.G. 2004. Effect of S, P and Zn on growth, yield nutrient uptake of wheat (Triticum aestivum L.) Indian J.
Agronomy. 49: pp. 160-162. [16] EthioSIS (Ethiopian Soil Information System), 2013; 2014; 2015 $ 2016. Soil analysis report. Agricultural Transformation Agency
(Unpublished) [17] Fageria, N. K. 2009. The use of nutrient in crop plants. CRC Press, New York, USA.
[18] Fageria, N.K., V.C., Baligar, and R.B., Clark, 2006; 2011. Physiology of crop production. New York: the Hawarth press.
[19] FAO (Food and Agriculture Organization of the United Nations). 2015a FAO production year book 56. FAO Statistics Series, no 17.Rome.fertilization. Pakistan J. Agri. Res., 12: 130-302.
[20] Gerwing J. and Gelderman R. 2005. Fertilizer recommendation guide south Dakota September 2005 EC 750 Cooperative Extension
Service/ South Dakota State University/ USDA. [21] Haileselassie A, Priess JA, Veldkamp E, Teketay D, Lesschen JP. 2005. Assessment of soil nutrient depletion and its spatial variability
on smallholders’ mixed farming systems in Ethiopia using partial versus full nutrient balances. Agric Ecosyst Environ; 108: 1–16.
[22] Hailu Gebre-Mariam. 1991. Wheat production and research in Ethiopia. In: Hailu Gebre-Mariam, D.G. Tanner, and M. Hulluka (eds.). Wheat Research in Ethiopia: A Historical Perspective. Addis Ababa: IAR/CIMMYT.
[23] Hazelton, P., and B. Murphy, 2007. Interpreting soil test results: What do all the numbers mean 2nd edition. CSIRO Publishing. 150-
152p. [24] Helder N.K., Hussein M.A., Saddiky M.A., Nasreen N. and Ullah M.H. 2007. The response of wheat varieties to boron application in
calcareous brown floodplain soil at Southern regions of Bangladesh, J. Agric. 6: 21-24.
[25] Hussain Z. and M. H. Leitch. 2007. The effect of sulfur and growth regulators on growth characteristics and grain yield of spring sown wheat. J. plant nut. 30: pp. 67-77.
[26] Jones, C., Olson, R and Dinkins, C. 2011. Nutrient uptake timing by crops; to assist with fertilizing decisions, Montans State University,
pp. 2-8.
[27] Jones, J.B., 2003. Agronomic hand book: management of crops, Soils, and their fertility. CRC press LLC, Boca Raton, FL., USA. 482p.
[28] Klikocka, H., Cybulska M., Barczak B., Narolski B., Szostak B., Koblalka A., Nowak A., and Wojcik E. 2016. The effect of S and N
fertilization on grain yield and technological quality of spring wheat plant soil Environ. [29] Kowalenko, C.G. 2004. Variation in within-season nitrogen and sulfur interaction effects on forage grass response to combinations of
nitrogen, sulfur and boron application. Commun. Soil Sci. Plant Anal. 35, pp. 759-780.
[30] Lemlem Hiwot, 2012. Evaluating the effect of low seeding rate, planting method and blended fertilizer application of Eragrostis tef (kun-
Page 17
Copyright © 2020 IJAIR, All right reserved
342
International Journal of Agriculture Innovations and Research
Volume 8, Issue 4, ISSN (Online) 2319-1473
-cho variety) yield, yield components and nutrient uptake by grain grown on Regosols and Vertisols. MSc Thesis, Mekelle University,
Mekelle, Ethiopia. [31] Marcel Dekker, Rattan Lal Maoj K Shukla Inc. 2004. Principles of soil physics. The Ohio state University Columbus Ohio U.S.A. Book
p. 712-716.
[32] Mekonnen Asrat, 2005. Response and uptake of barley to different rates of P and N fertilizer, MSc. Thesis, Alemaya University, Alemaya, Ethiopia.
[33] Mengel, K. and E.A. Kirkby, 1996. Principles of plant nutrition. Panima Publishing Corporation. New Delhi, India.
[34] MoARD, 2008. National Fertilizer Strategy and Action Plan of Ethiopia. Addis Ababa, Ethiopia. [35] Olsen S. R., C.W. Cole, F.S. Watanabe, and L.A. Dean, 1954. Estimation of available phosphorus in soils by extraction with sodium
bicarbonate circular, USDA.
[36] Ranist, V.E, M. Verloo, A. Demeyerand J.M. Pauwels (1999). Manual for soil chemistry and fertility laboratory.pp. 50-100. [37] Rashid A, Khan UK., Khan DJ. 2007. Comparative Effect of Varieties and Fertilizer Levels on Barley (Hordeum vulgare L.). ISSN
Online: 1814–9596, Pakistan.
[38] Raza, S.A., Ali S., Chahill Z.S. and Iqbal R.M. 2014. The response of foliar application of boron on bread wheat crop in calcareous soil of Pakistan. Acad. J. Agric. Res. 2 : 106-109.
[39] Sahlemedhin S. and Taye B. 2000. Procedures for soil and plant analysis. National Soil Research center Tech. Paper, 74110 p. NFIA,
Addis Ababa, Ethiopia. [40] Salam, P, K. 2004. Ann, Agric. Res. New Series. 25(2): 329-332.
[41] SAS (Statistical Analysis System). 2002. SAS Version 9.1.4. SAS Institute Inc., Cary, NC, USA.
[42] Sate Sahle, 2012. Effect of inorganic fertilizer types and sowing methods of different seed rates on yield and yield components of tef in Boreda district, southern Ethiopia. MSc, Thesis; Haramaya University, Haramaya, Ethiopia.
[43] Sharshar, M.S. and A. Soad El-Said. 2000. Evaluation of some wheat cultivars and lines under low and high inputs. J.Agri. Sci. Mansoura
Univ. 25(6): pp 3109-3127. [44] Tagesse Abera, Ketema Belete and Tamado Tana. 2018. Effect of blended NPS fertilizer supplemented with Nitrogen on Yield
components and yield of Bread Wheat (Triticum aestivum L.) Journal of Natural Science Research 8: 2224-3186.
[45] Tahir, M., Tanveer A, Shah T, Fiaz N, and Wasaya A, 2009. Yield response of wheat (Triticum aestivum L.) to boron application at different growth stages. Pak. J. Life Soc. Sci. 7: 39-42.
[46] Tekalign Tadesse. 1991. Soil, Plant, Water, fertilizer, animal manure compost analysis. Working document No. 13. International Livestock Research center for Africa, Addis Ababa.
[47] Thiangalingam, K. (2000). Soil and plant sample collection, preparation and interpretation of chemical analysis. A training manual and
guide. Australian contribution to a National agricultural research system in Papua New Guinea, Adelaide, Australia. 49pp. [48] Woinshet Tariku, 2007. Effect of nitrogen fertilizer levels on grain yield and malty quality of yields on farmers field and on-station in
Bale region of Ethiopia. pp. 510-516.
[49] Wondo District Agricultural office (2018). Agricultural Sector Annual report 2017/2018 (2010 E.C.) Report on Area and Production of Major Crops Wondo District, Southern Ethiopia (Unpublished).
[50] Woubshet, D., Selamyihun K., and Cherukuri V, 2017. Effect of integrated use of lime, blended fertilizer and compost on productivity,
nutrient removal and economics of barley (Hordeum Vulgare L) on acid soils of high lands in west Shoa zone of Ethiopia. Int. J. of life Sci. 2017, Vol. 5 (3) 311-322.
AUTHOR’S PROFILE
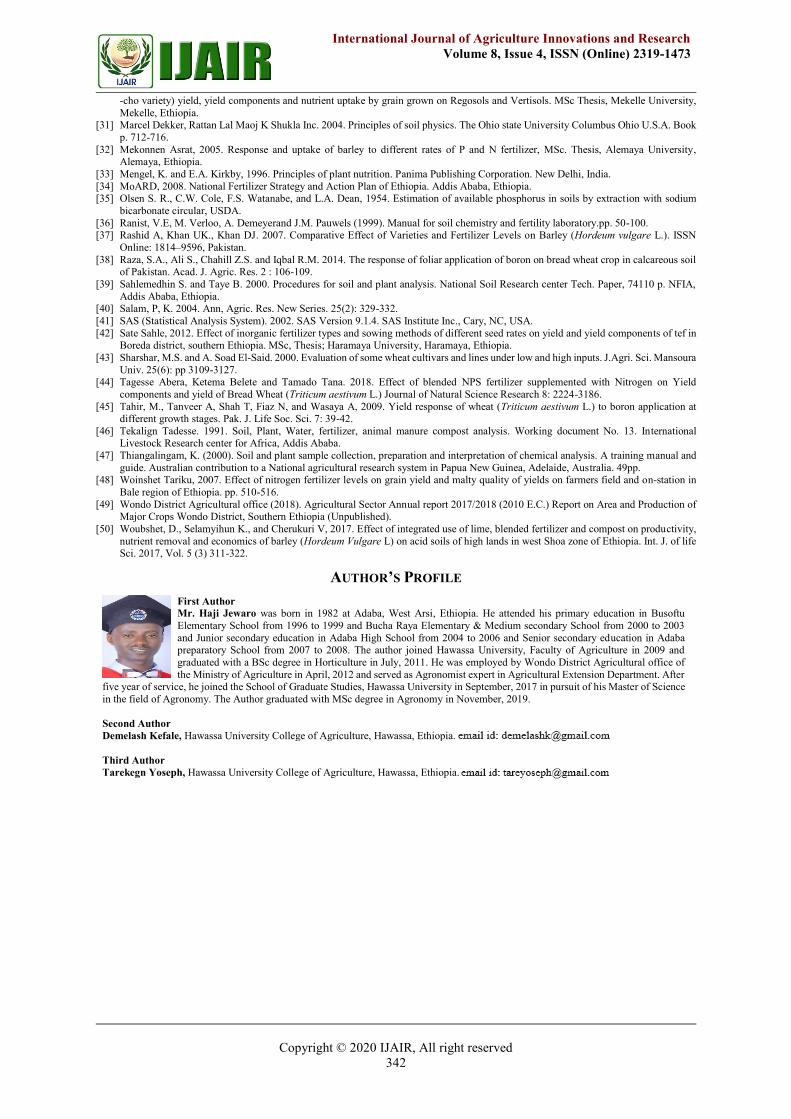
First Author
Mr. Haji Jewaro was born in 1982 at Adaba, West Arsi, Ethiopia. He attended his primary education in Busoftu
Elementary School from 1996 to 1999 and Bucha Raya Elementary & Medium secondary School from 2000 to 2003
and Junior secondary education in Adaba High School from 2004 to 2006 and Senior secondary education in Adaba preparatory School from 2007 to 2008. The author joined Hawassa University, Faculty of Agriculture in 2009 and
graduated with a BSc degree in Horticulture in July, 2011. He was employed by Wondo District Agricultural office of
the Ministry of Agriculture in April, 2012 and served as Agronomist expert in Agricultural Extension Department. After five year of service, he joined the School of Graduate Studies, Hawassa University in September, 2017 in pursuit of his Master of Science
in the field of Agronomy. The Author graduated with MSc degree in Agronomy in November, 2019.
Second Author
Demelash Kefale, Hawassa University College of Agriculture, Hawassa, Ethiopia.
Third Author
Tarekegn Yoseph, Hawassa University College of Agriculture, Hawassa, Ethiopia.