Page 1
EFFECT OF CERIUM OXIDE ON HYDROGEN PRODUCTION FROM METHANOL USING COPPER-ALUMINA AND COPPER-ZINC OXIDE-ALUMINA CATALYST PREPARED BY
FLAME SPRAY PYROLYSIS
By Miss Pawinee Eamprapai
A Thesis Submitted in Partial Fulfillment of the Requirements for the Degree Master of Engineering Program in Chemical Engineering
Department of Chemical Engineering Graduate School, Silpakorn University
Academic Year 2013 Copyright of Graduate School, Silpakorn University
สำนกัหอ
สมุดกลาง
Page 2
EFFECT OF CERIUM OXIDE ON HYDROGEN PRODUCTION FROM METHANOL USING COPPER-ALUMINA AND COPPER-ZINC OXIDE-ALUMINA CATALYST PREPARED BY
FLAME SPRAY PYROLYSIS
By Miss Pawinee Eamprapai
A Thesis Submitted in Partial Fulfillment of the Requirements for the Degree Master of Engineering Program in Chemical Engineering
Department of Chemical Engineering Graduate School, Silpakorn University
Academic Year 2013 Copyright of Graduate School, Silpakorn University
สำนกัหอ
สมุดกลาง
Page 3
ผลของซีเรียมออกไซด์ทมีีต่อปฏิกริิยาการผลติไฮโดรเจนจากเมทานอลโดยใช้ตัวเร่งปฏิกริิยาคอปเปอร์บนอลูมินาและคอปเปอร์-ซิงค์ออกไซด์บนอลูมินาซึงเตรียมโดยวธีิเฟรมสเปรย์
โดย นางสาวภาวนีิ เอยีมประไพ
วทิยานิพนธ์นีเป็นส่วนหนึงของการศึกษาตามหลกัสูตรปริญญาวศิวกรรมศาสตรมหาบัณฑิต สาขาวชิาวศิวกรรมเคมี ภาควชิาวศิวกรรมเคมี
บัณฑิตวทิยาลยั มหาวิทยาลัยศิลปากร ปีการศึกษา 2556
ลขิสิทธิของบัณฑิตวิทยาลยั มหาวทิยาลัยศิลปากร
สำนกัหอ
สมุดกลาง
Page 4
The Graduate School, Silpakorn University has approved and accredited the Thesis title of "Effect of cerium oxide on hydrogen production from methanol using copper-alumina and copper-zinc oxide-alumina catalyst prepared by flame spray pyrolysis" submitted by Miss Pawinee Eamprapai as a partial fulfillment of the requirements for the degree of Master of Engineering in Chemical Engineering
.........................................................................
(Associate Professor Panjai Tantatsanawong, Ph.D.) Dean of Graduate School ............./.............../.............
The Thesis Advisor Assistant Professor Choowong Chaisuk, D.Eng.
The Thesis Examination Committee
...................................................Chairman (Tarawipa Puangpetch, Ph.D.) ............./.............../.............
...................................................Member (Associate Professor Joongjai Panpranot, Ph.D.) ............./.............../.............
...................................................Member (Assistant Professor Okorn Mekasuwandumrong, D.Eng.) ............./.............../.............
...................................................Member (Assistant Professor Choowong Chaisuk, D.Eng.) ............./.............../............
สำนกัหอ
สมุดกลาง
Page 5
d
54404207 : MAJOR : CHEMICAL ENGINEERING KEY WORDS : FLAME SPRAY PYROLYSIS/ COPPER/ CERIUM/ ALUMINA/ METHANOL STEAM REFORMING
PAWINEE EAMPRAPAI : EFFECT OF CERIUM OXIDE ON HYDROGEN PRODUCTION FROM METHANOL USING COPPER-ALUMINA AND COPPER-ZINC OXIDE-ALUMINA CATALYST PREPARED BY FLAME SPRAY PYROLYSIS. THESIS ADVISOR : ASST. PROF. CHOOWONG CHAISUK, D.ENG. 93 pp.
The performance of Cu-Al2O3 and Cu-ZnO-Al2O3 catalysts with various CeO2 loading was investigated using the methanol steam reforming (MSR) at 200-350 ºC. All the catalysts were prepared by flame spray pyrolysis (FSP) method and characterized by XRD and TPR. The 20Cu-3CeO2-Al2O3 showed the highest methanol conversion and promoted hydrogen production rate. At CeO2 loading as 10 wt%, the behavior of MSR reaction could be changed which methanol conversion and hydrogen production rate were decreased. The 20Cu-10CeO2-Al2O3 catalyst exhibits the poorest performance of these catalysts with a maximum methanol conversion of 46%. The presence of CO2 byproduct indicated that the CeO2-containing catalysts favored the methanol steam reforming reaction. Addition of ZnO at low loading (1wt.%), Cu-ZnO-CeO2-Al2O3 catalyst demonstrated much better catalytic performance than those of the catalyst without CeO2 loading. On the other hand, addition of CeO2 at high ZnO loading (10wt.%) over Cu-ZnO-Al2O3 the catalyst behavior became similar to Cu-ZnO-Al2O3. Moreover, for ZnO impregnated on Cu-CeO2-Al2O3 catalysts, the methanol decomposition can be promoted more than the methanol steam reforming.
Department of Chemical Engineering Graduate School, Silpakorn University Student’s signature …………………………… Academic Year 2013 Thesis Advisor’s signature ……………………………
สำนกัหอ
สมุดกลาง
Page 6
e
54404207 : สาขาวชิาวศิวกรรมเคมี คาํสําคญั : เฟลมสเปรยไ์พโรไลซิส/ ทองแดง/ ซีเรียม/ อะลูมินา/ปฏิกิริยารีฟอร์มมิงของเมทานอล
ดว้ยไอนาํ ภาวนีิ เอียมประไพ : ผลของซีเรียมออกไซดที์มีต่อปฏิกิริยาการผลิตไฮโดรเจนจากเมทา
นอลโดยใช้ตวัเร่งปฏิกิริยาคอปเปอร์บนอลูมินาและคอปเปอร์-ซิงค์ออกไซด์บนอลูมินาซึงเตรียมโดยวธีิเฟรมสเปรย.์ อาจารยที์ปรึกษาวทิยานิพนธ์ : ผศ.ดร.ชูวงศ ์ชยัสุข. 93 หนา้.
ประสิทธิภาพเชิงเร่งปฏิกิริยาของคอปเปอร์บนตวัรองรับอะลูมินาและคอปเปอร์-ซิงค ์ออกไซด์บนตวัรองรับอะลูมินาทีมีการเปลียนแปลงปริมาณซีเรียมออกไซด์ถูกศึกษาในปฏิกิริยารีฟอร์มมิงของเมทานอลด้วยไอนาํทีอุณหภูมิ 200-350 องศาเซลเซียส ตวัเร่งปฏิกิริยาทงัหมดถูกเตรียมดว้ยวธีิเฟลมสเปรยไ์พโรไลซิสและวเิคราะห์คุณลกัษณะดว้ยวธีิการกระเจิงของรังสีเอกซ์และการวดัการรีดิวซ์แบบโปรแกรมอุณหภูมิ ตวัเร่งปฏิกิริยา เปอร์เซ็นต์ซีเรียมออกไซด์ทีรวมกบัทองแดง 20 เปอร์เซ็นตบ์นอะลูมินาแสดงค่าการเปลียนแปลงเมทานอลสูงสุดและส่งเสริมอตัราการผลิตไฮโดรเจน ทีปริมาณซีเรียมออกไซด์เป็น 10 เปอร์เซ็นต ์พฤติกรรมของปฏิกิริยารีฟอร์มมิงของเมทานอลดว้ยไอนาํถูกเปลียนแปลงซึงค่าการเปลียนแปลงเมทานอลและอตัราการผลิตไฮโดรเจนลดลง ตวัเร่งปฏิกิริยา 10 เปอร์เซ็นตซี์เรียมออกไซด์ทีรวมกบัทองแดง 20 เปอร์เซ็นตบ์นอะลูมินาแสดงประสิทธิภาพเชิงเร่งปฏิกิริยาตาํทีสุดของตวัเร่งปฏิกิริยาเหล่านีกบัค่าการเปลียนแปลงเมทานอลสูงทีสุด 46% การมีอยูข่องคาร์บอนไดออกไซดซึ์งเป็นผลพลอยได ้ชีให้เห็นวา่ตวัเร่งปฏิกิริยาทีมีซีเรียมออกไซดเ์ป็นองคป์ระกอบสนบัสนุนปฏิกิริยารีฟอร์มมิงของเมทานอลดว้ยไอนาํ การเติมซิงค์ออกไซด์ทีปริมาณน้อย (1 เปอร์เซ็นต์) คอปเปอร์-ซิงค์ออกไซด์-ซีเรียมออกไซด์บนตวัรองรับอะลูมินาแสดงประสิทธิภาพเชิงเร่งปฏิกิริยาดีกว่าตัวเร่งปฏิกิริยาทีไม่มีปริมาณซีเรียมออกไซด์ ในทางตรงกนัขา้ม การเติมซีเรียมออกไซด์ทีปริมาณซิงค์ออกไซด์มาก (10 เปอร์เซ็นต์) บนตวัเร่งปฏิกิริยาคอปเปอร์-ซิงคอ์อกไซด์บนตวัรองรับอะลูมินามีพฤติกรรมเหมือนกบัคอปเปอร์-ซิงค์ออกไซด์บนตวัรองรับอะลูมินา มากไปกว่านัน การเคลือบฝังซิงค์ออกไซด์บนคอบเปอร์-ซีเรียมออกไซด์บนตวัรองรับอะลูมินา ส่งเสริมปฏิกิริยาดีคอมโพสิชันของเมทานอลมากกว่าปฏิกิริยารีฟอร์มมิงของเมทานอลดว้ยไอนาํ
ภาควชิาวศิวกรรมเคมี บณัฑิตวทิยาลยั มหาวทิยาลยัศิลปากร ลายมือชือนกัศึกษา……………………………………. ปีการศึกษา 2556 ลายมือชืออาจารยที์ปรึกษาวิทยานิพนธ์……………………………
สำนกัหอ
สมุดกลาง
Page 7
f
Acknowledgements
This work was supported by the Department of Chemical Engineering, Faculty
of Engineering and Industrial Technology, Silpakorn University for this project are
thankfully admitted. In addition, I would like to thank SU Graduate school thesis
grant for the financial support.
The author thanks my advisor, Assistant Professor Dr. Choowong Chaisuk, for
valuable suggestions, useful discussions on this research to resolve this thesis
completed and thank Assistant Professor Dr. Okorn Mekasuwandumrong for
suggestions useful in my project. Moreover, I would like to thank Dr. Tarawipa
Puangpet who has been the chairman of the committee, Associate Professor Dr.
Joongjai Panpranot (members of the Center of Excellence on Catalysis and Catalytic
Reaction Engineering, Department of Chemical Engineering, Faculty of Engineering,
Chulalongkorn University), Assistant Professor Dr. Okorn Mekasuwandumrong who
have been members of the committee.
Finally, I wish to thanks my family, my friends, member of Chemical
Engineering Reaction Laboratory at Silpakorn University for furtherance and support.
สำนกัหอ
สมุดกลาง
Page 8
g
Contents
Page
English abstract .................................................................................... d
Thai abstract .......................................................................................... e
Acknowledgments ................................................................................. f
List of tables .......................................................................................... i
List of figures ......................................................................................... j
Chapter
I Introduction .............................................................................. 1
Objective of the research ….......................................... 2
Scope of the research ...................................................... 2
II Methanol Steam Reforming ..................................................... 5
III Flame Spray Pyrolysis .............................................................. 15
IV Experiments .............................................................................. 22
Catalyst preparation ...................................................... 23
Catalyst characterization .............................................. 25
Catalyst activity of hydrogen production from methanol 26
V Results and Discussion ............................................................. 31
The physical and chemical properties of CeO2 on
Cu-Al2O3 catalysts ................................................ 31
The physical and chemical properties of CeO2 on
Cu-ZnO-Al2O3 catalysts ......................................... 47
VI Conclusions .............................................................................. 71
สำนกัหอ
สมุดกลาง
Page 9
h
References .............................................................................. 72
Appendix .............................................................................. 80
Appendix A Calculation of catalyst preparation ........... 80
Appendix B Calculation of the crystallite size ............. 83
Appendix C Calculation for reducibility ..................... 87
Appendix D HC production ...................................... 89
Appendix E International presentation ........................ 92
Profile ..................................................................................... 93
สำนกัหอ
สมุดกลาง
Page 10
i
List of table
Table Page
2.1 Effect of CeO2 concentration on catalytic activity....................... 14
4.1 The details of chemical used in the catalyst preparation.............. 23
4.2 The details of gases used in the catalyst activity test................... 26
4.3 The operating conditions of TCD gas chromatographs
for the catalytic activity test............................................. 28
4.4 The operating conditions of FID gas chromatographs
for the catalytic activity test............................................. 29
5.1 The crystalline size of Cu-Al2O3 catalysts................................... 33
5.2 The reducibility of Cu-Al2O3 catalysts........................................ 34
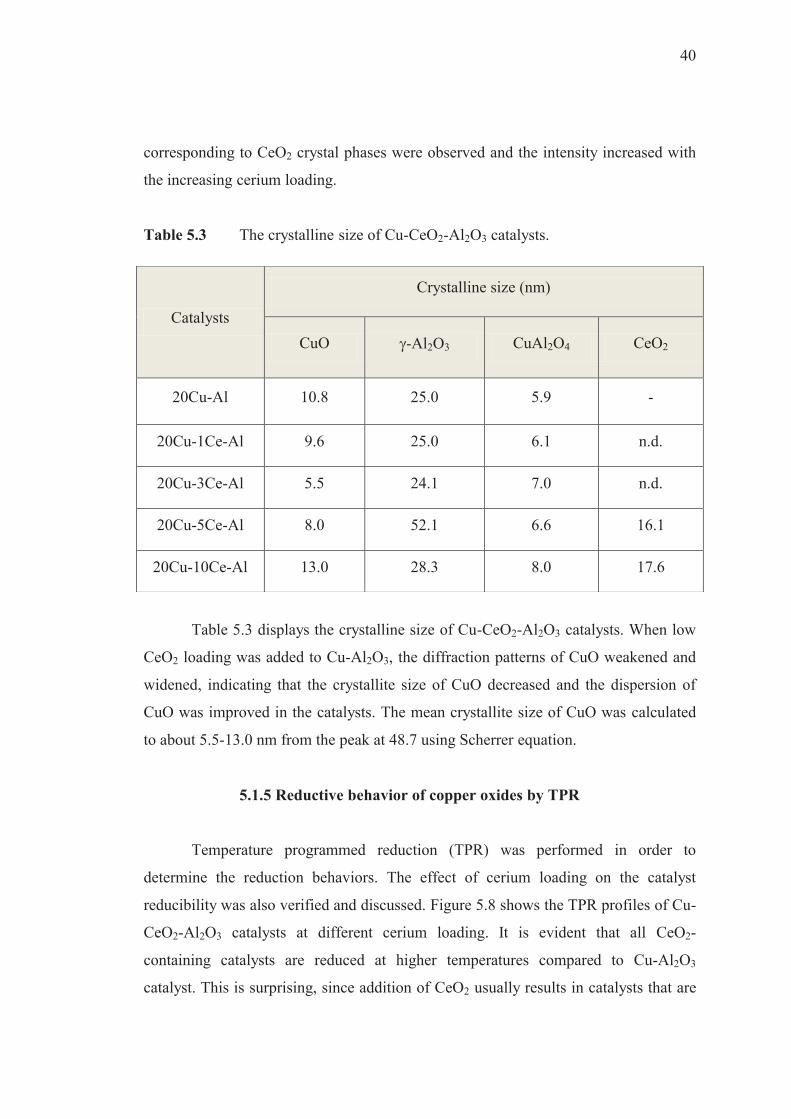
5.3 The crystalline size of Cu-CeO2-Al2O3 catalysts......................... 40
5.4 The reducibility of Cu-CeO2-Al2O3 catalysts.............................. 42
5.5 The crystalline size of Cu-ZnO-Al2O3 catalysts........................... 48
5.6 The reducibility of Cu-ZnO-Al2O3 catalysts................................ 50
5.7 The crystalline size of Cu-CeO2-Al2O3, Cu-ZnO-Al2O3 and
Cu-ZnO-CeO2-Al2O3 catalysts......................................... 55
5.8 The reducibility of Cu-ZnO-CeO2-Al2O3 catalysts...................... 57
5.9 The crystalline size of ZnO/Cu-CeO2-Al2O3 catalysts................. 64
5.10 The reducibility of ZnO/Cu-CeO2-Al2O3 catalysts....................... 65
สำนกัหอ
สมุดกลาง
Page 11
j
List of figure
Figure Page
1.1 Various percentages of promoter were incorporated with
Cu-Al2O3 that prepared by FSP....................................... 3
1.2 Various percentages of promoter were incorporated with
Cu-ZnO-Al2O3 that prepared by FSP.............................. 4
2.1 The temperature dependence of methanol conversion and product
composition during methanol steam reforming over the
G-66 MR Cu/ZnO/Al2O3 catalyst from Sud-Chemie
(H2O/CH3OH = 1:3)........................................................ 6
2.2 Time-on-stream stability test of catalysts
(T = 260 ◦C, W/F =11 kgcat mol−1 s, S/M= 1.4 M)....... 11
2.3 Methanol steam reforming over CuO/ZnO/ZrO2/Al2O3
(40/30/20/10), CuO/ZnO/ZrO2/Al2O3 (30/40/20/10)
and G66B catalysts for 110 h on stream............................ 13
3.1 FE-SEM images and size distributions of the silver-glass
composite powders prepared from spray solutions
with 0.1M and 3 M concentrations................................. 17
3.2 The schematic diagram illustrating the formation mechanism
of the morphologies of ceria particles from the three
precursors (CeA, CeN and CeAN) by FSP and TEM
images............................................................................. 19
3.3 TEM micrographs of the NDC particles with different
diameters.......................................................................... 20
3.4 (a and c) TEM and SEM images of hollow Al2O3 nanospheres
with addition of surfactants............................................... 21
สำนกัหอ
สมุดกลาง
Page 12
k
Figure Page
4.1 Experimental set-up scheme of flame spray pyrolysis system...... 24
4.2 Schematic diagram of the reaction and line for testing analyzed
by GC-TCD and GC-FID equipped with Porapak Q and
DB-1 column, respectively................................................ 27
5.1 XRD patterns of the Cu-Al2O3 catalysts....................................... 32
5.2 TPR profiles of Cu-Al2O3 catalysts.............................................. 33
5.3 MeOH conversion on Cu-Al2O3 catalysts in range 200-350 °C... 35
5.4 H2 production rate on Cu-Al2O3 catalysts in range 200-350 °C... 35
5.5 The H2/CO2 ratio on Cu-Al2O3 catalysts in range 275-350 °C..... 36
5.6 Pathway of reaction on Cu-Al2O3 catalysts in range 200-350 °C 37
5.7 XRD patterns of the Cu-CeO2-Al2O3 catalysts.................................. 39
5.8 TPR profiles of Cu-CeO2-Al2O3 catalysts..................................... 41
5.9 MeOH conversion on Cu-CeO2-Al2O3 catalysts
in range 200-350 °C.......................................................... 43
5.10 H2 production rate on Cu-CeO2-Al2O3 catalysts
in range 200-350 °C.......................................................... 43
5.11 The H2/CO2 ratio on Cu-CeO2-Al2O3 catalysts
in range 200-350 °C.......................................................... 44
5.12 Pathway of reaction on Cu-CeO2-Al2O3 catalysts
in range 200-350 °C.......................................................... 45
5.13 XRD patterns of the Cu-ZnO-Al2O3 catalysts..................................... 47
5.14 TPR profiles of Cu-ZnO-Al2O3 catalysts....................................... 49
5.15 MeOH conversion on Cu-ZnO-Al2O3 catalysts
in range 200-350 °C.......................................................... 51
5.16 H2 production rate on Cu-ZnO-Al2O3 catalysts
in range 200-350 °C.......................................................... 51
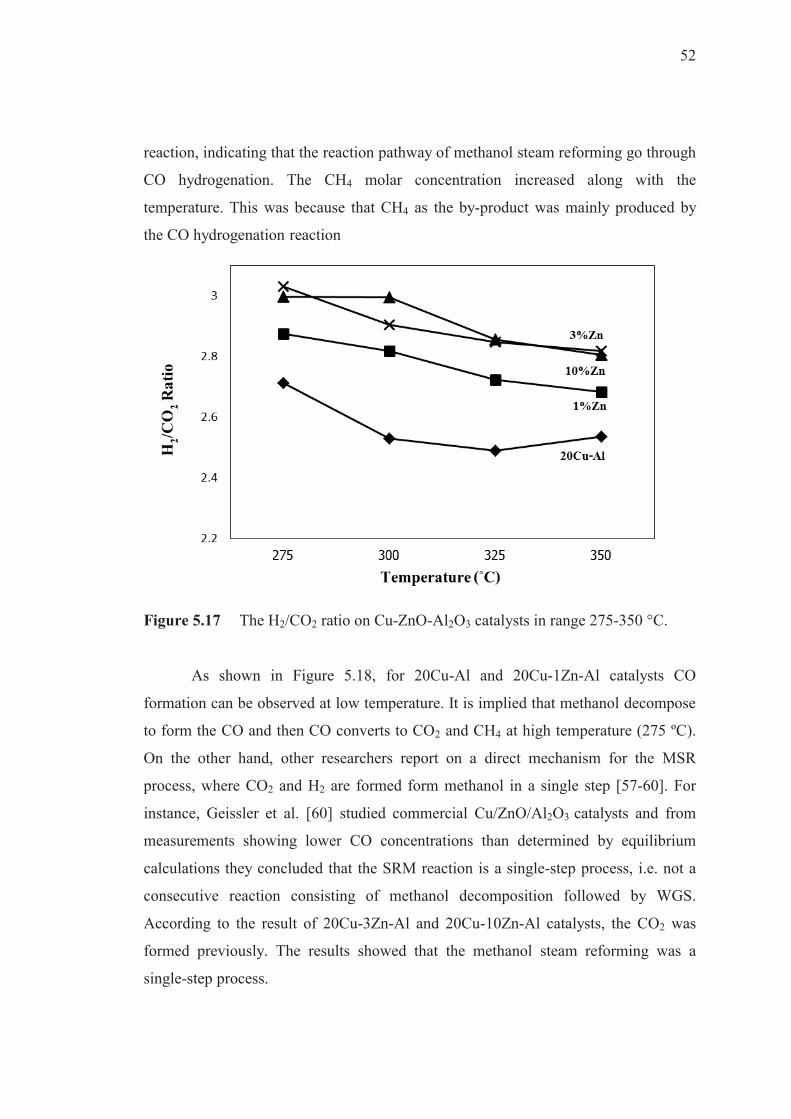
5.17 The H2/CO2 ratio on Cu-ZnO-Al2O3 catalysts
in range 200-350 °C.......................................................... 52
5.18 Pathway of reaction on Cu-ZnO-Al2O3 catalysts
in range 200-350 °C.......................................................... 53
สำนกัหอ
สมุดกลาง
Page 13
l
Figure Page
5.19 XRD patterns of the Cu-ZnO-CeO2-Al2O3 catalysts........................... 54
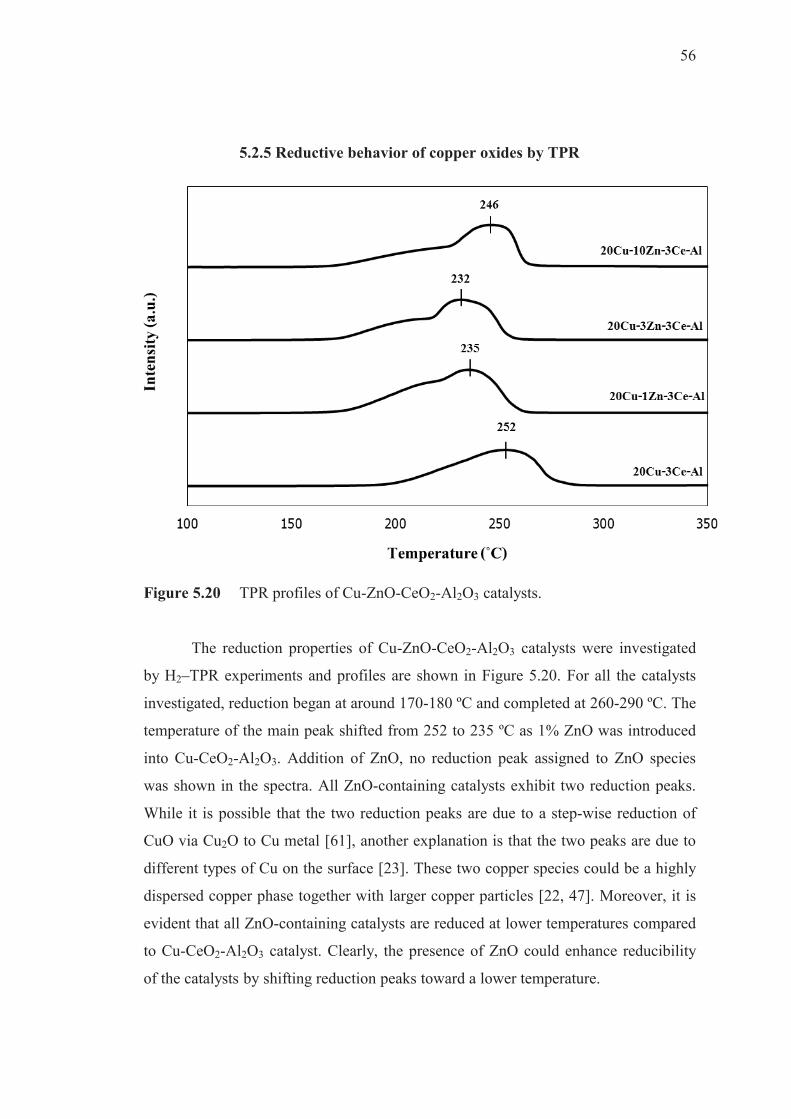
5.20 TPR profiles of Cu-ZnO-CeO2-Al2O3 catalysts............................... 56
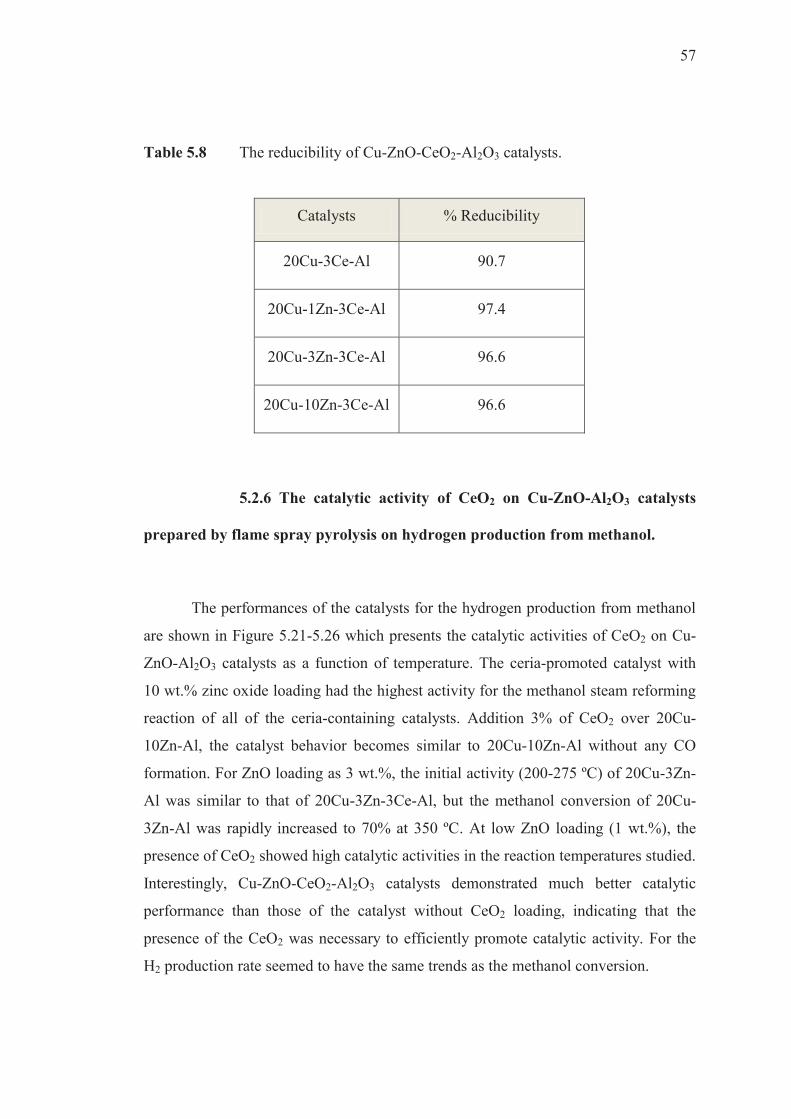
5.21 MeOH conversion of Cu-ZnO-Al2O3 (thin line) and
Cu-ZnO-CeO2-Al2O3 (dash line) catalysts
at ZnO as 1 wt.% in range 200-350 °C.............................. 58
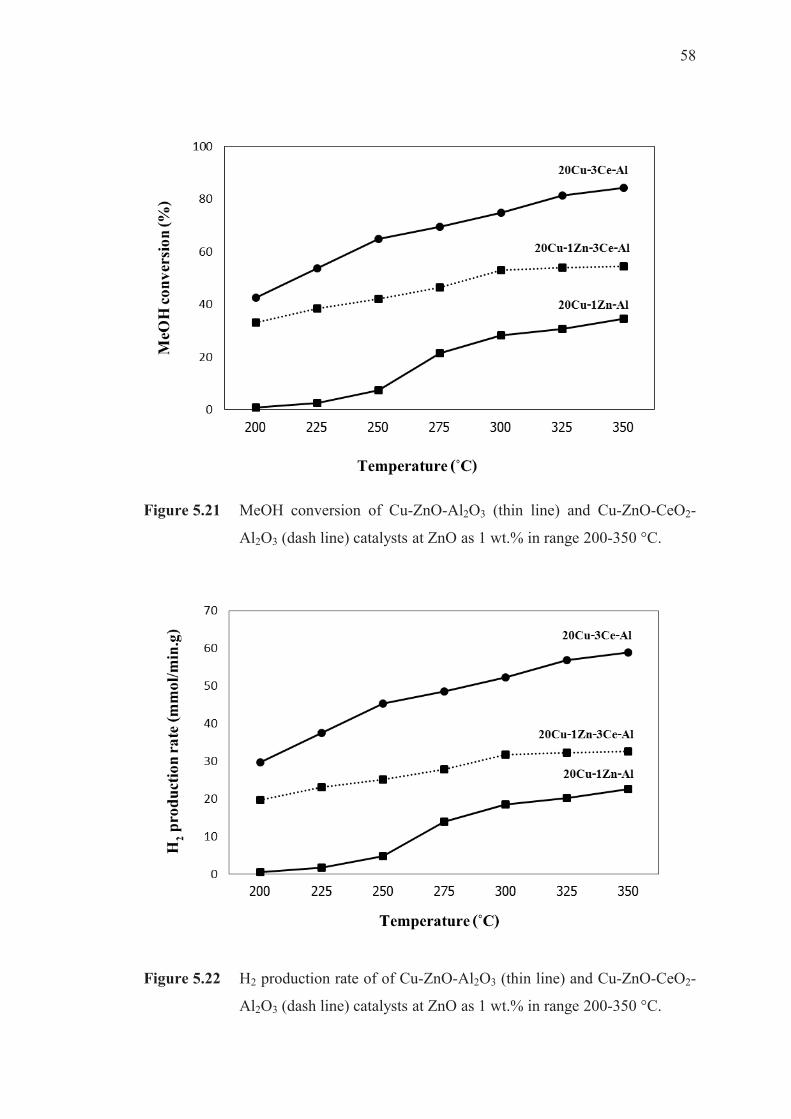
5.22 H2 production rate of of Cu-ZnO-Al2O3 (thin line) and
Cu-ZnO-CeO2-Al2O3 (dash line) catalysts
at ZnO as 1 wt.% in range 200-350 °C.............................. 58
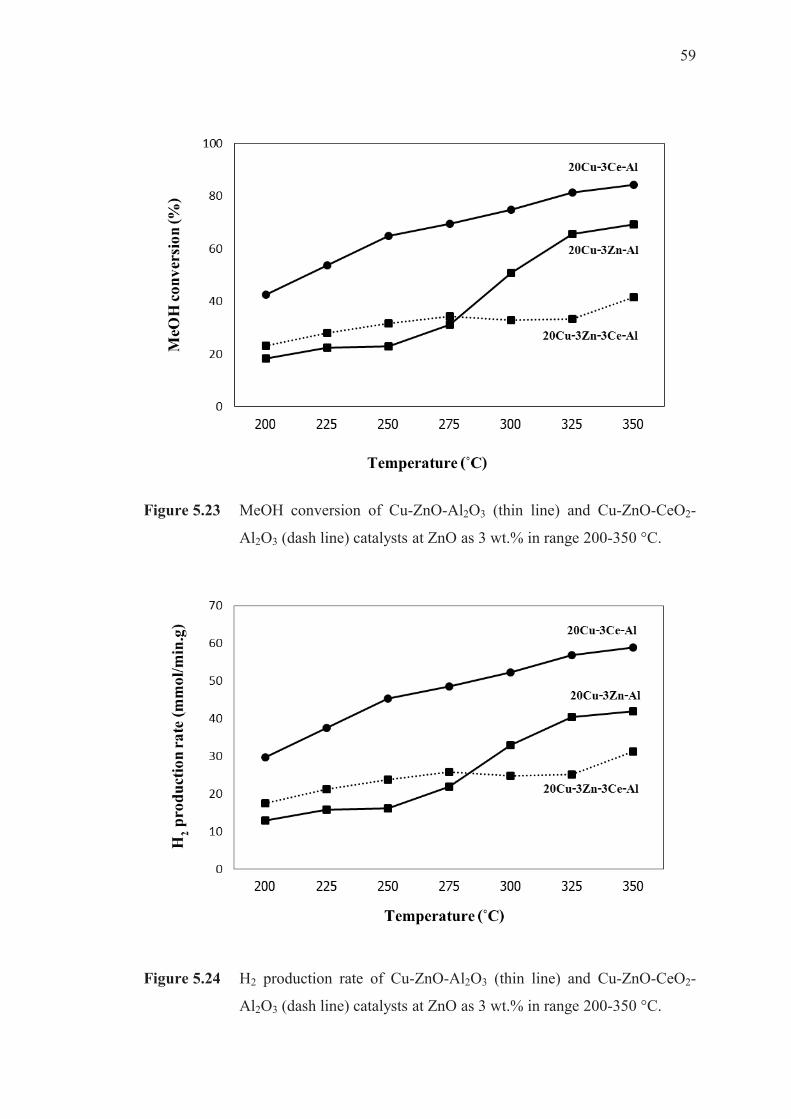
5.23 MeOH conversion of Cu-ZnO-Al2O3 (thin line) and
Cu-ZnO-CeO2-Al2O3 (dash line) catalysts
at ZnO as 3 wt.% in range 200-350 °C.............................. 59
5.24 H2 production rate of of Cu-ZnO-Al2O3 (thin line) and
Cu-ZnO-CeO2-Al2O3 (dash line) catalysts
at ZnO as 3 wt.% in range 200-350 °C.............................. 59
5.25 MeOH conversion of Cu-ZnO-Al2O3 (thin line) and
Cu-ZnO-CeO2-Al2O3 (dash line) catalysts
at ZnO as 10 wt.% in range 200-350 °C............................ 60
5.26 H2 production rate of of Cu-ZnO-Al2O3 (thin line) and
Cu-ZnO-CeO2-Al2O3 (dash line) catalysts
at ZnO as 10 wt.% in range 200-350 °C............................ 60
5.27 The H2/CO2 ratio on Cu-ZnO-CeO2-Al2O3 catalysts
in range 200-350 °C.......................................................... 61
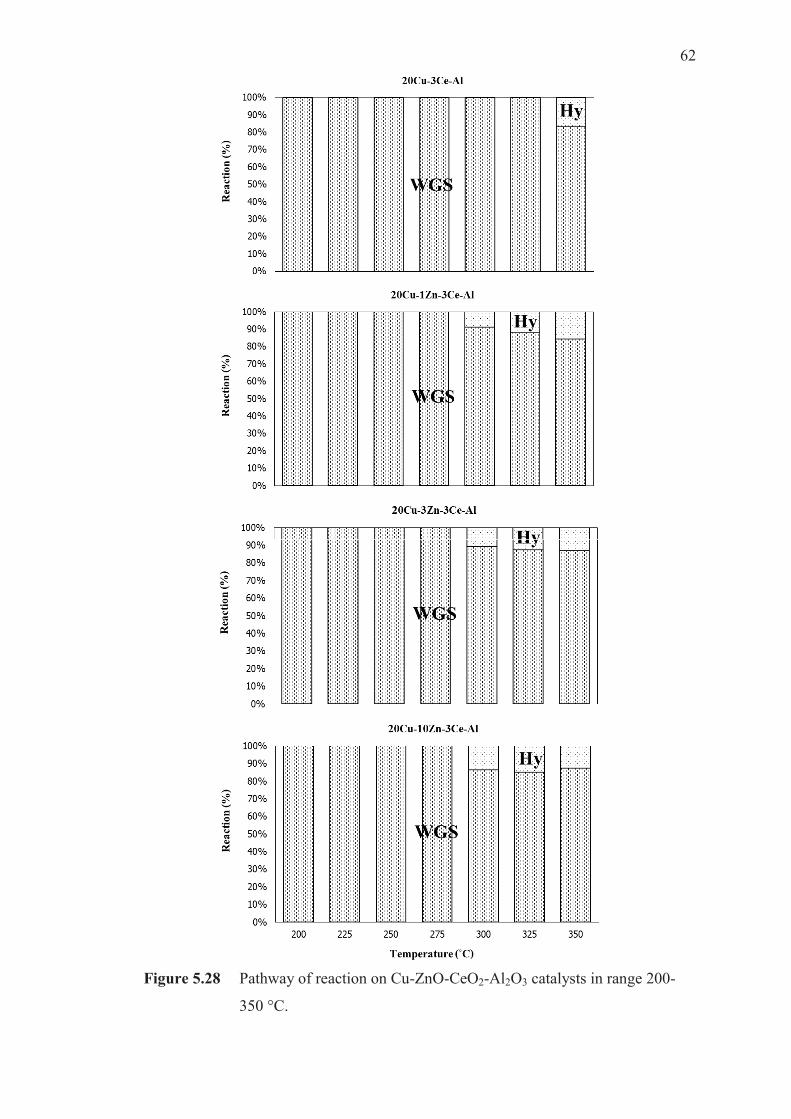
5.28 Pathway of reaction on Cu-ZnO-CeO2-Al2O3 catalysts
in range 200-350 °C.......................................................... 62
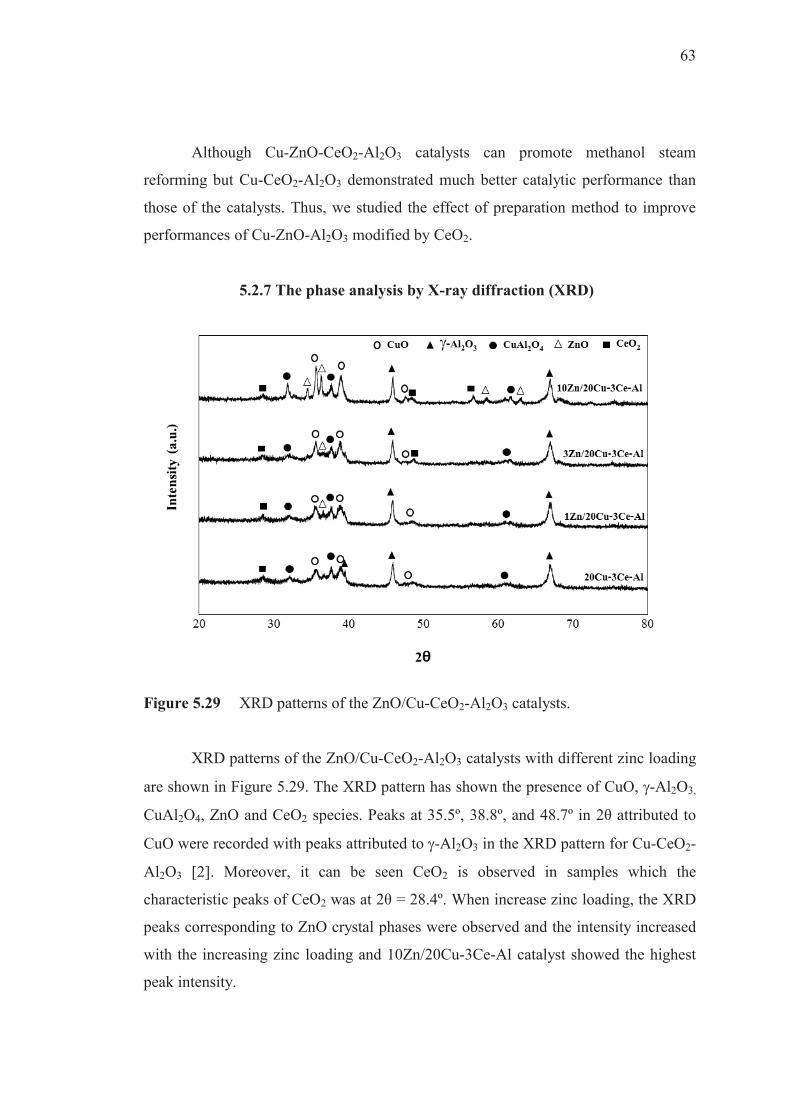
5.29 XRD patterns of the ZnO/Cu-CeO2-Al2O3 catalysts............................ 63
5.30 TPR profiles of ZnO/Cu-CeO2-Al2O3 catalysts................................ 65
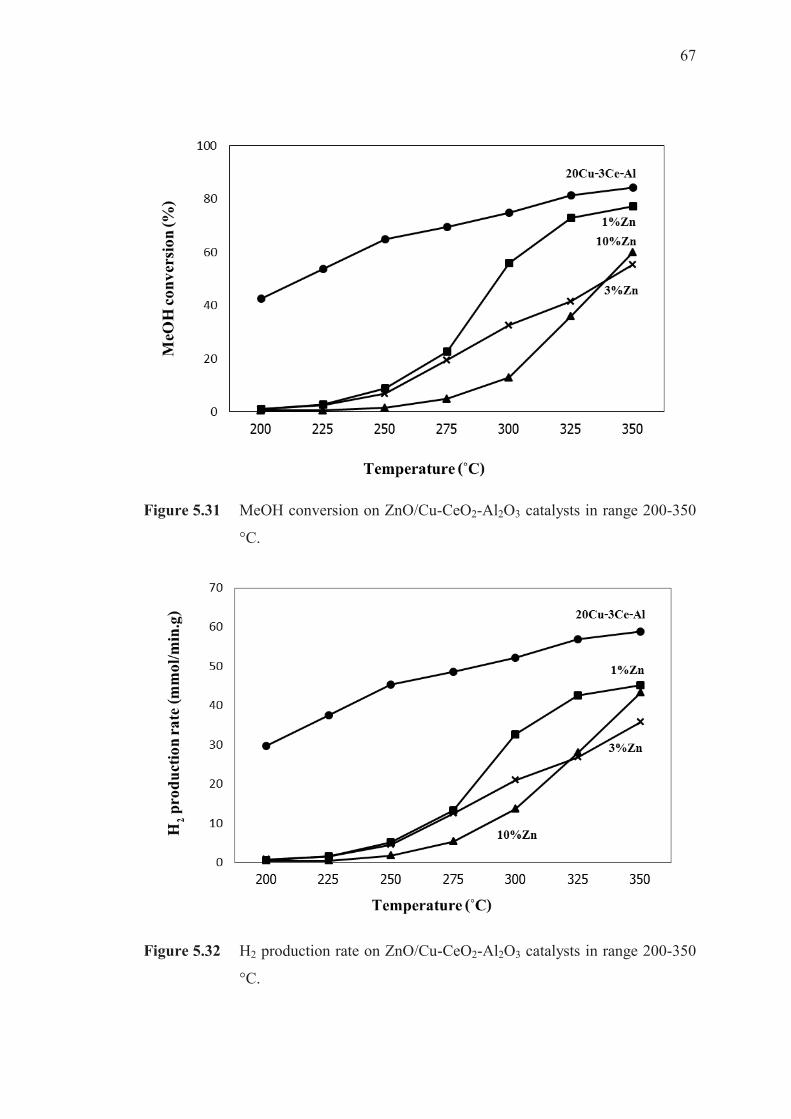
5.31 MeOH conversion on ZnO/Cu-CeO2-Al2O3 catalysts
in range 200-350 °C.......................................................... 67
5.32 H2 production rate on ZnO/Cu-CeO2-Al2O3 catalysts
in range 200-350 °C.......................................................... 67
สำนกัหอ
สมุดกลาง
Page 14
m
Figure Page
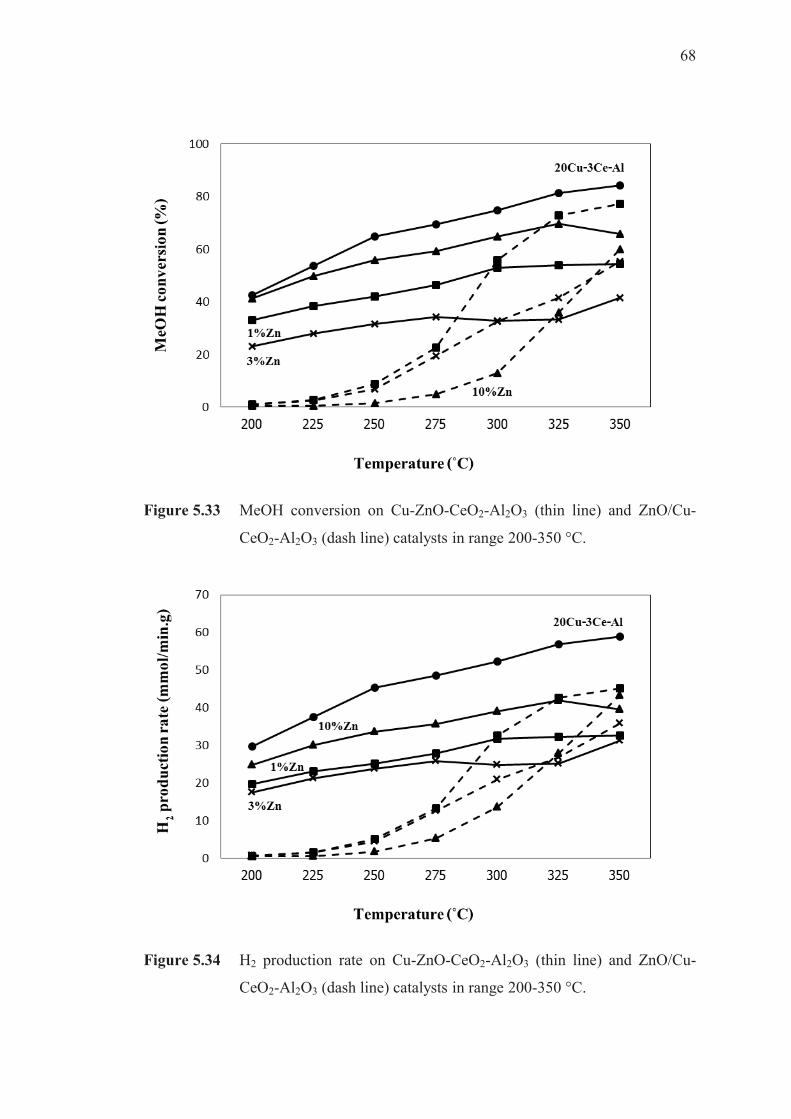
5.33 MeOH conversion on Cu-ZnO-CeO2-Al2O3 (thin line)
and ZnO/Cu-CeO2-Al2O3 (dash line) catalysts
in range 200-350 °C.......................................................... 68
5.34 H2 production rate on Cu-ZnO-CeO2-Al2O3 (thin line)
and ZnO/Cu-CeO2-Al2O3 (dash line) catalysts
in range 200-350 °C.......................................................... 68
5.35 The H2/CO2 ratio on ZnO/Cu-CeO2-Al2O3 catalysts
in range 200-350 °C.......................................................... 69
5.36 Pathway of reaction on ZnO/Cu-CeO2-Al2O3 catalysts
in range 200-350 °C.......................................................... 70
สำนกัหอ
สมุดกลาง
Page 15
1
CHAPTER I
INTRODUCTION
Hydrogen was recognized as an ideal fuel for power generation systems with
virtually zero emissions of air pollutants and carbon dioxide. Especially, hydrogen
produced via methanol reforming. From all methanol reforming reactions, methanol
steam reforming (MSR) produces the highest yield of hydrogen, about 75%, while
maintaining a low selectivity of CO of less than 1%. Moreover, methanol has been
recommended as the best source for hydrogen fuel among the high energy density
liquid fuels due to the high H/C ratio, relatively low boiling point and easy storing [1].
Selective methanol steam reforming is usually carried out below 300 ºC over copper
catalysts such as Cu/ZnO/Al2O3 for hydrogen production [2].
Copper based catalysts have been widely investigated for using in MSR
reaction due to their high selectivity and activity. Conventional Cu/ZnO/Al2O3
catalysts often consist of relatively large amounts of Cu and ZnO and a small amount
of Al2O3 [3]. It is generally accepted that copper dispersion plays a key role in the
catalytic performance while zinc oxide is known to improve the dispersion of Cu and
the reducibility of CuO. The addition of Al2O3 not only hindered the reducibility but
also weakened the interaction between CuO and ZnO in the catalysts. Although Al2O3
hindered the SRM reaction, an appropriate amount of it was needed to ensure the
stability and the mechanical strength of the catalysts [4].
To improve the efficiency of catalysts of the MSR reaction, several
researchers have introduced a third metallic oxide such as ZrO2, CeO2, Cr2O3, Fe2O3,
La2O3 or Y2O3, etc. can be added to improve the performance of CuO/ZnO-based and
CuO/ZnO/Al2O3-based catalysts. For example, ZrO2 addition to Cu-based alumina-
supported catalysts has been shown to increase methanol conversion and reduce CO
yields. The effects of ZrO2 on Cu-based catalysts appear to be similar to the effects of
สำนกัหอ
สมุดกลาง
Page 16
2
ZnO in that ZrO2 improves Cu dispersion and leads to more reducible catalysts.
Addition of CeO2 to Cu/Al2O3 catalysts has also been shown to increase methanol
conversion, decrease CO selectivity and increase catalyst stability [5-6].
Therefore, we have motivated to study the addition CeO2 which as promoter
on Cu-based catalysts for testing the catalytic performance of hydrogen production
from methanol.
Objective of the Research
To study the effect of CeO2 on hydrogen production from methanol using Cu-
Al2O3 and Cu-ZnO-Al2O3 catalyst prepared by flame spray pyrolysis (FSP).
Scope of the Research
1. Catalyst preparation
All the catalysts are divided into two groups. In first group, the catalysts
containing Cu on Al2O3 supported which various percentages of copper as 10-50
wt.%. The appropriate percentage of copper was selected to promote with CeO2 using
percentages loading as 1, 3, 5 and 10 wt.%. In second group, we have studied the
effect of CeO2 promoter on Cu-ZnO-Al2O3 catalysts by percentages of CeO2 loading
was fixed. Thus, in this part, percentages of ZnO loading were various as 1, 3 and 10
wt.% to improve the catalysts. All the catalysts were prepared by flame spray
pyrolysis (FSP) which the details were shown in figure 1.1-1.2.
สำนกัหอ
สมุดกลาง
Page 17
3
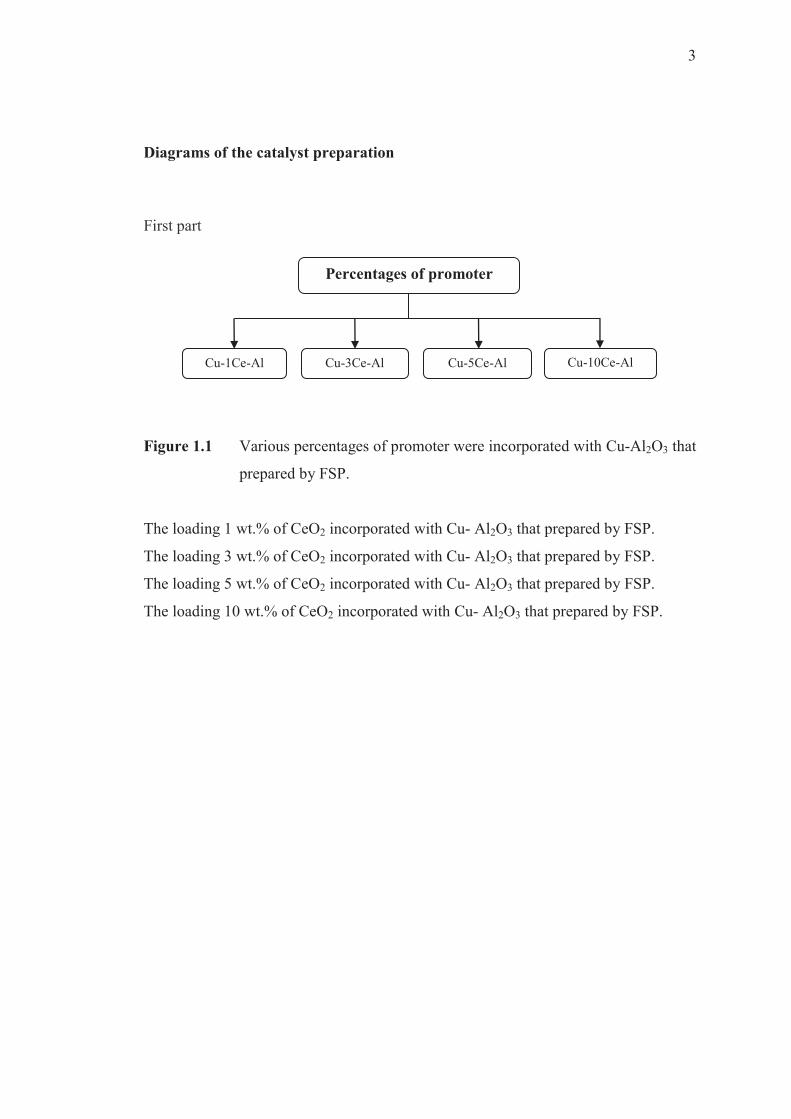
Diagrams of the catalyst preparation
First part
Figure 1.1 Various percentages of promoter were incorporated with Cu-Al2O3 that
prepared by FSP.
The loading 1 wt.% of CeO2 incorporated with Cu- Al2O3 that prepared by FSP.
The loading 3 wt.% of CeO2 incorporated with Cu- Al2O3 that prepared by FSP.
The loading 5 wt.% of CeO2 incorporated with Cu- Al2O3 that prepared by FSP.
The loading 10 wt.% of CeO2 incorporated with Cu- Al2O3 that prepared by FSP.
Percentages of promoter
Cu-1Ce-Al Cu-3Ce-Al Cu-10Ce-Al Cu-5Ce-Al
Page 18
4
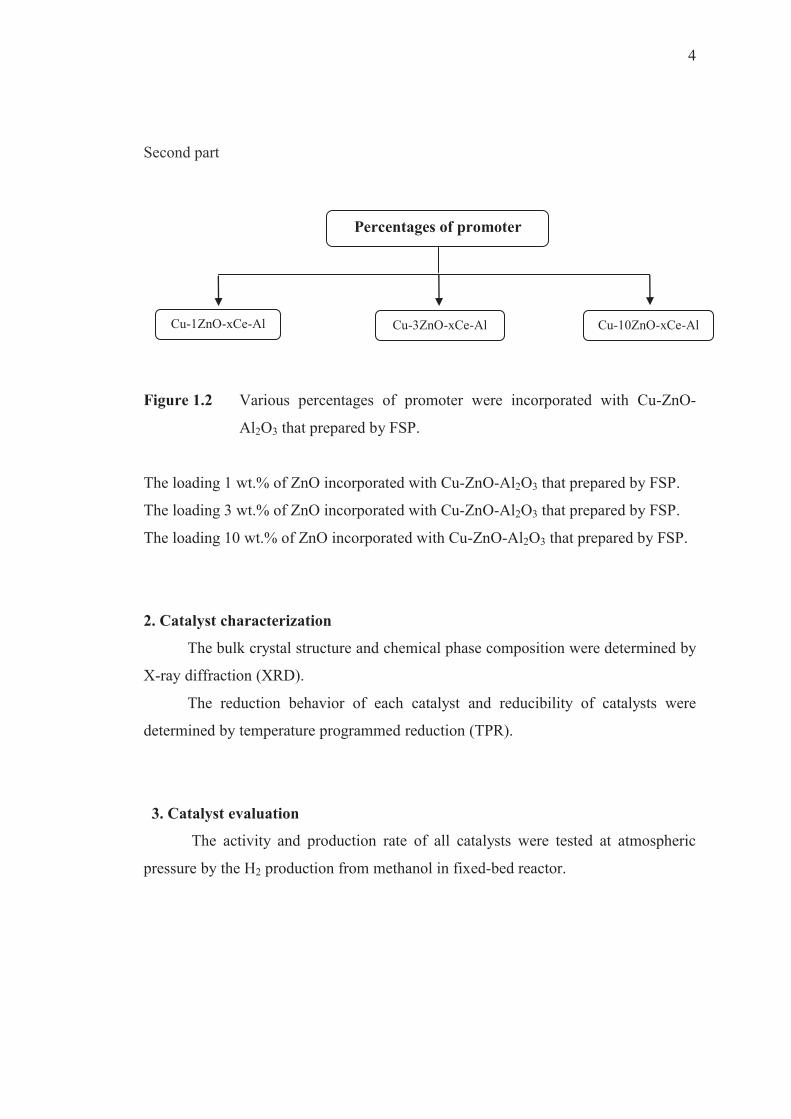
Second part
Figure 1.2 Various percentages of promoter were incorporated with Cu-ZnO-
Al2O3 that prepared by FSP.
The loading 1 wt.% of ZnO incorporated with Cu-ZnO-Al2O3 that prepared by FSP.
The loading 3 wt.% of ZnO incorporated with Cu-ZnO-Al2O3 that prepared by FSP.
The loading 10 wt.% of ZnO incorporated with Cu-ZnO-Al2O3 that prepared by FSP.
2. Catalyst characterization
The bulk crystal structure and chemical phase composition were determined by
X-ray diffraction (XRD).
The reduction behavior of each catalyst and reducibility of catalysts were
determined by temperature programmed reduction (TPR).
3. Catalyst evaluation
The activity and production rate of all catalysts were tested at atmospheric
pressure by the H2 production from methanol in fixed-bed reactor.
Percentages of promoter
Cu-1ZnO-xCe-Al Cu-10ZnO-xCe-Al Cu-3ZnO-xCe-Al
Page 19
5
CHAPTER II
METHANOL STEAM REFORMING
Hydrogen can be a major fuel to supply energy via the use of fuel cells. The
selection of the hydrogen source for a particular application depends on technical,
economic and political factors. Commercially, methanol reforming was the primary
method to produce hydrogen which can be obtained directly from methanol according
to three different reactions. There are methanol steam reforming (MSR), partial
oxidation of methanol (POM), and the decomposition of methanol (DM)
CH3OH + H2O 3H2 + CO2 (2.1)
CH3OH + 0.5O2 CO2 + 2H2 (2.2)
CH3OH 2H2 + CO (2.3)
From all methanol reforming reactions, methanol steam reforming (MSR)
produces the highest yield of hydrogen, about 75%, while maintaining a low
selectivity of CO less than 1%. Methanol is one of the most interesting hydrocarbon
sources for hydrogen production. The absence of a strong C–C bond facilitates the
reforming at low temperatures (200–300 ºC). This range of temperatures is very low
when compared to other common fuels. Although methanol is highly toxic and
miscible in water, it has the advantage of being biodegradable, liquid at atmospheric
conditions and has high hydrogen to carbon ratio [7]. Peppley et al. [8] found that the
methanol decomposition reaction occurred in parallel with the steam reforming
reaction, particularly at low conversions. In contrast, Agrell et al. [9] reported that CO
production was negligible at very short space times (low conversions) under the
conditions used in their study. Several groups had also reported that CO was a
secondary product (formed from CO2 via the reverse water-gas-shift reaction) rather
than a primary product (formed via direct methanol decomposition).
Page 20
6
Production of H2 by MSR was studied in the temperature range between 175
and 350 ºC over Cu/ZnO/Al2O3 catalysts from Sud-Chemie (G-66 MR) as showed in
Figure 2.1. Methanol conversion was kinetically controlled in the lower temperature
region, whereas mass transfer limitations occurred above 220°C.
Figure 2.1 The temperature dependence of methanol conversion and product
composition during methanol steam reforming over the G-66 MR
Cu/ZnO/Al2O3 catalyst from Sud-Chemie (H2O/CH3OH = 1:3).
(Agrell et al., 2002)
Copper-based catalysts are the most commonly used for the methanol steam
reforming reaction (MSR) due to their high activity and selectivity. However, these
catalysts are known for their pyrophoric characteristics and deactivation by thermal
sintering which motivates the search for other types of catalysts. In comparison to Cu-
based, group 8–10 catalysts have been reported in the literature as highly stable and
with similar selectivity.
However, concerning the catalytic activity, the later catalysts have the
disadvantage of producing less hydrogen than the copper-based ones [10]. In this
research, we focus copper-based catalysts for the MSR reaction to enhance the
Page 21
7
performance of the catalysts. Some studies are based on the addition of promoters,
while others focus on the effect of the preparation method. Catalysts for other
reactions such as partial oxidation and autothermal steam reforming are not included
in this study.
In addition to catalytic metal composition, the method of preparation had been
shown to be extremely important to catalytic performance. Several preparation
methods, including impregnation, coprecipitation, and hydrothermal synthesis, were
studied by Shen et al. [11] for methanol reforming over Cu/Zn/Al-based catalysts. It
was found that the preparation method affects conversion and selectivity. Shen and
Song examined the effect of the preparation method on the catalytic behavior of
Cu/Zn/Al catalysts and found that it significantly affected the dispersion of copper
particles and the catalyst performance in terms of methanol conversion, H2 yield and
CO concentration. A correlation between the observed catalytic activity and the
presence of highly dispersed Cu metal particles, obtained by an appropriate synthetic
procedure, was also proposed by Shishido et al. and Li et al. A very high catalytic
activity for methanol steam reforming at low temperature was reported by Zhang et al.
[12] on Cu/ZnO/Al2O3 catalysts synthesized by a gel-coprecipitation approach with
respect to the catalysts prepared by a conventional coprecipitation technique. This
superior catalytic performance was attributed not only to the generation of highly
dispersed copper and zinc components but also to the creation of catalytically actived
copper species with a much stronger Cu-Zn interaction.
Similarly, Zhang et al. attributed the better performance of a Cu/ZnO/Al2O3
catalysts obtained from a CuO/ZnO/Al2O3 sample, prepared by conventional
carbonate coprecipitation method and aged under microwave irradiation, to the
creation of highly strained copper nanocrystals in the active catalyst. Kurr et al. [13]
found that among various Cu/ZnO/Al2O3 catalysts, prepared by hydroxycarbonate
coprecipitation procedure, the catalytic activity and thermal stability under methanol
steam reforming conditions were influenced not only by the copper specific surface
area but also by defects in the bulk structure.
Jakdetchai et al. [14] improved the impregnation technique in order to achieve
higher copper dispersion in CuZn catalysts. They prepared a copper zinc-impregnated
FSM-16 (Folded Sheet Silica) catalyst by using a modified impregnation method with
Page 22
8
1,3-butanediol. When compared to the catalyst prepared by the conventional wet
impregnation method, this new catalyst presented a higher copper dispersion that
enhanced methanol conversion (ca. 62% higher) and decreased selectivity (no CO
detected at 230 ºC).
Kawamura et al. [15] reported optimization of the coprecipitation temperature
and pH, important in increasing Cu dispersion. Valde´s-Solı´s et al. [16] reported
synthesis of nanosized spinel Cu-based catalysts by a silica template technique.
Compared to conventionally prepared catalysts, improved surface areas were
reported, resulting in highly active catalysts. Deactivation due to coking was
observed, although it appeared to be independent of the synthesis method.
Gold (Au) supported on CeO2-Fe2O3 catalysts prepared by the deposition-
coprecipitation technique were investigated for methanol steam reforming. C.
Pojanavaraphan et al. [17] studied the 3 wt% Au/CeO2-Fe2O3 sample achieved 100%
methanol conversion and 74% hydrogen yield due to a strong Ce-Fe interaction in the
active solid solution phase. The sintering of Au particles was observed when the
highest metal content of 5 wt% was registered, which worsened the SRM activity.
Hydrogen production by steam reforming of methanol and ethanol is studied
over a series of Cu/ZnO/Al2O3 catalysts prepared by different coprecipitation
procedures and modified with the introduction of Ni and Co. Active and cheap
catalysts, comprising based metals (Cu, Co and Ni) as active phase and ZnO as
promoter, can be prepared following simple ways, demonstrating good performances
in the hydrogen production through the steam reforming of alcohols. Lorenzut et al.
[4] studied the optimization of the preparation methodology leaded to high surface
area materials, although the metal dispersion remains quite low due to the high metal
loading. N2O decomposition experiments, XRD analysis and HR-TEM images
suggest that metal nanoparticles could be at least partially embedded into the
ZnO/Al2O3.
The performances of different xCu10Al, xZn10Al (x = 1, 3, and 5),
5%Zn5Cu10Al and 5%Cu5Zn10Al catalysts prepared by impregnation method on
methanol steam reforming (MSR) at 350 oC were investigated by M. Mrad et al. [18].
The results show that the presence of alumina enhances the dispersion of copper oxide
species by the stabilization of isolated Cu2+ ions. The impregnation of copper over
Page 23
9
alumina supports shows better results than that of zinc. The presence of zinc over
alumina seems to favor the reverse water gas shift reaction. Among all the tested
series, the 5%Cu5Zn10Al shows the highest performance due to the presence of
ZnAl2O4 spinal form that stabilises the Cu+, which is the most active specie in the
SRM.
P.P.C. Udani et al. [19] studied CuO–CeO2 catalysts prepared by
coprecipitation method with varying copper content in the range of 30–80%. The
activity of CuO–CeO2 catalysts for MSR increased with the copper content and
70%CuO–CeO2 catalyst showed the best catalytic performance in the temperature
range of 160–300 oC. XRD of the used catalysts showed that the copper species after
SRM were mainly metallic copper with small amount of CuO and Cu2O, an indication
that metallic copper is an active species in the catalysis of MSR. The optimum
70%CuO–CeO2 catalyst showed stable activities for MSR reactions at 300 oC.
It was generally agreed that there was an optimum balance between metallic
Cu0 and oxidized Cu+ for maximum activity/selectivity and this was a function of not
only the catalyst preparation and composition but also the feed and reaction
conditions. It was generally accepted that copper dispersion played a key role in the
catalytic performance of these materials while the function of ZnO was to obtain and
maintain the catalytically actived copper in optimal dispersion and to improve the
reducibility of CuO. The addition of small amounts of Al2O3 further inhibited thermal
sintering of copper particles and, therefore, imparts chemical and thermal stability to
the catalyst. Moreover, it had been shown that the H2 yield decreased with increasing
alumina concentration.
S. D. Jones et al. [7] studied methanol steam reforming over nanoparticle-
supported catalysts. The catalysts achieved similar conversions as the commercial
reference catalyst but at slightly higher temperatures. Furthermore, the nanoparticle-
supported catalysts also exhibited a significantly lower CO selectivity at a given
temperature and space time than the reference catalyst. The TOF of the catalysts were
higher than that of the commercial catalyst, which means that the activity of the
surface copper is higher. Moreover, the acidity of the alumina support appears to
promote CH2O formation, which at low Cu concentrations is not reformed to CO2 and
H2.
Page 24
10
Cu-based catalysts with different supports (CeO2, ZrO2 and CeO2-ZrO2) for
methanol steam reforming (MSR) were prepared by a co-precipitation procedure, and
the effect of different supports was investigated. The introduction of ZrO2 into the
catalyst improved the Cu dispersion and catalyst reducibility, while the addition of
CeO2 mainly increased oxygen storage capacity. Lei Zhang et al. [20] showed that the
CeO2-ZrO2-containing catalyst showed the best performance with lower CO
concentration, which was due to the high Cu dispersion and well oxygen storage
capacity.
Promoters have been used to influence the status of copper and enhance the
performance of the catalyst. Studies on the promotional effects of zirconia have
revealed that this structural promoter decreases the CO selectivity. For instances,
Lindström and Pettersson [21] studied the effect of zirconia in alumina-supported
monolithic Cu-Zn catalysts. Although the Zr doped catalysts were less active than the
ones without Zr, the selectivity towards CO2 was higher. Jeong et al. [22] compared
the performance of Cu/ZnO/Al2O3 to the one of Cu/ZnO/ZrO2/Al2O3, and reported an
increase of approximately 16% in methanol conversion and a CO molar fraction 7.3
times lower, due to the presence of ZrO2. Agrell et al. [23] reported an increase of ca.
37.5% in copper dispersion after adding ZrO2 to Cu/ZnO catalyst. Finally, ZrO2, as
well as ZnO, can prevent copper particles from aggregation and help stabilize the
crystal size of copper [24]. Another structural promoter is Al2O3, which provides a
larger surface on which copper can be dispersed [22, 23]. Agrell et al. [23] observed
an increase of both total surface area (48.6-91.9 m2 g−1) and copper dispersion (9.6–
11.3%) due to Al2O3. A similar effect can be attained by adding Cr2O3 [25, 26], which
acts as stabilizer of the copper structure reducing sintering. The promotional effects of
CeO2 have been described in the literature [16, 27, 28, 29], in particular, Liu et al.
reported high activity of the Cu/CeO2 catalysts compared to Cu/ZnO, Cu/Zn(Al)O and
Cu/Al2O3 with the same Cu loading and under the same reaction conditions. It was
suggested that the high activity of the Cu/CeO2 catalysts was due to the highly
dispersed Cu metal particles and the strong metal-support interaction between the Cu
metal and CeO2 support. The catalytic activity has been reported to improve with the
addition of yttria which appears to stabilize a high copper surface area [30]. P. Bichon
et al. [31] investigated Cu-based catalysts with and without Pd addition. The increase
Page 25
11
in activity by adding Pd is moderate, and is accompanied by a large increase in CO
production. However, the Pd addition leads to a faster start-up without pre-reduction,
thus improving the dynamics of the system. Moreover, the addition of Pd also led to
poorer selectivity, due to a significant increase in the selectivity to CO. Finally,
Houteit et al. [32] reports that cesium oxide can prevent copper oxide crystallites from
sintering and its reduction into metallic Cu.
Figure 2.2 Time-on-stream stability test of catalysts (T = 260 ◦C, W/F =11 kgcat
mol−1 s, S/M= 1.4 M). (S. Patel and K.K. Pant, 2006)
The catalytic activity and hydrogen selectivity of cerium and zinc promoted
copper–alumina catalysts have been investigated for the selective production of
hydrogen via methanol steam reforming (MSR). Results revealed that the methanol
conversion, hydrogen selectivity and carbon monoxide formation varied with the type
of promoter and content of copper in the catalyst. S. Patel et al. [27] found cerium
promoted Cu–Zn–Ce–Al-oxide catalysts improved the activity and hydrogen
selectivity greatly and also kept the CO formation very low. Using cerium the MSR
could be carried out at lower temperature with high methanol conversion, results in
suppression of methanol decomposition and reverse water gas shift reactions
eventually end-up with the low carbon monoxide and hydrogen rich product stream.
Cerium also stabilizes the copper–alumina catalysts effectively that was confirmed by
Page 26
12
deactivation studies in which cerium promoted Cu–Zn–Ce–Al-oxide catalysts gave
the consistent performance for a long run-time compared to catalysts containing only
zinc promoter as showed in Figure 2.2.
P. Clancy et al. [30] studied Cu–zirconia catalysts containing various additives
(Y2O3, La2O3, Al2O3 and CeO2) have been prepared by coprecipitation method and
their activities and stabilities under operating conditions for the methanol steam
reforming. It has been found that an yttria promoted catalyst containing 30 mol% Cu
and 20 mol% of Y2O3 is not only very active but is also very stable under reaction
conditions used. The yttria appears to stabilise a high copper surface area and may
also have a slight promotional effect on the copper. Moreover, J. Papavasiliou et al.
[28] studied doping of CuO–CeO2 catalysts with small amounts of oxides of Sm and
Zn improves their catalytic performance in methanol steam reforming, while doping
with oxides of La, Zr, Mg, Gd, Y or Ca lowers or has negligible effect on catalytic
activity. All doped catalysts produce less CO than CuO–CeO2. Addition of larger
amounts of dopant leads always to a decrease of catalytic activity. Pd and Rh-
containing catalysts have similar (Rh) or higher (Pd) activity compared to CuO–CeO2,
but their CO selectivity is significantly higher and close to WGS equilibrium.
G. Huang et al. [6] studied CuO/ZnO/CeO2/ZrO2/Al2O3 catalysts for the steam
reforming of methanol. CeO2, ZrO2 and Al2O3 all improved the dispersions of CuO
and ZnO in catalysts. ZnO and ZrO2 improved the MSR reaction, but CeO2 and Al2O3
weakened the reaction. The introduction of ZrO2 into CuO/ZnO/Al2O3 improved the
reducibility and stability of the catalyst. The addition of CeO2 or Al2O3 hindered the
reducibility of the catalyst and weakened the interaction between CuO and ZnO.
Nevertheless, an appropriate amount of Al2O3 was needed for the stability and the
mechanical strength of the catalysts. The CuO/ZnO/ZrO2/Al2O3 (40/30/20/10) catalyst
was the best one in this study.
Page 27
13
Figure 2.3 Methanol steam reforming over CuO/ZnO/ZrO2/Al2O3 (40/30/20/10),
CuO/ZnO/ZrO2/Al2O3 (30/40/20/10) and G66B catalysts for 110 h on
stream. (G. Huang et al., 2009)
Effects of CeO2 content on Cu/Al2O3 catalysts prepared by co-precipitated
method were investigated. X. Zhang et al. [29] found that 20 wt% CeO2 promoted
Cu/Al2O3 catalysts exhibited higher activity and stability as compared to the
unpromoted ones. Results of XRD and the surface element distribution of catalysts
showed that CeO2 could enhance the surface dispersion of copper on catalysts, and
prevent copper crystallites from sintering and make copper crystallites relatively
smaller. It is suggested that high activity, selectivity and stability of CeO2 promoted
catalysts have been resulted from a higher copper dispersion and smaller copper
crystallites, and the synergetic effect of ceria.
Page 28
14
Table 2.1
Effect of CeO2 concentration on catalytic activity
Reaction conditions: P = 0.1MPa; t = 250 ºC; X the methanol conversion; Y the
hydrogen yield; S the selectivity; and y is the outlet CO concentration. (X. Zhang et
al., 2003)
Number W (CeO2) % X (CH3OH) (mol%) Y (H2) (mol(h.g)-1) S (H2) (%) Y (CO) (mol%)
1 0 81.4 0.2509 99.7 0.37
2 5 87.5 0.2697 99.9 0.19
3 10 90.0 0.2774 99.9 0.17
4 15 93.0 0.2866 99.9 0.15
5 20 95.5 0.2944 99.9 0.14
6 25 91.8 0.2829 99.9 0.16
Page 29
15
CHAPTER III
FLAME SPRAY PYROLYSIS
Nanotechnology has become a key area in the development of science and
engineering [33]. Nanotechnology basically involves the production or application of
materials that have unit sizes of about 10-100 nm. Comparing micron-sized and nano-
sized alumina particles, nano-alumina has many advantages. A smaller particle size
would provide a much larger surface area for molecular collisions and therefore
increase the rate of reaction, making it a better catalyst and reactant.
There are several methods to synthesize nano-alumina [34], and these are
categorized into physical and chemical methods. Physical methods include
mechanical milling, laser ablation, flame spray and thermal decomposition in plasma.
Chemical methods include sol–gel processing, solution combustion decomposition
and vapor deposition. Most of the chemical methods have resulted in extremely low
yield rates, and thus cannot be adapted to mass manufacturing. Physical methods like
mechanical milling are not efficient as the size of the nanoparticles cannot be easily
controlled, and these methods are only limited to certain materials. Other methods
such as laser ablation, vapour deposition and sol-gel are very costly as they require
specialized equipment such as vacuum systems, high power lasers as well as
expensive precursor chemicals. Finally, most systems are only possible for a specific
range of materials.
In this work, we focused on the synthesis nanoparticles by flame spray
pyrolysis (FSP), it can be seen that this method is a simple and clean method to
produce a large amount of various nanoparticles in a short time is desirable for
practical purpose. The nanoparticles products by FSP technique have shown high
surface-area and high purity. The FSP can be control characteristics for synthetic
Page 30
16
nanoparticles which controlled by fuel composition, oxidant dispersion gas flow rate,
the type of oxidant dispersion gas used, production rate, precursor feed rate, precursor
concentration and the type of precursor used [35, 36, 37]. O. Mekasuwandumrong et
al. [38] studied the Pd/TiO2 nanoparticles were synthesized by flame spray pyrolysis
(FSP) under different flame condition (varying precursor concentration and the feed
flow rate). The particle size of Pd/TiO2 increased with increasing precursor
concentration and feed flow rate. The BET surface areas and percentages of anatase
phase decreased with increasing particle size of Pd/TiO2. The active sites of the
Pd/TiO2 catalysts were increased with increasing TiO2 crystallite size and Pd cluster
size. It is suggested that coverage of Pd surface by the formation of TiO2 groups
occurred more easily when the Pd/PdO2 cluster was smaller resulted from shorter
residence time in flame and lower combustion energy during FSP.
The concentrations of the spray solution were investigated by H.Y. Koo et al.
[39]. They were studied the effect of mean particle size of the silver-glass composite
powders by controlling the precursor concentrations. Figure 3.1 shows SEM images
and size distributions of the silver-glass composite powders prepared from spray
solutions with 0.1M and 3 M. The mean particle size increased from 45-75 nm with
an increase in the precursor concentration from 0.1-3 M. The mean particle size of the
powders formed by nucleation and growth mechanism increased with an increase in
the concentration of the evaporated vapors. The increase in the concentration of the
spray solution increases the concentration of the vapors inside the diffusion flame.
Therefore, the mean particle size of the composite powders increased with an increase
in the concentration of the spray solution.
Page 31
17
Figure 3.1 FE-SEM images and size distributions of the silver-glass composite
powders prepared from spray solutions with 0.1 M and 3 M
concentrations. (H.Y. Koo et al., 2011)
The types of spray solution affect the formation of particle in the flame spray
pyrolysis. It was investigated by varying percentages of ethyl alcohol in the solution
was changed from 0% to 30%. The silver and glass components diluted with mixture
of ethyl alcohol and distilled water to a 0.5 M solution. The particle size of silver–
glass composite powders decreased (42 to 22 nm) with increasing percentages of ethyl
alcohol (0 to 30% EtOH). Increasing the percentages of ethyl alcohol will increase
energy to flame and synthesis zone. The higher temperature will cause agglomeration
to occur more readily, small particle resulted [40].
Page 32
18
The effect of various precursors using a flame spray pyrolysis (FSP) was
investigated. Ceria particles were prepared using FSP which provided by different
cerium precursors including cerium (IV) ammonium nitrate (CeAN), cerium (III)
acetate hydrate (CeA) and cerium (III) nitrate hydrate (CeN) The morphology of the
ceria nanoparticles from CeAN, CeA and CeN precursors showed in Figure 3.2. The
ceria particles prepared from CeAN showed solid spherical due to good solubility of
CeAN in solution which the ammonium nitrate make a surfactant to form micelles.
Therefore, the ammonium nitrate and water surrounded outside of the cerium, known
as the formation mechanism of volume precipitation of cerium. The particles prepared
from CeA showed the hollow structures of open pores due to the formation of surface
precipitation before extraction of non-metallic moieties. The CeN precursor was
shown close pores of the ceria particles. Therefore, the formation of particle structures
was involved both volume precipitation and surface precipitation resulting in different
morphological ceria particles. The detail about the formation mechanism of the
morphology of ceria particles from three precursors was shown in Figure 3.2.
The nanostructures with different morphologies from flame synthesis such as
hollow spheres, core-in-shell structures and carbon tubes were investigated. F.
Krumeich [41] have prepared ZnO nanorods with control of ratio (ratio of length to
width) and vary of metal-doped (In, Sn, Li) by flame spray pyrolysis (FSP). In and Sn
dopants have effect ZnO crystal and incorporated into lattice. The ZnO particles show
rodlike shape with increasing dopant concentration of In and Sn. Moreover, the
specific surface area for In- and Sn-doped ZnO increased with dopant concentration.
The nanorod formation with In and Sn occurs by annealing crystallization during
flame cooling.
Page 33
19
Figure 3.2 The schematic diagram illustrating the formation mechanism of the
morphologies of ceria particles from the three precursors (CeA, CeN
and CeAN) by FSP and TEM images. (F. Kruneich, 2006)
S.J Shih et al. [42] studied the nickel-doped ceria (NDC) nanoparticles and
yttrium-doped ceria (YDC) particles were prepared by flame spray pyrolysis. Figure
3.3 show the TEM micrographs of the NDC particles. The shapes of the particles
presented solid sphere and hollow sphere. Figure 3.3a show particles with diameters
less than ~100 nm were solid and polycrystalline. The hollow sphere showed in figure
3.3b and it clear in Figure 3.3c. The results from TEM showed that the particle
diameters were about 250 nm were prepared by FSP display hollow and rough
spherical with smooth surfaces. While the particle diameters were above 250 nm
displays uneven and concave surfaces.
Page 34
20
Figure 3.3 TEM micrographs of the NDC particles with different diameters,
(a) ~30 nm, (b) ~150 nm and (c) ~250–500 nm. (S.J Shih et al., 2009)
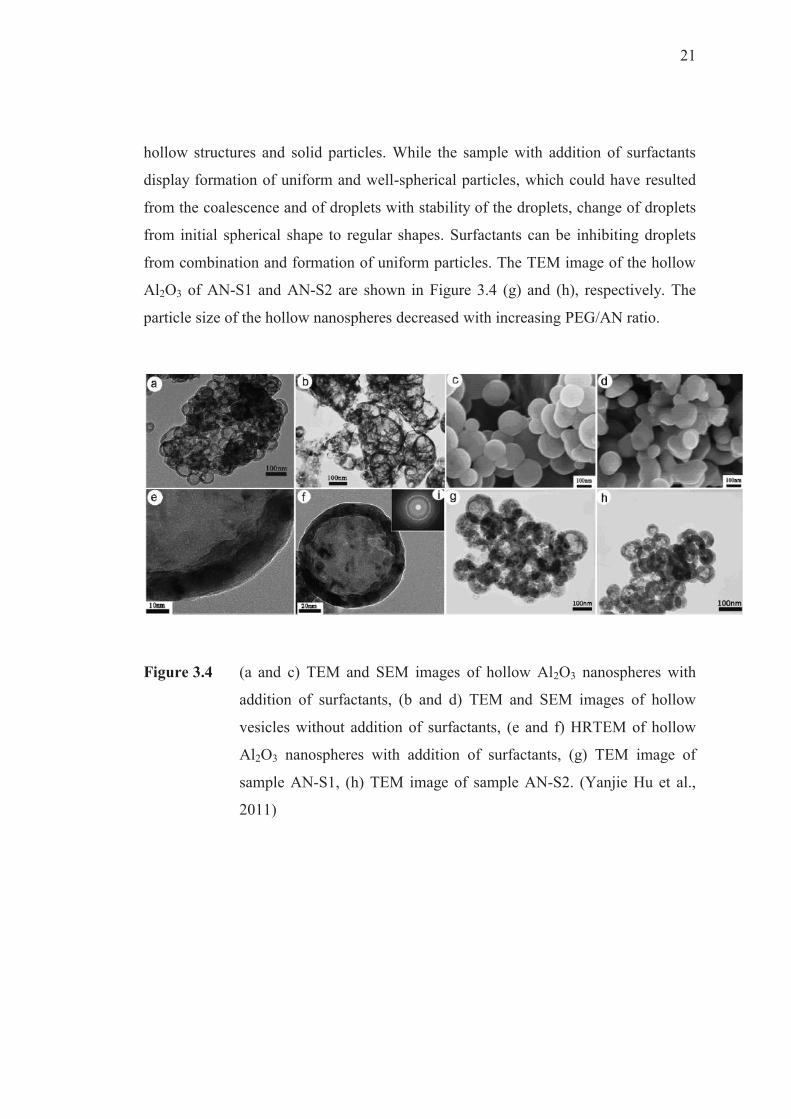
Yanjie Hu. et al. [43] have prepared Al2O3 hollow structure by addition of
surfactants in flame spray pyrolysis. TEM and SEM image of Al2O3 hollow structure
were shown in figure 3.4. The liquid feed was mixture of hydrated aluminum nitrate
(AN) and ethanol with addition of polyethylene glycol (PEG-2000) as the surfactant.
Moreover, they have studies the molar ratio between PEG-2000 and AN was 0.02 and
0.03 which using symbol as AN-S1 and AN-S2, respectively. The liquid precursor
was fed in flame spray pyrolysis. The TEM images in Figure 3.4 (a) display the
morphology of hollow Al2O3 structure by addition of PEG-2000 and Figure 3.4 (b)
display the hollow vesicles without addition of PEG-2000. The sample shows the
hollow nanospheres is about 80 nm and shell thickness about 10 nm (Figure 3.4, f and
e). The structures of the nanospheres with and without surfactants SEM images shown
in Figure 3.4 (c) and (d), respectively. The hollow Al2O3 nanosphere without addition
of surfactants illustrates an inhomogeneous mixture of large hollow vesicles, small
Page 35
21
hollow structures and solid particles. While the sample with addition of surfactants
display formation of uniform and well-spherical particles, which could have resulted
from the coalescence and of droplets with stability of the droplets, change of droplets
from initial spherical shape to regular shapes. Surfactants can be inhibiting droplets
from combination and formation of uniform particles. The TEM image of the hollow
Al2O3 of AN-S1 and AN-S2 are shown in Figure 3.4 (g) and (h), respectively. The
particle size of the hollow nanospheres decreased with increasing PEG/AN ratio.
Figure 3.4 (a and c) TEM and SEM images of hollow Al2O3 nanospheres with
addition of surfactants, (b and d) TEM and SEM images of hollow
vesicles without addition of surfactants, (e and f) HRTEM of hollow
Al2O3 nanospheres with addition of surfactants, (g) TEM image of
sample AN-S1, (h) TEM image of sample AN-S2. (Yanjie Hu et al.,
2011)
Page 36
22
CHAPTER IV
EXPERIMENT
In this chapter, the details of the experimental system and procedures used in
this research are explained. These topics are classified into three sections. The
procedure for catalyst preparation by flame spray pyrolysis and wet impregnation
method are first presented in section 4.1. Subsequently, section 4.2 explains
characterization techniques including x-ray diffraction (XRD) analysis and
temperature programmed reduction (TPR). Finally, a detail procedure for catalyst
evaluation in hydrogen production from methanol is explained.
Page 37
23
4.1 Catalyst Preparation
The chemicals used in this research are all analytical grades as listed in table 4.1.
Table 4.1 The details of chemical used in the catalyst preparation.
4.1.1 Preparation by flame spray pyrolysis
Copper (II) nitrate and aluminium nitrate were used as the feed precursor
which diluted in ethanol 0.5 M solution for Cu-Al2O3 based catalyst. Cerium (III)
nitrate and zinc nitrate were used as the feed precursor of promoter. The calculation of
chemical content was explained in Appendix B. The mixed of precursor and solvent
were injected through the center capillary of the FSP nozzle by a syringe pump at 5
ml/min, which was fed oxygen for dispersion of solution at 5 ml/min. The pressure
drop at the nozzles allows the synthesis was held constant at 1.5 bar by adjusting the
orifice gap area at the nozzle. The catalyst powder was collected on a glass microfiber
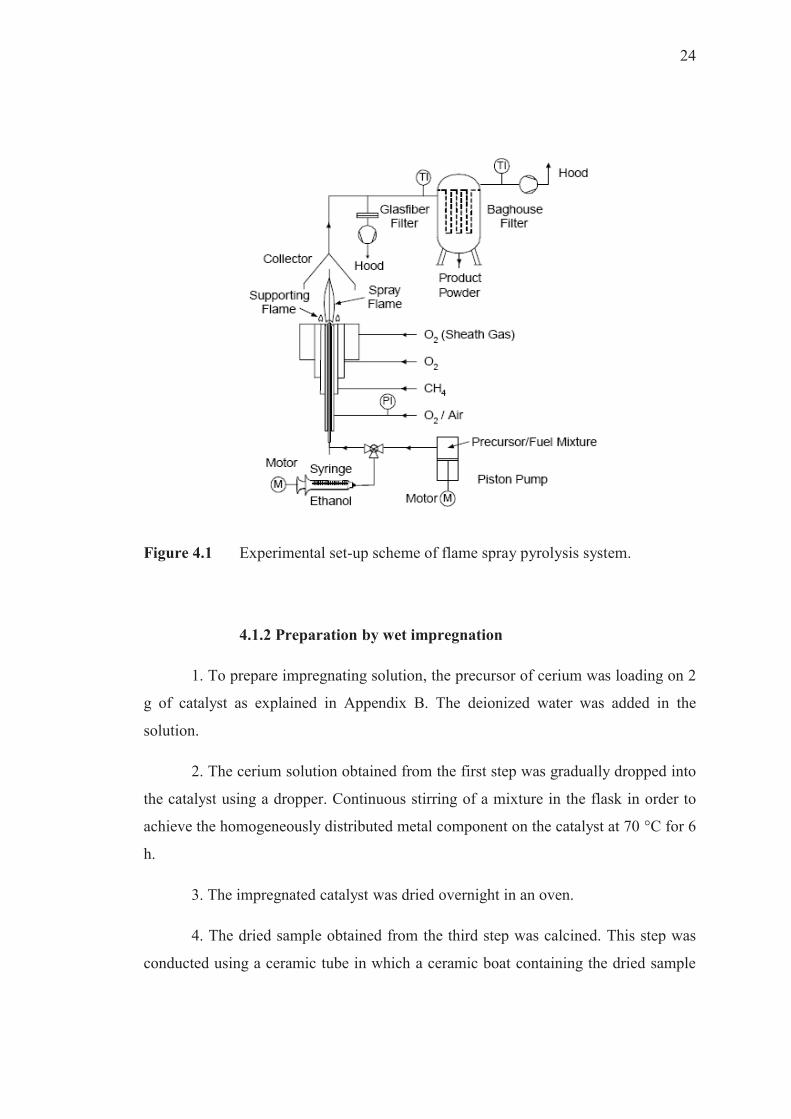
filter (Whatman) with the aid of a vacuum pump. The equipment of flame spray
pyrolysis system is showed in figure 4.1.
Chemicals Formula Grade (%) Manufacture
Copper (II) nitrate Cu(NO3)2.2.5H2O 99.0 Ajax Finechem Pty Ltd
Zinc nitrate Zn(NO3)2.6H2O 98.0 Ajax Finechem Pty Ltd
Aluminium nitrate Al(NO3)3.9H2O 98.0 Fluka
Cerium (III) nitrate CeN3O9.6H2O 99.0 Aldrich
Ethanol C2H5OH 99.9 SSCV Corporation
Page 38
24
Figure 4.1 Experimental set-up scheme of flame spray pyrolysis system.
4.1.2 Preparation by wet impregnation
1. To prepare impregnating solution, the precursor of cerium was loading on 2
g of catalyst as explained in Appendix B. The deionized water was added in the
solution.
2. The cerium solution obtained from the first step was gradually dropped into
the catalyst using a dropper. Continuous stirring of a mixture in the flask in order to
achieve the homogeneously distributed metal component on the catalyst at 70 °C for 6
h.
3. The impregnated catalyst was dried overnight in an oven.
4. The dried sample obtained from the third step was calcined. This step was
conducted using a ceramic tube in which a ceramic boat containing the dried sample
Page 39
25
was placed. This sample was heated under air at a flow rate of 30 ml/min with a
heating rate of 10 °C/min from room temperature to 350 °C and held for 5 h.
5. After the calcined sample was cooled down, it was stored in a glass bottle
for further use.
4.2 Catalyst Characterization
4.2.1 X-ray diffraction analysis
The bulk crystal structure, crystalline size, compounds and chemical phase
composition can be analyzed using X-ray diffractometer SIEMENS D-5000, X-ray
diffractometer of Ni-filtered Cu Kα connected with a computer with Diffract ZT
version 3.3 program for fully control of the XRD analyzer. The XRD patterns were
recorded in the range 2θ from 20 to 80°. The crystallite sizes were concluded from
XRD data using the Scherrer equation and α-Al2O3 was used as standard. The
instrument has been located at Center of Excellence on Catalysis and Catalytic
Reaction, Faculty of Science, Silpakorn University.
4.2.2 Temperature Programmed Reduction (TPR)
The temperature programmed reduction was used to determine bulk reduction
behavior and the reducibility of each catalyst. The hydrogen consumption was
measured by using a Micrometritics AutoChem II 2910 instrument. A 0.1 g of a
catalyst sample is placed in a quartz tubular reactor. Under nitrogen atmosphere at a
flow rate of 25 ml/min, the catalyst sample was heated up to 150°C and held 1 h in
order to eliminate the adsorbed water. After that, the system is cooled down to room
temperature. The reduction step is performed under 10% H2 in N2 flow of 25 ml/min
from room temperature to 800 °C at a heating rate of 10 °C/min.
Page 40
26
4.3 Catalyst Activity
The catalytic activity was tested using hydrogen production from methanol.
The gases used in this test are listed in table 4.2. They were all supplied by Thai
industrial gas limited.
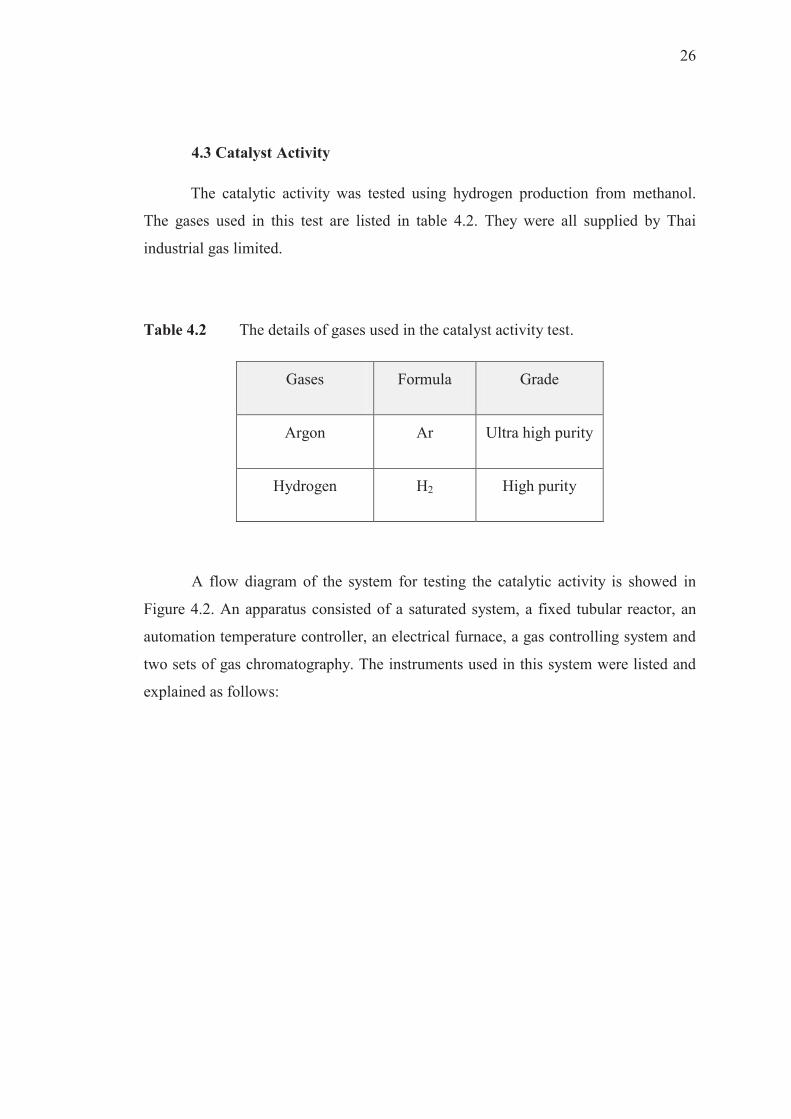
Table 4.2 The details of gases used in the catalyst activity test.
Gases Formula Grade
Argon Ar Ultra high purity
Hydrogen H2 High purity
A flow diagram of the system for testing the catalytic activity is showed in
Figure 4.2. An apparatus consisted of a saturated system, a fixed tubular reactor, an
automation temperature controller, an electrical furnace, a gas controlling system and
two sets of gas chromatography. The instruments used in this system were listed and
explained as follows:
Page 41
27
Figure 4.2 Schematic diagram of the reaction and line for testing analyzed by GC-
TCD and GC-FID equipped with Porapak Q and DB-1 column,
respectively.
1. Saturated system: Liquid reactants, methanol and water, were loaded in
glass chamber set on plate which was controlled by temperature controller at 150 °C
2. Reactor: All reactions were tested using the conventional micro-reactor
made from stainless steel tube with 0.95 cm inside diameter. Catalyst sample was
placed between two quartz wool layers. The reaction was carried out under ordinary
gas flow and atmospheric pressure. The effluent gases were sampled and analyzed by
on-line gas chromatography.
3. Automation Temperature Controller: This unit consisted of a magnetic
switch connected to a variable voltage transformer and a solid state relay temperature
controller connected to a thermocouple. Reactor temperature was measured at the
bottom of the catalyst bed in the reactor. The set point of temperature control was
adjustable within the range of 0 to 800 °C at the maximum voltage output of 220 volt.
4. Electrical furnace: The furnace supplied the required heat to the reactor.
The reactor could be operated from room temperature up to 800 °C at the maximum
voltage of 220 volt.
Page 42
28
5. Gas Controlling System: The flow rate of each gas used in this study was
controlled by a gas controlling system which consisted of pressure regulators and
metering valves.
6. Gas Chromatograph: The compositions of hydrocarbons in the product
stream were analyzed by two Shimadzu GC-14B gas chromatographs. One was
equipped with a thermal conductivity detector and another was equipped with a flame
ionization detector. The operating conditions for each instrument are shown in the
tables 3.3 and 3.4, respectively.
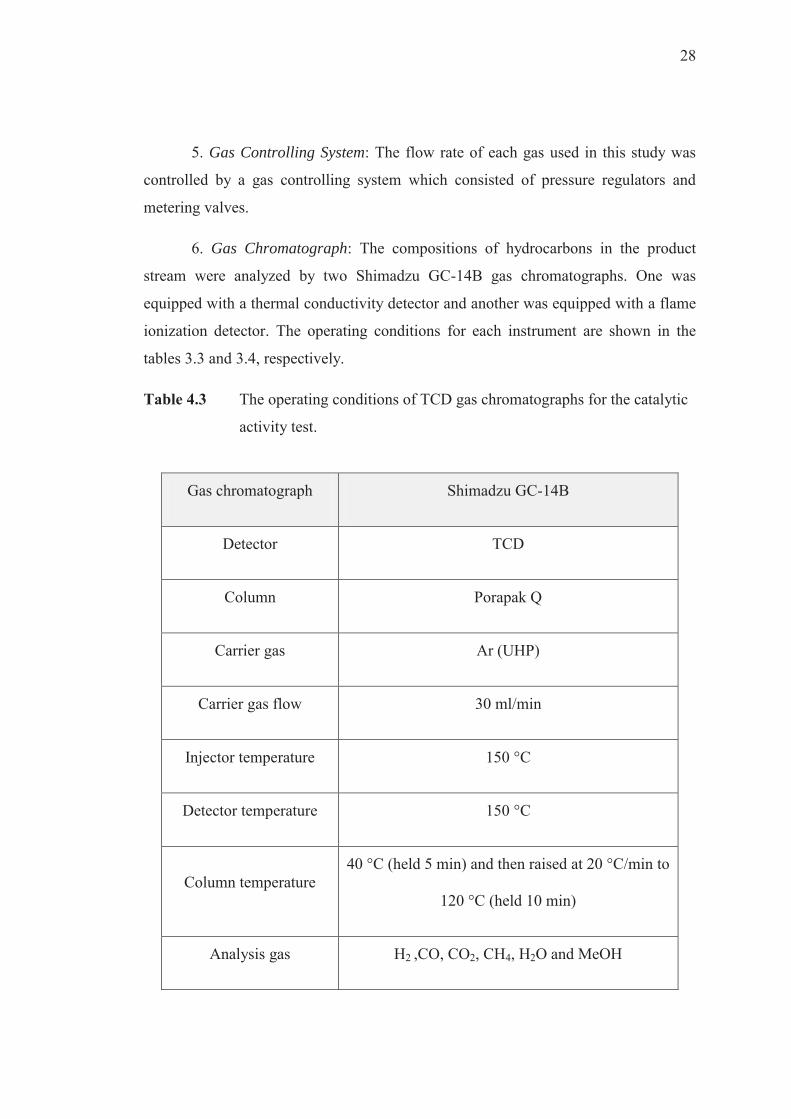
Table 4.3 The operating conditions of TCD gas chromatographs for the catalytic
activity test.
Gas chromatograph Shimadzu GC-14B
Detector TCD
Column Porapak Q
Carrier gas Ar (UHP)
Carrier gas flow 30 ml/min
Injector temperature 150 °C
Detector temperature 150 °C
Column temperature 40 °C (held 5 min) and then raised at 20 °C/min to
120 °C (held 10 min)
Analysis gas H2 ,CO, CO2, CH4, H2O and MeOH
Page 43
29
Table 4.4 The operating conditions of FID gas chromatographs for the catalytic
activity test.
Gas chromatograph Shimadzu GC-14B
Detector FID
Column DB-1
Carrier gas N2 (UHP)
Split/Splitless Split (40 ml/min)
Purge flow rate 10 ml/min
Carrier pressure 40 kPa
Make up pressure 50 kPa
Injector temperature 200 °C
Detector temperature 200 °C
Column temperature 40 °C
Analysis gas MeOH, Hydrocarbons
Page 44
30
4.3.1 Catalytic activity of hydrogen production from methanol
Catalytic activities of all samples for hydrogen production from methanol
were studied at a steady state in a fixed-bed reactor with an on-line GC. For each
experiment, 0.2 ml of the catalyst was packed in a fixed bed tubular reactor. Checking
feed containing the liquid methanol and water at furnace temperature is 100 C, a
heating rate of 10 C/min from room temperature then fed argon at a flow rate 50
ml/min through the saturator containing the liquid methanol and water. Prior to the
catalytic activity test, the catalyst was pretreated with argon at 350 C for 1 h and
reduced by hydrogen at 300 C for 1 h. After that, cool down by argon at 200 C. The
experiments were performed at atmospheric pressure, and range of temperature was
200-350 C which increased by 25 °C. The reactant feed was consisted of methanol
and water that was introduced into the reactor by argon and the product samples were
collected at 30 min in each temperature. The composition of the effluent was
measured by online gas chromatograph equipment, GC-TCD with Porapak Q column
and GC-FID with DB-1 column.
Page 45
31
CHAPTER V
RESULTS AND DISCUSSION
The effect of cerium oxide on copper-alumina and copper-zinc oxide-alumina
catalyst prepared by flame spray pyrolysis which characterized and evaluated in
hydrogen production from methanol. The results and discussion in this chapter were
divided into two parts. In the first part, the catalytic properties and performances of
hydrogen production from methanol of Cu-Al2O3 which promoted with CeO2 using
percentages loading as 1, 3, 5 and 10 wt.%. The effect of CeO2 promoter on Cu-ZnO-
Al2O3 in FSP catalysts were various ZnO loading which evaluated in the second part.
5.1 The physical and chemical properties of CeO2 on Cu-Al2O3 catalysts
prepared by flame spray pyrolysis on hydrogen production from methanol.
In first part, the catalysts containing Cu on Al2O3 supported which various Cu
loading as 10-50 wt.% were studied. The appropriate percentage of copper was
selected to promoted with CeO2 using percentages loading as 1, 3, 5 and 10 wt.%. The
catalytic properties were characterized by various methods. The phase identification
and the average crystalline size were determined by the X-ray diffraction technique
(XRD). The temperature programmed reduction (TPR) exhibited reduction behavior
and reducibility of the catalysts.
Page 46
32
5.1.1 The phase analysis by X-ray diffraction (XRD)
XRD patterns of the Cu-Al2O3 catalysts with different copper loading are
shown in Figure 5.1. The XRD pattern has shown the presence of CuO, -Al2O3 and
CuAl2O4 species. Patel and Pant [44] have concluded that the presence of alumina
enhances the dispersion of CuO species by the stabilization of isolated Cu2+ ions in
their matrix, and moderately by the formation of spinel like CuAl2O4. When increase
copper loading, the XRD peaks corresponding to CuO crystal phases were observed
and the intensity increased with the increasing copper loading and 50Cu-Al catalyst
showed the highest peak intensity, in agreement with the literature [45, 46].
Figure 5.1 XRD patterns of the Cu-Al2O3 catalysts.
Table 5.1 shows crystallite size of all species visible in the XRD spectra
calculated using the Sherrer equation. The crystallite size of CuO was also increased
by the addition of copper oxide, that is, the sizes were 2.4 nm for 10 wt.% CuO, 10.8
nm for 20 wt.% , 13.8 nm for 30 wt.%, 16.5 nm for 40 wt.% and 17.2 nm for 50 wt.%.
Moreover, the crystallite size of CuAl2O4 for 50Cu-Al catalyst was 13.7 nm while the
crystallite size of others catalysts about 5.4-7.4 nm.
Page 47
33
Table 5.1 The crystalline size of Cu-Al2O3 catalysts.
5.1.2 Reductive behavior of copper oxides by TPR
Figure 5.2 TPR profiles of Cu-Al2O3 catalysts.
Catalysts
Crystalline size (nm)
CuO -Al2O3 CuAl2O4
10Cu-Al 2.4 30.5 7.4
20Cu-Al 10.8 25.0 5.9
30Cu-Al 13.8 27.3 5.4
40Cu-Al 16.5 29.5 6.0
50Cu-Al 17.2 23.2 13.7
Page 48
34
The reduction properties of Cu-Al2O3 catalysts were investigated by H2–TPR
experiments and profiles are shown in Figure 5.2. The TPR profiles revealed the
reducibility of CuO in the Cu-Al2O3 catalysts which are shown in table 5.2. The TPR
profiles of all catalysts showed two reduction peaks, which included one lower
reduction temperature peak (the shoulder peak) and one higher reduction temperature
peak (the main peak). The two reduction peaks were due to the reduction of different
Cu species. These two copper species could be a highly dispersed copper phase
together with larger copper particles [47, 22]. Both peak area and peak intensity
increased significantly with increasing copper content and also the maximum peak
temperatures shifted to high temperature region with copper content, from 204 ºC for
10Cu-Al to 276 ºC for 50Cu-Al. This is in accordance with the results of
Gunawardana et al. [45] and Pérez-Hernandez et al. [48], who also observed that the
maximum peak temperatures shifted to high temperatures with increasing copper
content.
Table 5.2 The reducibility of Cu-Al2O3 catalysts.
5.1.3 The catalytic activity of Cu-Al2O3 catalysts prepared by
flame spray pyrolysis on hydrogen production from methanol.
Figure 5.3-5.6 shows the results of the methanol steam reforming over Cu-
Al2O3 prepared by flame spray pyrolysis. The catalyst activities, expressed as the
methanol conversion as a function of reaction temperature, is shown for the various
copper loading on Cu-Al2O3 catalysts in Figure 5.3. On all the samples, methanol
conversion starts above 200 ºC. The optimum Cu loading was 20% indicating the
highest methanol conversion and H2 production rate. On the other hand, the 50Cu-Al
catalyst had the lowest catalytic activity. The methanol conversion was only 9.8% at
Catalysts 10Cu-Al 20Cu-Al 30Cu-Al 40Cu-Al 50Cu-Al
% Reducibility 79.9 81.4 85.9 86.3 84.4
Page 49
35
350 ºC. For these catalysts the excessive loading of copper did not perform well
which might be due to formation of larger copper crystallites that resulted in low
surface area or due to formation of larger CuAl2O4.
Figure 5.3 MeOH conversion on Cu-Al2O3 catalysts in range 200-350 °C.
Figure 5.4 H2 production rate on Cu-Al2O3 catalysts in range 200-350 °C.
Page 50
36
Figure 5.5 The H2/CO2 ratio on Cu-Al2O3 catalysts in range 275-350 °C.
Over all the tested Cu-Al2O3 catalysts, HC and CH4 were detected as a by-
product. H2/CO2 ratio was obtained 2.6-2.7 (Figure 5.5) for 20Cu-Al which
theoretical results H2/CO2 was 3. These results reveal that unfavorable reactions such
as CO hydrogenation have influence on the performance of the methanol steam
reforming. When copper loading was increased, the quantity of the by-products
detected increased. Thus, the by-product formation is also directly related to the
copper loading in the catalysts.
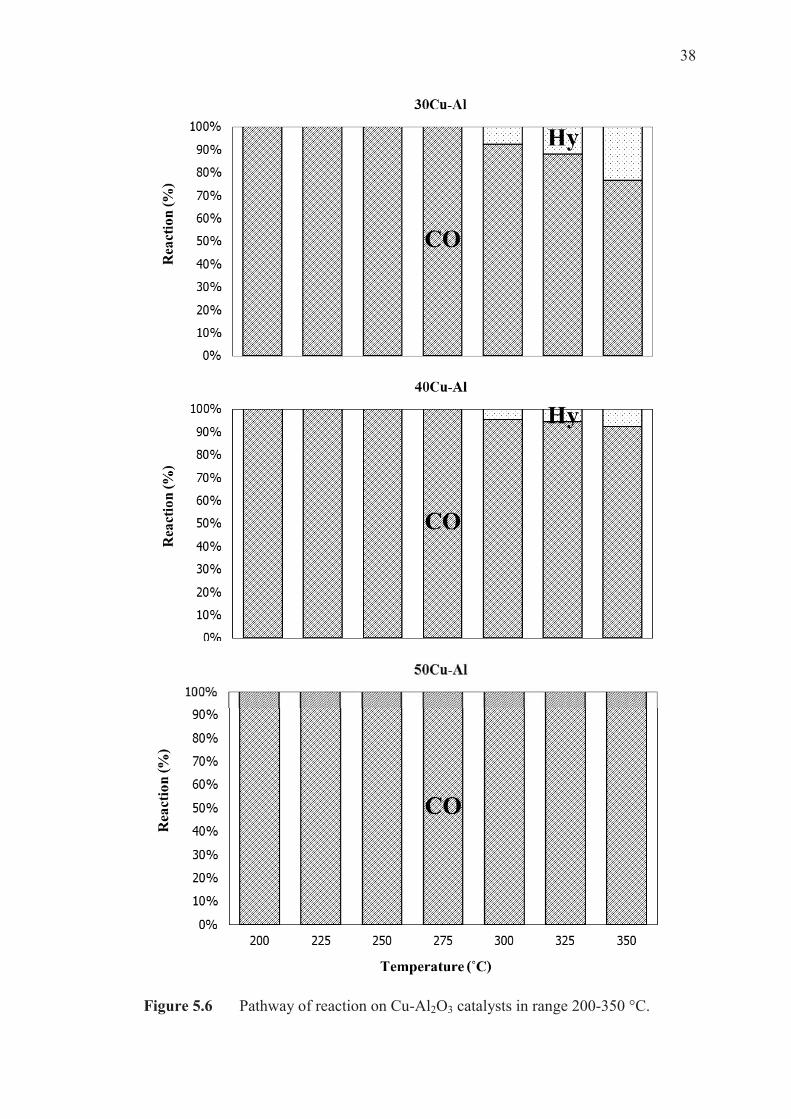
The route of CO and CO2 formation was investigated in our experiments
(Figure 5.6). If the mechanism of the methanol decomposition (DM) followed by
water gas shift reaction (WGS) was assumed, CO should be firstly formed by DM,
subsequently converted into CO2 in the WGS reaction. According to the mechanism,
the CO formation of all catalysts indicated that the catalysts favored methanol
decomposition at low temperature consistent with the formation of quantities of CO2
is observed only above 275 ºC for 10Cu-Al and 20Cu-Al. The CO2 production over
only 10Cu-Al and 20Cu-Al catalysts indicated the different catalytic behavior of low
and high Cu loading. For high Cu loading, an amount of CH4 was detected over
catalysts decreased while increasing the copper content.
Page 51
37
CH3OH 2H2 + CO (DM)
CO + H2O H2 + CO2 (WGS)
CO + 3H2 CH4 + H2O (CO hydrogenation)
Page 52
38
Figure 5.6 Pathway of reaction on Cu-Al2O3 catalysts in range 200-350 °C.
Page 53
39
Thus, we have studied the effect of CeO2 promoter on 20Cu-Al catalyst by
various percentages of CeO2 loading as 1, 3, 5 and 10 wt.% to improve the catalytic
properties and performances of hydrogen production from methanol of 20Cu-Al
catalyst.
5.1.4 The phase analysis by X-ray diffraction (XRD)
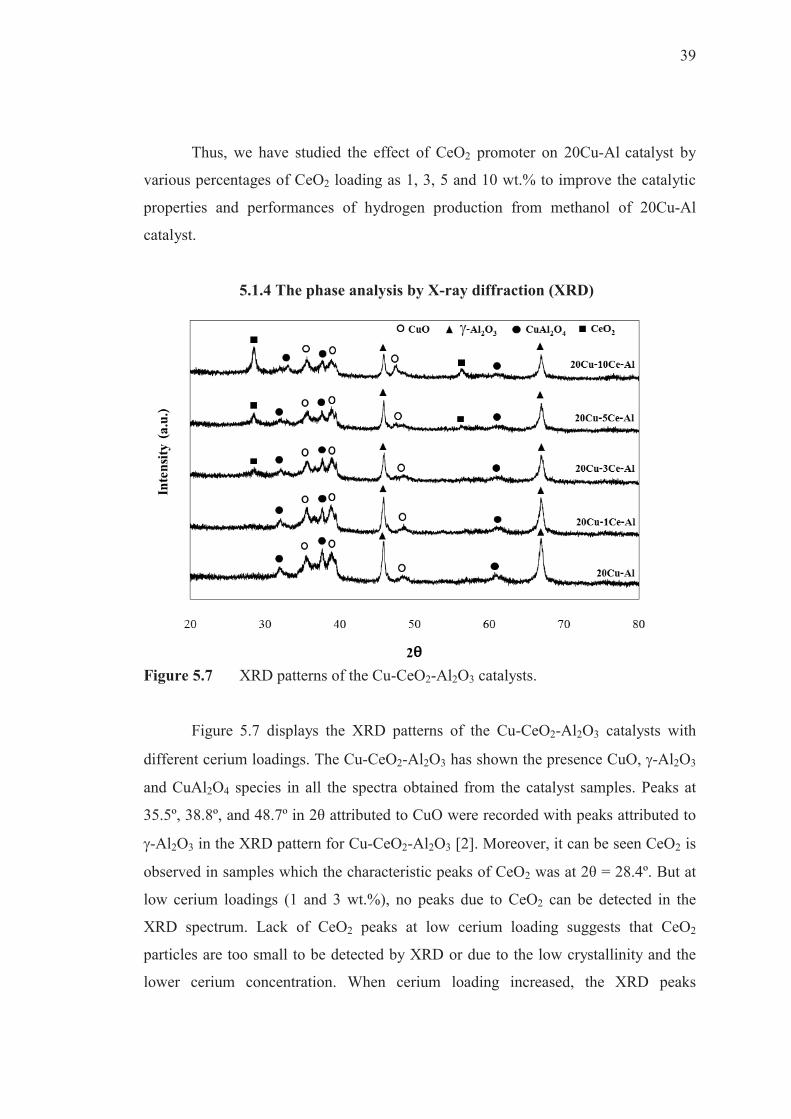
Figure 5.7 XRD patterns of the Cu-CeO2-Al2O3 catalysts.
Figure 5.7 displays the XRD patterns of the Cu-CeO2-Al2O3 catalysts with
different cerium loadings. The Cu-CeO2-Al2O3 has shown the presence CuO, -Al2O3
and CuAl2O4 species in all the spectra obtained from the catalyst samples. Peaks at
35.5º, 38.8º, and 48.7º in 2θ attributed to CuO were recorded with peaks attributed to
-Al2O3 in the XRD pattern for Cu-CeO2-Al2O3 [2]. Moreover, it can be seen CeO2 is
observed in samples which the characteristic peaks of CeO2 was at 2θ = 28.4º. But at
low cerium loadings (1 and 3 wt.%), no peaks due to CeO2 can be detected in the
XRD spectrum. Lack of CeO2 peaks at low cerium loading suggests that CeO2
particles are too small to be detected by XRD or due to the low crystallinity and the
lower cerium concentration. When cerium loading increased, the XRD peaks
Page 54
40
corresponding to CeO2 crystal phases were observed and the intensity increased with
the increasing cerium loading.
Table 5.3 The crystalline size of Cu-CeO2-Al2O3 catalysts.
Table 5.3 displays the crystalline size of Cu-CeO2-Al2O3 catalysts. When low
CeO2 loading was added to Cu-Al2O3, the diffraction patterns of CuO weakened and
widened, indicating that the crystallite size of CuO decreased and the dispersion of
CuO was improved in the catalysts. The mean crystallite size of CuO was calculated
to about 5.5-13.0 nm from the peak at 48.7 using Scherrer equation.
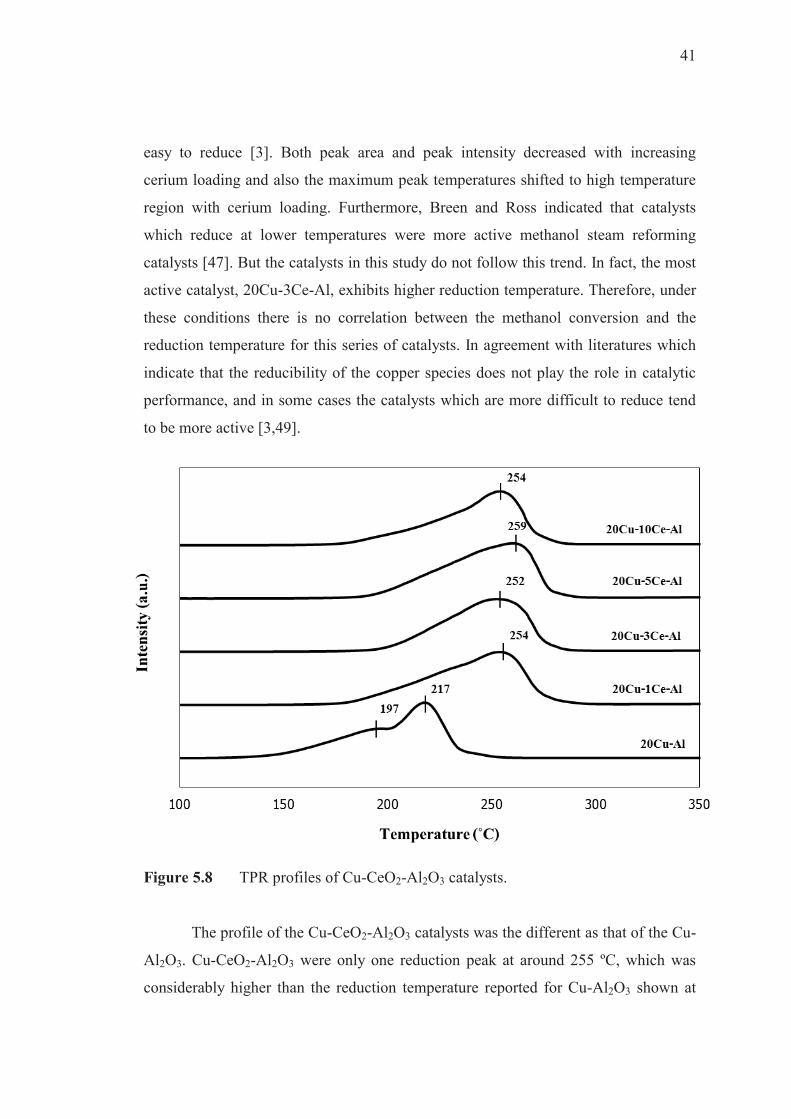
5.1.5 Reductive behavior of copper oxides by TPR
Temperature programmed reduction (TPR) was performed in order to
determine the reduction behaviors. The effect of cerium loading on the catalyst
reducibility was also verified and discussed. Figure 5.8 shows the TPR profiles of Cu-
CeO2-Al2O3 catalysts at different cerium loading. It is evident that all CeO2-
containing catalysts are reduced at higher temperatures compared to Cu-Al2O3
catalyst. This is surprising, since addition of CeO2 usually results in catalysts that are
Catalysts
Crystalline size (nm)
CuO -Al2O3 CuAl2O4 CeO2
20Cu-Al 10.8 25.0 5.9 -
20Cu-1Ce-Al 9.6 25.0 6.1 n.d.
20Cu-3Ce-Al 5.5 24.1 7.0 n.d.
20Cu-5Ce-Al 8.0 52.1 6.6 16.1
20Cu-10Ce-Al 13.0 28.3 8.0 17.6
Page 55
41
easy to reduce [3]. Both peak area and peak intensity decreased with increasing
cerium loading and also the maximum peak temperatures shifted to high temperature
region with cerium loading. Furthermore, Breen and Ross indicated that catalysts
which reduce at lower temperatures were more active methanol steam reforming
catalysts [47]. But the catalysts in this study do not follow this trend. In fact, the most
active catalyst, 20Cu-3Ce-Al, exhibits higher reduction temperature. Therefore, under
these conditions there is no correlation between the methanol conversion and the
reduction temperature for this series of catalysts. In agreement with literatures which
indicate that the reducibility of the copper species does not play the role in catalytic
performance, and in some cases the catalysts which are more difficult to reduce tend
to be more active [3,49].
Figure 5.8 TPR profiles of Cu-CeO2-Al2O3 catalysts.
The profile of the Cu-CeO2-Al2O3 catalysts was the different as that of the Cu-
Al2O3. Cu-CeO2-Al2O3 were only one reduction peak at around 255 ºC, which was
considerably higher than the reduction temperature reported for Cu-Al2O3 shown at
Page 56
42
around 217 ºC. For the Cu-Al2O3 catalyst, the TPR profiles of the catalysts showed
two reduction peaks, which included one lower reduction temperature peak (the
shoulder peak) and one higher reduction temperature peak (the main peak). The two
reduction peaks were due to the reduction of different Cu species. The shoulder peak
is attributed to reduction of highly dispersed CuO species, the main peak is attributed
to the reduction of bulk CuO species [50].
Table 5.4 The reducibility of Cu-CeO2-Al2O3 catalysts.
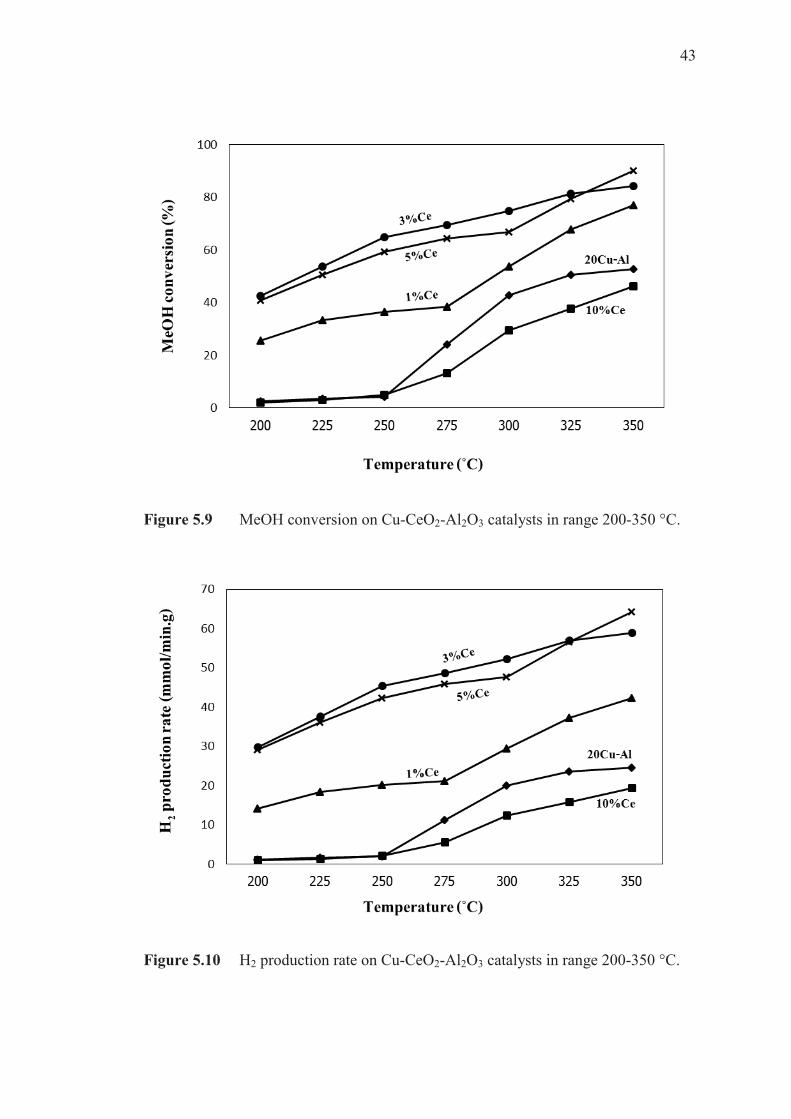
5.1.6 The catalytic activity of CeO2 on Cu-Al2O3 catalysts prepared
by flame spray pyrolysis on hydrogen production from methanol.
Figures 5.9 show methanol conversion as a function of temperature on Cu-
CeO2-Al2O3 with various cerium loadings in range 200-350 °C. The methanol
conversion increased slightly with temperature increased. The 20Cu-3Ce-Al catalyst
exhibits the best performance of all catalysts in this series. Only at the highest
temperature (350 ºC) does the 20Cu-5Ce-Al catalyst have a slightly higher conversion
than the 20Cu-3Ce-Al catalyst. The 20Cu-10Ce-Al catalyst exhibits the poorest
performance of these catalysts with a maximum methanol conversion of 46%.
Addition CeO2 into Cu-Al2O3 slightly promoted the MSR reaction. The methanol
conversion increased compared to the Cu-Al2O3 catalyst at each reaction temperature.
It implied that the CeO2 was a suitable promoter for MSR reaction. However, the
excessive loading of CeO2 was leading to the lower activity which the H2 production
rate (Figure 5.10) seemed to have the same trends as the methanol conversion.
Catalysts 20Cu-Al 20Cu-1Ce-Al 20Cu-3Ce-Al 20Cu-5Ce-Al 20Cu-10Ce-Al
% Reducibility 81.4 90.4 90.7 91.4 93.3
Page 57
43
Figure 5.9 MeOH conversion on Cu-CeO2-Al2O3 catalysts in range 200-350 °C.
Figure 5.10 H2 production rate on Cu-CeO2-Al2O3 catalysts in range 200-350 °C.
Page 58
44
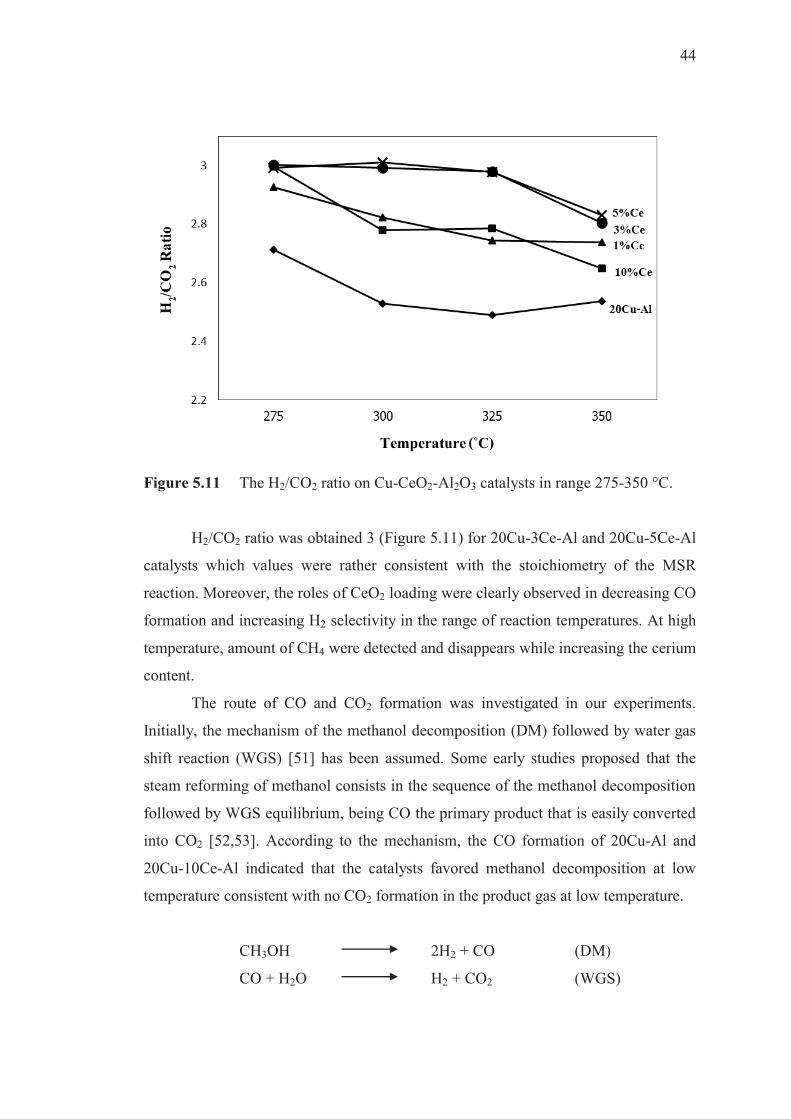
Figure 5.11 The H2/CO2 ratio on Cu-CeO2-Al2O3 catalysts in range 275-350 °C.
H2/CO2 ratio was obtained 3 (Figure 5.11) for 20Cu-3Ce-Al and 20Cu-5Ce-Al
catalysts which values were rather consistent with the stoichiometry of the MSR
reaction. Moreover, the roles of CeO2 loading were clearly observed in decreasing CO
formation and increasing H2 selectivity in the range of reaction temperatures. At high
temperature, amount of CH4 were detected and disappears while increasing the cerium
content.
The route of CO and CO2 formation was investigated in our experiments.
Initially, the mechanism of the methanol decomposition (DM) followed by water gas
shift reaction (WGS) [51] has been assumed. Some early studies proposed that the
steam reforming of methanol consists in the sequence of the methanol decomposition
followed by WGS equilibrium, being CO the primary product that is easily converted
into CO2 [52,53]. According to the mechanism, the CO formation of 20Cu-Al and
20Cu-10Ce-Al indicated that the catalysts favored methanol decomposition at low
temperature consistent with no CO2 formation in the product gas at low temperature.
CH3OH 2H2 + CO (DM)
CO + H2O H2 + CO2 (WGS)
Page 59
45
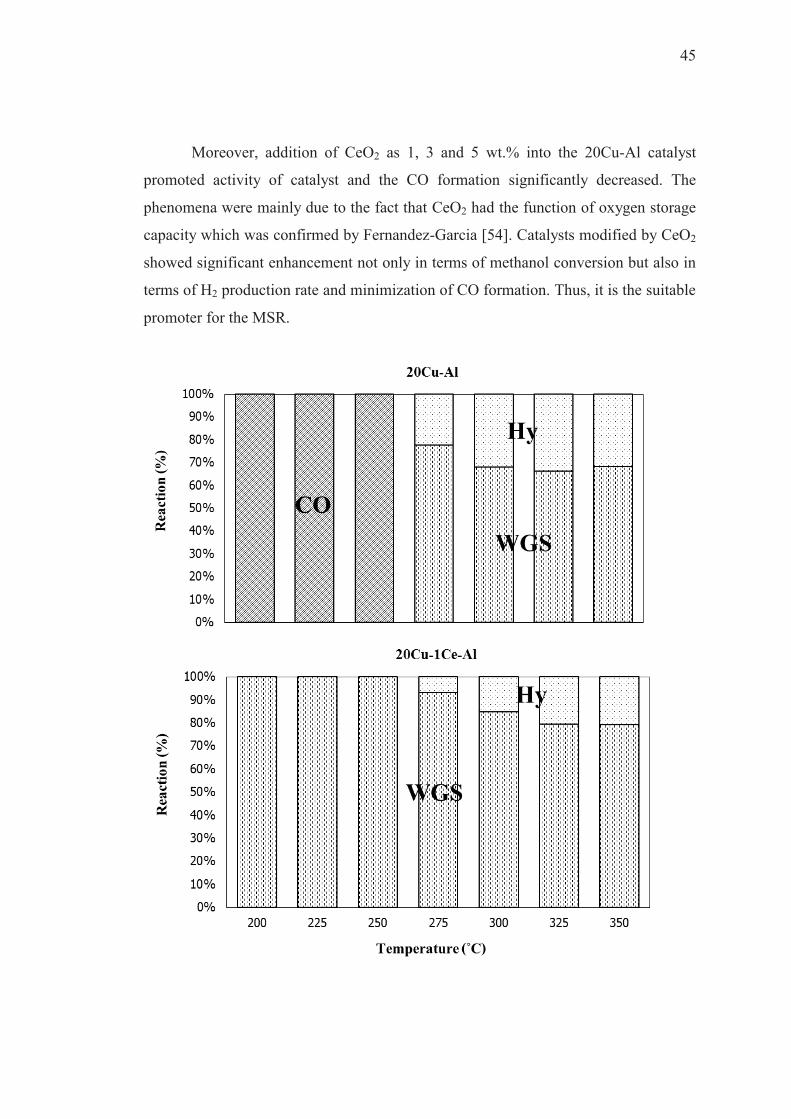
Moreover, addition of CeO2 as 1, 3 and 5 wt.% into the 20Cu-Al catalyst
promoted activity of catalyst and the CO formation significantly decreased. The
phenomena were mainly due to the fact that CeO2 had the function of oxygen storage
capacity which was confirmed by Fernandez-Garcia [54]. Catalysts modified by CeO2
showed significant enhancement not only in terms of methanol conversion but also in
terms of H2 production rate and minimization of CO formation. Thus, it is the suitable
promoter for the MSR.
Page 60
46
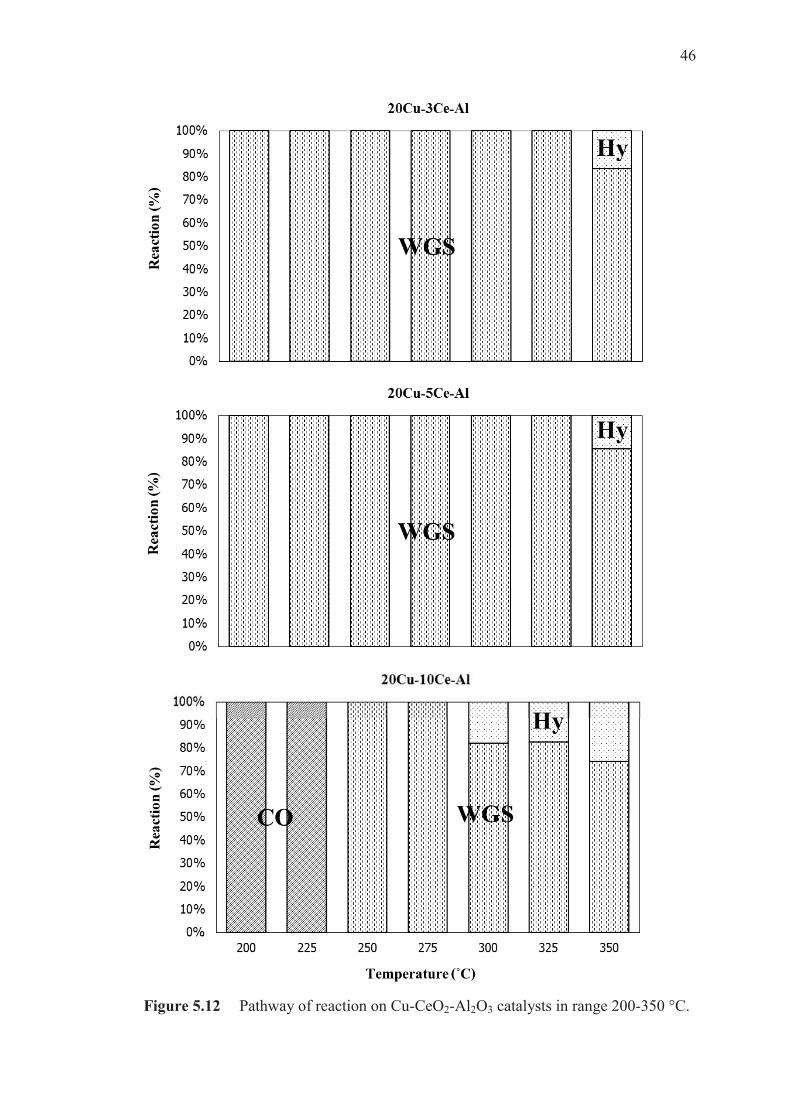
Figure 5.12 Pathway of reaction on Cu-CeO2-Al2O3 catalysts in range 200-350 °C.
Page 61
47
5.2 The physical and chemical properties of CeO2 on Cu-ZnO-Al2O3
catalysts prepared by flame spray pyrolysis on hydrogen production from
methanol.
In second part, we have studied the effect of CeO2 promoter on Cu-ZnO-Al2O3
catalysts by percentages of CeO2 loading as 3 wt.% because the 20Cu-3Ce-Al catalyst
exhibits the best performance of all catalysts in first part. Thus, in this part,
percentages of ZnO loading were various as 1, 3, and 10 wt.% to improve the
catalysts. The catalytic properties were characterized by various methods. The phase
identification and the average crystalline size were determined by the X-ray
diffraction technique (XRD). The temperature programmed reduction (TPR) exhibited
reduction behavior and reducibility of the catalysts.
5.2.1 The phase analysis by X-ray diffraction (XRD)
Figure 5.13 XRD patterns of the Cu-ZnO-Al2O3 catalysts.
Figure 5.13 shows the XRD spectra of the Cu-ZnO-Al2O3 catalysts at different
ZnO loading. There are peaks in the spectrum which corresponded to the CuO phase
Page 62
48
and a crystalline ZnO phase is present on the 20Cu-3Zn-Al and 20Cu-10Zn-Al
catalysts but not on the 20Cu-1Zn-Al catalyst. On the 20Cu-1Zn-Al the ZnO is below
the detection limit or is present in amorphous form. Meanwhile, the diffraction peaks
of CuO and ZnO evidently overlapped, and the part of ZnO diffraction peaks
disappeared. It indicated that the interaction between CuO and ZnO was strengthened.
There are peaks visible in the spectrum of all catalysts at 2Ɵ = 31.3º, 37.1º, 44.6º,
55.6º, 59.2º, and 65.1º which are not due to CuO or ZnO. The 2Ɵ values of the peaks
are consistent with those obtain from aluminate species such as CuAl2O4 or ZnAl2O4.
Since both the CuAl2O4 and ZnAl2O4 have nearly identical diffraction patterns is it
difficult to distinguish between the two in the XRD spectrum obtained from the
catalysts [7]. In first part, Cu-Al2O3 catalysts were characterized with XRD
measurements. We found that the presence of an aluminate phase was visible with
XRD in the Cu-Al2O3 catalysts. This result suggests that the aluminate phase seen in
the XRD spectra obtained from the all catalysts in this part is CuAl2O4 and not
ZnAl2O4.
Table 5.5 The crystalline size of Cu-ZnO-Al2O3 catalysts.
Table 5.5 shows crystallite size of all species visible in the XRD spectra
calculated using the Sherrer equation. The crystallite size of CuO was also increased
by the addition of zinc oxide, that is, the sizes were 7.2 nm for 1 wt.% ZnO, 8.0 nm
Catalysts
Crystalline size (nm)
CuO -Al2O3 CuAl2O4 ZnO
20Cu-Al 10.8 25.0 5.9 -
20Cu-1Zn-Al 7.2 27.1 5.9 n.d.
20Cu-3Zn-Al 8.0 25.5 5.4 n.d.
20Cu-10Zn-Al 11.3 19.7 8.5 n.d.
Page 63
49
for 3 wt.% and 11.3 nm for 10 wt.%. On the other hand, the crystallite size of -Al2O3
decreased. Moreover, the crystallite size of CuAl2O4 for 20Cu-10Zn-Al catalyst was
8.5 nm while the crystallite size of others catalysts about 5.4-5.9 nm.
5.2.2 Reductive behavior of copper oxides by TPR
Figure 5.14 TPR profiles of Cu-ZnO-Al2O3 catalysts.
The TPR profiles (Figure 5.14) revealed the reducibility of CuO in the Cu-
ZnO-Al2O3 catalysts. For all the catalysts investigated, reduction began at around 150
ºC and completed at 260 ºC. The profile of the Cu-ZnO-Al2O3 catalyst was the same
as that of the Cu-Al2O3. There were two overlapped reduction peaks, which included
one lower reduction temperature peak (the shoulder peak) and one higher reduction
temperature peak (the main peak). The presence of two peaks in the samples is an
indication of the existence of more than one copper species in the catalysts. Except for
the 20Cu-10Zn-Al catalyst, the TPR profiles of the catalyst showed only one
reduction peak at around 232 ºC. The temperature of the main peak shifted from 217
to 232 ºC as 10% ZnO was introduced into Cu-Al2O3. These temperatures are
Page 64
50
considerably lower than the reduction temperature reported for pure CuO, which
showed a single large peak at around 340 ºC [44, 55, 56]. Addition of ZnO, no
reduction peak assigned to ZnO species was shown in the spectra. While adding zinc
oxide, the reducibility of CuO was higher about 93-97% as shown in table 5.6.
Compared to the 20Cu-Al, ZnO incorporation by FSP enhances the reducibility of
copper.
Table 5.6 The reducibility of Cu-ZnO-Al2O3 catalysts.
5.2.3 The catalytic activity of Cu-ZnO-Al2O3 catalysts prepared by
flame spray pyrolysis on hydrogen production from methanol.
All the catalysts were tested for the production of hydrogen via methanol
steam reforming. The main products of the MSR reaction were H2, CO2 and CO.
Moreover, by-products of MSR containing CH4 and HC which HC detected in small
amounts. Methanol conversion as a function of temperature for each catalyst tested is
shown in Figure 5.15. Moreover, for all the catalysts, the activity increased
monotonically with the temperature because of the endothermic property of MSR.
The 20Cu-10Zn-Al catalyst had the highest catalytic activity. The methanol
conversion was 72% at 350 ºC. Adding the ZnO promoter, the catalyst activity was
further improved. The methanol conversion increased compared to the 20Cu-Al
catalyst at each reaction temperature. It implied that the ZnO was a suitable promoter
for MSR reaction. Catalysts modified by ZnO showed significant enhancement not
only in terms of methanol conversion but also in terms of H2 production rate. For the
H2 production rate (Figure 5.16) seemed to have the same trends as the methanol
conversion.
Catalysts 20Cu-Al 20Cu-1Zn-Al 20Cu-3Zn-Al 20Cu-10Zn-Al
% Reducibility 81.4 94.9 93.3 96.6
Page 65
51
Figure 5.15 MeOH conversion on Cu-ZnO-Al2O3 catalysts in range 200-350 °C.
Figure 5.16 H2 production rate on Cu-ZnO-Al2O3 catalysts in range 200-350 °C.
Figure 5.17 showed the H2/CO2 ratio as a function of reaction temperature.
The H2/CO2 ratio was below the value than obtained from stoichiometry of the MSR
Page 66
52
reaction, indicating that the reaction pathway of methanol steam reforming go through
CO hydrogenation. The CH4 molar concentration increased along with the
temperature. This was because that CH4 as the by-product was mainly produced by
the CO hydrogenation reaction
Figure 5.17 The H2/CO2 ratio on Cu-ZnO-Al2O3 catalysts in range 275-350 °C.
As shown in Figure 5.18, for 20Cu-Al and 20Cu-1Zn-Al catalysts CO
formation can be observed at low temperature. It is implied that methanol decompose
to form the CO and then CO converts to CO2 and CH4 at high temperature (275 ºC).
On the other hand, other researchers report on a direct mechanism for the MSR
process, where CO2 and H2 are formed form methanol in a single step [57-60]. For
instance, Geissler et al. [60] studied commercial Cu/ZnO/Al2O3 catalysts and from
measurements showing lower CO concentrations than determined by equilibrium
calculations they concluded that the SRM reaction is a single-step process, i.e. not a
consecutive reaction consisting of methanol decomposition followed by WGS.
According to the result of 20Cu-3Zn-Al and 20Cu-10Zn-Al catalysts, the CO2 was
formed previously. The results showed that the methanol steam reforming was a
single-step process.
Page 67
53
Figure 5.18 Pathway of reaction on Cu-ZnO-Al2O3 catalysts in range 200-350 °C.
Page 68
54
Thus, we have studied the effect of CeO2 promoter on Cu-ZnO-Al2O3 catalysts
by fixed percentages of CeO2 loading as 3 wt.% and various percentages of ZnO
loading as 1, 3, and 10 wt.% to improve the catalysts.
5.2.4 The phase analysis by X-ray diffraction (XRD)
Figure 5.19 XRD patterns of the Cu-ZnO-CeO2-Al2O3 catalysts.
XRD spectra obtained from the catalysts are shown in Figure 5.19 which
shown Cu-ZnO-CeO2-Al2O3 catalysts with different zinc oxide loading. Peaks at
35.5º, 38.8º, and 48.7º in 2θ attributed to CuO were recorded with peaks attributed to
-Al2O3 in the XRD pattern for Cu-ZnO-CeO2-Al2O3 [2]. Moreover, it can be seen
CeO2 is observed in samples which the characteristic peaks of CeO2 was at 2θ = 28.4º.
The characteristic peaks of CuO, -Al2O3, CuAl2O4 and CeO2 are evident in all the
spectra obtained from the catalyst samples but no crystalline ZnO phase is present on
the catalysts, implying that ZnO phase are probably present micro-crystallite state in
catalysts.
Page 69
55
Table 5.7 The crystalline size of Cu-CeO2-Al2O3, Cu-ZnO-Al2O3 and Cu-ZnO-
CeO2-Al2O3 catalysts.
Table 5.7 shows crystalline size of all species visible in the XRD spectra
calculated using the Sherrer equation. The sizes of the CuO particles are slightly
smaller on Cu-ZnO-Al2O3 catalyst compared with Cu-ZnO-CeO2-Al2O3 catalysts.
Another interesting observation is that the particle sizes of the aluminate species of
Cu-ZnO-CeO2-Al2O3 catalysts are smaller than for the CuO species. The Sherrer
equation gives a value about 5-10 nm for the aluminate. The small particle size
observed is likely due to the strong metal-support interactions that result in formation
of this compound. Addition of cerium oxide to Cu-ZnO-Al2O3 increased the
crystalline size of CuO to 13–14 nm. XRD results showed that CeO2 had a significant
influence on surface copper dispersion and crystallite sizes.
Catalysts
Crystalline size (nm)
CuO -Al2O3 CuAl2O4 CeO2
20Cu-1Zn-Al 7.2 27.1 5.9 n.d.
20Cu-3Zn-Al 8.0 25.5 5.4 n.d.
20Cu-10Zn-Al 11.3 19.7 8.5 n.d.
20Cu-3Ce-Al 5.5 24.1 7.0 n.d.
20Cu-1Zn-3Ce-Al 13.4 49.8 10.0 14.6
20Cu-3Zn-3Ce-Al 12.9 24.1 4.9 7.2
20Cu-10Zn-3Ce-Al 14.1 32.6 5.2 13.5
Page 70
56
5.2.5 Reductive behavior of copper oxides by TPR
Figure 5.20 TPR profiles of Cu-ZnO-CeO2-Al2O3 catalysts.
The reduction properties of Cu-ZnO-CeO2-Al2O3 catalysts were investigated
by H2–TPR experiments and profiles are shown in Figure 5.20. For all the catalysts
investigated, reduction began at around 170-180 ºC and completed at 260-290 ºC. The
temperature of the main peak shifted from 252 to 235 ºC as 1% ZnO was introduced
into Cu-CeO2-Al2O3. Addition of ZnO, no reduction peak assigned to ZnO species
was shown in the spectra. All ZnO-containing catalysts exhibit two reduction peaks.
While it is possible that the two reduction peaks are due to a step-wise reduction of
CuO via Cu2O to Cu metal [61], another explanation is that the two peaks are due to
different types of Cu on the surface [23]. These two copper species could be a highly
dispersed copper phase together with larger copper particles [22, 47]. Moreover, it is
evident that all ZnO-containing catalysts are reduced at lower temperatures compared
to Cu-CeO2-Al2O3 catalyst. Clearly, the presence of ZnO could enhance reducibility
of the catalysts by shifting reduction peaks toward a lower temperature.
Page 71
57
Table 5.8 The reducibility of Cu-ZnO-CeO2-Al2O3 catalysts.
Catalysts % Reducibility
20Cu-3Ce-Al 90.7
20Cu-1Zn-3Ce-Al 97.4
20Cu-3Zn-3Ce-Al 96.6
20Cu-10Zn-3Ce-Al 96.6
5.2.6 The catalytic activity of CeO2 on Cu-ZnO-Al2O3 catalysts
prepared by flame spray pyrolysis on hydrogen production from methanol.
The performances of the catalysts for the hydrogen production from methanol
are shown in Figure 5.21-5.26 which presents the catalytic activities of CeO2 on Cu-
ZnO-Al2O3 catalysts as a function of temperature. The ceria-promoted catalyst with
10 wt.% zinc oxide loading had the highest activity for the methanol steam reforming
reaction of all of the ceria-containing catalysts. Addition 3% of CeO2 over 20Cu-
10Zn-Al, the catalyst behavior becomes similar to 20Cu-10Zn-Al without any CO
formation. For ZnO loading as 3 wt.%, the initial activity (200-275 ºC) of 20Cu-3Zn-
Al was similar to that of 20Cu-3Zn-3Ce-Al, but the methanol conversion of 20Cu-
3Zn-Al was rapidly increased to 70% at 350 ºC. At low ZnO loading (1 wt.%), the
presence of CeO2 showed high catalytic activities in the reaction temperatures studied.
Interestingly, Cu-ZnO-CeO2-Al2O3 catalysts demonstrated much better catalytic
performance than those of the catalyst without CeO2 loading, indicating that the
presence of the CeO2 was necessary to efficiently promote catalytic activity. For the
H2 production rate seemed to have the same trends as the methanol conversion.
Page 72
58
Figure 5.21 MeOH conversion of Cu-ZnO-Al2O3 (thin line) and Cu-ZnO-CeO2-
Al2O3 (dash line) catalysts at ZnO as 1 wt.% in range 200-350 °C.
Figure 5.22 H2 production rate of of Cu-ZnO-Al2O3 (thin line) and Cu-ZnO-CeO2-
Al2O3 (dash line) catalysts at ZnO as 1 wt.% in range 200-350 °C.
Page 73
59
Figure 5.23 MeOH conversion of Cu-ZnO-Al2O3 (thin line) and Cu-ZnO-CeO2-
Al2O3 (dash line) catalysts at ZnO as 3 wt.% in range 200-350 °C.
Figure 5.24 H2 production rate of Cu-ZnO-Al2O3 (thin line) and Cu-ZnO-CeO2-
Al2O3 (dash line) catalysts at ZnO as 3 wt.% in range 200-350 °C.
Page 74
60
Figure 5.25 MeOH conversion of Cu-ZnO-Al2O3 (thin line) and Cu-ZnO-CeO2-
Al2O3 (dash line) catalysts at ZnO as 10 wt.% in range 200-350 °C.
Figure 5.26 H2 production rate of Cu-ZnO-Al2O3 (thin line) and Cu-ZnO-CeO2-
Al2O3 (dash line) catalysts at ZnO as 10 wt.% in range 200-350 °C.
Page 75
61
Figure 5.27 The H2/CO2 ratio on Cu-ZnO-CeO2-Al2O3 catalysts in range 275-350
°C.
Figure 5.27 showed the H2/CO2 ratio as a function of reaction temperature.
H2/CO2 ratio was obtained 2.8-3 (Figure 5.27) for all catalysts which below the value
than obtained from stoichiometry of the MSR reaction, indicating that the reaction
pathway of methanol steam reforming go through CO hydrogenation. Moreover, the
roles of CeO2 loading were clearly observed in decreasing CO formation. At high
temperature, amount of CH4 were detected. The CH4 molar concentration increased
along with the temperature. This was because that CH4 as the by-product was mainly
produced by the CO hydrogenation reaction
As shown in Figure 5.28, other researchers report on a direct mechanism for
the MSR process, where CO2 and H2 are formed form methanol in a single step [57-
60]. According to the result of all catalysts in this part, the CO2 was formed
previously and no CO formation. The results showed that the methanol steam
reforming was a single-step process.
Page 76
62
Figure 5.28 Pathway of reaction on Cu-ZnO-CeO2-Al2O3 catalysts in range 200-
350 °C.
Page 77
63
Although Cu-ZnO-CeO2-Al2O3 catalysts can promote methanol steam
reforming but Cu-CeO2-Al2O3 demonstrated much better catalytic performance than
those of the catalysts. Thus, we studied the effect of preparation method to improve
performances of Cu-ZnO-Al2O3 modified by CeO2.
5.2.7 The phase analysis by X-ray diffraction (XRD)
Figure 5.29 XRD patterns of the ZnO/Cu-CeO2-Al2O3 catalysts.
XRD patterns of the ZnO/Cu-CeO2-Al2O3 catalysts with different zinc loading
are shown in Figure 5.29. The XRD pattern has shown the presence of CuO, -Al2O3,
CuAl2O4, ZnO and CeO2 species. Peaks at 35.5º, 38.8º, and 48.7º in 2θ attributed to
CuO were recorded with peaks attributed to -Al2O3 in the XRD pattern for Cu-CeO2-
Al2O3 [2]. Moreover, it can be seen CeO2 is observed in samples which the
characteristic peaks of CeO2 was at 2θ = 28.4º. When increase zinc loading, the XRD
peaks corresponding to ZnO crystal phases were observed and the intensity increased
with the increasing zinc loading and 10Zn/20Cu-3Ce-Al catalyst showed the highest
peak intensity.
Page 78
64
Table 5.9 The crystalline size of ZnO/Cu-CeO2-Al2O3 catalysts.
Table 5.9 shows crystallite size of all species visible in the XRD spectra
calculated using the Sherrer equation. The crystallite size of CuO was also increased
by the addition of zinc oxide, that is, the sizes were 11 nm for 1 wt.% ZnO, 21 nm for
3 wt.% but decreased for 10 wt.% ZnO, i.e. 17.2 nm. Moreover, the crystallite size of
CuAl2O4 for 10Zn/20Cu-3Ce-Al catalyst was 13.7 nm while the crystallite size of
others catalysts about 6-7 nm.
5.2.8 Reductive behavior of copper oxides by TPR
The reduction properties of ZnO/Cu-CeO2-Al2O3 catalysts were investigated
by H2–TPR experiments and profiles are shown in Figure 5.30. For all the catalysts
investigated, reduction began at around 200 ºC and completed at 330 ºC. The profile
of the ZnO/Cu-CeO2-Al2O3 catalyst was the same as that of the Cu-CeO2-Al2O3
which have only one reduction peak. Figure 5.30 shows the TPR profiles of ZnO/Cu-
CeO2-Al2O3 catalysts at different zinc loading. It is evident that all ZnO-containing
catalysts are reduced at higher temperatures compared to Cu-CeO2-Al2O3 catalyst.
This is surprising, since addition of ZnO usually results in catalysts that are easy to
reduce. The temperature of the peak shifted from 252 to 297 ºC as 10% ZnO was
introduced into 20Cu-3Ce-Al.
Catalysts
Crystalline size (nm)
CuO -Al2O3 CuAl2O4 CeO2 ZnO
20Cu-3Ce-Al 5.5 24.1 7.0 n.d. -
1Zn/20Cu-3Ce-Al 11.0 37.1 6.0 10.3 10.5
3Zn/20Cu-3Ce-Al 21.0 29.7 6.1 13.3 12.8
10Zn/20Cu-3Ce-Al 17.2 75.6 13.7 4.1 71.5
Page 79
65
Figure 5.30 TPR profiles of ZnO/Cu-CeO2-Al2O3 catalysts.
Addition of ZnO, no reduction peak assigned to ZnO species was shown in the
spectra. While adding zinc oxide, the reducibility of CuO was higher about 91-93% as
shown in table 5.10.
Table 5.10 The reducibility of ZnO/Cu-CeO2-Al2O3 catalysts.
Catalysts % Reducibility
20Cu-3Ce-Al 90.7
1Zn/20Cu-3Ce-Al 92.6
3Zn/20Cu-3Ce-Al 91.1
10Zn/20Cu-3Ce-Al 91.0
Page 80
66
5.2.9 The catalytic activity of ZnO impregnated on Cu-CeO2-Al2O3
catalysts prepared by flame spray pyrolysis on hydrogen production from
methanol.
Figure 5.31-5.32 shows the results of the methanol steam reforming of over
ZnO/Cu-CeO2-Al2O3 which impregnated ZnO on Cu-CeO2-Al2O3 prepared by flame
spray pyrolysis. The main products of the MSR reaction were H2, CO2 and CO.
Moreover, by-products of MSR containing CH4 and HC which HC detected in small
amounts. The catalyst activities, expressed as the methanol conversion as a function
of reaction temperature, is shown for the various zinc loading on Cu-CeO2-Al2O3
catalysts. On all the samples, methanol conversion starts above 200 ºC. At low
temperature, methanol conversion increased slightly with temperature increased. On
the other hand, methanol conversion increased rapidly at high temperature. The
1Zn/20Cu-3Ce-Al catalyst exhibits the best performance of all catalysts in this series.
The methanol conversion was 77% at 350 ºC. For the H2 production rate (Figure 5.22)
seemed to have the same trends as the methanol conversion.
Figure 5.33-5.34 shows methanol conversion and H2 production rate of Cu-
ZnO-CeO2-Al2O3 compared with ZnO/Cu-CeO2-Al2O3. Interestingly, Cu-ZnO-CeO2-
Al2O3 catalysts demonstrated much better catalytic performance than ZnO/Cu-CeO2-
Al2O3 especially at low temperature, indicating that ZnO incorporated by FSP
necessary to efficiently promote catalytic activity in all reaction temperature more
than ZnO impregnated.
Page 81
67
Figure 5.31 MeOH conversion on ZnO/Cu-CeO2-Al2O3 catalysts in range 200-350
°C.
Figure 5.32 H2 production rate on ZnO/Cu-CeO2-Al2O3 catalysts in range 200-350
°C.
Page 82
68
Figure 5.33 MeOH conversion on Cu-ZnO-CeO2-Al2O3 (thin line) and ZnO/Cu-
CeO2-Al2O3 (dash line) catalysts in range 200-350 °C.
Figure 5.34 H2 production rate on Cu-ZnO-CeO2-Al2O3 (thin line) and ZnO/Cu-
CeO2-Al2O3 (dash line) catalysts in range 200-350 °C.
Page 83
69
Figure 5.35 The H2/CO2 ratio on ZnO/Cu-CeO2-Al2O3 catalysts in range 275-350
°C.
Over all the tested ZnO/Cu-CeO2-Al2O3 catalysts, HC and CH4 were detected
as a by-product. H2/CO2 ratio was obtained 2.7-2.9 (Figure 5.35) which theoretical
results H2/CO2 was 3. At high temperature, amount of CH4 were detected and
disappears while increasing the zinc loading.
The route of CO and CO2 formation was investigated in our experiments. The
decomposition-WGS sequence has been proposed by some authors [51-53]. In this
scheme, CO is believed to be a primary product, subsequently converted into CO2 in
the WGS reaction. According to the mechanism, the CO formation of all catalysts
indicated that the catalysts favored methanol decomposition at low temperature
consistent with the formation of quantities of CO2 is observed only above 275 ºC for
all catalysts.
CH3OH 2H2 + CO (DM)
CO + H2O H2 + CO2 (WGS)
Page 84
70
Figure 5.36 Pathway of reaction on ZnO/Cu-CeO2-Al2O3 catalysts in range 200-
350 °C.
Page 85
71
CHAPTER VI
CONCLUSIONS
In this research, the conclusions of these results were as follows:
1. Addition of CeO2 as 1, 3 and 5 wt.% into the Cu-Al2O3 catalyst promoted
activity of catalyst
2. At low ZnO loading (1 wt.%), Cu-ZnO-CeO2-Al2O3 catalysts demonstrated
much better catalytic performance than the catalyst without CeO2 loading.
3. For ZnO impregnated on Cu-CeO2-Al2O3 catalysts, the methanol
decomposition can be promoted more than the methanol steam reforming.
Page 86
72
REFERENCES
[1] S. Danwittayakul, J. Dutta. (2012). “Zinc oxide nanorods based catalysts for
hydrogen production by steam reforming of methanol.” International
Journal of Hydrogen Energy, 37: 5518-5526.
[2] Y. Matsumura, H. Ishibe. (2009). “High temperature steam reforming of methanol
over Cu/ZnO/ZrO2 catalysts.” Applied Catalysis B: Environmental, 91: 524-
532.
[3] S. D. Jones, H. E. Hagelin-Weaver. (2009). “Steam reforming of methanol over
CeO2- and ZrO2-promoted Cu-ZnO catalysts supported on nanoparticle
Al2O3.” Applied Catalysis B: Environmental, 90: 195-204.
[4] B. Lorenzut, T. Montini, L. D. Rogatis, P. Canton, A. Benedetti, P. Fornasiero.
(2011). “Hydrogen production through alcohol steam reforming on Cu/ZnO-
based catalysts.” Applied Catalysis B: Environmental, 101: 397-408.
[5] Cheung-Chun Chang, Jhih-Wei Wang, Ching-Tu Chang, Biing-Jye Liaw, Yin-Zu
Chen. (2012). “Effect of ZrO2 on steam reforming of methanol over
CuO/ZnO/ZrO2/Al2O3 catalysts.” Chemical Engineering Journal, 192: 350-
356.
[6] Gang Huang, Biing-Jye Liaw, Cheng-Jyun Jhang, Yin-Zu Chen. (2009). “Steam
reforming of methanol over CuO/ZnO/CeO2/ZrO2/Al2O3 catalysts.” Applied
Catalysis A: General, 358: 7-12.
[7] S. D. Jones, L. M. Neal, H. E. Hagelin-Weaver. (2008). “Steam reforming of
methanol using Cu-ZnO catalysts supported on nanoparticle alumina.”
Applied Catalysis B: Environmental, 84: 631-642.
Page 87
73
[8] B. A. Peppley, J. C. Amphlett, L. M. Kearns, R. F. Mann. (1999). “Methanol-
steam reforming on Cu/ZnO/Al2O3 catalysts. Part 2. A comprehensive kinetic
model.” Applied Catalysis A: General, 179: 31-49.
[9] J. Agrell, H. Birgersson, M. Boutonnet. (2002). “Steam reforming of methanol
over a Cu/ZnO/Al2O3 catalyst: a kinetic analysis and strategies for suppression
of CO formation.” Journal of Power Sources, 106: 249–257.
[10] S. Sá, H. Silva, L. Brandão, J. M. Sousa, A. Mendes. (2010). “Catalysts for
methanol steam reforming.” Applied Catalysis B: Environmental, 99: 43-57.
[11] Jian-Ping Shen, Chunshan Song. (2002). “Influence of preparation method on
performance of Cu/Zn-based catalysts for low-temperature steam reforming
and oxidative steam reforming of methanol for H2 production for fuel cells.”
Catalysis Today, 77: 89–98.
[12] Xin-Rong Zhang, Lu-Cum Wang, Cheng-Zhang Yao, Yong Cao, Wei-Lin Dai,
He-Yong He, Kang-Nian Fan. (2005). “A highly efficient Cu/ZnO/Al2O3
catalyst via gel-coprecipitation of oxalate precursors for low-temperature
steam reforming of methanol.” Catalysis Letters, 102: 183-190.
[13] P. Kurr, I. Kasatkina, F. Girgsdies, A. Trunschkea, R. Schlögl, T. Ressler.
(2008). “Microstructural characterization of Cu/ZnO/Al2O3 catalysts for
methanol steam reforming - A comparative study.” Applied Catalysis A:
General, 348: 153–164.
[14] O. Jakdetchai, N. Takayama, T. Nakajima. (2003). “Activity enhancement of
CuZn-impregnated FSM-16 by modification with 1,3-butanediol for steam
reforming of methanol.” Kinetics and Catalysis, 46: 56–64.
[15] Y. Kawamura, K. Yamamoto, N. Ogura, T. Katsumata, A. Igarashi. (2005).
“Preparation of Cu/ZnO/Al2O3 catalyst for a micro methanol reformer.”
Journal of Power Sources, 150: 20–26.
Page 88
74
[16] T. Valdés-Solís, G. Marbán, A.B. Fuertes. (2006). “Nanosized catalysts for the
production of hydrogen by methanol steam reforming.” Catalysis Today, 116:
354–360.
[17] C. Pojanavaraphan, A. Luengnaruemitchai, E. Gulari. (2012). “Effect of support
composition and metal loading on Au catalyst activity in steam reforming of
methanol,” International journal of hydrogen energy, 37: 14072-14084.
[18] M. Mrad, C. Gennequin, A. Aboukaïs, E. Abi-Aad. (2011). “Cu/Zn-based
catalysts for H2 production via steam reforming of methanol.” Catalysis
Today, 176: 88-92.
[19] P.P.C. Udani, P.V.D.S. Gunawardana, Hyun Chan Lee, Dong Hyun Kim. (2009).
“Steam reforming and oxidative steam reforming of methanol over CuO–CeO2
catalysts.” International journal of hydrogen energy, 34: 7648–7655.
[20] Lei Zhang, Liwei Pan, Changjun Ni, Tianjun Sun, Shengsheng Zhao, Shudong
Wang, Anjie Wang, Yongkang Hu. (2013). “CeO2-ZrO2-promoted CuO/ZnO
catalyst for methanol steam reforming.” International journal of hydrogen
energy, 38: 4397-4406.
[21] B. Lindström, L. J. Pettersson. (2002). “Steam reforming of methanol over
copper-based monoliths: the effects of zirconia doping.” Journal of Power
Sources, 106: 264–273.
[22] Heondo Jeong, Kweon Ill Kim, Tae Hwan Kim, Chang Hyun Ko, Hwa Choon
Park, In Kyu Song. (2006). “Hydrogen production by steam reforming of
methanol in a micro-channel reactor coated with Cu/ZnO/ZrO2/Al2O3
catalyst.” Journal of Power Sources, 159: 1296–1299.
[23] J. Agrell, H. Birgersson, M. Boutonnet, I. Melián-Cabrera, R.M. Navarro, J.L.G.
Fierro. (2003). “Production of hydrogen from methanol over Cu/ZnO catalysts
promoted by ZrO2 and Al2O3.” Journal of Catalysis, 219: 389–403.
Page 89
75
[24] Gui-Sheng Wu, Dong-Sen Mao, Guan-Zhong Lu, Yong Cao, Kang-Nian Fan.
(2009). “The Role of the Promoters in Cu Based Catalystsfor Methanol Steam
Reforming.” Catalysis Letters, 130:177–184.
[25] L. Ma, B. Gong, T. Tran, M.S. Wainwright. (2000). “Cr2O3 promoted skeletal Cu
catalysts for the reactions of methanol steam reforming and water gas shift.”
Catalysis Today, 63: 499–505.
[26] X. Huang, L. Ma, M.S. Wainwright. (2004). “The influence of Cr, Zn and Co
additives on the performance of skeletal copper catalysts for methanol
synthesis and related reactions.” Applied Catalysis A: General, 257: 235–
243.
[27] S. Patel, K.K. Pant. (2006). “Activity and stability enhancement of copper–
alumina catalysts using cerium and zinc promoters for the selective production
of hydrogen via steam reforming of methanol.” Journal of Power Sources,
159: 139–143.
[28] J. Papavasiliou, G. Avgouropoulos, T. Ioannides. (2007). “Effect of dopants on
the performance of CuO–CeO2 catalysts in methanol steam reforming.”
Applied Catalysis B: Environmental, 69: 226–234.
[29] Xinrong Zhang, Pengfei Shi. (2003). “Production of hydrogen by steam
reforming of methanol on CeO2 promoted Cu/Al2O3 catalysts.” Journal of
Molecular Catalysis A: Chemical, 194: 99–105.
[30] P. Clancy, J. P. Breen, J. R. H. Ross. (2007). “The preparation and properties of
coprecipitated Cu–Zr–Y and Cu–Zr–La catalysts used for the steam reforming
of methanol.” Catalysis Today, 127: 291-294.
[31] P. Bichon, M. Asheim, A. Jordal, T. Sperle, M. Fathi, A. Holmen, E. A. Blekkan.
(2007). “Hydrogen from methanol steam-reforming over Cu-based catalysts
with and without Pd promotion.” International journal of hydrogen energy,
32: 1799-1805.
Page 90
76
[32] A. Houteit, H. Mahzoul, P. Ehrburger, P. Bernhardt, P. Légaré, F. Garin. (2006).
“Production of hydrogen by steam reforming of methanol over copper-based
catalysts: The effect of cesium doping.” Applied Catalysis A: General, 306:
22–28.
[33] L.C. Pathak, T.B. Singh, S. Das, A.K. Verma, P. Ramachandrarao. (2002).
“Effect of pH on the combustion synthesis of nano-crystalline alumina
powder.” Materials Letters, 57: 380 – 385.
[34] J.M. Wu. (2001). “Nano-sized amorphous alumina particles obtained by ball
milling ZnO and Al powder mixture.” Materials Letters, 48: 324–330.
[35] A.I.Y. Tok, F.Y.C. Boey, S.W. Du, B.K. Wong. (2006). “Flame spray synthesis
of ZrO2 nano-particles using liquid precursors.” Materials Science and
Engineering B, 130: 114–119.
[36] R. Mueller, R. Jossen, S.E. Pratsinis. (2004). “Zirconia nanoparticles made in
spray flames at high production rates.” Journal of the American Ceramic
Society, 87: 197–202.
[37] K. Wegner, W. J. Stark, S. E. Pratsinis. (2002). “Flame-nozzle synthesis of
nanoparticles with closely controlled size, morphology and crystallinity.”
Materials Letters, 55: 318 – 321.
[38] O. Mekasuwandumrong, S. Phothakwanpracha, B. Jongsomjit, J. Panpranot,
A.Shotipruk. (2011). “Influence of flame conditions on the dispersion of Pd on
the flame spray-derived Pd/TiO2 nanoparticles.” Powder Technology, 210:
328-331.
[39] H. Y. Koo, J. H.Yi, J. H. Kim, Y.N. Ko, Y. J Hong, Y.C. Kang, B.K. Kim.
(2011). “Size-controlled silver-glass composite powders with nanometer size
prepared by flame spray pyrolysis.” Powder Technology, 207: 362–369.
Page 91
77
[40] H. Y. Koo, J.H. Yi, Y.C. Kang. (2010). “Effect of preparation conditions and
types of spray solutions on the formation of nano-sized silver–glass
composite powders in flame spray pyrolysis.” Journal of Alloys
Compounds, 496: 536–542.
[41] F. Kruneich. (2006). “Nanorods of ZnO made by flame spray pyrolysis.”
Chemistry of Materials, 18: 572-578.
[42] S.J. Shih, G. Li, D.J.H. Cockayne, K.B. Borisenko. (2009). “Mechanism of
dopant distribution: An example of nickel-doped ceria nanoparticles.”
Scripta Materialia, 6: 832-835.
[43] Y. Hu, H. Ding, C. Li. (2011). “Preparation of hollow alumina nanospheres via
surfactant-assisted flame spray pyrolysis.” Particuology, 9: 528-532.
[44] S. Patel, K.K. Pant. (2007). “Hydrogen production by oxidative steam reforming
of methanol using ceria promoted copper–alumina catalysts.” Fuel Processing
Technology, 88: 825-832.
[45] P.V.D.S. Gunawardana, Hyun Chan Lee, Dong Hyun Kim. (2009). “Performance
of copper–ceria catalysts for water gas shift reaction in medium temperature
range.” International journal of hydrogen energy, 34: 1336-1341.
[46] Zhu P, Li J, Zuo S, Zhou R. (2008). “Preferential oxidation properties of CO in
excess hydrogen over CuO–CeO2 catalyst prepared by hydrothermal method.”
Applied Surface Science, 255: 2903-2909.
[47] J.P. Breen, J.R.H. Ross. (1999). “Methanol reforming for fuel-cell applications:
development of zirconia-containing Cu-Zn-Al catalysts.” Catalysis Today,
51: 521-533.
[48] R. Pérez-Hernández, A. Gutiérrez-Martínez, C.E. Gutiérrez-Wing. (2007).
“Effect of Cu loading on CeO2 for hydrogen production by oxidative steam
reforming of methanol.” International Journal of Hydrogen Energy, 32:
2888 – 2894.
Page 92
78
[49] Cheng-Zhang Yao, Lu-Cun Wang, Yong-Mei Liu, Gui-Sheng Wu, Yong Cao,
Wei-Lin Dai, He-Yong He, Kang-Nian Fan. (2006). “Effect of preparation
method on the hydrogen production from methanol steam reforming over
binary Cu/ZrO2 catalysts.” Applied Catalysis A: General, 297: 151–158.
[50] Meng-Fei Luo, Ping Fang, Mai He, Yun-Long Xie. (2005). “In situ XRD,
Raman, and TPR studies of CuO/Al2O3 catalysts for CO oxidation.” Journal
of Molecular Catalysis A: Chemical, 239: 243–248.
[51] Pour V, Barton J, Benda A. (1975). “Kinetics of catalyzed reaction of methanol
with water vapour.” Collect Czech Chem Commun, 40: 2923-2934.
[52] E. Santacesaria, S. Carrá. (1983). “Kinetics of catalytic steam reforming of
methanol in a cstr reactor.” Applied Catalysis, 5: 345-358.
[53] J.C. Amphlett, M.J. Evans, R.F. Mann, R.D. Weir. (1985). “Hydrogen production
by the catalytic steam reforming of methanol: Part 2: Kinetics of methanol
decomposition using girdler G66B catalyst.” The Canadian Journal of
Chemical Engineering, 63: 605-611.
[54] Fernandez-Garcia M, Martinez-Arias A, Salamanca LN, Coronado JM, Anderson
JA, Conesa JC. (1999). “Influence of ceria on Pd activity for the CO + O2
reaction.” Journal of Catalysis, 187: 474-485.
[55] Y. Liu, T. Hayakawa, K. Suzuki, S. Hamakawa, T. Tsunoda, T. Ishii, Mikio
Kumagai. (2002). “Highly active copper/ceria catalysts for steam reforming of
methanol.” Applied Catalysis A: General, 223: 137–145.
[56] S. Patel, K.K. Pant. (2007). “Selective production of hydrogen via oxidative
steam reforming of methanol using Cu–Zn–Ce–Al oxide catalysts.” Chemical
Engineering Science, 62: 5436 – 5443.
[57] B. A. Peppley, J. C. Amphlett, L. M. Kearns, R. F. Mann (1999). “Methanol-
steam reforming on Cu/ZnO/Al2O3. Part 1: the reaction network.” Applied
Catalysis A: General, 179: 21-29.
Page 93
79
[58] B. A. Peppley, J. C. Amphlett, L. M. Kearns, R. F. Mann (1999). “Methanol-
steam reforming on Cu/ZnO/Al2O3 catalysts. Part 2. A comprehensive kinetic
model.” Applied Catalysis A: General, 179: 31-49.
[59] S. P. Asprey, B. W. Wojciechowski, B. A. Peppley (1999). “Kinetic studies using
temperature-scanning: the steam-reforming of methanol.” Applied Catalysis
A: General, 179: 51-70.
[60] K. Geissler, E. Newson, F. Vogel, T.-B. Truong, P. Hottinger, A. Wokaun
(2001). “Autothermal methanol reforming for hydrogen production in fuel cell
applications.” Physical Chemistry Chemical Physics, 3: 289-293.
[61] B. Lindström, L. J. Pettersson, P. G. Menon (2002). “Activity and
characterization of Cu/Zn, Cu/Cr and Cu/Zr on -alumina for methanol
reforming for fuel cell vehicles.” Applied Catalysis A: General, 234: 111-
125.
Page 100
80
APPENDIX A
CALCULATION OF CATALYST PREPARATION
Calculation of catalyst prepared by flame spray pyrolysis
Table A.1 Properties of precursor
Metal
MW of metal
(g)
Metal precursor
MW of metal precursor
(g)
Purity
(%)
Cu 63.546 Cu(NO3)2·2.5H2O 232.59 99.0
CeO2 172.114 CeN3O9·6H2O 434.22 99.0
Al2O3 101.96 Al(NO3)3·9H2O 375.13 98.0
Page 101
81
Preparation precursor Cu-CeO2-Al2O3 (FSP)
20Cu-1CeO2-Al2O3
Basis 100 g catalyst (Cu = 20 g, CeO2 = 1 g, Al2O3 = 79 g)
Mole Cu = 3147.0546.63
20 mol
Mole CeO2 = 0058.0114.172
1 mol
Mole Al2O3 = 7748.096.101
79 mol
Al = (2×0.7748) = 1.5496 mol
Total mole = 0.3147+0.0058+1.5496 = 1.8701 mol
XCu = 0.1683 XCeO2 = 0.0031 XAl2O3 = 0.8286
Precursor 500 cm3 concentration 0.5M
Total mole = 25.01000
5005.0 mol
Mole Cu = 0.0421 mol
Mole CeO2 = 0.0008 mol
Mole Al2O3 = 0.2072 mol
Cu(NO3)2·2.5H2O = 0.0421 × 232.59 ×99.01 = 9.8909 g
CeN3O9·6H2O = 0.0008 × 434.22 × 99.0
1 = 0.3509 g
Al(NO3)2·9H2O = 0.2072×375.13×98.01 79.3132 g
Page 102
82
Wet-impregnation (CeO2/Cu-Al2O3)
Basis : Cu-Al2O3 2 g
Cu(NO3)2·2.5H2O
99.01
122.434
11
114.1721
973
2932
932.
93
2
2
OmolCeNg
molCeOOmolCeN
gmolCeO
gg
g OCeN
CeOcat
CeOcat
= 0.1576 g
Page 103
83
APPENDIX B
CALCULATION OF THE CRYSTALLITE SIZE
Calculation of the crystallite size by Debye-Scherrer equation
The crystallite size was calculated from the half-height width of the diffraction
peak of XRD pattern using the Debye-Scherrer equation.
Figure B.1 Derivation of Bragg's Law for X-ray diffraction
sindyzxy
Thus sind2xyz
But nxyz
Therefore nsind2 Bragg’s
Law
Page 104
84
sin2nd
The Bragg's Law was derived to C.1
From Scherrer equation:
cos KD
(C.1)
Where D = Crystallite size, Å
K = Crystallite-shape factor = 0.9
λ = X-ray wavelength, 1.5418 Å for CuKα
θ = Observed peak angle, degree
β = X-ray diffraction broadening, radian
The X-ray diffraction broadening (β) is the pure width of powder diffraction
free from all broadening due to the experimental equipment. α-Alumina is used as a
standard sample to observe the instrumental broadening since its crystallite size is
larger than 2000 Å. The X-ray diffraction broadening (β) can be obtained by using
Warren’s formula.
From Warren’s formula:
2S
2M BB
(C.2)
Where BM = The measured peak width in radians at half peak height.
BS = The corresponding width of the standard material.
Page 105
85
Example: Calculation of the crystallite size of alumina
The half-height width of 111 diffraction peak = 1.83° (from Figure C.1)
= (π 1.83)/180
= 0.0319 radian
The corresponding half-height width of peak of α-alumina (from the Bs value
at the 2θ of 30.3° in Figure C.2) = 0.0036 radian
The peak width, 2S
2M BB
22 0036.00319.0
radian0317.0
Where B = 0.0317 radian
2θ = 30.3°
θ = 15.15°
λ = 1.5418 Å
The crystallite size = 15.15cos0317.0
5418.19.0 = 45.32 Å
= 4.5 nm
Page 106
86
Figure B.2 The 111 diffraction peak of alumina for calculation of the crystallite
size
Figure B.3 The plot indicating the value of line broadening due to the equipment.
The data were obtained by using α-alumina as a standard.
Page 107
87
APPENDIX C
CALCULATION FOR REDUCIBILITY
For supported copper catalyst, it can be assumed that the major species of
calcined Cu catalysts is CuO. H2 consumption to reduce CuO is calculated as follows:
Molecular weight of Cu = 63.546
Molecular weight of CuO = 79.545
Calculation of the calibration of H2 consumption using copper oxide (CuO)
Let the weight of CuO = 0.1 g
= 1.257x10⁻³ mole
From equation of CuO reduction;
CuO + H2 → Cu + H2O (E.1)
Mole of H2 consumption = Mole of CuO consumption
= 1.257x10⁻³ mole
Integral area of hydrogen used to reduce CuO 0.1 g = 8.7017 unit
At 100% reducibility, the amount of hydrogen consumption is 1.257x10⁻³
mole related to the integral area of CuO after reduction 8.7017 unit
Calculation of reducibility of supported copper catalyst
% Reducibility = Amount of H2 uptake to reduce 0.1 g of catalyst x100
Amount of theoretical H2 uptake to reduce CuO to Cu for 0.1 g of catalyst
Page 108
88
Integral area of the calcined catalyst = X unit
The amount of H2 consumption = [1.257x10⁻³x (X)/ 8.7017] mole
Let the weight of calcined catalyst used = W g
Concentration of Cu = Y %wt
Amount of theoretical = /63.546Y/100W mole
% Reducibility = )100(/63.546Y/100W
8.7017](X)/ x [1.257x10 -3
Example for 10Cu-Al2O3
Integral area of the calcined catalyst = 0.8777 unit
The amount of H2 consumption = [1.257x10⁻³x (X)/ 8.7017] mole
Let the weight of calcined catalyst used = 0.1008 g
Concentration of Cu = 10 %wt
Amount of theoretical = /63.54610/1000.1008 mole
% Reducibility = )100(/63.54610/1000.1008
8.7017](0.8777)/ x [1.257x10 -3
= 79.9 %
Page 109
89
APPENDIX D
HC PRODUCTION
In this research, we studied the methanol steam reforming of over Cu-based
catalysts which prepared by flame spray pyrolysis. The main products of the MSR
reaction were H2, CO2 and CO. Moreover, by-products of MSR containing CH4 and
HC which HC detected in small amounts. Thus, the results of HC formation were
shown in Appendix D.
Figure D.1 HC production on Cu-Al2O3 catalysts in range 200-350 °C.
Page 110
90
Figure D.2 HC production on Cu-CeO2-Al2O3 catalysts in range 200-350 °C.
Figure D.3 HC production on Cu-ZnO-Al2O3 catalysts in range 200-350 °C.
Page 111
91
Figure D.4 HC production on Cu-ZnO-CeO2-Al2O3 catalysts in range 200-350 °C.
Figure D.5 HC production on ZnO/Cu-CeO2-Al2O3 catalysts in range 200-350 °C.
Page 112
92
APPENDIX E
INTERNATIONAL PRESENTATION
Pawinee Eamprapai and Choowong Chaisuk
"Effect of Copper/Alumina Ratio and ZnO promoter in FSP Catalyst on Hydrogen Production from Methanol", 12th International Conference on Atomically Controlled Surfaces, Interfaces and Nanostructuresin conjunction with 21st International Colloquium on Scanning Probe Microscopy (ACSIN-12 & ICSPM21 2013), Tsukuba International Congress Center, Tsukuba, Japan, November 4-8, 2013, Poster presentation.
Page 113
93
PROFILE
Name: Miss Pawinee Eamprapai
Birth date: February 7, 1989
Place of birth: Nakorn Pathom , Thailand
Nationality: Thai
Religion: Thai
Address: 37 M.4, T. Banluang, A. Dontoom,
Nakorn Pathom, 73150, Thailand
Contact: [email protected] , Tel. 0850190329
Education:
2013 Master student of Chemical Engineering at Graduate
School, Silpakorn University.
2010 Bachelor degree of Chemical Engineering, Silpakorn
University.
2006 Kasetsart University Laboratory School Kamphaeng Saen
Campus, Educational Research and Development Center,
Nakorn Pathom,Thailand