Page 1
Revue des Energies Renouvelables Vol. 18 N°2 (2015) 303 – 314
303
Effect of crosslinking on EVA-based encapsulant properties
during photovoltaic module fabrication process
K. Agroui 1*, G. Collins 2, G. Oreski 3
M. Boehning 4, A. Hadj Arab 5 and D. Ouadjaout 1
1 Semiconductors Technology for Energetic Research Center, CRTSE
2, Bd. Dr. Frantz Fanon, B.P. 140 Alger-7 Merveilles, Algiers, Algeria 2 Department of Biomedical Engineering, New Jersey Institute of Technology, USA
3 Polymer Competence Center Leoben, PCCL, Leoben, Austria 4 Federal Institute for Materials Research and Testing, BAM, Berlin, Germany
5 Centre de Développement des Energies Renouvelables, CDER
B.P. 62, Route de l’Observatoire, 16340, Algiers, Algeria
(reçu le 11 Février 2015 – accepté le 30 Juin 2015)
Abstract - The key objective of this work is to create a comprehensive comparison
between experimental analysis methods for detecting crosslinking reaction in EVA
encapsulant material during PV module fabrication process. Several analytical methods,
spanning from classical gel content extraction measurements over different thermo-
analytic and mechanical approaches to spectroscopic analysis as Thermally Stimulated
Current (TSC), have been investigated as to their ability to reveal the crosslinking state of
ethylene vinyl acetate (EVA). The basic results show that TSC complements perfectly
other thermal analysis methods like as Differential Scanning Calorimetry (DSC),
Dynamic Mechanical Thermal Analysis (DMTA) to determine fundamental properties of
EVA such as molecular mobility characteristics and also to monitor the crosslinking
reaction. Exothermic peak as revealed by DSC analysis can be used to estimate the
crosslinking rate of EVA during PV module encapsulation process as fast quality control
test.
Résumé - L’objectif principal de ce travail est de permettre une meilleure compréhension
entre les différentes techniques analyses expérimentales pour détecter la réaction de
réticulation au niveau de l’encapsulant Ethylène-Vinyle Acétate (EVA), durant le process
de fabrication d’un module PV. Plusieurs méthodes d’analyse, allant du test classique
d’extraction du taux de gel aux différentes techniques d’analyses thermomécaniques ainsi
que les techniques d’analyse de spectroscopie comme le courant stimulé thermiquement
(TSC), ont été étudiés pour permettre de révéler le phénomène de la réaction de
réticulation de l’encapsulant l’EVA. Les résultats de base montrent que la TSC complète
parfaitement d’autres méthodes d’analyses thermiques comme la calorimétrie
différentielle à balayage (DSC), l’analyse mécanique dynamique (DMTA) pour
déterminer les propriétés fondamentales de l’EVA. Ces techniques permettent de
déterminer les caractéristiques relatives à la mobilité moléculaire et aussi pour mieux
mettre en évidence la réaction de réticulation. Le pic exothermique comme révélé par
l’analyse par DSC, peut être utilisé pour estimer le taux de réticulation de l’EVA au cours
du process d’encapsulation du module PV comme un test rapide de contrôle de qualité.
Keywords: EVA - Photovoltaic module - Crosslinking process – Thermal properties -
Mechanical properties.
* [email protected]
Page 2
K. Agroui et al.
304
1. INTRODUCTION
The polymer encapsulant used in PV modules serves to provide the functions of
structural support, electrical isolation, physical isolation/protection and thermal
conduction for the solar cell circuit [1]. Normally the encapsulant materials are made of
a high insulating polymer to maintain good circuit isolation.
The relative stability is crucial to the long term durability of the encapsulant material
for PV modules deployed in the field, where along service lifetime and reliable power
output are needed [2].Also, it is important to provide a method for determining that the
EVA encapsulant has sufficient crosslinking density to be capable of surviving outdoors
for 25 years and of passing the IEC module qualification tests.
This method may be used to assess the quality of the EVA used in fabrication
(where the peroxide agent facilitating the cure has a finite shelf-life) and may be used to
establish (or verify) the time temperature conditions used during lamination.
DSC analysis technique can provide a method for measuring the crosslinking
density in EVA encapsulant, or verifying adequate completion of the curing process
after it has been processed in a PV module.
Knowledge of exact thermal stability of EVA based encapsulant and how they vary
during thermal processing is important to understand the effect of crooslinking.
The crystallization and the crosslinking properties of EVA experienced during
encapsulation process a real so examined by DSC analysis. An understanding of the
crystallization of EVA is important as the degree of crystallinity affects mechanical and
processing properties of the material. In this paper the thermal stability of EVA will be
defined and their dependence on temperature will be presented.
2. EXPERIMENTAL
2.1 Material and lamination-crosslinking process
EVA Sample, prepared with commercial EVA standards based on 9918P, is referred
to as original EVA [3]. EVA samples were inserted between two pieces of Teflon and
placed on a piece of glass of the same size as used for the actual module in order to
produce the correct thermal conditions during the crosslinking cycle is executed using
the Spi-Laminator at temperature of 160°C for 15 min [4].
EVA sample submitted to the cure step cycle is referred to as crosslinked EVA. The
gel content (degree of crosslinking) produced during the cycle cure is about 70% [5].
2.2 Analysis techniques
2.2.1 Thermally Stimulated Current Technique (TSC)
The TSC experiments provide information about the mobile phase in polymeric
materials. TSC experiments were run in depolarization mode (TSDC). The TSDC
procedure was to apply a voltage V200Ep across the EVA specimen and ramp the
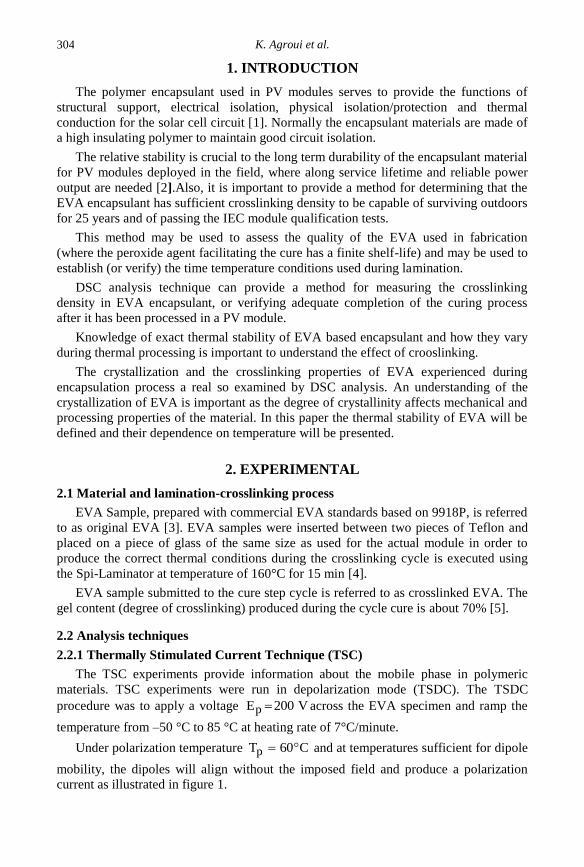
temperature from –50 °C to 85 °C at heating rate of 7°C/minute.
Under polarization temperature C60Tp and at temperatures sufficient for dipole
mobility, the dipoles will align without the imposed field and produce a polarization
current as illustrated in figure 1.
Page 3
Effect of crosslinking on EVA-based encapsulant properties during photovoltaic…
305
2.2.2 Differential Scanning Calorimetric (DSC)
For DSC, a measuring instrument 204 F1 Phoenix®,Netzsch, Germany, was used.
Standard crucibles with a manually perforated lid were deployed. A circular sample was
punched out from the EVA foil. A heat-cool-heat temperature programming protocol
was used in DSC experiments to evaluate the behavior of the EVA samples from -80°C
to 200°C.The heating and cooling rates were 10 °C/min.
Fig. 1: Thermal program for the TSDC experiments
2.2.3 Dynamic Mechanical Thermal Analysis (DMTA)
Thermomechanical properties of the EVA samples were measured using a
Rheometric DMTA IV. Specimens were cut from the samples and mounted in the
rectangular tension fixture. The typical sample dimensions were 10 mm long, 3.3-3.5
mm wide and 0.4-0.5 mm thick. The frequency was 1 Hz and the static force was
maintained at 20% higher than the dynamic force
2.2.4 Thermogravimetric Analyzer (TGA)
Thermogravimetric Analysis (TGA) measures changes in weight of a sample with
increasing temperature. This, in principle, simple measurement is an important and
powerful tool in solid state chemistry and materials science. The method for example
can be used to determine thermal stability of materials and also the reaction kinetics.
TGA measurements can be conducted in inert and oxidative atmosphere on a TA
Instruments TGA 2950 Thermogravimetric Analyzer, which has a sensitivity of 0.1 mg.
2.2.5 Tensile properties
The tensile testing is the most versatile of the applied characterization methods in
describing the aging behavior of polymer materials. Tensile tests were carried out with a
screw driven universal test machine (Zwick Z010 Allround-Line, Zwick, Ulm, D) at 23
°C according to EN ISO 527- 3. Figure 2 shows the specimen test dimensions.
Rectangular specimens of 100 mm in length and 15 mm in width were cut using a
device with fixed razor blades and rotating sample. The test speed was 50 mm/min.
From a total of at least five specimens for each test series, average numbers for elastic
modulus ( tE ), stress-at-break ( b ) and strain-at-break ( b ) were deduced [6].
Fig. 2: Sample dimensions for tensile test
Page 4
K. Agroui et al.
306
2.2.6 Electrical resistivity measurements
For evaluating the electrical properties of EVA an experimental set-up was installed
according to the IEC recommendations system. EVA samples are contained between the
upper and lower metal plate electrodes within a confinement ring soldered to the lower
plate. The electrodes are connected to heating resistances to allow measurements to be
taken at several temperatures up to 150°C which are stabilized with a temperature
regulator type 2965 (Tettex). The electrodes pressure is kept constant and equal to 2,
5.104 Pa. The applied voltage is adjusted to a value of 500 VAC and frequency of 50 Hz
to favor optimal sensibility of measurements. Insulating resistance ( R ) was measured
with a Megohmeter type MOM11. The resistivity ( ) is deduced from the
measurements [7].
3. RESULTS AND DISCUSSIONS
3.1 Thermal relaxations by TSC
Figure 3 provides the TSC results in TSDC mode for EVA sample polarized at 60°C
before and after crosslinking process. The TSDC behavior of EVA, exhibits two peaks
represented mobility in two distinct phase separated amorphous domains. The increase
in peak magnitude for the low temperature relaxation likely reflects an increase in the
number of mobile dipoles in that domain. At polarization temperature of 60°C, for each
EVA material, there is a low temperature relaxation process and a high temperature
process. Original EVA has a low temperature peak at about -37°C, and a high
temperature peak at about 30°C. The high temperature peak appears to have a shoulder
above 50°C. The crosslinked EVA has a somewhat broad low temperature peak at about
-38°C, and a high temperature peak at about 26°C. The complex behavior of this peak
suggests that there are two processes occurring in this temperature range; first there is
the relaxation characteristic of the glass transition ( gT ) and second, there is the crystal
melting as indicated in the DSC results as discussed below.
We observe a decrease in current intensity for the crosslinked EVA particularly for
the high glass transition temperature. There is a large reduction in the depolarization
current that is especially apparent for the high temperature peak.
Fig. 3: TSDC curves of the original and crosslinked EVA
at polarization temperature of 60°C
Page 5
Effect of crosslinking on EVA-based encapsulant properties during photovoltaic…
307
We observe a decrease in current intensity for the crosslinked EVA particularly for
the high glass transition temperature. There is a large reduction in the depolarization
current that is especially apparent for the high temperature peak.
However, it is clear that in the high temperature transition, there is a distinct
difference between the original and crosslinked EVA. This strongly suggests that the
EVA is crosslinked selectively in the high temperature phase, and this is consistent with
the large reduction in depolarization current for the high temperature gT in the TSC
data.
3.2 Thermal transition by DSC
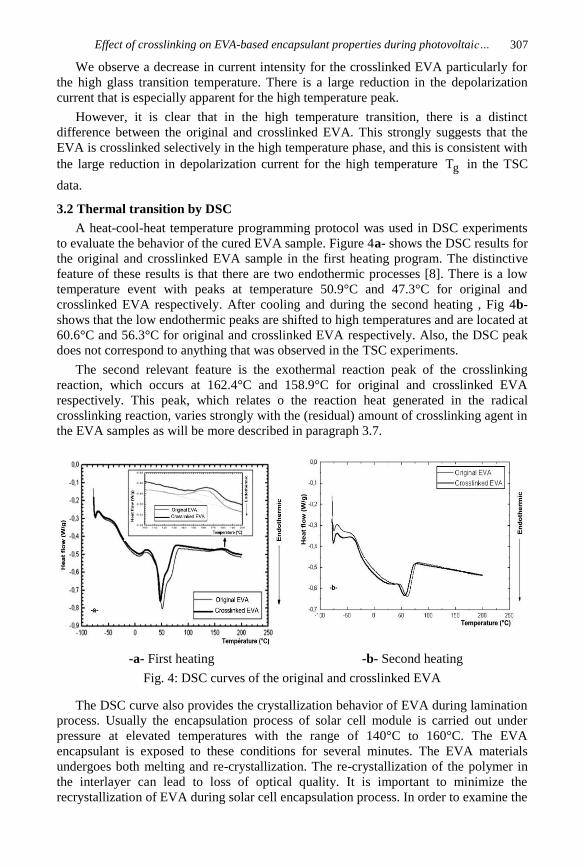
A heat-cool-heat temperature programming protocol was used in DSC experiments
to evaluate the behavior of the cured EVA sample. Figure 4a- shows the DSC results for
the original and crosslinked EVA sample in the first heating program. The distinctive
feature of these results is that there are two endothermic processes [8]. There is a low
temperature event with peaks at temperature 50.9°C and 47.3°C for original and
crosslinked EVA respectively. After cooling and during the second heating , Fig 4b-
shows that the low endothermic peaks are shifted to high temperatures and are located at
60.6°C and 56.3°C for original and crosslinked EVA respectively. Also, the DSC peak
does not correspond to anything that was observed in the TSC experiments.
The second relevant feature is the exothermal reaction peak of the crosslinking
reaction, which occurs at 162.4°C and 158.9°C for original and crosslinked EVA
respectively. This peak, which relates o the reaction heat generated in the radical
crosslinking reaction, varies strongly with the (residual) amount of crosslinking agent in
the EVA samples as will be more described in paragraph 3.7.
-a- First heating -b- Second heating
Fig. 4: DSC curves of the original and crosslinked EVA
The DSC curve also provides the crystallization behavior of EVA during lamination
process. Usually the encapsulation process of solar cell module is carried out under
pressure at elevated temperatures with the range of 140°C to 160°C. The EVA
encapsulant is exposed to these conditions for several minutes. The EVA materials
undergoes both melting and re-crystallization. The re-crystallization of the polymer in
the interlayer can lead to loss of optical quality. It is important to minimize the
recrystallization of EVA during solar cell encapsulation process. In order to examine the
Page 6
K. Agroui et al.
308
effect of crosslinking process on crystallinity of EVA, the degree of crystallinity was
calculated via the total enthalpy method [9] according to the {Eq. (1)}:
%100H
H(%)
100
mc
(1)
where c is the degree of crystallinity, mH is the specific enthalpy of melting of
the sample studied and 100H is the specific enthalpy of melting for 100% crystalline
Polyethylene (288 J/g).
Since the previous thermal history of a polymer affects the calculated degree of
crystallinity, EVA crystallinity was evaluated after being subjected to a second heating
designed to remove the effect of prior thermal history [10, 11]. The degree of
crystallinity of EVA before and after crosslinking remains unchanged and is calculated
to be 5%.Therefore, the crystallinity of EVA depends only on the actual cooling rate of
the lamination process, but not on the heating rate during endothermic melting. The
recrystallization degree represents by endothermic melting enthalpy depicts the overall
crystallinity in EVA.
3.3 Measurement of the crosslinking rate in EVA before and after encapsulation
process
The most important method for measuring the crosslinking degree of an EVA is
solvent extraction method. In addition to this, DSC curve may also provide information
about the curing degree of the polymer encapsulant. The ratio of exothermic enthalpy of
crosslinked EVA at different laminating temperatures to as received EVA can be used
to estimate the gel content of EVA. The crosslinking rate ( rC ) or gel content is
estimated by the {Eq. (2)} from the exothermic peak as follow:
%100H
H(%)C
c
er
(2)
where, cH , original EVA enthalpy (W/g) ; eH , crosslinked EVA enthalpy (W/g).
The enthalpy value is deduced from the area of exothermic peak of DSC curve
during the first heat in the range of temperatures from 120°C to 200°C, where the
crosslinking reaction is nearly completed after about 8.5 minutes, visible in a sloping-
off of the curve. The original and crosslinked EVA enthalpy is to be 4.1176 J/g and
2.764 J/g respectively. Therefore, the crosslinking rate obtained by DSC method is 67
%. In the second measurement, no indication of incomplete crosslinking is found, as the
heat flow shows a straight line and no remaining exothermic peak as revealed by figure
4b-.
The gel content of EVA obtained by solvent extraction is within 4% upper than that
by DSC curve. The DSC method detects the enthalpy changes of crosslinking reaction,
even when a slight amount of reaction occurs. However, solvent extraction method
measures the amount of undissolved EVA during solvent extraction treatment to
calculate the curing degree of crosslinked EVA.
Since the slight crosslinked EVA may dissolved in solvent, the DSC method will
provide more accurate data of crosslinking reaction extent. Moreover, there is another
advantage of using DSC method over solvent extraction treatment, time consuming and
not so environmental friendly procedures undertaken by solvent extraction method.
Page 7
Effect of crosslinking on EVA-based encapsulant properties during photovoltaic…
309
However, the error of gel content measured by DSC curve may increase when the
exothermic enthalpy of crosslinking reaction is small.
3.4 Dynamic thermo- mechanical properties by DMTA
DMTA analysis is used to evaluate the mechanical relaxations in EVA samples. The
DMTA curves represented by the storage modulus ( 'E ) and loss tangent ( tan ) of the
EVA during encapsulation process are illustrated in figures 5 and 6 respectively. DMTA
analyses revealed that the storage modulus increases dramatically from 50 MPa to 2
GPa.
In the same process, the loss tangent curve exhibits two relaxation peaks in good
agreement with the TSC thermogram. Crosslinked EVA exhibits lower loss tangent than
original EVA due to the effect of crosslinking.
EVA exhibits at least two distinct drops in modulus. The low temperature drop is
accompanied by a peak in the tan as revealed in figure 5. This low temperature
mechanical loss process is taken to correspond to the low temperature relaxation peak
observed in the TSDC [12].
Fig. 5: Variation of storage modulus of
EVA before and after crosslinking process
Fig. 6: Variation of loss tangent factor of
EVA before and after crosslinking process
3.5 Static mechanical properties by tensile tests
The ultimate mechanical properties of EVA before and after crosslinking process are
shown in Table 1 and 2 respectively. These tables summarize the most important static
mechanical properties like elastic modulus, strain-at-break and stress-at-break.
Basically, and in agreement with requirement profile for elastomeric encapsulant,
all materials show a highly ductile behavior, high flexibility and pronounced yield
point.
Evaluation of the average elastic modulus, i.e. the slope to the stress- strain curve in
the elastic deformation region at low strains, yielded values of 10 MPa and 6 MPa for
original and crosslinked EVA samples respectively.
It is noted a moderate decrease in elastic modulus due to the crosslinking reaction
which is in good agreement with DMTA results.
Page 8
K. Agroui et al.
310
Table 1: Tensile test results of original EVA
tE (MPa) b (MPa) b (%)
Probe 1 9.90 5.87 1511.21
Probe 2 10.02 5.56 1435.08
Probe 3 9.64 5.55 1364.15
Probe 4 9.72 4.76 1281.54
Probe 5 10.53 5.87 1382.74
Mean value 9.96 5.52 1394.94
Deviation 0.35 0.45 85.28
Table 2: Tensile test results of crosslinked EVA
tE (MPa) b (MPa) b (%)
Probe 1 5.95 3.34 1010.33
Probe 2 5.95 4.45 1127.74
Probe 3 5.28 3.33 1090.85
Probe 4 7.15 5.55 1189.52
Probe 5 7.19 5.15 1116.24
Mean value 6.30 4.36 1106.94
Deviation 0.84 1.02 65.06
Figure 7 shows exemplary stress-strain curves of EVA before and after crosslinking
process for the test probe 3, illustrating the general stress–strain behavior of the EVA
materials.
Fig. 7: Stress-strain curves of EVA before and after crosslinking process
Otherwise, significant changes could be observed in the post-yield region. While all
samples exhibited an essentially bi-linear stress-strain relation-ship, the crosslinked
EVA samples are less significantly stiffer in this region and the strain-at-break values
are lower [13].
Regarding tensile testing results, the original and crosslinked EVA material exhibit a
high ductile behavior with the average strain at break (stress at break) values of about
1366% and 1110% (5.52 MPa and 3.32 MPa) respectively. This can be attributed to the
Page 9
Effect of crosslinking on EVA-based encapsulant properties during photovoltaic…
311
three-dimensional widely meshed polymer network, which restricts re-orientation and
slipping of the polymer chains, thus significantly constraining the plastic deformation.
Also, for the investigated EVA samples a clear influence of crosslinking process
parameters as time, temperature and pressure is observed. Strain-at-break and stress-at-
break values are very sensitive to changes in molecular mass of the polymer and
therefore sensitive to chemical crosslinking reaction [14].
3.6 Thermal stability by TGA in inert and oxidative atmosphere
Figure 8 shows the weight change of EVA material as function of the temperature
by TGA analysis in inert atmosphere (Argon gas) during PV module encapsulation
process. It is not easy to correctly model the EVA degradation process due to the fact
that the reaction is complicated and involves multiple steps.
There is no general way of defining the onset of degradation of a polymer material,
but we can define the temperature in a scanning TGA experiment as the start of weight
loss. In a TGA weight loss curve the degradation onset of the original and crosslinked
EVA is 85°C and 51°C respectively.
At this temperature, the weight loss of the original and crosslinked EVA is 0.125%
and 0.1806% respectively. Weight loss below 100°C is initial water content both in
EVA.It demonstrated that crosslinked EVA is very stable and no substantial weight loss
will occur at processing or operational cell temperature.
Fig. 8: TGA curves of EVA before and after crosslinking process
Also, figure 9 shows the TGA curves analysis in isothermal mode at 160°C, which
was in the typical range of the crosslinking reaction process, and in oxidative
atmosphere (oxygen gas). It appears clearly that holding EVA samples at temperature of
160°C for 5 hours; the mass loss weight is 1.5% and 0.05% for original and crosslinked
EVA respectively.
This is the evidence that crosslinked EVA exhibits very high stability in oxidative
atmosphere and under high temperature due to the crosslinking reaction and also the
presence of anti- oxidant additive [15, 16].
3.7 Effect of crosslinking on the resistivity of EVA
As shown in figure 10, the resistivity decreases with increasing temperature i.e. the
EVA has a negative resistivity temperature coefficient. The experimental measurement
results show that crosslinked EVA exhibits higher resistivity than the original EVA.
Page 10
K. Agroui et al.
312
This provides the high electrical insulation which is needed to guarantee circuit isolation
from environmental damages.
Fig. 9: TGA curves of EVA in isothermal
mode before and after crosslinking process
Fig. 10: Variation of the resistivity of EVA as function of temperature
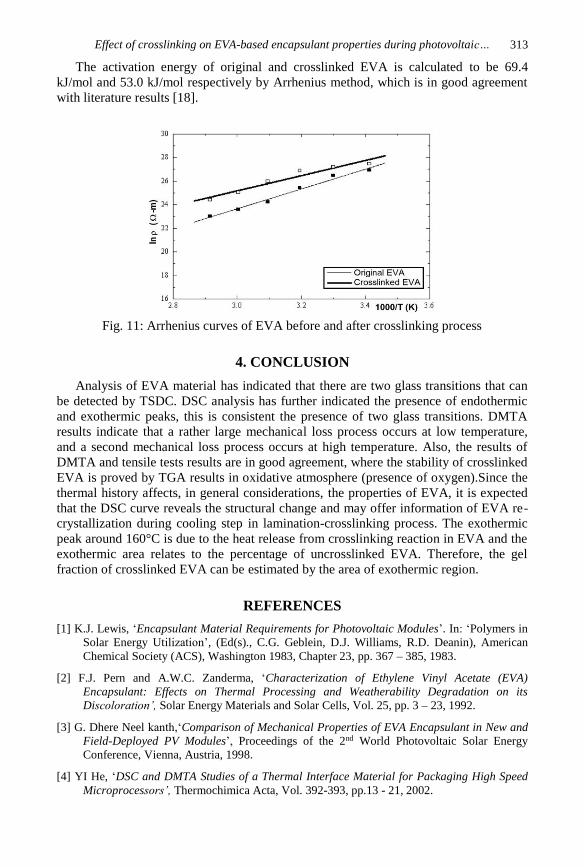
The second approach is the evaluation of the activation energy of EVA during
encapsulation process by using the Arrhenius method. Experimentally [17], the
temperature dependence of resistivity is given by {Eq. (3)}:
TREexp a (3)
Where, and are the resistivity at temperature T and T respectively, aE
(J/mol) is the activation energy and R is the Gas constant (8.314 J/mol.K).
A plot of T/1000.vsLog will yield a straight lineas seen in figure 11, where the
activation energy W can be obtained from the curve slope ( REa ) according to
{Eq. (4)}:
lnT
1
R
ELog a (4)
Page 11
Effect of crosslinking on EVA-based encapsulant properties during photovoltaic…
313
The activation energy of original and crosslinked EVA is calculated to be 69.4
kJ/mol and 53.0 kJ/mol respectively by Arrhenius method, which is in good agreement
with literature results [18].
Fig. 11: Arrhenius curves of EVA before and after crosslinking process
4. CONCLUSION
Analysis of EVA material has indicated that there are two glass transitions that can
be detected by TSDC. DSC analysis has further indicated the presence of endothermic
and exothermic peaks, this is consistent the presence of two glass transitions. DMTA
results indicate that a rather large mechanical loss process occurs at low temperature,
and a second mechanical loss process occurs at high temperature. Also, the results of
DMTA and tensile tests results are in good agreement, where the stability of crosslinked
EVA is proved by TGA results in oxidative atmosphere (presence of oxygen).Since the
thermal history affects, in general considerations, the properties of EVA, it is expected
that the DSC curve reveals the structural change and may offer information of EVA re-
crystallization during cooling step in lamination-crosslinking process. The exothermic
peak around 160°C is due to the heat release from crosslinking reaction in EVA and the
exothermic area relates to the percentage of uncrosslinked EVA. Therefore, the gel
fraction of crosslinked EVA can be estimated by the area of exothermic region.
REFERENCES
[1] K.J. Lewis, ‘Encapsulant Material Requirements for Photovoltaic Modules’. In: ‘Polymers in
Solar Energy Utilization’, (Ed(s)., C.G. Geblein, D.J. Williams, R.D. Deanin), American
Chemical Society (ACS), Washington 1983, Chapter 23, pp. 367 – 385, 1983.
[2] F.J. Pern and A.W.C. Zanderma, ‘Characterization of Ethylene Vinyl Acetate (EVA)
Encapsulant: Effects on Thermal Processing and Weatherability Degradation on its
Discoloration’, Solar Energy Materials and Solar Cells, Vol. 25, pp. 3 – 23, 1992.
[3] G. Dhere Neel kanth,‘Comparison of Mechanical Properties of EVA Encapsulant in New and
Field-Deployed PV Modules’, Proceedings of the 2nd World Photovoltaic Solar Energy
Conference, Vienna, Austria, 1998.
[4] YI He, ‘DSC and DMTA Studies of a Thermal Interface Material for Packaging High Speed
Microprocessors’, Thermochimica Acta, Vol. 392-393, pp.13 - 21, 2002.
Page 12
K. Agroui et al.
314
[5]‘Determining the gel content of ethylene vinyl acetate’, Specialized Technology Resources,
Inc., Available on http://www.PhotoCap.net.
[6] G. Oreski and G.M. Wallner,‘Evaluation of the Aging Behavior of Ethylene Copolymer Films
for Solar Applications under Accelerated Weathering Conditions’, Solar Energy, Vol. 83,
N°7, pp. 1040 – 1047, 2009.
[7] K.Agroui, A. Belghachi, G. Collins and J.Farenc, ‘Quality Control of EVA During
Photovoltaic Module Encapsulation Process’, Desalination, Vol. 209, pp. 1 – 9, 2007.
[8] K. Agroui and G. Collins, ‘Characterization of EVA Encapsulant Material by Thermally
Stimulated Current Technique’, Solar Energy Materials and Solar Cells, Vol. 80, N°2, pp.
33 – 45, 2003.
[9] J.A. Reyes-Labarta, M.M. Olaya and A. Marcilla, ‘DSC and TGA Study of the Transitions
Involved in the Thermal Treatment of Binary Mixtures of PE and EVA Copolymer with A
Crosslinking Agent’, Polymer, Vol. 47, pp. 8194 – 8202, 2006.
[10] W. Stark and M. Jaunich, ‘Investigation of Ethylene Vinyl Acetate Copolymer (EVA) By
Thermal Analysis DSC and DMA’, Polymer Testing, Vol. 30, N°2, pp. 236 – 242, 2011.
[11] L.M. Huang, R.J. Wu, M.C. Lai, W.K. Lee and F.M. Lin, ‘The Evaluations of Physical
Properties and Lamination Process Parameters of EVA Encapsulant by Thermal Analysis’,
Proceedings of the 24th European Photovoltaic Solar Energy Conference, Hamburg,
Germany, 2009.
[12] K. Agroui, G. Collins and J. Farenc, ‘Measurement of Glass Transition Temperature of
Crosslinked EVA Encapsulant by Thermal Analysis for Photovoltaic Application’,
Renewable Energy, Vol. 43, pp. 218 – 223, 2012.
[13] C. Hirschl et al., ‘Determining the Degree of Crosslinking of Ethylene Vinyl Acetate
Photovoltaic Module Encapsulants, A Comparative Study’, Solar Energy Materials and
Solar Cells, Vol. 116, pp. 203 – 218, 2013.
[14] G. Oreski, ‘Accelerated Indoor Durability Testing of Polymeric Photovoltaic Encapsulation
Materials’, Proceedings of SPIE 2010; 7773:77730D, ‘Reliability of Photovoltaic Cells,
Modules, Components, and Systems III’, San Diego, California, 2010.
[15] A.W.C. Czanderna and F.J. Pern, ‘Encapsulation of PV Modules Using Ethylene Vinyl
Acetate Copolymer as a Pottant: A Critical Review’, Solar Energy Materials and Solar
Cells, Vol. 43, pp. 101 – 181, 1996.
[16] K. Agroui, A. Maallemi, M. Boumaour and D. Ouadjaout, ‘Effect of Crosslinking on
Thermal Stability of Standard Eva Encapsulant Material’, Proceedings of the 21st European
Photovoltaic Solar Energy Conference and Exhibition, Dresden, Germany, 2006.
[17] J.J. Lieari and L.A. Hughes, ‘Functions of Coating’. In: ‘Handbook of polymer coatings for
electronics: Chemistry, Technology and applications’ (Ed(s) J.J. Lieari and L.A. Hughes),
Noyes Publications, New Jersey, Chapter 4, pp. 103 – 149, 1990.
[18] M. Bregulla et al., ‘Degradation mechanisms of Ethylene Vinyl Acetate copolymer: New
Studies including ultra-fast cure foils’, Proceedings of the 22nd European Photovoltaic Solar
Energy Conference, Milan, Italy, 2007.