Effect of Crumb Rubber on Asphalt Mixture Performance 1Rahul R G, 2Nidhin G. Raj, 3Nadhiya F M, 4Hima Mohan, 5Athira K S, 6Goutam Divakar Santhish
Introduction
Now-a-days disposal of different wastes produced from different Industries is a great problem. These materials possess environmental pollution in the nearby locality because many of them are non-biodegradable. Traditionally soil, stoneaggregate, sand, bitumen, cement etc. are used for road construction. Concerned about this, the scientists are looking for alternative materials for highway construction, by which the pollution and disposal problems may be partly reduced. Keeping in mind the need for bulk use of these solid wastes in India, it was thought the use of waste tires in road making in which higher economic returns may be possible.
The possible use of these materials should be developed for construction of low volume roads in different parts of our country. The necessary specifications should be formulated and attempts are to be made to maximize the use of solid wastes in different layers of the road pavement. Rubber tyres are user friendly but not ecofriendly as they are non-biodegradable generally. The practice of disposing waste tyres in landfills and open burning is becoming unacceptable because of rapid depletion of available landfill sites and clear environment respectively. The conventional bituminous mix includes stone
aggregate and 3 to 5 percent bitumen by weight of the aggregate. These crap tyre rubbers can be incorporated into bitumen, often abbreviated as modified bitumen and granulated or ground rubber or crumb rubber can be used as a portion of the fine stone aggregate. The use of waste in hot bituminous mixes enhances pavement performance, protect environment, and provide low cost and quieter roads.
Objectives
The present study is concerned with the effect of crumb rubber on the strength characteristics of bituminous concrete used for the surface course of bituminous pavements. Design of an ideal polymer modified bituminous concrete mix and comparison of the cost and performance of polymer modified and conventional plain mixes is aimed in this study. Besides the changes in the properties of bitumen binder viz. penetration and softening point are also investigated.
Literature Review
Patel Chirag B (2013) used the Crumb Rubber as a modifier the properties of bitumen will be change and this change in physical properties like softening
Abstract
Use of Crumb Rubber i.e. the rubber obtained from the waste tires of vehicles in the construction of flexible pavement is gaining importance. It is also worth mentioning that, the modifier raw-material has been sourced from disposed crumb rubber. This not only allows us to collect modifier raw material at low cost, but also provides a solution towards ecological menace posed by increased use of rubber. In the present study, an attempt has been made to use Crumb Rubber, blended using wet process .Marshal method of Bituminous mix design was carried out for varying percentages of Crumb Rubber to determine the different mix design characteristics. Marshall’s mix design was carried out by changing the modified bitumen content at constant optimum rubber content and subsequent tests have been performed to determine the different mix design characteristics and for conventional bitumen Volatile Grade-30 (VG-30). This has resulted in much improved characteristics when compared with straight run bitumen and improve the strength of pavement Modified Bitumen is one of the important construction materials for flexible pavements.
757
Rahul R G et al. International Journal of Science, Engineering and Technology, 2016, Volume 4 Issue 5 ISSN (Online): 2348-4098 , ISSN (Print): 2395-4752
point, penetration value, elastic recovery and Marshall Stability was checked bydifferent test. In this study he used modifier in proportion(1%,2%,3% and 4%) by the weight of bitumen.
R.Vasudevanet. Al.(2007)has studied that the crumb rubber modified bitumen and they construct different stretches and perform field study with the help of National Transport Planning and Research Centre, Trivandrum. From this field study they concluded that the entire road having a good skid resistance value and from bump integrator study a good surface evenness.
Shankar (2009)used crumb rubber modified bitumen (CRMB55) was blended at specified temperatures. Marshall’s mix designwas carried out by changing the modified bitumen content atconstant optimum rubber content and subsequent tests have been performed to determine the different mix design conventional bitumen (60/70) also. This has resulted in much improved characteristics and for characteristics when compared with straight run bitumen and that too at reduced optimum modified binder content of 5.67%.
Materials Used
All the materials used for the study was collected locally from Vattiyoorkavu quarry and are tested for its quality on Kerala Highway Research Institute (KHRI). Coarse Aggregates of 20mm, 12mm, 6mm sizes available were blended together to obtain the required gradation. Quarry dust passing 2.36mm sieve and retained on 75 micron sieve, which was locally available was used as fine aggregate for the mix design. Ordinary Portland cement was selected as filler. Penetration grade bitumen 60/70 was used for the study. The penetration value was obtained as 66.3 and the softening point as 480C. Crumb Rubber granules is used as the additives or modifier for bituminous concrete which has been brought for a price of Rs.150 /-for 1 kg. The Crumb Rubber granules obtained was passing through 1.18 mm sieve is used for the study.
Methodology
Tests On Bitumen
Penetration test: The penetration test determines the hardness or softness of bitumen by measuring the depth in tenths of a millimeter to which a standard loaded needle will penetrate vertically in 5 sec. The bitumen is softened to a poring consistency, stirred thoroughly and poured in to containers to a depth at least 15mm in excess of the expected penetration. The penetration value for VG30 (VG-
volatile grade) grade bitumen ranges from 60 to 70.The penetration value of the bitumen used is 66.3, which is within the limit.
Ductility: The ductility test is carried out on bitumen to test the property of binder to form thin films around the aggregates. The test is to measure the adhesive property of bitumen and its ability to stretch. The ductility is expressed as the distance in centimeters to which a standard briquette of bitumen can be stretched before the thread breaks. A min ductility value of 40cm has been specified by the IS for bitumen grade of VG 30.The ductility value of the bitumen used is 72cm, which is within the limit.
Softening Point: The softening point is the temperature at which the substance attains a particular degree of softening under specified conditions of test. The softening point of bitumen is usually determined by Ring and Ball test. The softening point of various bitumen grades used in paving jobs varies between 35˚C to 70˚C. For VG 30 the value should be greater than 47˚C.The softening point of bitumen used is 48 ˚C, which is within the limit.
Specific Gravity of bitumen: The specific gravity of bituminous material is defined as the ratio of mass of a given volume of substance to the same of an equal volume of water, the temperature of both being 270C. The specific gravity of the bitumen used is 1.02,which is within the limit.
Tests On Aggregates
Aggregate crushing value: The aggregate sample for test consists of aggregates passing through 12.5mm sieve and retained on 10mm sieve. The aggregate crushing value used for road constructions should be between 20%-30%.The crushing value of the aggregate used is 24%,which is within the limit.
Aggregate impact value: The test sample consists of aggregates sized 10mm to 12.5mm. The aggregate impact value is expressed as the percentage of the fine formed in terms of the total
weight of the sample. For bituminous concrete the impact value should be less than 24%. The impact value of aggregate used is 18%, which is within the limit.
Specific gravity and water absorption test: The specific gravity of coarse aggregates normally used in road construction ranges from 2.5 to 3.2.The specific gravity and water absorption values for
758
Rahul R G et al. International Journal of Science, Engineering and Technology, 2016, Volume 4 Issue 5 ISSN (Online): 2348-4098 , ISSN (Print): 2395-4752
coarse aggregates used is within the limit for 20mm, 12mm, 6mm aggregates.
Shape test: The particle shape of aggregate mass is determined by the percentages of flaky and elongated particles contained in it, in terms of flakiness index and elongation index.
Los Angeles Abrasion test: The principle of Los Angeles abrasion test is to find the percentage wear due to the relative rubbing action between the aggregates and the steel balls used as abrasive charge. The Los Angeles abrasion value of good aggregates acceptable for cement concrete, bituminous concrete and other high quality pavement materials should be less than 30%. The Abrasion value of aggregates used is 28.28%, which is within the limit.
Proportioning of aggregates: The gradation recommended by MORTH for bitumenic concrete for the wearing course of highways with heavy traffic was used for all the investigations. The aggregates of size 19mm, 12mm, 6mm, quarry dust and cement as filler were to be blended. The properties of a bituminous mix including the density and stability are very much dependent on the aggregates and their grain size distribution. As higher maximum size of aggregate gives higher stability, usually the biggest size that can be adopted keeping in view of the compacted thickness of the layer is selected, provided all other factors are equal.
Marshall Method of Mix Design
Marshall Stability test is conducted on compacted cylindrical specimens of bituminous mix of diameter 101.6mm thickness 63.5mm. The load is applied perpendicular to the axis of the cylindrical specimen through a testing head, consisting of a pair of cylindrical segments, at a constant rate of deformation of 51mm per minute at the standard temperature of 600C. The ‘Marshall Stability’ of the bituminous mix specimen is defined as a maximum load carried in kg at the standard test temperature of 600C when load is applied under specified test condition. The ‘Flow Value’ is the total deformation of Marshall Test specimen at maximum load, expressed in mm units. The Marshall Stability value of a compacted specimen of bituminous mix indicates its resistance to deformation under applied incremental load and the flow value indicates the extent of deformation it undergoes due to loading or its flexibility.
Preparation of Test Specimens
The coarse aggregates, fine aggregates and the filler materials are proportioned and mixed in such a way that final gradation of the mixture is within the range specified for desired type of bituminous mix. The maximum permissible size of coarse aggregates for the preparation of Marshall Stability test specimen is 25mm.The type and gradation of aggregate to be used, the type of bituminous binder and range of binder content to be used for the preparation of the bituminous mix specimens are given in the relevant standard specifications. The aggregates and the filler are mixed together in the desired proportion to fulfill the design requirements and the specified gradation. The required quantity of the mineral aggregate mix weighed and taken so as to produce a compacted bituminous mix specimen of thickness 63.5mm approximately. At least 3 test specimens should be prepared for each mix of aggregates and bitumen content.
Determination of Weight And Dimensions Or Volume Of Test Specimens
Each specimen prepared as above is weighted in air and the average diameter and thickness of the cylindrical specimen is obtained by taking measurements at 3 or 4 locations of the specimen. The volume of each specimen is calculated from the average diameter and thickness values. The volume of specimens may also be determined by finding the weights of the specimen in air and its apparent weight by suspending it in water. The main objective is to determine the density or specific gravity of each compacted bituminous mix specimen.
Determination of Marshall Stability And Flow Values
The specimens to be tested are kept immersed under water in a thermostatically controlled water bath maintained at 60ºC±1ºC for 30-40. The loading unit of Marshall Stability testing machine is started and the load is applied at the constant deformation rate of 51mm per minute. The load and the deformation readings are closely observed. The maximum load reading and the corresponding deformation dial reading are noted. The maximum load value expressed in kg is recorded as the ‘Marshall Stability’ value of the specimen. The vertical deformation of the test specimen corresponding to the maximum load, expressed in 0.25mm units is recorded as the ‘Flow Value’.
Interpretation of Test Data and Calculations
Correction Factors for Marshall Stability Value
759
Rahul R G et al. International Journal of Science, Engineering and Technology, 2016, Volume 4 Issue 5 ISSN (Online): 2348-4098 , ISSN (Print): 2395-4752
The thickness of compacted specimens and therefore the volume and density of the specimens are likely to vary depending on factors such as the initial weight of the aggregates, the mean specific gravity of aggregates used and due to variation in bitumen content in the specimens. Therefore it is necessary to apply appropriate correction factor to the maximum load value or Marshall Stability value recorded for each test specimen. If the average thickness of the specimen is exactly 63.5mm,it is not necessary to apply correction factor. If the average value is not 63.5mm or if the volume is not in the range 509-522 cm³, it is necessary to apply the appropriate correction factors.
Correction Factors
Volume of Specimen,cm³
Average Thickness of Specimen, mm
Correction factors
457-470 57.2 1.19
471-482 58.7 1.14
483-495 60.3 1.09
496-508 61.9 1.04
509-522 63.5 1.00
523-535 65.1 0.96
536-546 66.7 0.93
547-559 68.3 0.89
560-573 69.8 0.86
Density and Void Analysis
Total Volume of the compacted specimen = V, Void-less volume of all the mineral aggregates and filler = Vm, Volume of voids in mineral aggregates, VMA = V-Vm ,Total volume of bituminous binder in the mix = Vb, Part volume of the binder absorbed by the aggregates = Vba, Rest of binder filled in part of voids in mineral aggregates = Vbf
Therefore,
Vb = (Vba +Vbf)
Volume of air voids in the mix,Vv = V-(Vm+Vbf)
Volume of voids filled with bitumen,VFB = (VMA-Vv)
Voids-less volume of the paving mix = (V-Vv)
Vv (%) = 100*(Gt-Gb) /Gt
Vb (%) = Gb*(W4/G4)
MA (%) = Vv+Vb
VFB (%) = (100*Vb/VMA)
Theoretical Density or Specific Gravity of the Bituminous Mix Specimen
The specific gravity values of the different aggregates and bituminous binders used are determined before conducting Marshall Stability test on bituminous mix the apparent specific gravity values of these materials be : Coarse aggregates = G1, Fine aggregates = G2, Bituminous binder = G4, Filler = G3 The theoretical specific gravity value of the bituminous mix specimen, Gt is given by
Gt = (100/ ((W1/G1)+(W2/G2)+(W3/G3)+(W4/G4)))
Analysis of test data
The criteria used to select the optimum bitumen content can vary considerably between agencies. The Asphalt Institute method and the National Asphalt Pavement Association procedure are described below.
Design criteria
For the optimum binder content of 5.2% the corrected Marshal stability, flow value, the percentage of air voids filled with bitumen and the percentage of air voids in the total mix are obtained from the plotted graphs. These are checked with the values specified by MORTH and are found to be within the limit.The quantity of aggregates and bitumen for 1.2kg of bituminous concrete mix are estimated .
Determination of optimum crumb rubber content
The following steps are followed for determining the optimum crumb rubber content. Marshall Specimens were prepared with varying the percentage of crumb rubber by weight of bitumen. The specimens prepared were allowed to cool for 24 hours. Then it was extracted from the mould and the length, weight in air, weight in water was determined. Then the specimen was maintained at a temperature of 600+10C for 30 minutes. The flow meter was set to zero and the load was applied after proper positioning of testing head and specimen. The specimen is then loaded and the stability and flow value at failure is noted. From the stability and flow values noted, the optimum % crumb rubber is determined. The optimum crumb rubber content is
760
Rahul R G et al. International Journal of Science, Engineering and Technology, 2016, Volume 4 Issue 5 ISSN (Online): 2348-4098 , ISSN (Print): 2395-4752
that content at which the maximum stability value is obtained. After the addition of crumb rubber, fromthe Marshall Stability value obtained, the following graphs have to be prepared.
Stability Vs% of crumb rubber added,
Flow value Vs % of crumb rubber added.
The stability values and flow values are determined from the various percentage of crumb rubber added to bituminous mix along with the optimum binder content. The graphs are prepared with the data’s. From the plotted graphs, maximum stability and flow value is determined, and it is then compared with the conventional bituminous concrete.
Results and Discussions
Penetration Test
Particulars Test 1 Test 2 Test 3
Initial penetrometer reading
0 0 0
Final penetrometer reading
69 70 60
Penetration Value 69 70 60
Mean Penetration Value
66.3
For VG-30 grade, penetration value ranges between 60-70, The penetration value of bitumen is 66.3,which is within the limit
Ductility
Ductility value: 72cm
For VG-30 grade, ductility value should be minimum of 40cm, The ductility value of bitumen used is 72cm, which is within the limit.
Softening Point
Softening point: 48˚C
For VG-30, softening point value should be greater than 47˚C, The softening point of bitumen used is 48˚C, which is within the limit.
SPECIFIC GRAVITY OF BITUMEN
Particulars Sample 1
Weight of empty bottle, W1 20.1
Weight of bottle+ water . w4 45
Weight of bottle+bitumen, w2 33.6
Wieght of bottle+bitumen+water. W3
45.3
Specific Gravity, G = ((W2-W1)/((W4-W1)-(W3-W2))
1.02
The specific gravity of pure bitumen is in the range of 0.97-1.05, The specific gravity of the bitumen used is 1.02, which is within the limit.
Aggregate Crushing Value
Particulars Sample 1
Total Weight of dry sample taken, W1 g 3231
Weight of portion passing 4.75mm sieve, w2 g
787
Aggregate crushing value (%)=(w2/w1)*100
24
The crushing value is in the range 20%-30%, The crushing value of the aggregate used is 24%,which is within the limit.
Aggregate Impact Value
Particulars Sample1 Sample2 Sample3
Weight of empty mould (g)
742.3 742.3 742.3
Weight of mould+ Sample (g)
1089.4 1099.8 1103.5
Total weight of dry aggregates , W1 (g)
347.1 357.5 361.2
Weight of the portion passing 2.36 mm sieve, W2 (g)
65.5 62.1 67.2
Aggregate impact value= (W2/W1)*100
18.7 17.37 18.63
Mean Aggregate impact value (%)
18
The impact value should be less than 20%, The impact value of the aggregates used is 18%, which is within the limit
761
Rahul R G et al. International Journal of Science, Engineering and Technology, 2016, Volume 4 Issue 5 ISSN (Online): 2348-4098 , ISSN (Print): 2395-4752
Specific Gravity and Water Absorption Test on Aggregates
Particulars 20mm 12mm 6mm
Weight of saturated aggregates suspended in water with basket, W1 (g) 1301 1927 1272
Weight of empty basket suspended in water, W2 (g) 636 649 636
Weight of saturated aggregate in water, Ws = W1 – W2, (g) 665 1278 636
Water absorption value for coarse aggregates is in the range 0.1%-2%.specific gravity value is in the range of 2.5-3.2, The water absorption and specific gravity of the used aggregates is within the limit.
SPECIFIC GRAVITY OF M-SAND
Weight of empty bottle, W1g 25.2 25.2
Weight of bottle + M-Sand, W2g 62.8 61
Weight of bottle + M-Sand + water, W3g 98.5 97.8
Weight of bottle + water, W4g 75.5 75.5
Specific gravity =(W2–W1)/[(W4-W1)-(W3-W2)] 2.57 2.65
Average Specific gravity ,G 2.6
SPECIFIC GRAVITY OF FILLER
Weight of empty bottle, W1g 25.2 25.2
Weight of bottle + filler, W2g 65 59.4
Weight of bottle + filler + water, W3g 100.4 96.6
Weight of bottle + water, W4g 75.5 75.5
Specific gravity =(W2–W1)/[(W4-W1)-(W3-W2)] 2.67 2.61
Average Specific gravity ,G 2.64
The specific gravity for M-sand and filler is in the range 2.5-3.2, The specific gravity for m-sand and filler used is within the limit.
762
Rahul R G et al. International Journal of Science, Engineering and Technology, 2016, Volume 4 Issue 5 ISSN (Online): 2348-4098 , ISSN (Print): 2395-4752
Shape Test
Flakiness and Elongation Index
IS Size range of aggregate passing & retained ,mm
Weight of 200 pieces of aggregate in the range, W(g)
Thickness gauge size, mm
Weight of flaky particles (aggregates passing thickness gauge), w(g)
Length gauge size,
mm
Weight of elongated particles retained on Length Gauge, E (g)
63-50 0 33.9 0 - 0
50-40 0 27 0 81 0
40-31.5 0 19.5 0 58.5 0
31.5-25 0 16.95 0 40.5 0
25-20 0 13.5 0 32.4 0
20-16 0 10.8 0 25.6 0
16-12.5 335 8.55 33.8 20.2 175.6
12.5-10 1157.7 6.75 187 14.7 151.3
10-6.3 338.9 4.89 17.5 - 0
6.3-pan 19.2 - 0 - 0
∑W=1850.8 ∑w=238.3 ∑E=326.9
FLAKINESS INDEX =100*(∑w/∑W) FI = 12%
ELONGATION INDEX=100*(∑E/∑W) EI = 16%
The flakiness index of aggregates used in road construction is less than 15% and normally doesnot exceed 25%.flakiness index and elongation index values in excess of 30% undesirable for bituminous pavements, The sum of flakiness and elongation index values are 28%<30%, within the limit.
Los Angeles Abrasion Test
Number of revolutions 33
Weight of aggregate, W1 (g) 5000
Weight of oven dried aggregate after abrasion test (retained on 1.7mm sieve), W2 (g) 3586
Abrasion value=[(W1–W2)/W1]*100 28.28%
For bituminous concrete, abrasion value should not be less than 30%, Abrasion value of the aggregate used is 28.28%, within the limit
Grain Size Distribution
Grain Size Distribution of 20mm Aggregate
Weight of sample taken = 5000 g
IS sieve size, mm Weight retained, g % weight retained Cumulative % retained % finer
26.5 0 0 0 100
19 324.67 6.16 6.16 93.84
763
Rahul R G et al. International Journal of Science, Engineering and Technology, 2016, Volume 4 Issue 5 ISSN (Online): 2348-4098 , ISSN (Print): 2395-4752
13.2 105.04 19.04 25.2 74.8
9.5 111.8 17.88 43.08 56.92
4.75 520.8 3.84 46.92 53.08
2.36 101.47 19.71 66.63 33.37
1.18 25.3 9.74 76.37 23.63
0.6 388.35 5.15 81.52 18.48
0.3 100 2.42 88.84 11.16
0.15 100 2.42 91.26 8.74
0.075 205 4.52 95.78 4.22
Grain size distribution of 16mm aggregate
Weight of sample taken = 1550 g
IS sieve size, mm Weight retained, g % weight retained Cumulative % retained % finer
26.5 0 0 0 100
19 0 0 0 100
13.2 0 0 0 100
9.5 0 0 0 100
4.75 32.1 2.07 2.07 97.93
2.36 1121.8 72.37 74.44 25.56
1.18 240.3 15.5 89.94 10.06
0.6 39.8 2.567 92.567 7.433
0.3 34.6 2.232 94.739 5.261
0.15 9.8 0.632 95.371 4.629
0.075 32 2.064 98.235 1.765
Grain size distribution of 12mm aggregate
Weight of sample taken = 2447 g
IS sieve size, mm Weight retained, g % weight retained Cumulative % retained % finer
26.5 0 0 0 100
19 0 0 0 100
13.2 606.6 24.789 24.789 75.211
9.5 1523 62.23 87.019 12.981
4.75 284.9 11.64 98.659 1.341
764
Rahul R G et al. International Journal of Science, Engineering and Technology, 2016, Volume 4 Issue 5 ISSN (Online): 2348-4098 , ISSN (Print): 2395-4752
2.36 0 0 98.659 1.341
1.18 0.2 0.00817 98.667 1.333
0.6 0.3 0.012 98.679 1.321
0.3 0.5 0.020 98.879 1.121
0.15 0.4 0.016 98.895 1.105
0.075 2.7 0.1103 99.005 0.995
Grain size distribution of M- Sand
Weight of sample taken = 1000 g
IS sieve size, mm Weight retained, g % weight retained Cumulative % retained % finer
26.5 0 0 0 100
19 0 0 0 100
13.2 0 0 0 100
9.5 0 0 0 100
4.75 3.33 0.33 0.33 99.67
2.36 120.1 12.01 12.34 87.66
1.18 240 4 36.4 63.66
0.6 136.3 13.63 49.97 50.03
0.3 224.4 22.44 72.41 27.59
0.15 63.33 6.33 78.74 21.26
0.075 123.2 12.32 91.06 8.94
Grain size distribution of filler
Weight of sample taken = 5000 g
IS sieve size, mm Weight retained, g % weight retained Cumulative % retained % finer
26.5 0 0 0 100
19 0 0 0 100
13.2 0 0 0 100
9.5 0 0 0 100
4.75 0.5 0.038 0.038 99.962
2.36 97.2 7.476 7.514 92.486
1.18 200.7 15.43 22.944 77.056
0.6 226.4 17.415 40.359 59.641
765
Rahul R G et al. International Journal of Science, Engineering and Technology, 2016, Volume 4 Issue 5 ISSN (Online): 2348-4098 , ISSN (Print): 2395-4752
Rahul R G et al. International Journal of Science, Engineering and Technology, 2016, Volume 4 Issue 5 ISSN (Online): 2348-4098 , ISSN (Print): 2395-4752
0.3 0.410 8.202 86.57 13.43 11.16 10-20 15.0
0.15 0.299 5.972 92.55 7.45 8.74 5-13 9.0
0.075 0.244 4.874 97.42 2.58 4.22 2-8 5.0
Marshall Stability and Flow Data
Determination of Correction Factor
Specimen Height of Specimen(cm) Volume of Specimen(cm3) Correction factor
Bitumen Content: 5%
1 6.26 504.53 1.02
2 6.11 493.65 1.06
Bitumen Content: 5.5%
1 6.17 498.24 1.04
2 6.22 496.11 1.03
Bitumen Content: 6%
1 6.18 497.86 1.04
2 6.16 485.50 1.1
Marshall Stability and flow data
Specimen Flow value in mm
Avg flow value(mm)
Stability value, KN
Correction factor
Corrected stability(KN)
Avg load, KN
Bitumen content: 5%
1 3.5
3.65
12.6 1.02 12.8930
15.3505 2 3.8 16.8 1.06 17.8080
Bitumen Content: 5.5%
1 2.2
2.95
9.2 1.04 9.6071
10.4307 2 3.7 10.9 1.03 11.2453
Bitumen Content: 6%
1 3.8
3.7
12.3 1.04 12.8228
12.7274 2 3.6 11.5 1.10 12.6320
767
Rahul R G et al. International Journal of Science, Engineering and Technology, 2016, Volume 4 Issue 5 ISSN (Online): 2348-4098 , ISSN (Print): 2395-4752
Specific Gravity and Unit Weight
Calculation of Specific Gravity
Specimen Dry weightW1 Kg Wet weightW2Kg Gm=W1/(W1-W2) Average Gm Unit weight
Rahul R G et al. International Journal of Science, Engineering and Technology, 2016, Volume 4 Issue 5 ISSN (Online): 2348-4098 , ISSN (Print): 2395-4752
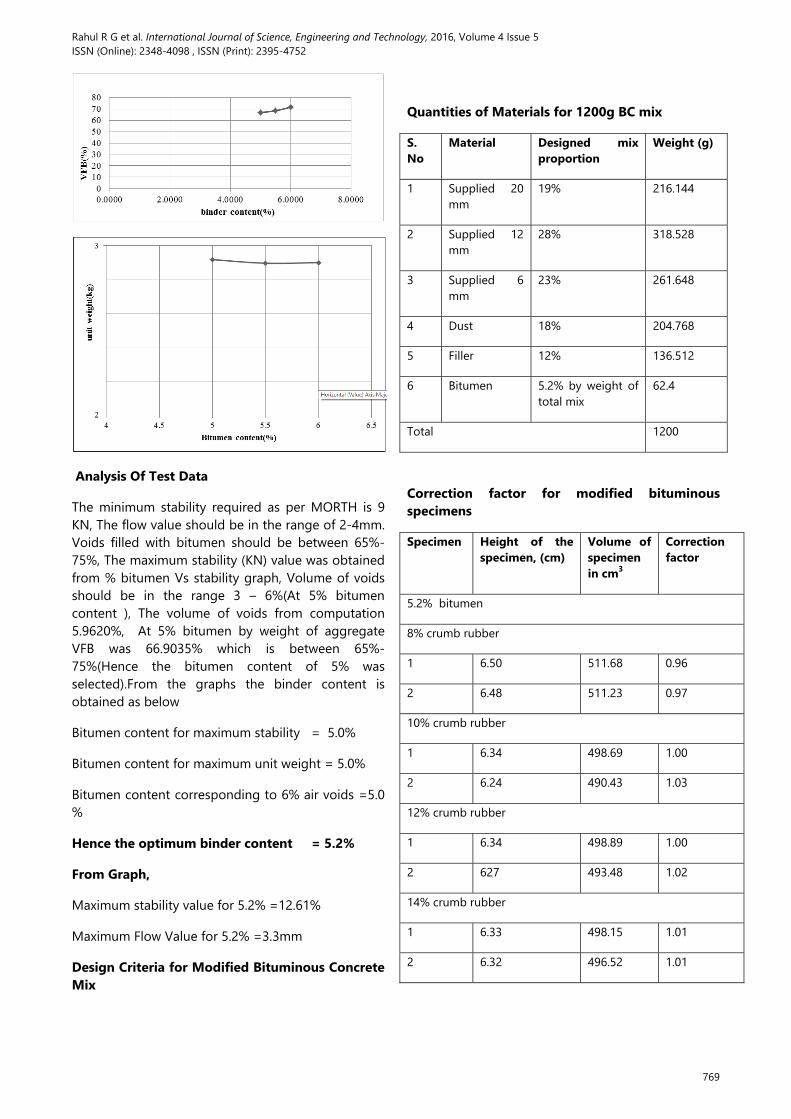
Analysis Of Test Data
The minimum stability required as per MORTH is 9 KN, The flow value should be in the range of 2-4mm. Voids filled with bitumen should be between 65%-75%, The maximum stability (KN) value was obtained from % bitumen Vs stability graph, Volume of voids should be in the range 3 – 6%(At 5% bitumen content ), The volume of voids from computation 5.9620%, At 5% bitumen by weight of aggregate VFB was 66.9035% which is between 65%-75%(Hence the bitumen content of 5% was selected).From the graphs the binder content is obtained as below
Bitumen content for maximum stability = 5.0%
Bitumen content for maximum unit weight = 5.0%
Bitumen content corresponding to 6% air voids =5.0 %
Hence the optimum binder content = 5.2%
From Graph,
Maximum stability value for 5.2% =12.61%
Maximum Flow Value for 5.2% =3.3mm
Design Criteria for Modified Bituminous Concrete Mix
Quantities of Materials for 1200g BC mix
S. No
Material Designed mix proportion
Weight (g)
1 Supplied 20 mm
19% 216.144
2 Supplied 12 mm
28% 318.528
3 Supplied 6 mm
23% 261.648
4 Dust 18% 204.768
5 Filler 12% 136.512
6 Bitumen 5.2% by weight of total mix
62.4
Total 1200
Correction factor for modified bituminous specimens
Specimen Height of the specimen, (cm)
Volume of specimen in cm3
Correction factor
5.2% bitumen
8% crumb rubber
1 6.50 511.68 0.96
2 6.48 511.23 0.97
10% crumb rubber
1 6.34 498.69 1.00
2 6.24 490.43 1.03
12% crumb rubber
1 6.34 498.89 1.00
2 627 493.48 1.02
14% crumb rubber
1 6.33 498.15 1.01
2 6.32 496.52 1.01
769
Rahul R G et al. International Journal of Science, Engineering and Technology, 2016, Volume 4 Issue 5 ISSN (Online): 2348-4098 , ISSN (Print): 2395-4752
Marshall test on modified bituminous specimen
Specimen Stability value Correction factor Corrected stability
Average stability value
Flow value Average flow value
5.2% bitumen
0% crumb rubber
1 13 0.97 12.61 12.61 3.3 3.3
8% crumb rubber
1 12.9 0.96 12.384
14.1945
3.05
3.53 2 16.5 0.97 16.005 4.01
10% crumb rubber
1 12.1 1.00 12.1
13.5175
3.9
2.96 2 14.5 1.03 14.935 2.03
12% crumb rubber
1 14.1 1.00 14.1
13.425
3.33
2.73 2 12.5 1.02 12.75 2.13
14% crumb rubber
1 10.7 1.01 10.807
11.2615
1.3
2.975 2 11.6 1.01 11.716 4.05
Graphical Representation of Modified Bituminous Concrete
Conclusions
All the tests conducted on aggregate, bitumen and the bituminous concrete mixture where within the specified limits according to MoRTH specifications and hence it favorable for the use of road construction. It is observed crumb rubber modified bitumen reveals that the Marshall Stability value, which is the strength parameter of bituminous concrete, has shown increasing trend and the maximum values have increased by about 8% addition of crumb rubber. This experiment will not only constructively utilize the waste tyres in road construction industry but also effectively enhance the important parameters which will ultimately have better and long living roads. This will provide more stable and durable mix for the flexible pavements. Thus, these processes are socially highly relevant, giving better infrastructure. From our study, Marshall Test was conducted on modified bituminous concrete moulds with varying percentage of crumb rubber (8%, 10%, 12%, and 14%) added and then by comparing its stability value, it is found that the 8% addition of crumb rubber to optimum bitumen
770
Rahul R G et al. International Journal of Science, Engineering and Technology, 2016, Volume 4 Issue 5 ISSN (Online): 2348-4098 , ISSN (Print): 2395-4752
content (5.2%) is found to have maximum stability value with specified limit of value. From the studies we came to infer that the stability value is about 1.15 times than that of ordinary bituminous concrete. Thus the increased marshal stability value represents the increased strength of modified bituminous concrete. This mix will offer improved engineering properties for modified bituminous pavement and is also found to be cost effective with long life of road pavements. It is also found that crumb rubber coated aggregate has no stripping even after 120 hours of soaking in water and it also showed better binding property due to addition of waste tyre product. Thus the application of modified bitumen improves the strength and durability of the road pavements. Thus it can carry heavier loads and high traffic volume and hence provide higher performance pavements.The study also shows that the percentage of crumb rubber and stability value may vary depending upon the bitumen grade, aggregate grading etc. It should be also noted that the characteristics of crumb rubber is altered with time. Thus, we completed our study giving positive results and proved that modified bituminous mix could be applied efficiently for road pavement construction.
References • S. K. Khanna -C.E.G. Justo- A. Veeraragavan; “Highway Materials and Pavement Testing”, NemChandand Bros, Rorkee, 2009
• Ministry of Road Transport and Highways (MoRTH), Specifications for Road and Bridge Works, Fourth Revision, Indian Road Congress (IRC), New Delhi,2001
• Bureau of Indian Standard: IS:383-1970(Reaffirmed 1997) and IS:2386-part 1- 1963(Reaffirmed 1997)
• Roberts F.L., Kandhal P.S., Brown E.R., Lee DY and Kennedy T.W., Hot Mix Materials, Mixture Design and Construction, (Second Edition), NAPA Education Foundation, Lanham, Maryland
• Asphalt Institute, Mix Design Methods for Asphalt Concrete and Other Hot Mix Types, (Sixth Edition-1993), Asphalt Institute, Lexington, U.S.A
• Road Research Laboratory, Bituminous Materials in Road Construction, H.M.S.O.,London
Author’s Profile 1M. Tech Student, Coastal And Harbour Engineering, KUFOS, Kochi, Kerala, Email: [email protected] 2M Tech Student, Geotechnical Engineering, St. Thomas College of Engineering, Thiruvananthapuram, Kerala, Email: [email protected] 3B Tech Graduate, Civil Engineering, PRS College of Engineering and technology, Thiruvananthapuram, Kerala, Email: [email protected] 4B Tech Graduate, Civil Engineering, PRS College of Engineering and technology, Thiruvananthapuram, Kerala, Email: [email protected] 5B Tech Graduate, Civil Engineering, PRS College of Engineering and technology, Thiruvananthapuram, Kerala,Email: [email protected] 6B Tech Graduate, Civil Engineering, PRS College of Engineering and technology, Thiruvananthapuram, Kerala,Email: [email protected]
Copy for Cite this Article- Rahul R G, Nidhin. G.Raj, Nadhiya F M, Hima Mohan, Athira K S, Goutam Divakar Santhish, “Effect of Crumb Rubber on Asphalt Mixture Performance”, International Journal of Science, Engineering and Technology, Volume 4 Issue 5: 2016, pp. 757-771.


![Chemically modified bitumens with enhanced rheology and ... · additives employed in the bitumen modification are waste polymer [7,8] (plastic from agriculture, crumb tyre rubber,](https://static.documents.pub/doc/80x56/5e9fb9f2f69cc877e74efe35/chemically-modified-bitumens-with-enhanced-rheology-and-additives-employed-in.jpg)


