EFFECT OF DEMAND DRIVEN APPROACHES ON SUSTAINABLE
SUPPLY CHAIN: A CASE OF HOMA-BAY COUNTY GOVERNMENT
BY
MICHAEL OKEYO SUNA
A RESEARCH PROJECT SUBMITTED IN PARTIAL FULFILLMENT
OF THE REQUIREMENTS FOR THE DEGREE OF MASTER OF
SCIENCE IN SUPPLY CHAIN MANAGEMENT
DEPARTMENT OF MANAGEMENT SCIENCE
MASENO UNIVERSITY
© 2018
ii
DECLARATION
I, the undersigned hereby declare that this project is my original work and has not been
submitted in the same form or any other form to this or any other university or college for any
examination.
Michael Okeyo Suna Sign………………… Date………………………
MSC/BE/00140/016
This project has been submitted for examination with my approval as the University Supervisor.
Mr. Albert Tambo Sign………………. Date……………….………
Department of Management science
School of Business and Economics
iii
ACKNOWLEDGEMENT
I wish to take this earliest opportunity to thank the Almighty God for my life up to this end and
for giving me time to express my very sincere acknowledgement to my supervisor, Mr. Albert
Tambo, who really worked extra hard to the realization of this material in time. More special
recognition goes to my lecturers Dr. Johnmark Obura, Dr. Moses Oginda, Mr. Barrack Oro, and
Mr. Silas Onyango for their knowledgeable presentation of their lectures. My fellow course
mates Erick Opiyo, Ronald Ochieng, Iddri Issa, Renson Wanyonyi, Nancy and Evans Ongati are
appreciated for their resourcefulness towards this work. Your support is really appreciated.
iv
DEDICATION
I dedicate this work to my parents Mr. Elijah Suna and Mrs Maritha Suna who inculcated the
spirit of education in me. Equally, I owe this work to my family: loving wife Josephine Suna and
children Velama, Harriet, Collins and Melvin for enduring my absence during my study time.
May God provide you with more philanthropic.
v
ABSTRACT
Devolution is meant to enhance accountability and bring resources closer to the people they
intend to serve. However, the implementation of devolution has not been easy, as the County
Government of Homa Bay needed to engage in massive procurement in the establishment of
County Governments. This has affected the performance levels of the County with performance
dropping from 70% in 2016 to 50% in 2017 according to 2017 annual report. Several studies
have been done on impact of procurement and Disposal Act of 2005, focusing on the relationship
between demands driven approaches on sustainable supply chain. However, no study considered
investigating the relationship between stock out and sustainable supply chain, carrying cost and
sustainable supply chain and extended lead time and sustainable supply: information on these
constructs of demand driven approaches and sustainable supply chain is therefore lacking. The
purpose of this study was to investigate the effects of demand driven approaches on sustainable
supply chain, taking a case of Homa-Bay County Government. Specific objectives were to
establish the effect of stock-outs, examine the effect of extended lead times, and to determine the
effect of inventory carrying costs on sustainable supply chain of Homa Bay County Government.
This study was anchored on the agile supply chain theory. Correlation research design was
adopted on a target population of all 132-procurement staff who were sampled using stratified
random sampling technique. Primary data was collected using structured questionnaire.
Cronbach’s alpha test was used to test the internal consistency of the instrument. A coefficient of
0.878 which is above the threshold of 0.7 was established indicating instruments reliability. For
validity test, the instrument was reviewed after which corrections were done. The study
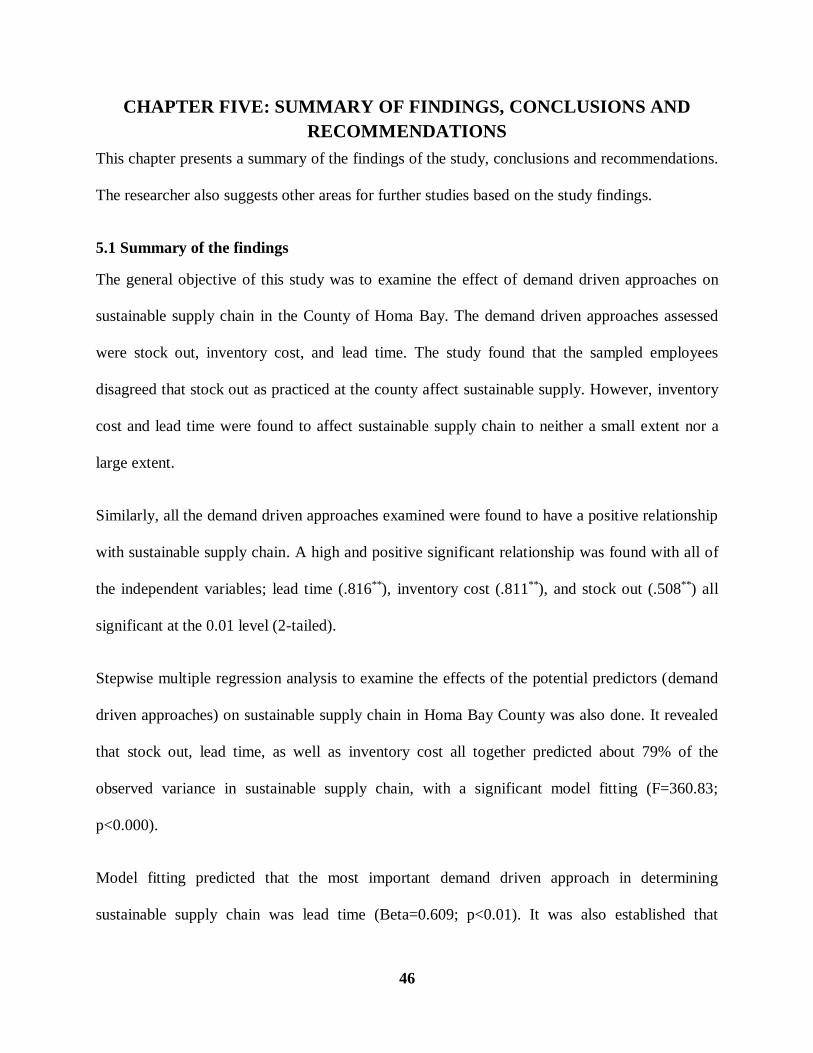
established; Stock out has a significant effect on Supply Chain Sustainability (β= -0.164,
α=0.00). Lead time has a significant effect on Supply Chain Sustainability (β=0.609, α=0.00).
Inventory cost was established to be having a significant effect on Supply Chain Sustainability
(β=0.468, α=0.00). The results imply that stock out as practiced at the county does not affect
sustainable supply. However, inventory cost and lead time were found to affect sustainable
supply chain to neither a small extent nor a large extent. Further it was also established that
inventory cost was significantly critical in predicting sustainable supply chain. The researcher
recommends that information sharing between users and suppliers; adoption of e procurement;
and employment of virtual reality during acquisition and placement be embraced. Further studies
are recommended on effect of lead time on sustainable procurement. The study findings may be
used by Kenyan Policy makers in government and private sectors to come up with strategies and
policies that ensure the demand driven approaches on sustainable supply chain in Kenya compete
favorably in the global market by meeting both environmental and quality requirements. The
study finding might also provide a theoretical and empirical framework for research in demand
driven approaches on sustainable supply chain in Kenya and would contribute to the body of
knowledge since it might be reference material for future researchers and academicians.
vi
TABLE OF CONTENTS
DECLARATION ....................................................................................................................... ii
ACKNOWLEDGEMENT ......................................................................................................... iii
DEDICATION .......................................................................................................................... iv
ABSTRACT ...............................................................................................................................v
TABLE OF CONTENTS .......................................................................................................... vi
ABBREVIATIONS AND ACRONYMS .................................................................................. ix
OPERATIONAL DEFINITION OF TERMS ..............................................................................x
LIST OF TABLES .................................................................................................................... xi
LIST OF FIGURES ................................................................................................................. xii
CHAPTER ONE: INTRODUCTION ......................................................................................1
1.1 Background to the Study .......................................................................................................1
1.2 Statement of The Problem .....................................................................................................6
1.3 Objectives of The Study ........................................................................................................8
1.4 Research Hypotheses .............................................................................................................8
1.5 Justification of the Study .......................................................................................................9
1.6 Scope of the Study.................................................................................................................9
1.7 Conceptual Framework .........................................................................................................9
CHAPTER TWO: LITERATURE REVIEW ........................................................................ 11
2.1 Theoretical Framework ....................................................................................................... 11
2.1.1 The Agile Supply Chain Theory ....................................................................................... 11
2.1.2 Stock Out cost .................................................................................................................. 13
2.1.4 Inventory Carrying Cost ................................................................................................... 16
2.1.5 Sustainable Supply Chain Management ............................................................................ 19
2.2 Empirical Literature Review ................................................................................................ 21
vii
2.2.1 Stock out and Sustainable supply chain ............................................................................ 21
2.2.2 Extended lead time and sustainable supply chain .............................................................. 22
2.2.3 Carrying cost and sustainable supply chain ....................................................................... 23
2.3 Summary of Knowledge Gaps ............................................................................................. 26
CHAPTER THREE: RESEARCH METHODOLOGY ........................................................ 27
3.1 Research Design .................................................................................................................. 27
3.2 Study Area .......................................................................................................................... 27
3.3 Target Population ................................................................................................................ 28
3.4 Sample and Sampling Technique ......................................................................................... 28
3.5 Data Collection Method....................................................................................................... 29
3.5.1 Data Source ...................................................................................................................... 29
3.5.2 Piloting ............................................................................................................................. 30
3.5.3 Reliability Instruments ..................................................................................................... 30
3.5.4. Validity of the Study ....................................................................................................... 30
3.6 Data Analysis ...................................................................................................................... 30
3.8 Ethical Consideration .......................................................................................................... 31
CHAPTER FOUR: RESULTS AND DISCUSSIONS ........................................................... 33
4.1 Demographic Characteristics of the Sample ......................................................................... 33
4.2 Demand Driven Approaches on Sustainable Supply Chain .................................................. 34
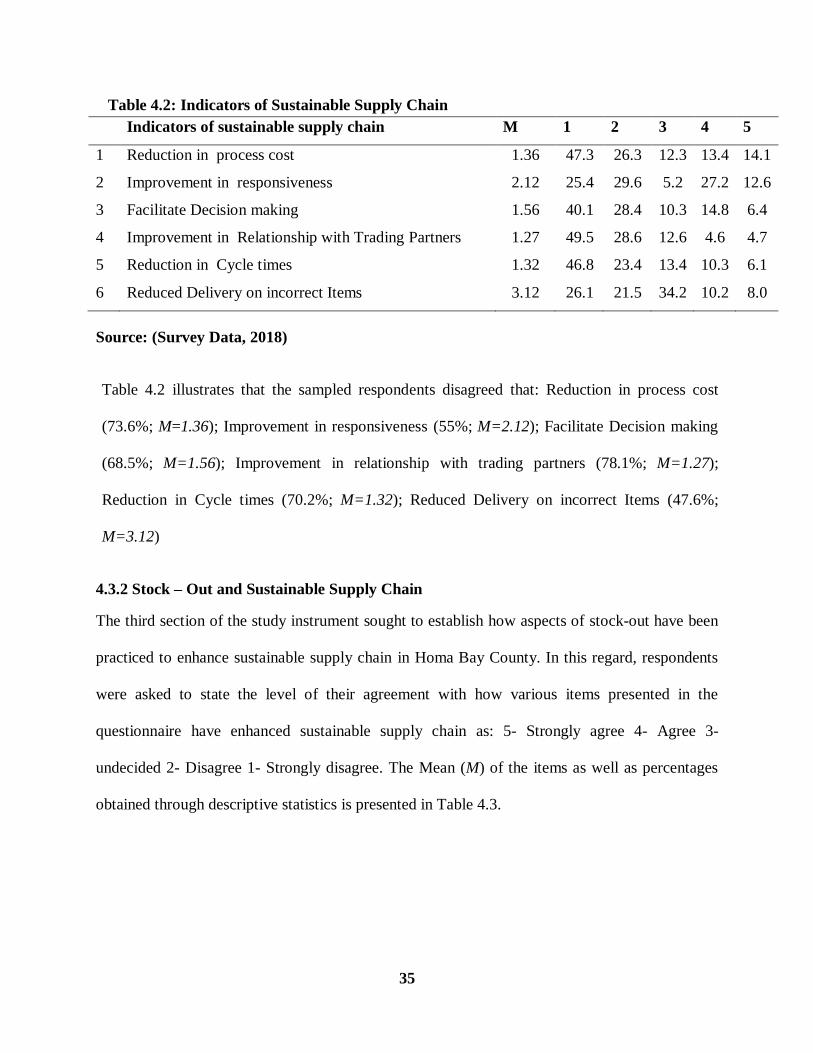
4.2.1 Indicators of Sustainable Supply Chain............................................................................. 34
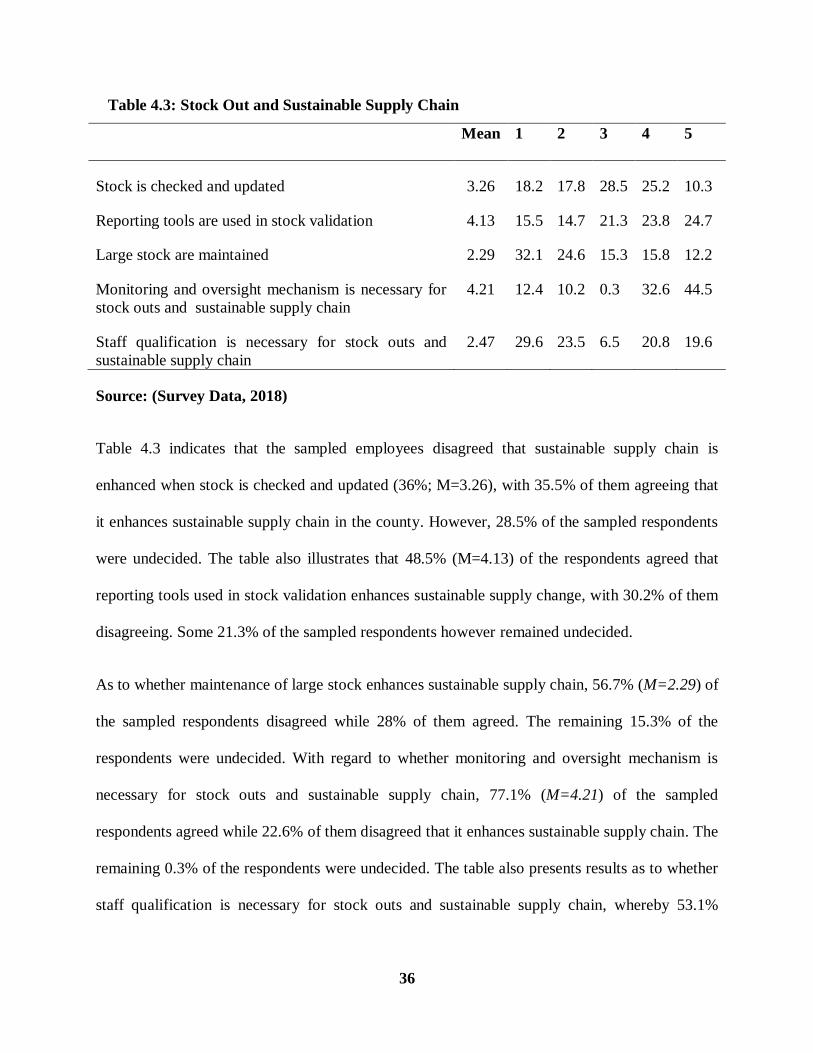
4.3.2 Stock – Out and Sustainable Supply Chain ....................................................................... 35
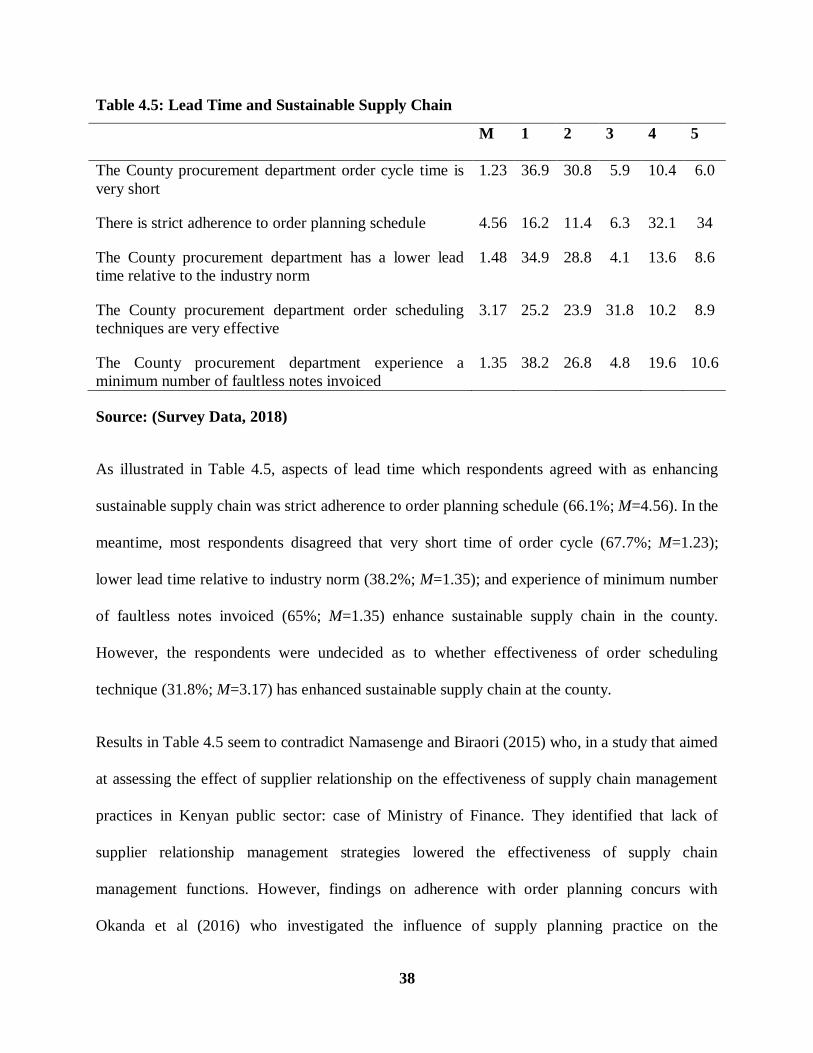
4.3.3 Lead Time and Sustainable Supply Chain ......................................................................... 37
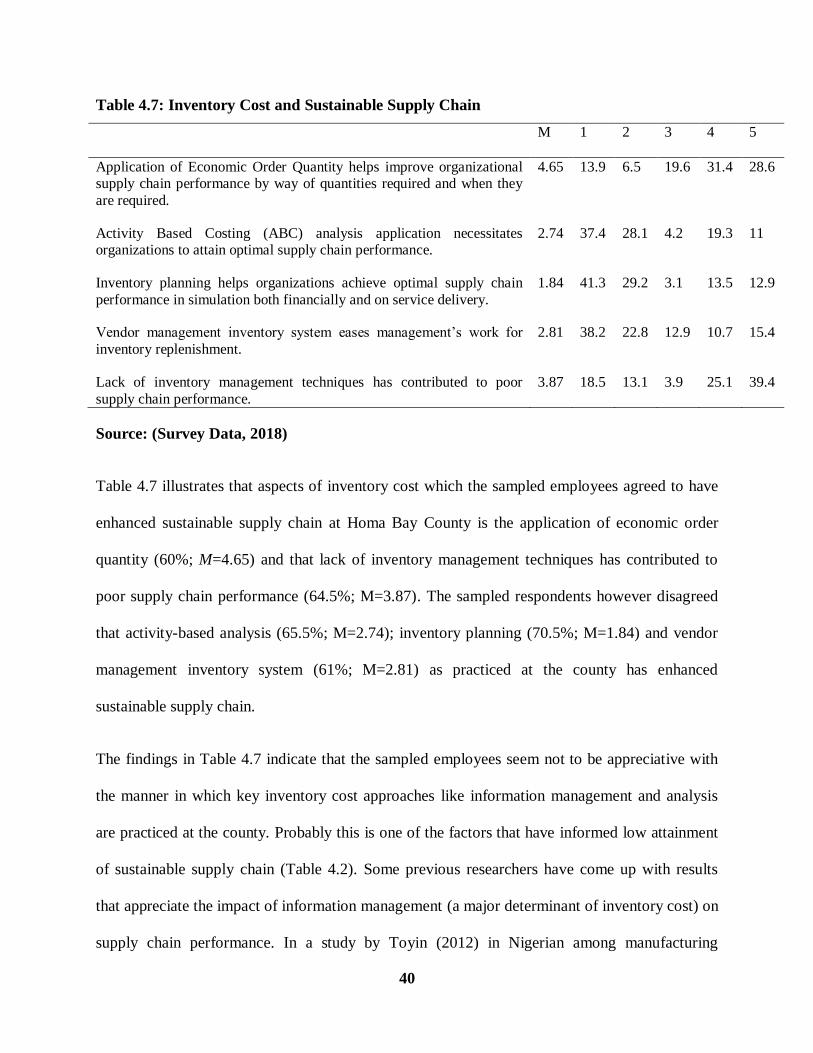
4.3.4 Inventory cost and sustainable supply chain ...................................................................... 39
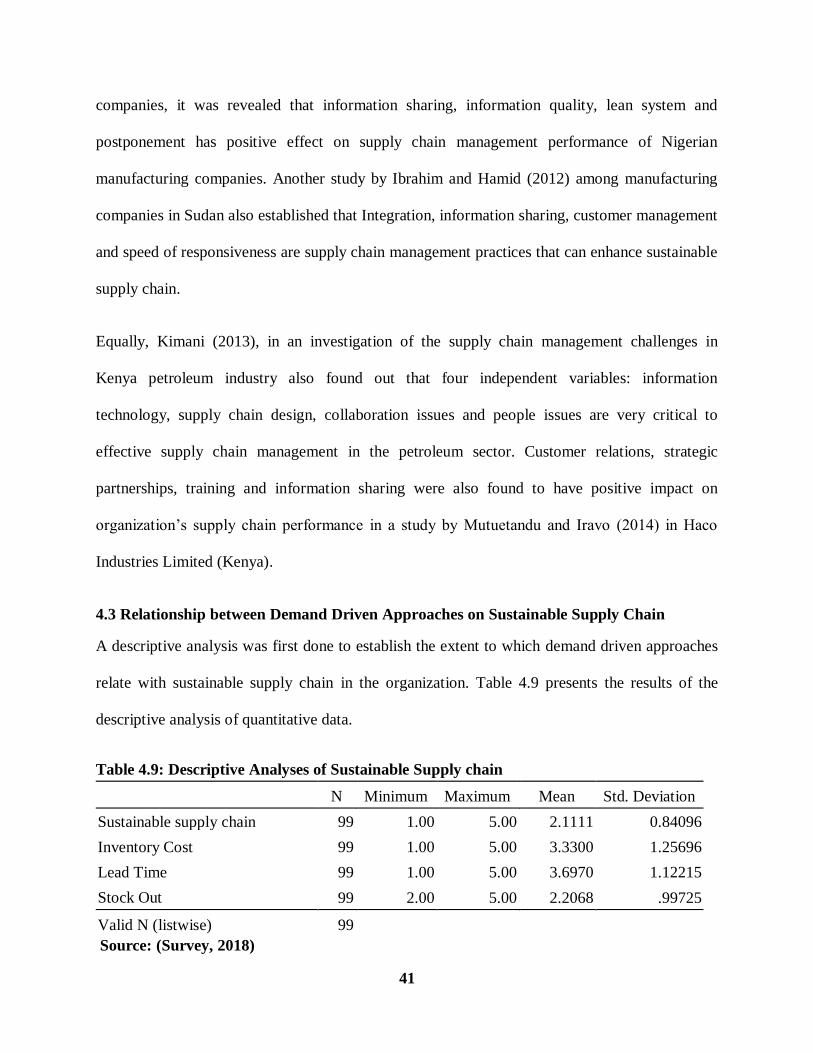
4.3 Relationship between Demand Driven Approaches on Sustainable Supply Chain ................ 41
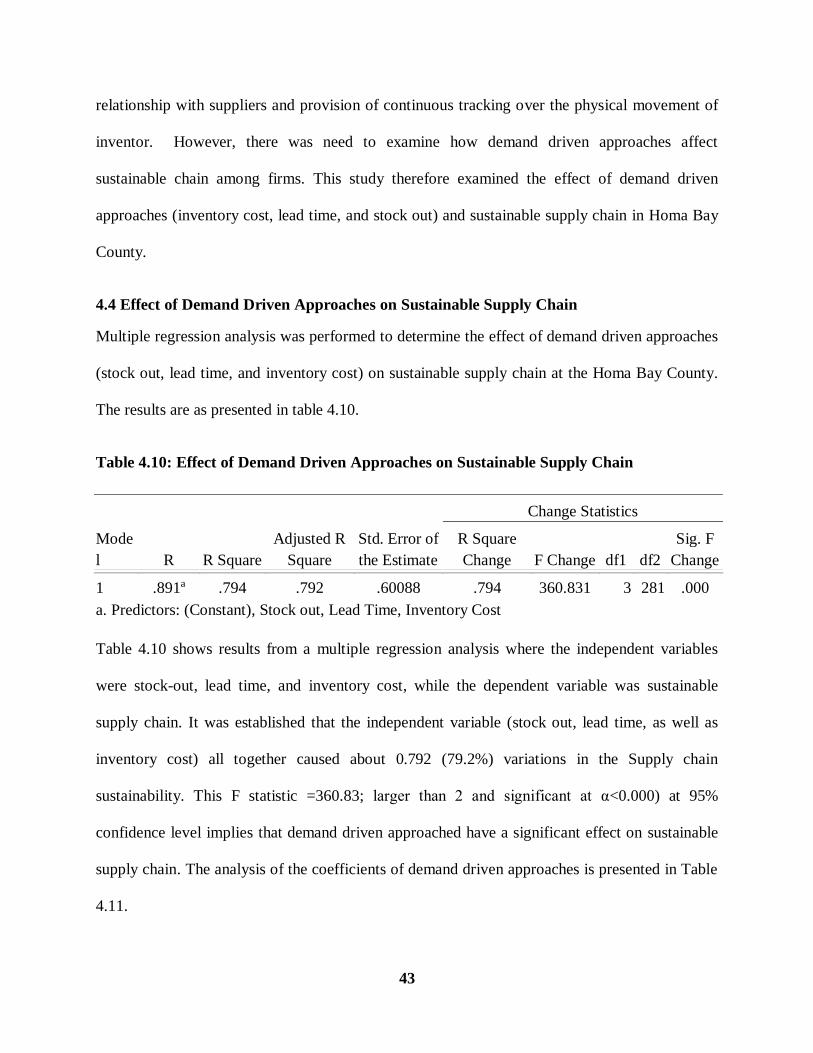
4.4 Effect of Demand Driven Approaches on Sustainable Supply Chain .................................... 43
CHAPTER FIVE: SUMMARY OF FINDINGS, CONCLUSIONS AND
RECOMMENDATIONS ........................................................................................................ 46
5.1 Summary of the findings ..................................................................................................... 46
viii
5.2 Conclusion .......................................................................................................................... 47
5.3 Recommendations for Improving Sustainable Supply Chain ................................................ 47
5.4 Recommendation for Further Research ................................................................................ 48
REFERENCE .......................................................................................................................... 49
APPENDICES .......................................................................................................................... 53
APPENDIX I: LETTER OF INTRODUCTION ........................................................................ 53
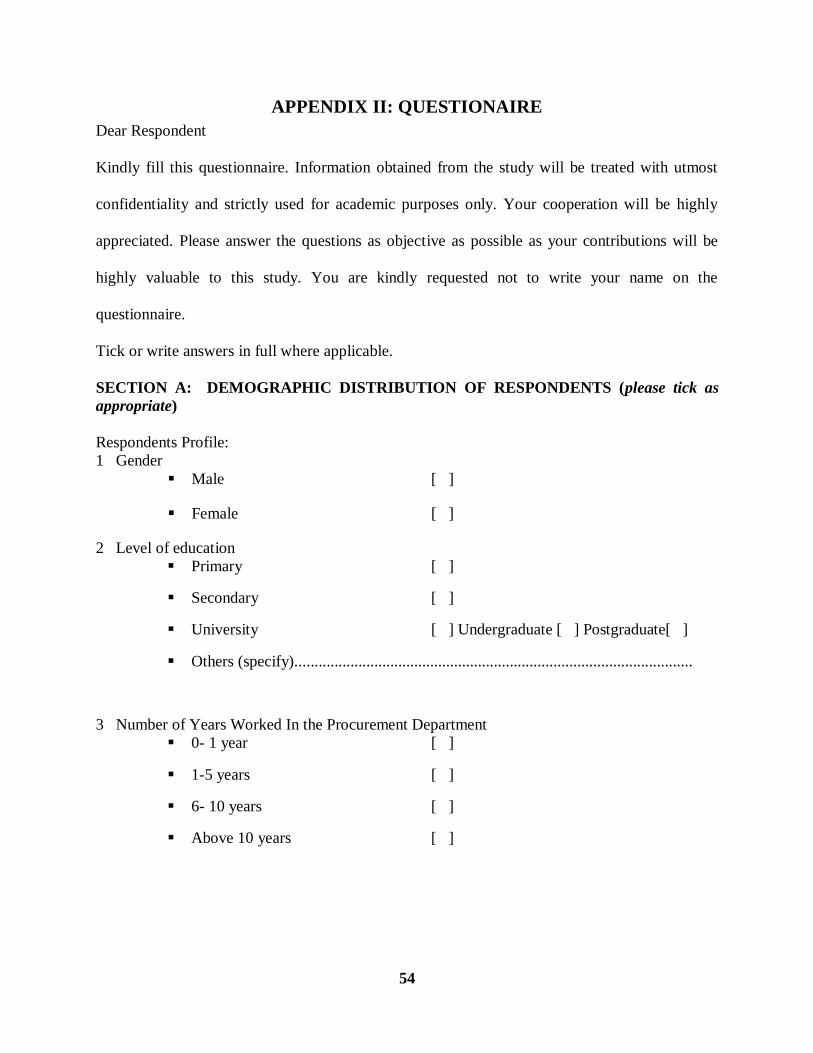
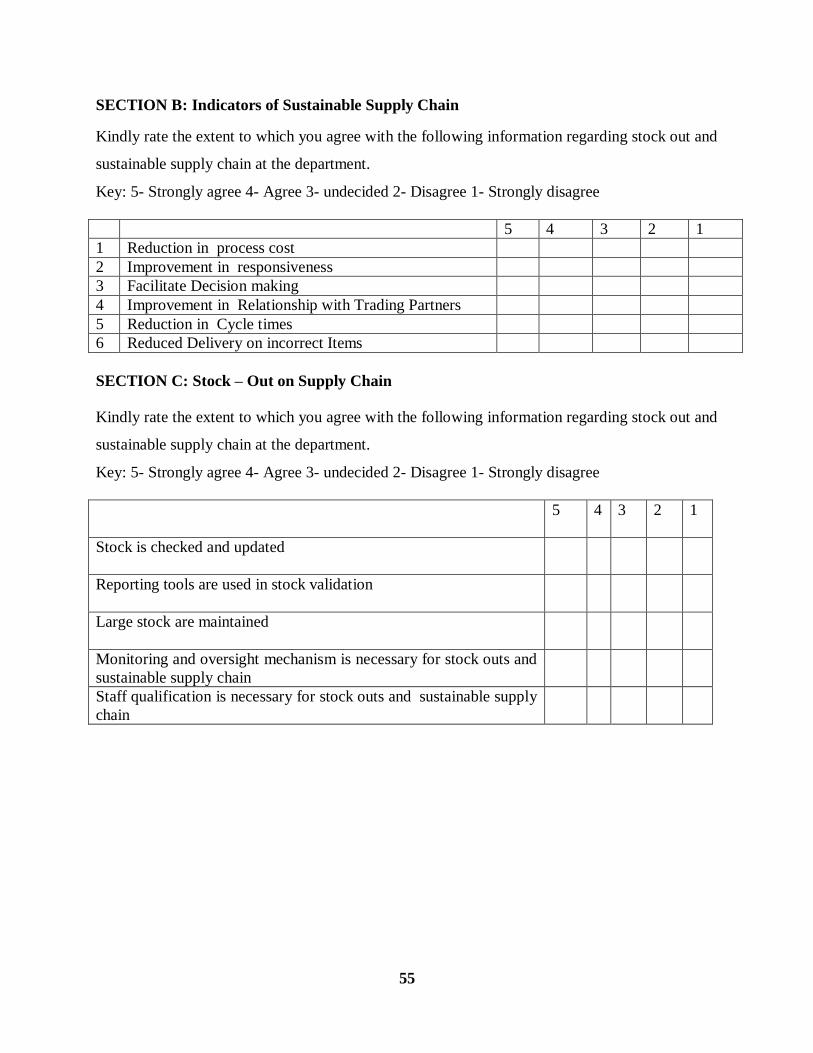
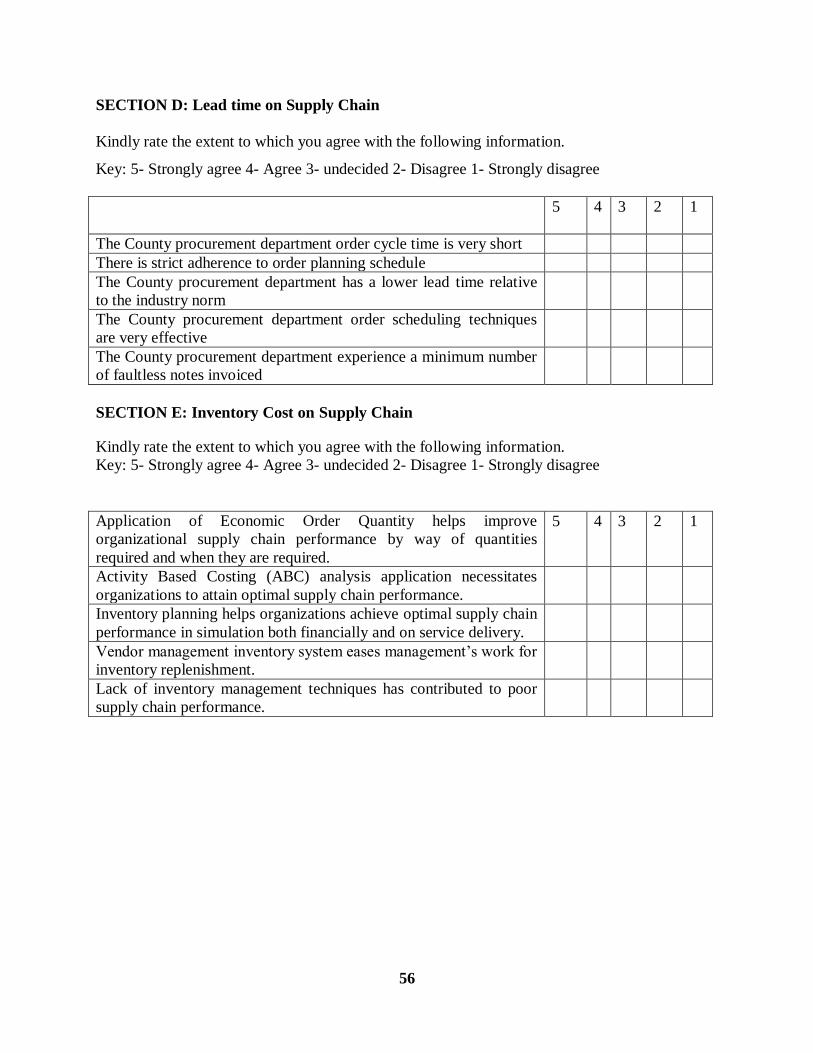
APPENDIX II : QUESTIONAIRE ............................................................................................ 54
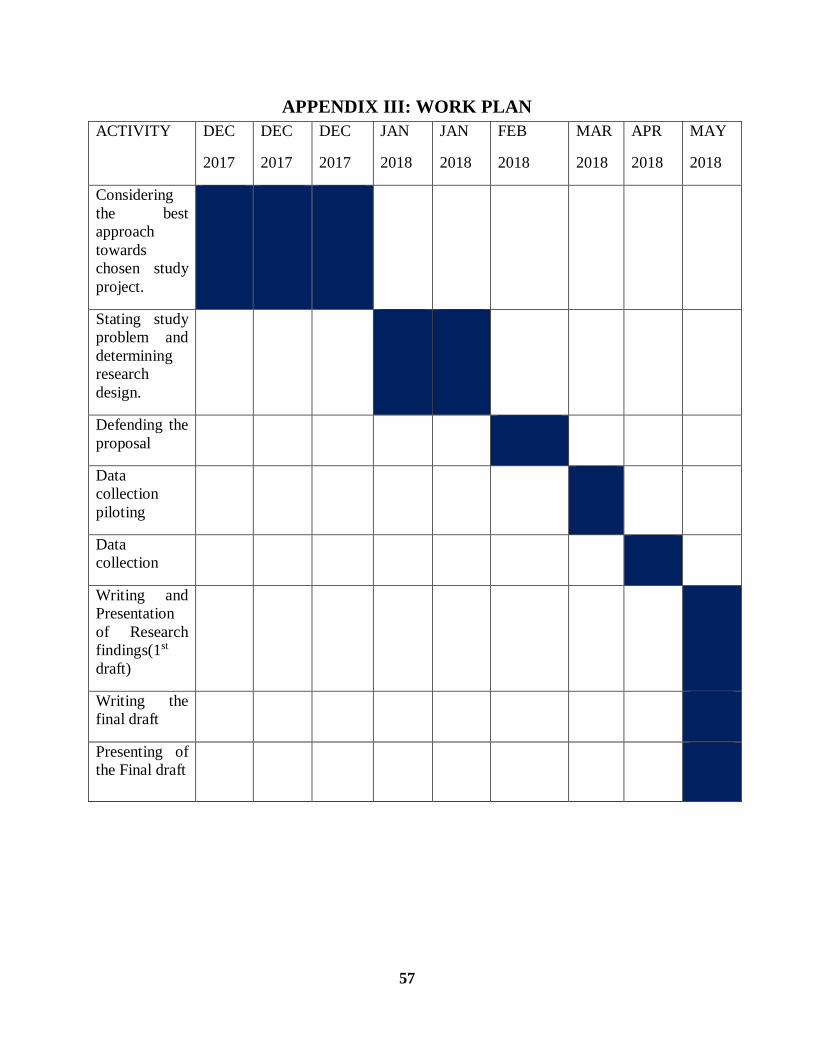
APPENDIX III: WORK PLAN ................................................................................................. 57
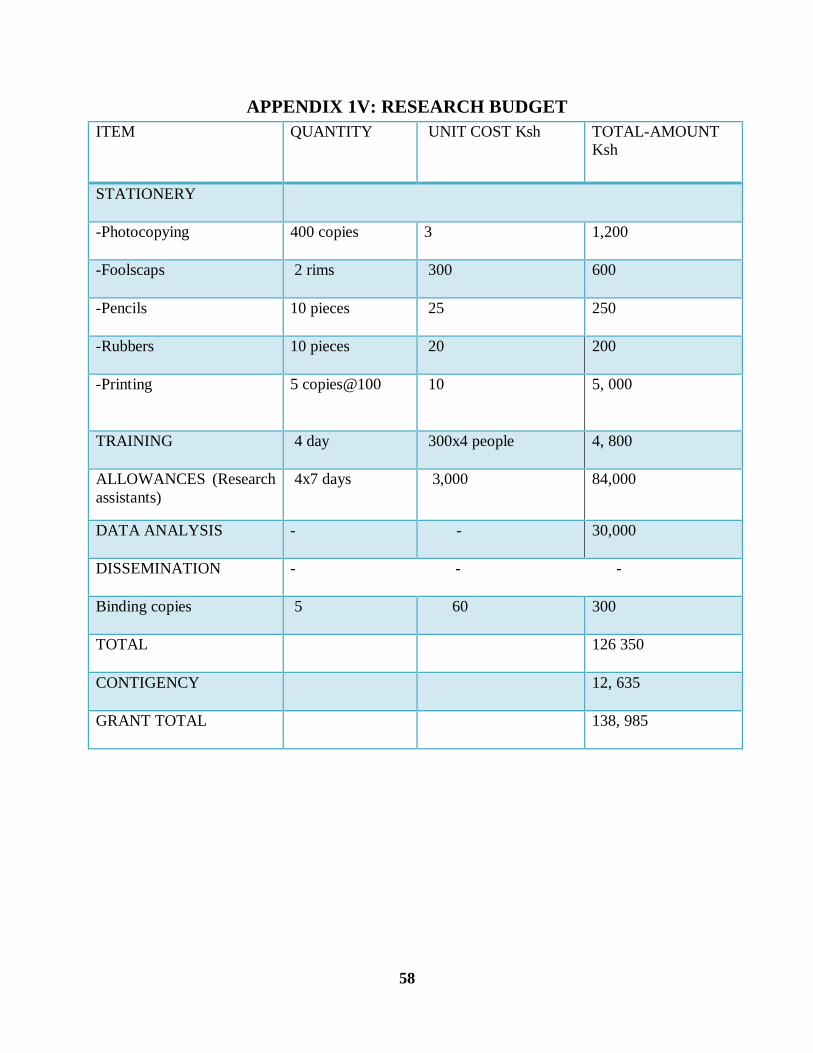
APPENDIX 1V: RESEARCH BUDGET .................................................................................. 58
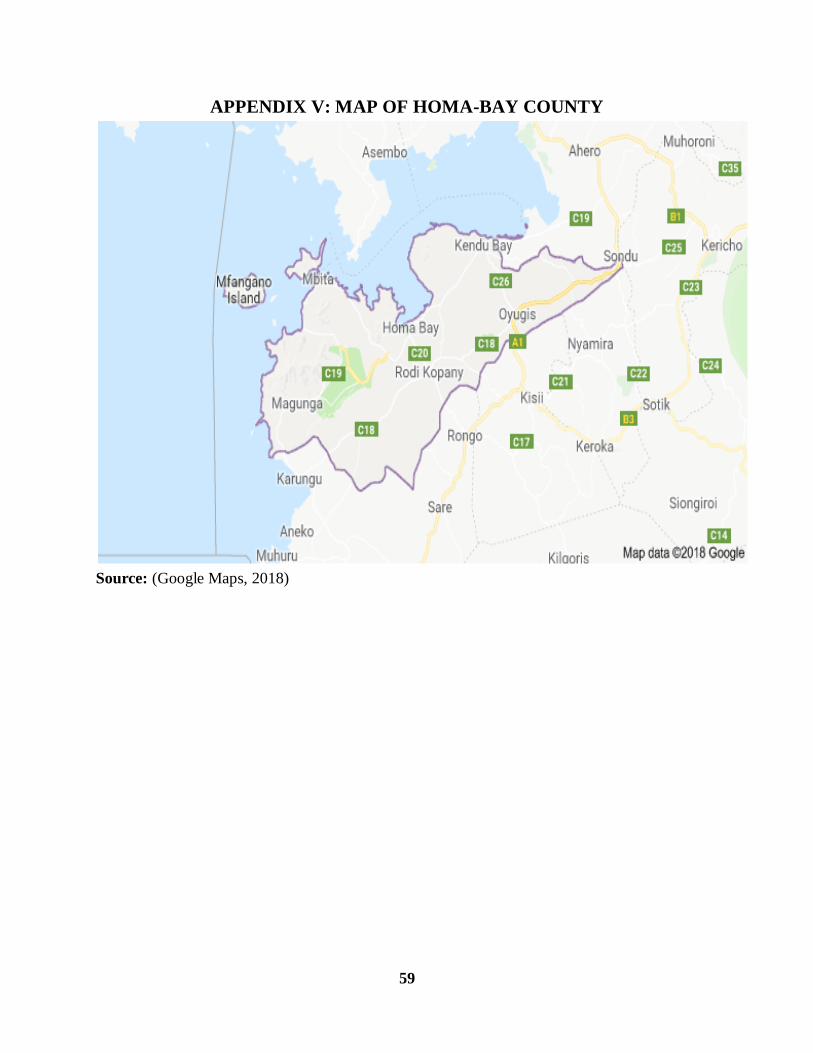
APPENDIX V: MAP OF HOMA-BAY COUNTY ................................................................... 59
ix
ABBREVIATIONS AND ACRONYMS
ECR- Efficient Customer Response
EDI- Electronic Data Interchange
SCM- Supply Chain Management
SCS- Supply Chain Strategy
SPSS- Statistical Package for the Social Sciences
x
OPERATIONAL DEFINITION OF TERMS
Demand Driven Approaches Demand driven approaches in this study refers to the
selection of an appropriate type of supply chain to achieve
optimal performance driven by the characteristic of product
an organization is manufacturing.
.
Supply Chain Management Supply Chain Management in this study is considered as
the management and integration of a set of selected key
business processes from end user through original suppliers
that provide products, services, and information that add
value for customers and other stakeholders through the
collaborative efforts of supply chain members.
Sustainable Supply chain management Sustainable supply chain management In this study
involves integrating environmentally and financially viable
practices into the complete supply chain lifecycle, from
product design and development, to material selection,
including raw material extraction or agricultural
production, manufacturing, packaging, warehousing,
distribution, consumption, return and disposal
Sustainable development Refer development that meets the needs of the present
without compromising the ability of future generations to
meet their own needs.
Green Supply Chain Management Refer to green supply chain management as the
principle of reducing waste, increasing efficiencies.
Effective management of resources, reduce production
costs, promote recycling, reuse of raw materials and,
reduced production of hazardous substances.
xi
LIST OF TABLES
Table 4.1: Characteristics of Study respondents ......................................................................... 33
Table 4.2: Indicators of sustainable supply chain ....................................................................... 35
Table 4.3: Stock out and sustainable supply chain ..................................................................... 36
Table 4.5: Lead Time and Sustainable Supply Chain ................................................................. 38
Table 4.7: Inventory cost and sustainable supply chain .............................................................. 40
Table 4.9: Descriptive analyses of Sustainable supply chain ...................................................... 41
Table 4.10: Effect of Demand Driven Approaches on Sustainable Supply Chain ....................... 43
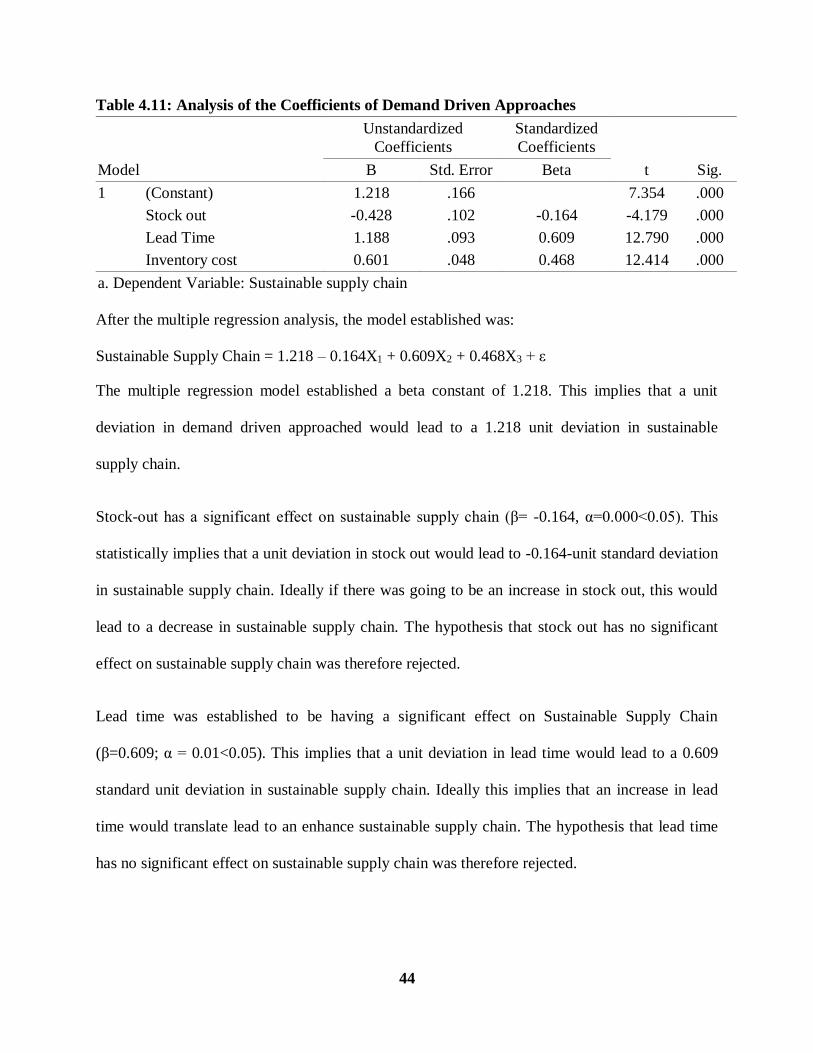
Table 4.11: Analysis of the coefficients of demand driven approaches ...................................... 44
xii
LIST OF FIGURES
Figure 1. 1: Conceptual Framework of the relationship between demand driven approaches and
sustainable supply chain. ........................................................................................................... 10
1
CHAPTER ONE: INTRODUCTION
This chapter presents a preview to the concept and effects of demand driven approaches on
sustainable supply chain, taking the case of case of Homa-Bay County Government. It presents
the purpose of the study, objective of the study, and statement of the problem and the limitation
of the study.
1.1 Background to the Study
Supply Chain Management (SCM) has gained considerable focus in business as a key success
factor for firm competitiveness. Whereas in the past SCM was considered simply a function
under operations and restricted to materials management, it has now been appreciated as an all-
encompassing strategic discipline. This change has been necessitated by various factors:
globalization has increased the competitive space, customers are now more demanding in terms
of variety, price and quality of products, the opportunities afforded by technology and the global
recession (Palomero & Chalmeta, 2014). This strategic shift has also provided developing
countries with an opportunity to benefit from their offerings of affordable labour and raw
materials. Osagie (2015) argues that shareholder return maximization has pushed businesses to
focus on countries with low cost advantages for their operations; while this has generated
employment and foreign investment, it has also led to large supply chains and therefore
increased risks and complexity.
This shift in strategic sourcing while harnessing the bottom-line of global corporations has also
increased economic activity within poor countries by also enabling joint ventures with local
entrepreneurs, for example the “ready-made garment” industry in India. According to UNCTAD
(2010), off-shoring of operations has grown significantly and is estimated at between US$ 250-
2
300 billion. This presents a great growth opportunity for developing countries but is not without
its own challenges. Two major concerns are with ethical engagement of labourers by multi-
national corporations in less developed countries and the environmental impact of their
production activities. Supply chains also face unique operational challenges due to changing
purchasing behavior of today’s consumers who have access to digital information and are more
empowered and expect their needs to be met wherever they want them and exactly when they
want (O'Marah, 2015).
Moreover, businesses have to now prove to their consumers that they take product provenance
seriously by revealing origins of their products in order to build customer trust and a reputation
for sustainable procurement through ethical sourcing of inputs and production of their goods.
New (2010) notes that this has led to new technologies within SCM and marketing where at each
link throughout the value chain, data accumulates and is passed on at a low cost to the next stage
so that consumers as well as supply chain members can trace the finished product all the way
back to its origin. These extra efforts by organisations come at a cost that is sometimes not
obvious which means there is the extra challenge of controlling costs while responding to the
customers’ needs (Persson, 2011).
SCM falls in the broad area of strategic management and specifically under operational
strategies. Supply Chain Strategy (SCS), as an emerging research area of supply chain
management, still needs to develop universally accepted definitions, frameworks and
characteristics of application. The main focus of the research on the medium to short-term
tactical strategy can be traced to the origin of supply chain management research as a part of
operations management field, where the main focus is on tactical levels of planning and decision
making (Rose, Singh, and Rose, 2012). It is now evident that SCS cuts across different
3
functionalities of the organization from manufacturing and marketing to external relations with
customers and suppliers.
Rose et al. (2012) define supply chain management as “planning, implementing, monitoring,
controlling, where possible, and changing, where necessary, all the processes, resources and
flows within an extended concept of supply chain which includes all actors in a network, web or
system that functions as a whole to provide value from the highest upstream source through
various value-adding and modifying nodes, to the end customer”. In the past, SCM and logistics
have been used interchangeably; however logistics is a function under SCM. While logistics is
concerned with customer service, inventory management, warehousing, information systems and
lot size considerations (Lambert and Terrance, 2001) SCM is a set of three or more entities
(organizational or individually) directly involved in the upstream and downstream flow of
products, services or information from source to customer (Mentzer, Flint, and Hult, 2001).
Organisations focus on improving SCM practices in order to gain competitive advantage for
improved organizational performance. According to Ivanov (2010) SCM is now considered as
the most popular strategy for improving organisational competitiveness in this century. SCM
studies the resources of enterprises and decisions in relation to external collaboration so as to
transform and use these resources in the most logical way throughout the entire supply chain,
from customers up to raw material suppliers, based on integration, collaboration and
coordination (Ivanov, 2010). It is this multi-disciplinary and multi-enterprise reach of SCM that
makes it a necessary focus for strategy formulation.
The main focus of SCM is on operational cost reduction, time and response optimisation,
customer services or profitability (Nuthall, 2003). It can therefore be concluded that SCM by its
4
nature has a more significant effect on firm performance (Carter and Narasimhan, 1996). Hence,
organizational performance cannot be optimized without supply chain performance
consideration. Coherent strategy formulation and implementation is a key success factor for
improved supply chain performance. In order for supply chains to be competitive, order
fulfillment must be aligned with demand creation (Godsell et al. 2006). Fisher (1997) advocates
for the delineation of SCS in accordance with the different demand profiles of a firm’s different
product types (functional and innovative) in order to maximize success. These product types
have different demand characteristics in terms of predictability, life cycles and delivery lead
times. He states a belief that the key reason for supply chain problems is the mismatch between
product type and the characteristics of the supply chain.
There is now an emphasis in SCM as a tool of functional strategy across the value chain.
Purchases constitute 75% of the operating budget for organizations (Quinn, 1997); therefore
companies are constantly looking for ways to reduce costs to increase profits and gain
competitive advantage. SCS is a series of prioritized objectives focused on processes, reduction
in bull whip effect, and smooth flow of information across channels, superior customer service
and assured product arrival. Therefore, a well-connected business process improves SCM
performance through lowering costs, reducing delivery time, providing appropriate feedback,
maintaining low inventory levels, and improving reliability (Davis, 1993). However, as much as
organisations may implement these tried and true strategies, there are certain factors that they
need to mitigate as well. Ivanov (2010) found that SCM is characterised by increased
uncertainty. The uncertainty origins lie both in the environmental (demand fluctuations, machine
breakdowns, information system damage) and human (errors, false information interpretation,
and disjointed goal pursuit) areas. He recommends that there is an extra need for special
5
techniques for designing vigorous supply chains, analysis of the solidity of supply chains,
monitoring supply chain performance and reconfiguration whenever necessary.
Seuring and Muller (2008) merge the definitions for SCM and sustainability and define SSCM as
―the management of material, information and capital flows as well as cooperation among
companies along the supply chain while taking goals from all three dimensions of sustainable
development i.e. economic, environmental and social into account which is derived from
customer and stakeholder requirements. According to the Sustainable Supply Chain Foundation
(SSCF), Sustainable Supply Chain Management involves integrating environmentally and
financially viable practices such as recycling, refurbishing, waste management etc. into the
complete supply chain lifecycle, from product design and development, to material selection,
(including raw material extraction or agricultural production), manufacturing, packaging,
transportation, warehousing, distribution, consumption, return and disposal. All supply chains
can be optimized using sustainable practices. Sustainability in the supply chain encapsulates a
number of different priorities: environmental stewardship, conservation of resources, reduction
of carbon footprint, financial savings and viability and social responsibility. Sustainable
development meets the needs of people today without compromising the ability of people in the
future to meet their needs (CIPS, 2014).
Sustainability integrates social, environmental, and economic systems. Social aspects include
following applicable laws and international treaties; using open and transparent participatory
processes that actively engage relevant stakeholders, establish rights and obligations, and
emplace a long-term sustainability plan with periodic monitoring; and ensuring decent wages and
working conditions, the safety of workers, and workers‘ rights to organize and collectively
bargain (Mukanga, 2011). Environmental sustainability occurs when processes, systems and
6
activities reduce the environmental impact of organizations facilities, products and operations.
Economic sustainability is used to define strategies that promote the utilization of socio-
economic resources to their best advantage. A sustainable economic model proposes an equitable
distribution and efficient allocation of resources. The idea is to promote the use of those
resources in an efficient and responsible way that provides long-term benefits and establishes
profitability (UNGC-Accenture, 2013).
The implementation of devolution has not been easy for county government especially and worse
off in Homabay County. The County Government of Homabay needed to engage in massive
procurement in the establishment of County Governments. This has affected the performance
levels of these County Government with performance dropping from 70% in 2016 to 50% in
2017 according to Homabay County government 2017 annual report. The County government
report attributed the fall in performance to among other factors demand driven approaches. It is
with this regard that the study proposes to establish the effect of demand driven approaches on
sustainable supply chain management.
1.2 Statement of the Problem
One of the strategic goals of the National Government for the year 2012 was to enhance
devolution in all sectors in Kenya. While the study appreciates the extent of Kenya’s devolution
of authority to various tiers of the local government, the level of empowerment through
democratization, participation, accountability, responsibility and efficiency, effective use of
resources is still a big debate. Devolution is meant to enhance accountability by bringing
politicians and resources closer to the people they are intended to serve. However, the
implementation of devolution has not been easy as the County Government needed to engage in
massive procurement in the establishment of County Governments. This has affected the
7
performance levels of these County Government. Several studies have been done on impact of
procurement and Disposal Act of 2005. Sound public procurement policies and practices are
among the essential elements of good governance (KIPPRA, 2006; World Bank, 2002).
According to corruption perception index (2010) Kenya is ranked 139th out of 176 with the least
corrupt countries at the top. Homa Bay County Government suffers from neglect, lack of proper
direction, poor co-ordination, slow with a lot of bureaucracy, lack of open competition and
transparency, differing levels of corruption and not having a cadre of trained and qualified
procurement specialists who are competent to conduct and manage the procurement process in a
professional, timely and cost effective manner, The implementation of the procurement Act 2005
and the subsequent regulations and guideline have faced many challenges under the devolved
system of governance in Kenya generally and Homa Bay County in Particular. Local studies
have been done on the area of procurement performance have focused on the effect of
procurement process in companies, analyzed the effect of procurement activities on the operation
and effectiveness of public sectors in Kenya. A study on supply chain management practices and
their impact on performance among humanitarian organizations in Kenya, using a population of
twenty eight humanitarian organizations concluded that they should come up with mechanisms
that will enable them to overcome various challenges in their supply chains such as use of
technology to speed up work, effective and efficient internal operations inter-organizational
integration and continuous improvement in the organization. Abdi (2012) examined procurement
practices of public state corporations in Kenya. A procurement review by PPOA (2010) of the
Narok North District on compliance with the law, regulations, internal controls, generally
accepted principles and institutional framework found out that there were deviations in general
8
and specific areas of procurement stages. However, the reviewed studies failed to address the
context of demand driven approaches on sustainable supply chain.
1.3 Objectives of the Study
The general objective of this study was to establish the effects of demand driven approaches on
sustainable supply chain of Homa-Bay County Government
This study was guided by the following specific objectives;
i. To establish the effect of stock-outs on sustainable supply chain of Homa Bay County
Government.
ii. To determine the effect of extended lead times on sustainable supply chain of Homa Bay
County Government.
iii. To examine the effect of inventory carrying costs on sustainable supply chain of Homa
Bay County Government.
1.4 Research Hypotheses
H01 Stock-outs costs has no significant influence on sustainable supply chain of Homa
Bay County Government.
H02 Extended lead time has no significant influence on sustainable supply chain of
Homa Bay County Government.
H03 Inventory carrying costs has no significant influence on sustainable supply chain
of Homa Bay County Government.
9
1.5 Justification of the Study
The information might be used by Kenyan Policy makers in government and private sectors to
come up with strategies and policies that ensure the demand driven approaches on sustainable
supply chain in Kenya compete favorably in the global market by meeting both environmental
and quality requirements. The study might also provide a theoretical and empirical framework
for research in demand driven approaches on sustainable supply chain in Kenya and would
contribute to the body of knowledge since it might be reference material for future researchers
and academicians.
1.6 Scope of the Study
The study will focus on the effects of demand driven approaches on sustainable supply chain; a
case of Homa Bay County Government performance on sustainable supply chain performance.
Besides, the present study will be conducted during the month of February to August 2018.
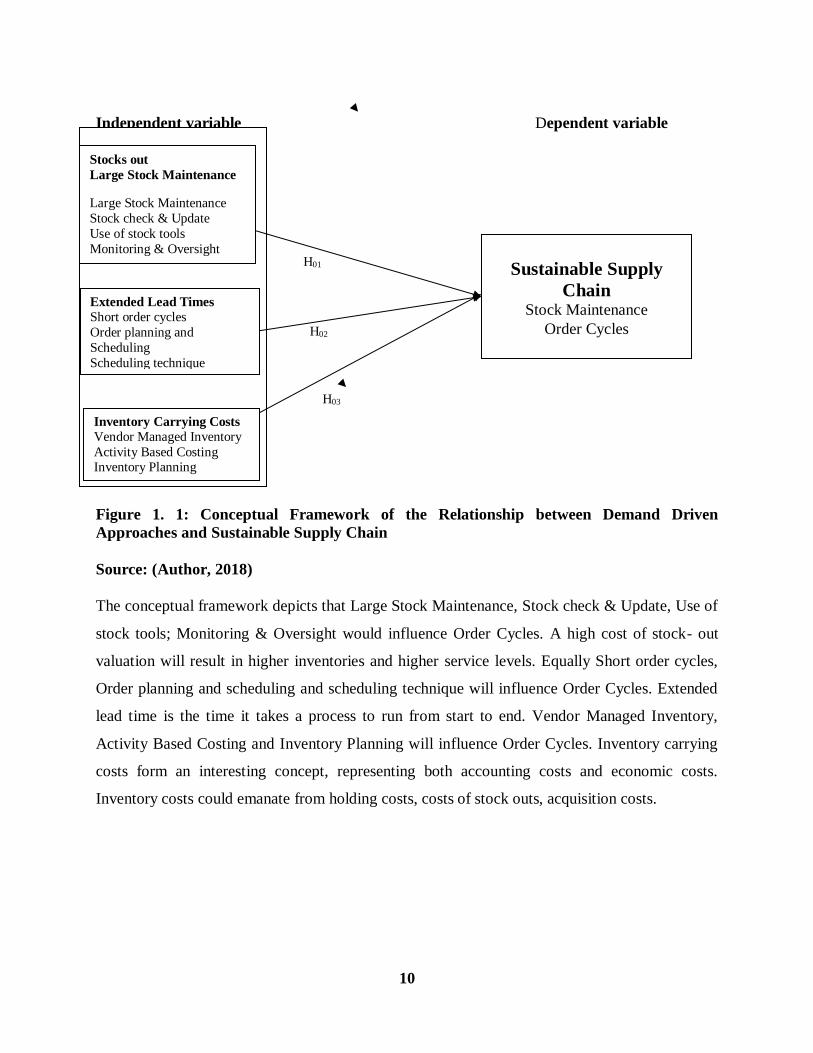
1.7 Conceptual Framework
Conceptual Framework is a diagrammatic explanation of the research problem hence an
explanation of the relationship among several factors that have been identified as important to
the study (Ngechu, 2006). The conceptual framework provides a basis for understanding the
multiple connections between the variables under study.
10
Independent variable Dependent variable
Figure 1. 1: Conceptual Framework of the Relationship between Demand Driven
Approaches and Sustainable Supply Chain
Source: (Author, 2018)
The conceptual framework depicts that Large Stock Maintenance, Stock check & Update, Use of
stock tools; Monitoring & Oversight would influence Order Cycles. A high cost of stock- out
valuation will result in higher inventories and higher service levels. Equally Short order cycles,
Order planning and scheduling and scheduling technique will influence Order Cycles. Extended
lead time is the time it takes a process to run from start to end. Vendor Managed Inventory,
Activity Based Costing and Inventory Planning will influence Order Cycles. Inventory carrying
costs form an interesting concept, representing both accounting costs and economic costs.
Inventory costs could emanate from holding costs, costs of stock outs, acquisition costs.
H03
H02
H01
Stocks out
Large Stock Maintenance
Large Stock Maintenance
Stock check & Update
Use of stock tools
Monitoring & Oversight
Inventory Carrying Costs
Vendor Managed Inventory
Activity Based Costing Inventory Planning
Sustainable Supply
Chain Stock Maintenance
Order Cycles
Extended Lead Times
Short order cycles
Order planning and
Scheduling
Scheduling technique
11
CHAPTER TWO: LITERATURE REVIEW
This section reviews the literature from previous studies and works related to the study
phenomena. It also provides the theoretical framework that the study is anchored upon.
2.1 Theoretical Framework
2.1.1 The Agile Supply Chain Theory
The market environment has become more dynamic and turbulent; companies need to adopt new
supply chain strategy for them to remain competitive. Supply chain management is now moving
away from traditional processes to agile capability of competitive bases of speed, flexibility,
innovation, quality, and profitability through the integration of reconfigurable resources and best
practices in a knowledge-rich environment to provide customer-driven products and services in a
fast changing market environment (Yusuf et al., 2004). Agility is a business-wide capability that
embraces organizational structures, information systems, logistics processes and in particular,
mindsets (Christopher, 2000). Lee (2004) argues that supply chain agility aims at responding
quickly to short-term changes in demand or supply and ensure that the company handles external
disruptions smoothly. Christopher (2000) identified four characters of agile supply chain that
included sensitivity, virtuality, process integration and network based. Process integration means
collaborative working between buyers and suppliers, joint product development, common
systems and shared information.
Agile supply chain is market sensitive and needs the supply chain members to be able to read
and respond to the market demand. The supply chain members should show the willingness to
create an environment in which information can flow freely in both directions in the chain for
them to achieve a more agile supplier base. Christopher (2000) argues that leveraging supplier
12
relations allows companies to create agile supply chains by reducing lead time between
organizations. The leverage of respective strengths and competencies of network partners assists
to achieve greater responsiveness to market needs (Christopher, 2000). Krajewski et al. (2009)
asserts that efficient supply chain has the qualities of make to stock, low capacity cushion, low
inventory investment, short lead time, emphasis low process with consistent quality and on time
delivery while for responsive supply chain include assemble to order with emphasis on product
variety operational strategy, high capacity cushion, just as needed inventory to enable fast
delivery time, shorten lead time and emphasis on fast delivery time, customization, and
flexibility. It is through information sharing and collaboration that the company as a whole will
have responsibility in assisting its external suppliers to improve quality, delivery time and
service performance. This requires real time market feedback on actual customer requirements
without making forecasts based upon past sales or shipments.
The use of information technology has helped the organizations to capture data on demand
through Efficient Customer Response (ECR) from point –of –sale or the point of use hence
increasing the responsiveness in process industries. Efficient Customer Response (ECR) is
designed to integrate and rationalize product assortment, promotion, new product development
and replenishment across the supply chain hence increasing emphasis on key areas such as EDI,
cross- docking and continuous replenishment (Harrison & Van Hoek, 2008). Implementing e-
business to streamline business processes provide windows into operations, integrating the
supply chain, increase customer services and streamline distribution (Rao 2002). Porter (2008)
opine that the adoption of information technology will change the competitive environment in
three ways, namely through changing the structure of the industry, changing the rules of
13
competition, and giving businesses new methods by which to gain competitive advantage over
the competition.
Information technology help to communicate between upstream and downstream partners hence
creating a virtual supply chain that is information based rather than inventory. Virtual supply
chain ensures information is shared among partners thereby forming a process alignment through
collaboration that is linked together as a network. Electronic Data Interchange (EDI) and the
internet have made it possible for partners in the supply chain to share the same data rather than
waiting for that extended chain to transmit data from one step to another. The company that are
market driven can easily realize agility by investing in product research and modern information
technology that enables it to react quickly to the fluctuations in product demand and sourcing
problems.
2.1.2 Stock Out cost
Inventory management is influenced by the nature of demand including whether demand is
derived or independent. Inventory levels are affected by customer service expectations, demand
uncertainty, and the flexibility of the supply chain (Ballou, 2004). For products characterized by
erratic demand, a short life cycle or product proliferation, a more responsive supply chain and
larger buffer inventories may be needed to meet a desired customer service level. Inventory costs
fall into three classes: carrying costs of regular inventory and safety stock, ordering or set up
costs, and stock- out costs. Inventory control systems balance the cost of carrying inventory
against the cost associated with ordering or shortfalls. Service level goals can differ by the value
placed on stock- outs and indirectly carrying costs. A high cost of stock- out valuation will result
in higher inventories and higher service levels. A constant availability of stock provides a
continuous uninterrupted customer service. The Item Fill Rate (IFR) Measures how a particular
14
by product (Often called a stock keeping unit or SKU) is available (Wilson, 2004). Stock levels
should be maintained to minimum level so as not to incur unnecessary stock holding cost but
always available for continuous service to customers. Careful analysis can identify an economic
order quantity (EOQ), being the quantity of an item that should be regularly ordered so as to
minimize total cost of ordering and holding cost. If stock-out occurs, different scenarios will
happen.
Subject to distribution inventory stock out or manufacturing inventory stock-out, the impact on
the supplier and the customer is different in terms of extent and scale, i.e. the impact is greater
and more serious for one party than the other one. So the attitude toward stock-out varies
accordingly. For instance, if there is a manufacturing inventory stock-out in the manufacturing
companies like Fordand Toyota, the result is critical. The production line will be shut down and
startup costs are very high. Hence such stock-out is prohibited. In case of distribution inventory
stock out, the impact on the customer is usually not big and serious, e.g. it is not a big deal when
consumers encounter such a stock-out, therefore their counterparts-the suppliers, such as
wholesalers and retailers, tolerate stock-outs. When a supplier is unable to satisfy demand with
available inventory, one of four events may occur: (1) the customer waits until the new
replenishment arrives; (2) the customer back orders the product; (3) the sale is lost; (4) the
customer is lost (Coyle et al., 2003). For most companies, the four results are listed from best to
worst in terms of the impact. Stock-out Costs is the cost associated with the lost opportunity
caused by the exhaustion of the inventory. The exhaustion of inventory could be a result of
various factors.
15
2.1.3 Extended Lead Time
Lead time is defined as the latency between the initiation and the execution of a process. Lead
time is the key issue for enhancing performance of organisations across various industries
(Treville et al. 2004). Lead time is a major consideration for retailers and customers in the supply
chain. Higher levels of integration results in reduced lead times. Chopra, Reinhardt and
Dadahardt (2004) showed that by decreasing the lead time uncertainty, the required safety stock
increases. Singh, Sohani and Marmat (2013) noted that in an information-enriched supply chain,
firms are closely connected with suppliers and customers both internally and externally because
of information sharing resulting in reduced lead time and increased performance. Extended lead
time is the time it takes a process to run from start to end.
Lead time can be measured in a number of ways, including manufacturing lead time (Jayaram,
Vickery & Droge 1999) and customer lead time (Duenyas & Hopp 1995). Customer lead time is
the time elapsed from receipt of an order until the finished product is either shipped or delivered
to the customer. Grönroos (2001) emphasized the importance of lead time in the experience of
inventory management, similar to the idea proposed by Lehtinen and Lehtinen (2002).
Customers bring their earlier experiences and overall perceptions of a service firm to each
encounter because customers often have continuous contacts with the same service firm
(Grönroos, 2001).
Therefore, the lead time issue was introduced as yet another important component in the
perceived quality inventory management model, so that the dynamic aspect of the service
perception process was considered as well. A favorable and well-known time strategy is an asset
for any firm because it has an impact on customer perceptions of the communication and
operations of the firm in many respects. If a service provider has a strong inventory management
16
in the minds of customers, minor mistakes will be forgiven. If mistakes often occur, however, the
image will be damaged. If a provider's image is negative, the impact of any mistake will often be
magnified in the consumer's mind. In a word, lead-time can be viewed as a filter in terms of a
consumer's perception of quality Parasuraman et al. (2005).
Lead-time has to live up to service promises, especially if the service provider is “claiming” the
quality service position in the firming industry. According to Navon & Berkovich (2006), the
main logistic responsibility in any organization is to formulate master programme for the timely
provision of materials, components and work-in progress. Stevenson (2001), explained that
logistics, including materials and goods flowing in and out of a production facility as well as its
internal handling has become very important to an organization to acquire competitive
advantages, as the company’s struggle to deliver the right product at the correct place and time.
The main aim is to actually promote, with low cost, a flow whose velocity allows the execution
of manufacturing process with expected satisfaction level. Bowersox & Closs (2002), articulated
that improvement in continuity of supplies with reduced lead times, will lead to improvement in
cooperation and will also enhance cooperation’s and Communications with reduced duplication
of efforts, reduction in material costs and improvement in quality control, which are the main
benefits of materials management.
2.1.4 Inventory Carrying Cost
There are costs associated with holding all inventories, and the costs go beyond the expenditure
of the inventory investment. Inventory carrying costs form an interesting concept, representing
both accounting costs and economic costs (Goldsby et al., 2005). A carrying cost is the expense
associated with holding inventory over a period of time. In other words, it's the cost of owning,
storing, and keeping inventory to be sold to customers. Accounting costs are explicit and call for
17
a cash payment. Economic costs are implicit, not necessarily involving an outlay but rather an
opportunity cost. The capital cost is the single biggest factor of inventory carrying cost. It is
opportunity cost; to clarify its sense, just think about what else could be done with the amount of
capital if it were not tied up in inventory? Inventory is viewed as an asset on the balance sheet;
hence, many state governments impose property tax rates on inventory. Insurance premiums are
paid to provide coverage against loss or damage to inventory. Obsolescence reflects the real
possibility that inventory value may decline in the course of being kept. Storage costs in this
figure just refer to variable costs of storage. Fixed warehousing costs, which do not change with
the volume of inventory maintained, are not included in inventory carrying costs but are
calculated as warehousing costs in a total logistics cost.
Inventory costs could emanate from holding costs, costs of stock outs, acquisition costs. First,
acquisition costs: acquisition costs include preliminary costs for preparing requisition, vendor
selection, negotiation costs; placement costs such as order preparation, stationery costs and post-
placement costs which include receipt of goods, material handling, inspection and payment of
invoices. Secondly, holding costs are storage costs-space, rates, light, heat and power costs;
labour costs that relate to handling, clerical and inspection; cost of insurance; interest on capital
tied up; costs of deterioration, obsolescence and pilferage. Other costs relate to stock outs: costs
associated with lack of inventory. These costs are; loss of production output, costs of idle time,
loss of customer goodwill and costs of rectifying the stock out. Whether you are making an
adjustment to record monthly sales or to account for inventory loss, you must determine the cost
of the items. The cost includes the actual price of the goods and also any shipping or freight costs
you must pay to receive the items. Inventory cost does not include outbound freight to ship
18
orders to customers, interest paid if you finance your purchases, storage or warehousing of your
inventory or insurance on the inventory in your possession ( Roels, & Perakis, 2006).
Effective cost management and reduction in inventory management can be a road map to
achieving your most critical organizational objectives. With careful planning and good cost
reduction techniques and planning, purchasers by use of inventory management can save big
amount of company’s budget major concepts in cost in purchasing are price, cost, and total value
analysis. The nature, purpose, scope and benefits of inventory management in reducing costs
associated with inventory make it suitable for different applications (Marcus and Keil,
2004;Kaplan and Sahney, 2000). Characteristics of inventory management are highlighted to
have important determinant of cost reduction in organizations. The value of inventory
management is defined as the benefit over costs of implementing. Inventory management is
justified only when the perceived benefit is large enough to cover the cost. Inventory
management offer a practice-intensive learning experience to anyone responsible for selecting
suppliers, negotiating prices and fees, and purchasing goods and services. Adoption of inventory
management is effective on Cost Management in performance of food processing companies.
According to (Shaw & Subramaniam, 2002), the value of inventory management can be defined
as price benefits plus transaction minus technology lock in cost. Price benefits result from saving
in theft, obsolescence, damage, holding capital and cost of ordering, cost of carriage and shortage
cost. Lower inventory cost is a definite advantage for the company that effectively controls its
inventory. Business owners need to fully understand the costs of carrying inventory, not just how
much the inventory costs to purchase. Inventory carrying costs consist of all the expenses a
company incurs for owning inventory. These expenses include the cost of capital, storage and
risks costs (including obsolescence, damage, theft and deterioration) plus the appropriate taxable
19
amounts. Effective inventory control reduces these costs because it reduces the total amount of
inventory required to manage the business. Inventory control monitors the level of inventory and
proactively manages obsolescence and deterioration by ordering in the appropriate quantities.
Effective inventory control also reduces storage costs, because it orders enough inventories to fill
consumer demand and not much more (Perakis, &Roels, 2010).
Well-defined inventory control policies can reduce the labor costs associated with managing the
inventory. Each time inventory gets handled, whether to move it from one location to another, to
retrieve it for order picking or to put it away for storage, it involves labor. This handling makes
up part of the cost associated with managing inventory. Companies prefer to handle the
inventory as little as possible. When a company constantly searches for lost inventory, moves
inventory from one location to another because of poor space utilization or handle the inventory
multiple times, it results in increased labor costs. Properly managed inventory reduces these
incidents and reduces the labor cost associated with the inventory (Jordan, 2007).
2.1.5 Sustainable Supply Chain Management
Seuringand Muller (2008) merge definitions for SCM and sustainability and defined SSCM as
“the management to material, information and capital as well as cooperation among companies
along the supply chain while taking goals from all three dimensions of sustainable development,
i.e., economic, environmental and social into account which is derived from customer and
stakeholder requirements.” According to the Sustainable Supply Chain Foundation (SSCF),
Sustainable Supply Chain Management involves integrating environmentally and financially
viable practices such as recycling, refurbishing, waste management and so forth into the
complete supply chain lifecycle, from product design and development to material selection
(including raw material extraction or agricultural production), manufacturing, packaging,
20
transportation, warehousing, distribution, consumption, return and disposal. Supply chain
sustainability is based on the principle that socially responsible products and practices are not
only good for the environment, but are important for long-term profitability.
All supply chains can be optimized using sustainable practices. Sustainability in the supply chain
encapsulates a number of different priorities: environmental stewardship, conservation of
resources, reduction of carbon footprint, financial savings as well as viability and social
responsibility. Sustainable development meets needs of people today without compromising the
ability of people in future to meet their needs (CIPS, 2014). Sustainability integrates social,
environmental, and economic systems. Social aspects include following applicable laws and
international treaties using open and transparent participatory processes that actively engage
relevant stakeholders, establish rights and obligations, and emplace a long-term sustainability
plan with periodic monitoring; and ensuring decent wages and working conditions, the safety of
workers, and workers’ rights to organize as well as collectively bargain (Mukanga, 2011).
Environmental sustainability occurs when processes, systems and activities reduce the
environmental impact of organizations’ facilities, products and operations.
Economic sustainability is used to define strategies that promote utilization of socio-economic
resources to their best advantage. A sustainable economic model proposes an equitable
distribution and efficient allocation of resources. The idea is to promote use of those resources in
an efficient and responsible way that provides long-term benefits as well as establishes
profitability (UNGC-Accenture, 2013) Kovacs (2014) opines that supply chain sustainability is a
holistic perspective of supply chain processes and technologies that go beyond the focus of
delivery, inventory and traditional views of cost. This emerging philosophy is based on the
21
principle that socially responsible products and practices are not only good for the environment,
but also they are important for long-term profitability. Therefore, sustainability is a business
strategy that drives long-term corporate growth and profitability by mandating inclusion of
environmental and social issues into the business model. It is intended to generate a maximum
increase in company, consumer and employee value by embracing opportunities including
managing risks derived from environmental as well as social developments.
2.2 Empirical Literature Review
2.2.1 Stock out and Sustainable supply chain
Li et al. (2006) investigated the impact of supply chain management practices on competitive
advantage and organizational performance. Supply chain management practices identified were
strategic supplier partnership, customer relationship, level of information sharing, quality of
information sharing and postponement. The results showed that the organizations with high level
of Supply chain management practice can lead to enhanced competitive advantage and improved
organizational performance. The study was carried out in USA and metrics for measuring
organizational performance using both financial and market criteria, included return on
investment (ROI), market share, profit margin on sales, the growth of ROI, the growth of sales,
the growth of market share, and overall competitive position.
Osoro et al. (2015) analyzed the effect of crude oil price as a determinant on performance of
supply chain systems in the petroleum industries in Kenya. The study employed a censuring
sampling frame due to the fact that the targeted populations of entire stakeholders was about 73
companies who are involved daily in the oil industry management. It was established that cost of
crude oil affects performance of supply chain systems in the petroleum industries.
22
Namasenge and Biraori (2015) conducted study that aimed at assessing the effect of supplier
relationship on the effectiveness of supply chain management practices in Kenyan public sector:
case of Ministry of Finance. The study identified that lack of supplier relationship management
strategies lowered the effectiveness of supply chain management functions.
Previous studies reviewed (Namasenge and Biraori (2015), Osoro et al. (2015) , and Li et al.
(2006) have attempted to investigate the relationship between demand driven approaches and
sustainable supply chain. However no study reviewed looked at the relationship between stock
out and sustainable supply chain. Information on the relationship between stock out and
sustainable supply chain is therefore lacking.
2.2.2 Extended lead time and sustainable supply chain
Sukati et al. (2011) investigated the relationship between supply chain management practices
and the competitive advantage of firm. Supply chain management practices that he adopted
included supplier partnership, customer relationship and information sharing. The study was
conducted in Malaysia manufacturing industry by sending questionnaires to 200 supply chain
practitioners. The study showed that there is a positive relationship between supply chain
management practices and the competitive advantage of the firm.
Okello and Were (2014) conducted the study on the Influence of supply chain management
practices on performance of the Nairobi securities exchange’s listed, food manufacturing
companies in Nairobi. The study identified product development processes, inventory
management, lead time, technology and innovation as supply chain management practices in the
study. They asserted that five Supply chain management practices have a significant influence on
the performance of food manufacturing companies in Kenya. They suggested that supply chain
23
interventions need to be put in place to address issues such as negotiating contracts with external
suppliers, involvement of E-procurement, creation of a close relationship with suppliers and
provision of continuous tracking over the physical movement of inventor.
Previous studies reviewed Okello and Were (2014) and Sukati et al. (2011) have attempted to
investigate the relationship between demand driven approaches and sustainable supply chain.
However no study reviewed looked at the relationship between extended lead time and
sustainable supply chain. Information on the relationship between extended lead time and
sustainable supply chain is therefore lacking.
2.2.3 Carrying cost and sustainable supply chain
Ibrahim and Hamid (2012) carried out a study on supply chain management practices and supply
chain performance effectiveness in manufacturing companies in Sudan. They collected through
questionnaires by sending to supply chain managers or top-level executives in 150 large
manufacturing corporations among Sudanese listed in and registered in ministry of industry.
They found that Integration, information sharing, customer management and speed of
responsiveness were the supply chain management practices that were adopted in the study. The
study revealed that there is a positive relationship between supply chain management practices
and performance through effectiveness.
Sari (2009) investigated the Framework for analyzing and developing information integration. A
study on steel industry maintenance service supply chain. The aim of his study was to understand
the meaning, constituents, extent, and development means of information integration in service
supply chain context. He argued that service providers should be integrated to the supply chain
just like other supply chain members as it contributes to the supply chain performance. Gustav
24
and Mankowitz (2008) aimed at investigating Supply Chain Management in the Swedish steel
industry. It specifically investigated how actors in the industry regard their supply chains in
relation to their overall strategy and what implications industry specifics have when the flow of
material and information is to be optimized. A study by Toyin (2012) carried out in Nigerian
manufacturing companies on the impact supply chain management practices on the performance
revealed that information sharing, information quality, lean system and postponement has
positive effect on Supply chain management performance of Nigerian manufacturing companies.
Musuya and Namusonge (2013) assessed the factors that affect the implementation of JIT supply
chain practices in public health sector in Kenya and found that product demand/ supply stability
variable influence on the ability to implement JIT in Ministry of public health. Mutuetandu and
Iravo (2014) investigated the impact of Supply Chain Management Practices on Organizational
Performance: A Case Study of Haco Industries Limited (Kenya).The study found out that supply
chain management practices like customer relations, strategic partnerships, training and
information sharing have a positive effect on the organization’s performance. Kimani (2013)
investigated the supply chain management challenges in Kenya petroleum industry: Case of
national oil corporation of Kenya and found out that four independent variables namely;
information technology, supply chain design, collaboration issues and people issues are very
critical to effective supply chain management in the petroleum sector.
Okemba and Namusonge (2014) conducted research to establish whether reverse logistics as
green supply chain management practices determines supply chain performance in Kenya’s
manufacturing firm: A case study of Nairobi based firms in the food and beverage sector.
Findings revealed that the firms in focus had adopted GSCM practices to a great extent, was
however there was a disconnect between adoption and practice in that, respondents affirmed that
25
they had incorporated recyclable content as well as ensured reusability of their packaging but
when it comes to collecting the same used packages under reverse logistics, a significant
percentage (46%) was non-committal on whether they collect from customers/return to their
suppliers.
Okanda, Namusonge and Waiganjo (2016) investigated the influence of supply planning practice
on the performance of the unit of vaccines and immunizations in the Ministry of health, Kenya
and found out that supply planning practices such as optimum inventory procurement,
determination of health requirements of health facilities at every node, aggregate determination
requirements and joint coordination with suppliers if adopted by the unit of vaccines and
immunizations will increase the performance positively
Although the studies carried out by Mutuetandu and Iravo (2014) addressed some variables in
this study, this study was not carried out in steel manufacturing companies in Kenya. The studies
carried out in steel industry, were either done in developed countries like Sweden (Gustav &
Mankowitz, 2008) and Finland (Sari, 2009). Most of studies done in Kenya did not address
specifically the steel manufacturing companies and the variables used as supply chain
management practices were different from the one used in this study. Hence there was need for
an empirical study to be carried out in steel industry in Kenya. The study adopted the supply
chain management practices that included supply chain collaboration practice, Green Supply
Chain Management Practice, Information Sharing Practice and Customer relationship
management Practice.
Previous studies reviewed Ibrahim and Hamid (2012), Mutuetandu and Iravo (2014), Okanda,
Namusonge and Waiganjo (2016), have attempted to investigate the relationship between
26
demand driven approaches and sustainable supply chain. However no study reviewed looked at
the relationship between carrying cost and sustainable supply chain. Information on the
relationship between carrying cost and sustainable supply chain is therefore lacking.
2.3 Summary of Knowledge Gaps
The reviewed studies (Namasenge and Biraori (2015), Osoro et al. (2015) , and Li et al. (2006)
have attempted to investigate the relationship between demand driven approaches and
sustainable supply chain. However no study reviewed looked at the relationship between stock
out and sustainable supply chain. Information on the relationship between stock out and
sustainable supply chain is therefore lacking.
The reviewed studies Okello and Were (2014) and Sukati et al. (2011) have attempted to
investigate the relationship between demand driven approaches and sustainable supply chain.
However no study reviewed looked at the relationship between extended lead time and
sustainable supply chain. Information on the relationship between extended lead time and
sustainable supply chain is therefore lacking.
The reviewed studies Ibrahim and Hamid (2012), Mutuetandu and Iravo (2014), Okanda,
Namusonge and Waiganjo (2016), have attempted to investigate the relationship between
demand driven approaches and sustainable supply chain. However no study reviewed looked at
the relationship between carrying cost and sustainable supply chain. Information on the
relationship between carrying cost and sustainable supply chain is therefore lac
27
CHAPTER THREE: RESEARCH METHODOLOGY
This chapter outlines the research design adopted by the study, the target population, sample and
the sampling procedures, data collection, validity and reliability and data analysis methods and
presentation.
3.1 Research Design
Kerlinger (1973) defines research design as an arrangement of conditions for collecting and
analyzing of data in a manner that aims to combine relevance to the research purpose with
economy in procedure. It is the conceptual structure within which research is conducted; it
constitutes the blueprint for the collection, measurement and analysis of data. Orodho (2003)
defines research design as the scheme, outline or a plan used to generate answers to research
problems. Correlation research design was adopted used in this study. According to Kothari
(2008) correlation research design determines the frequency with which a variable occurs or its
association with other variables. This design helped in looking at the association between
independent variables and dependent variables.
3.2 Study Area
Homa Bay County number 043 is located in Western Kenya and borders Kisii County and
Nyamira County to the South-East, Kericho County to the East, Kisumu County to the North
and Lake Victoria to the North-West. It lies between 0º 40’ and 0º South and longitude 34º and
34º 50 east (Republic of Kenya, 2009). Homa Bay is popularly known as the Bay County
because of its many bays. It has breathtaking islands with the most famous being Rusinga and
Mfangano, hills, valleys and the longest shores of Lake Victoria. With 80% of Kenya’s Lake
Victoria in Homa bay, the county leads as the supplier of fresh lake fish in Kenya. According to
the 2009 Kenya Population and Housing Census, it has a population of 963,794 with a
28
population density of 303 people per Km2 and an annual growth rate of 2.7%. It covers an area
of 3,183.3Km2.
3.3 Target Population
Cooper & Schindler (2001), defined population as the total collection of elements about which
we wish to make some inferences. The study population constituted all the procurement
Directors, administrators and members of the procurement department. According to the Homa
Bay county Government Human resource department there is 132 procurement staff. The study
adopted purposive sampling which was done in order to select respondents who were directly
engaged in procurement.
3.4 Sample and Sampling Technique
Sampling is a procedure of using a small number of items or part of the whole population to
make conclusions regarding the population. It enables the researcher to estimate some unknown
characteristics of the population and make generalization, (Zikmund, 2003). The study
purposively targeted the procurement director and administrators, and members of the
procurement department. Purposive sampling as a technique allowed the researcher to use cases
that have the required information with respect to the objectives of the study (Gay, 2006). The
respondents who participated in the study were stratified into strata using stratified random
sampling technique. Simple random sampling method was used to select the procurement
officers of Homa Bay County who were given equal chance of being selected per strata. A
sample of respondents operating for the last three years were selected using Yamane’s (1967)
formulae
29
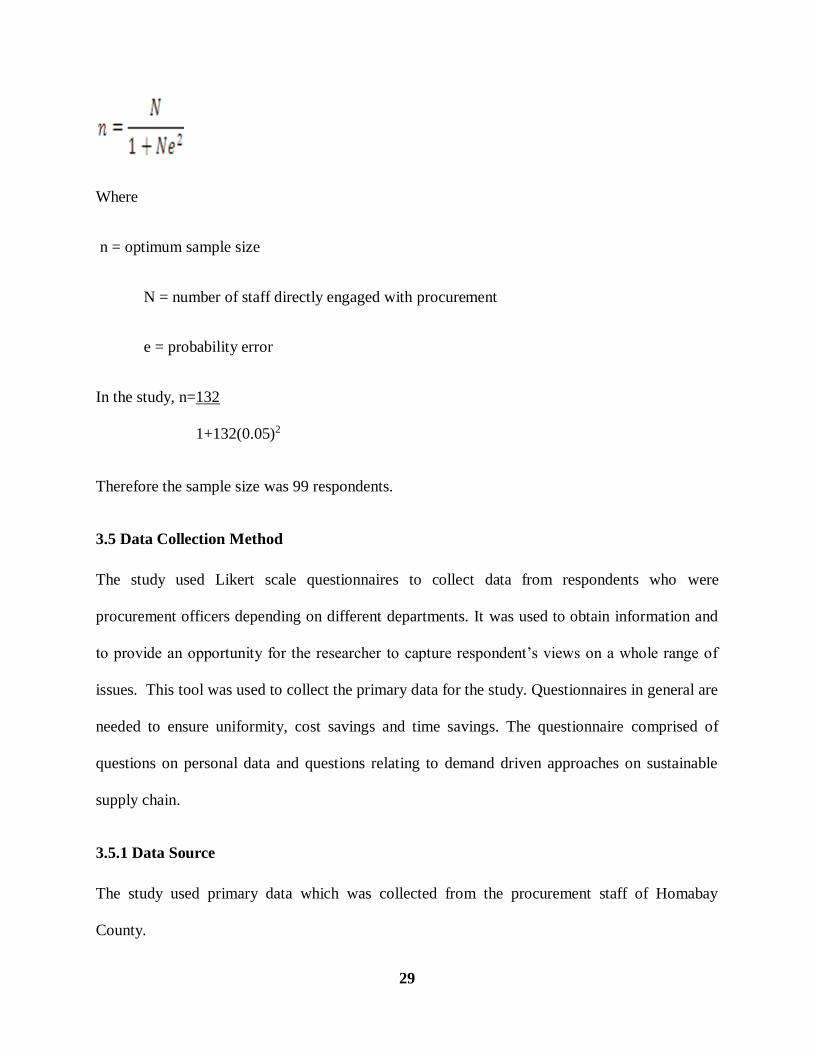
Where
n = optimum sample size
N = number of staff directly engaged with procurement
e = probability error
In the study, n=132
1+132(0.05)2
Therefore the sample size was 99 respondents.
3.5 Data Collection Method
The study used Likert scale questionnaires to collect data from respondents who were
procurement officers depending on different departments. It was used to obtain information and
to provide an opportunity for the researcher to capture respondent’s views on a whole range of
issues. This tool was used to collect the primary data for the study. Questionnaires in general are
needed to ensure uniformity, cost savings and time savings. The questionnaire comprised of
questions on personal data and questions relating to demand driven approaches on sustainable
supply chain.
3.5.1 Data Source
The study used primary data which was collected from the procurement staff of Homabay
County.
30
3.5.2 Piloting
To ensure reliability and validity of the questionnaire, pilot test will be done using 13
respondents from Migori County, procurement department. The time of completion was recorded
and how well the question is understood and answered was ascertained. The pilot test was
performed twice in a span of one week.
3.5.3 Reliability Instruments
According to Meller, (2001) reliability of measurement concerns the degree to which a particular
measuring procedure gives similar results over a number of repeated trials. Cronbach’s alpha test
of internal consistency was used to test the findings from the gathered data during a pilot study
and a coefficient of 0.878 which is above the threshold of 0.7 which is the cutoff point (Meller,
2001) established indicating instruments reliability.
3.5.4. Validity of the Study
Patton (2002), states that validity and reliability are two factors which any researcher should be
concerned about while designing a study, analyzing results and judging the quality of the study.
Validity test, according to Saunders, Lewis and Thornhill (2007) is the degree to which a test
measures what it is supposed to measure. According to Mugenda (2008), content validity was
ensured by literature searches to ensure that items were based on the study concepts. This was
also corroborated by expert judgment and the mitigation of corrections given by the supervisors.
Consequently, the advice of supervisors and practitioners who are experts in the field was also
sought and incorporated.
3.6 Data Analysis
This study used quantitative data analysis method. Descriptive statistics such as frequency
distribution and percentages was used to analyse biographical information of study respondents,
31
while Pearson’s correlation and multiple regressions was used to analyse the relationship
between elements of stocks out, extended lead times, and inventory carrying costs, and demand
driven approaches as recommended by Hair, Babin, Money & Samouel (2003). These variables
were tested from a general multiple regression equation of the form:
Y= β0 + β 1X1 + β 2X2+β 3X3=€
Where Y= measure the key indicator being demand driven approaches
β0 =Constant
β1 to β5 =Regression coefficients
X1= Effect of stocks out
X2= Effect of extended lead times
X3= Effect of inventory carrying costs
€ = Coefficient of error
A partial regression coefficient represents the change in dependent variable, due to one unit
change in independent variable; e is the margin term.
3.8 Ethical Consideration
The researcher distributed questionnaires to respective respondents accompanied by a letter of
introduction upon approval by Maseno University School of Graduate Studies (SGS) and
Maseno University Ethical Review Committee (MUERC) The letter provided details concerning
the researcher, the research and the objectives of the research. It also provided details on how
participants’ information would be addressed including confidentiality issues. The researcher
ensured responsible use of data and respected the dignity and welfare of anyone the researcher
worked with. The study adhered to the universal principles underlying research such as honesty
and respect for the rights of individuals or personalities in the study. Informed consent as Grey
32
(2002) points out is an important ethical norm any researcher should consider. No participant
was forced to either answer any question they did not feel comfortable with or disclosed
information they did not wish to divulge. Responses given by an individual were not be shared
by any other persons except those directly involved in the study and were only be used for
academic purposes. The researcher paid attention to plagiarism. No work was used without
attribution. The researcher also ensured that every work was not used verbatim and that proper
paraphrasing was ensue.
33
CHAPTER FOUR: RESULTS AND DISCUSSIONS
This chapter presents data analysis and findings of the study in two major sections. The first
section provides demographic characteristics of the respondent of the study, while the second
section gives out the results and discussions of this research.
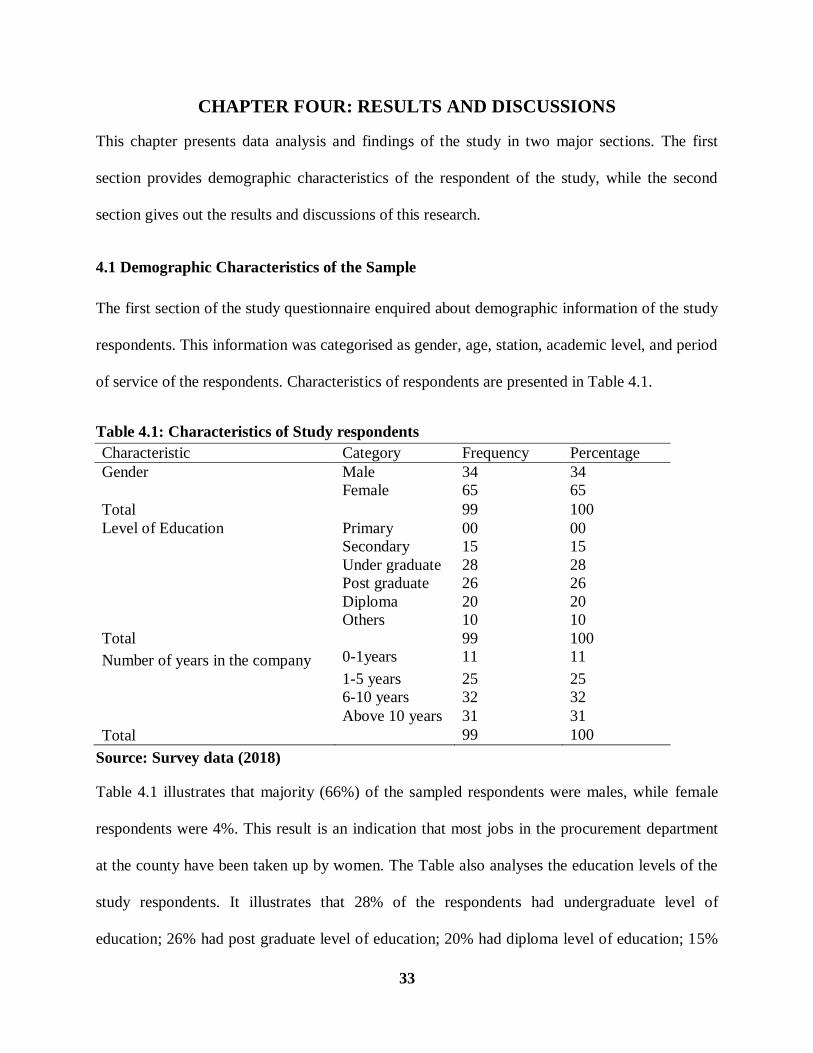
4.1 Demographic Characteristics of the Sample
The first section of the study questionnaire enquired about demographic information of the study
respondents. This information was categorised as gender, age, station, academic level, and period
of service of the respondents. Characteristics of respondents are presented in Table 4.1.
Table 4.1: Characteristics of Study respondents
Characteristic Category Frequency Percentage
Gender Male 34 34
Female 65 65
Total 99 100
Level of Education Primary 00 00
Secondary 15 15
Under graduate 28 28
Post graduate 26 26
Diploma 20 20
Others 10 10
Total 99 100
Number of years in the company 0-1years 11 11
1-5 years 25 25
6-10 years 32 32
Above 10 years 31 31
Total 99 100
Source: Survey data (2018)
Table 4.1 illustrates that majority (66%) of the sampled respondents were males, while female
respondents were 4%. This result is an indication that most jobs in the procurement department
at the county have been taken up by women. The Table also analyses the education levels of the
study respondents. It illustrates that 28% of the respondents had undergraduate level of
education; 26% had post graduate level of education; 20% had diploma level of education; 15%
34
had secondary level of education, while 10% had other levels of education that were not
presented in the questionnaire. With only 15% of the sampled respondents with secondary level
of education, it can be concluded that the staff at the supplies chain department were fairly
qualified academically, hence were in a better position to provide appropriate answers to
questions as posed by the study.
Table 4.1 also indicates that 32% of the sampled respondents had served in the procurement
department for between 6 and 10 years. Additionally, 31% of the employees had been at the
same department for over 10 years while 25% of them had stayed in procurement department for
between one and five years. The remaining 12% of the sampled employees had stayed in the
company for less than one year. With over 60% of the staff having more than six years of work
experience at the procurement department, it was expected that they were well conversant with
practices that could enhance sustainable supply chain in the organization.
4.2 Demand Driven Approaches on Sustainable Supply Chain
The second part of the questionnaire examined the study variables: effect of demand driven
approaches on sustainable supply chain. It begins by assessing the dependent variable.
4.2.1 Indicators of Sustainable Supply Chain
The second section of the study tool sought to establish the indicators of sustainable supply chain
at the supply chain department. In this regard, respondents were asked to state their level of
agreement with regard to various indicators presented in the questionnaire have been realised at
the county using a scale of: Key: 5- Strongly agree 4- Agree 3- undecided 2- Disagree 1-
Strongly disagree was used to measure the responses from respondents. Table 4.2 illustrates the
Mean (M) of responses obtained through descriptive statistics.
35
Table 4.2: Indicators of Sustainable Supply Chain
Indicators of sustainable supply chain M 1 2 3 4 5
1 Reduction in process cost 1.36 47.3 26.3 12.3 13.4 14.1
2 Improvement in responsiveness 2.12 25.4 29.6 5.2 27.2 12.6
3 Facilitate Decision making 1.56 40.1 28.4 10.3 14.8 6.4
4 Improvement in Relationship with Trading Partners 1.27 49.5 28.6 12.6 4.6 4.7
5 Reduction in Cycle times 1.32 46.8 23.4 13.4 10.3 6.1
6 Reduced Delivery on incorrect Items 3.12 26.1 21.5 34.2 10.2 8.0
Source: (Survey Data, 2018)
Table 4.2 illustrates that the sampled respondents disagreed that: Reduction in process cost
(73.6%; M=1.36); Improvement in responsiveness (55%; M=2.12); Facilitate Decision making
(68.5%; M=1.56); Improvement in relationship with trading partners (78.1%; M=1.27);
Reduction in Cycle times (70.2%; M=1.32); Reduced Delivery on incorrect Items (47.6%;
M=3.12)
4.3.2 Stock – Out and Sustainable Supply Chain
The third section of the study instrument sought to establish how aspects of stock-out have been
practiced to enhance sustainable supply chain in Homa Bay County. In this regard, respondents
were asked to state the level of their agreement with how various items presented in the
questionnaire have enhanced sustainable supply chain as: 5- Strongly agree 4- Agree 3-
undecided 2- Disagree 1- Strongly disagree. The Mean (M) of the items as well as percentages
obtained through descriptive statistics is presented in Table 4.3.
36
Table 4.3: Stock Out and Sustainable Supply Chain
Mean 1 2 3 4 5
Stock is checked and updated 3.26 18.2 17.8 28.5 25.2 10.3
Reporting tools are used in stock validation 4.13 15.5 14.7 21.3 23.8 24.7
Large stock are maintained 2.29 32.1 24.6 15.3 15.8 12.2
Monitoring and oversight mechanism is necessary for
stock outs and sustainable supply chain
4.21 12.4 10.2 0.3 32.6 44.5
Staff qualification is necessary for stock outs and
sustainable supply chain
2.47 29.6 23.5 6.5 20.8 19.6
Source: (Survey Data, 2018)
Table 4.3 indicates that the sampled employees disagreed that sustainable supply chain is
enhanced when stock is checked and updated (36%; M=3.26), with 35.5% of them agreeing that
it enhances sustainable supply chain in the county. However, 28.5% of the sampled respondents
were undecided. The table also illustrates that 48.5% (M=4.13) of the respondents agreed that
reporting tools used in stock validation enhances sustainable supply change, with 30.2% of them
disagreeing. Some 21.3% of the sampled respondents however remained undecided.
As to whether maintenance of large stock enhances sustainable supply chain, 56.7% (M=2.29) of
the sampled respondents disagreed while 28% of them agreed. The remaining 15.3% of the
respondents were undecided. With regard to whether monitoring and oversight mechanism is
necessary for stock outs and sustainable supply chain, 77.1% (M=4.21) of the sampled
respondents agreed while 22.6% of them disagreed that it enhances sustainable supply chain. The
remaining 0.3% of the respondents were undecided. The table also presents results as to whether
staff qualification is necessary for stock outs and sustainable supply chain, whereby 53.1%
37
(M=2.47) of the sampled respondents disagreed that it enhances sustainable supply chain while
40.4% agreed. Some 6.5% of the sampled respondents were however undecided.
Findings in this section seem to support Boon-itt and Pongpanarat (2011) who adapted the seven
service SCM practices from Ellram et al. (2004) which are demand management, customer
relationship management, supplier relationship management, capacity and resource management,
service performance management, information and technology management, order process
management. Based on detailed analysis, they found five main dimensions of SCM practices
widely acknowledged by the researchers as well as suitable to be applied in healthcare industry.
These five service SCM practices are information & technology management, customer
relationship management, supplier relationship management, demand management, and capacity
and resource management.
4.3.3 Lead Time and Sustainable Supply Chain
The fourth section of the questionnaire investigated how aspects of lead time have been practiced
to enhance sustainable supply chain in Homa Bay County. In this regard, respondents were asked
to state the level of their agreement with regard to how various items presented in the
questionnaire have enhanced sustainable supply chain at Homa Bay County. A scale of 5-
Strongly agree 4- Agree 3- undecided 2- Disagree 1- Strongly disagree was used to measure the
responses. The mean (M) of the items as well as percentages are presented in Table 4.5.
38
Table 4.5: Lead Time and Sustainable Supply Chain
M 1 2 3 4 5
The County procurement department order cycle time is
very short
1.23 36.9 30.8 5.9 10.4 6.0
There is strict adherence to order planning schedule 4.56 16.2 11.4 6.3 32.1 34
The County procurement department has a lower lead
time relative to the industry norm
1.48 34.9 28.8 4.1 13.6 8.6
The County procurement department order scheduling
techniques are very effective
3.17 25.2 23.9 31.8 10.2 8.9
The County procurement department experience a
minimum number of faultless notes invoiced
1.35 38.2 26.8 4.8 19.6 10.6
Source: (Survey Data, 2018)
As illustrated in Table 4.5, aspects of lead time which respondents agreed with as enhancing
sustainable supply chain was strict adherence to order planning schedule (66.1%; M=4.56). In the
meantime, most respondents disagreed that very short time of order cycle (67.7%; M=1.23);
lower lead time relative to industry norm (38.2%; M=1.35); and experience of minimum number
of faultless notes invoiced (65%; M=1.35) enhance sustainable supply chain in the county.
However, the respondents were undecided as to whether effectiveness of order scheduling
technique (31.8%; M=3.17) has enhanced sustainable supply chain at the county.
Results in Table 4.5 seem to contradict Namasenge and Biraori (2015) who, in a study that aimed
at assessing the effect of supplier relationship on the effectiveness of supply chain management
practices in Kenyan public sector: case of Ministry of Finance. They identified that lack of
supplier relationship management strategies lowered the effectiveness of supply chain
management functions. However, findings on adherence with order planning concurs with
Okanda et al (2016) who investigated the influence of supply planning practice on the
39
performance of the unit of vaccines and immunizations in the Ministry of health, Kenya and
found out that supply planning practices such as optimum inventory procurement, determination
of health requirements of health facilities at every node, aggregate determination requirements
and joint coordination with suppliers if adopted by the unit of vaccines and immunizations will
increase the performance positively.
This also supports by the Agile supply theory which argues that supply chain members should
show the willingness to create an environment in which information can flow freely in both
directions in the chain for them to achieve a more agile supplier base.
4.3.4 Inventory cost and sustainable supply chain
The fifth (and the last) section of the questionnaire investigated how aspects of inventory cost
have been practiced to enhance sustainable supply chain in Homa Bay County. In this regard,
respondents were asked to state the level of their agreement with regard to how various items
presented in the questionnaire (related to inventory cost) have enhanced sustainable supply chain
at Homa Bay County. A scale of 5- Strongly agree 4- Agree 3- undecided 2- Disagree 1-
Strongly disagree was used to measure the responses obtained from the sampled respondents.
Results presented in Mean (M) of the items and percentages are presented in Table 4.7.
40
Table 4.7: Inventory Cost and Sustainable Supply Chain
M 1 2 3 4 5
Application of Economic Order Quantity helps improve organizational supply chain performance by way of quantities required and when they
are required.
4.65 13.9 6.5 19.6 31.4 28.6
Activity Based Costing (ABC) analysis application necessitates organizations to attain optimal supply chain performance.
2.74 37.4 28.1 4.2 19.3 11
Inventory planning helps organizations achieve optimal supply chain
performance in simulation both financially and on service delivery. 1.84 41.3 29.2 3.1 13.5 12.9
Vendor management inventory system eases management’s work for
inventory replenishment. 2.81 38.2 22.8 12.9 10.7 15.4
Lack of inventory management techniques has contributed to poor
supply chain performance. 3.87 18.5 13.1 3.9 25.1 39.4
Source: (Survey Data, 2018)
Table 4.7 illustrates that aspects of inventory cost which the sampled employees agreed to have
enhanced sustainable supply chain at Homa Bay County is the application of economic order
quantity (60%; M=4.65) and that lack of inventory management techniques has contributed to
poor supply chain performance (64.5%; M=3.87). The sampled respondents however disagreed
that activity-based analysis (65.5%; M=2.74); inventory planning (70.5%; M=1.84) and vendor
management inventory system (61%; M=2.81) as practiced at the county has enhanced
sustainable supply chain.
The findings in Table 4.7 indicate that the sampled employees seem not to be appreciative with
the manner in which key inventory cost approaches like information management and analysis
are practiced at the county. Probably this is one of the factors that have informed low attainment
of sustainable supply chain (Table 4.2). Some previous researchers have come up with results
that appreciate the impact of information management (a major determinant of inventory cost) on
supply chain performance. In a study by Toyin (2012) in Nigerian among manufacturing
41
companies, it was revealed that information sharing, information quality, lean system and
postponement has positive effect on supply chain management performance of Nigerian
manufacturing companies. Another study by Ibrahim and Hamid (2012) among manufacturing
companies in Sudan also established that Integration, information sharing, customer management
and speed of responsiveness are supply chain management practices that can enhance sustainable
supply chain.
Equally, Kimani (2013), in an investigation of the supply chain management challenges in
Kenya petroleum industry also found out that four independent variables: information
technology, supply chain design, collaboration issues and people issues are very critical to
effective supply chain management in the petroleum sector. Customer relations, strategic
partnerships, training and information sharing were also found to have positive impact on
organization’s supply chain performance in a study by Mutuetandu and Iravo (2014) in Haco
Industries Limited (Kenya).
4.3 Relationship between Demand Driven Approaches on Sustainable Supply Chain
A descriptive analysis was first done to establish the extent to which demand driven approaches
relate with sustainable supply chain in the organization. Table 4.9 presents the results of the
descriptive analysis of quantitative data.
Table 4.9: Descriptive Analyses of Sustainable Supply chain
N Minimum Maximum Mean Std. Deviation
Sustainable supply chain 99 1.00 5.00 2.1111 0.84096
Inventory Cost 99 1.00 5.00 3.3300 1.25696
Lead Time 99 1.00 5.00 3.6970 1.12215
Stock Out 99 2.00 5.00 2.2068 .99725
Valid N (listwise) 99
Source: (Survey, 2018)
42
Table 4.9 indicate that employees at Homa Bay County disagreed that sustainable supply chain
has been attained (M=2; SD=0.84096). Similarly, the respondents also disagreed that stock out
has affected sustainable supply chain (N=2.2068; SD=0.99725) at the county. However, the
sampled employees agreed that lead time approaches (M=3.7; SD=1.12) as practiced at the
county have affected sustainable supply chain. The respondents however remained undecided as
t whether inventory cost approaches (M=3.33; SD=1.26) has affected sustainable supply chain at
the county. It is therefore emerging from this finding that lead time approach as applied at the
county is the main demand driven practice that tend to affect sustainable supply chain in the
organization. In regard to sustainable supply chain having been achieved only to a small extent,
it implies that there is a problem in lead time at Homa Bay County.
This finding seem to concur with Agile Theory, which asserts that lead time practices through
information sharing and collaboration has the potential of assisting external suppliers to improve
quality, delivery time and service performance. The theory further urges that this requires real
time market feedback on actual customer requirements without making forecasts based upon past
sales or shipments. Efficient Customer Response (ECR) is designed to integrate and rationalize
product assortment, promotion, new product development and replenishment across the supply
chain hence increasing emphasis on key areas such as EDI, cross- docking and continuous
replenishment (Harrison & Van Hoek, 2008).
Lead time practices as a panacea to attainment of sustainable supply chain have been a focus of
many researchers. Sukati et al. (2011), in a study done in Malaysia, found a positive relationship
between lead time practices and the competitive advantage of firms. Okello and Were (2014)
suggested that supply chain interventions need to be put in place to address issues such as
negotiating contracts with external suppliers, involvement of E-procurement, creation of a close
43
relationship with suppliers and provision of continuous tracking over the physical movement of
inventor. However, there was need to examine how demand driven approaches affect
sustainable chain among firms. This study therefore examined the effect of demand driven
approaches (inventory cost, lead time, and stock out) and sustainable supply chain in Homa Bay
County.
4.4 Effect of Demand Driven Approaches on Sustainable Supply Chain
Multiple regression analysis was performed to determine the effect of demand driven approaches
(stock out, lead time, and inventory cost) on sustainable supply chain at the Homa Bay County.
The results are as presented in table 4.10.
Table 4.10: Effect of Demand Driven Approaches on Sustainable Supply Chain
Table 4.10 shows results from a multiple regression analysis where the independent variables
were stock-out, lead time, and inventory cost, while the dependent variable was sustainable
supply chain. It was established that the independent variable (stock out, lead time, as well as
inventory cost) all together caused about 0.792 (79.2%) variations in the Supply chain
sustainability. This F statistic =360.83; larger than 2 and significant at α<0.000) at 95%
confidence level implies that demand driven approached have a significant effect on sustainable
supply chain. The analysis of the coefficients of demand driven approaches is presented in Table
4.11.
Mode
l R R Square
Adjusted R
Square
Std. Error of
the Estimate
Change Statistics
R Square
Change F Change df1 df2
Sig. F
Change
1 .891a .794 .792 .60088 .794 360.831 3 281 .000
a. Predictors: (Constant), Stock out, Lead Time, Inventory Cost
44
Table 4.11: Analysis of the Coefficients of Demand Driven Approaches
Model
Unstandardized
Coefficients
Standardized
Coefficients
t Sig. B Std. Error Beta
1 (Constant) 1.218 .166 7.354 .000
Stock out -0.428 .102 -0.164 -4.179 .000
Lead Time 1.188 .093 0.609 12.790 .000
Inventory cost 0.601 .048 0.468 12.414 .000
a. Dependent Variable: Sustainable supply chain
After the multiple regression analysis, the model established was:
Sustainable Supply Chain = 1.218 – 0.164X1 + 0.609X2 + 0.468X3 + ε
The multiple regression model established a beta constant of 1.218. This implies that a unit
deviation in demand driven approached would lead to a 1.218 unit deviation in sustainable
supply chain.
Stock-out has a significant effect on sustainable supply chain (β= -0.164, α=0.000<0.05). This
statistically implies that a unit deviation in stock out would lead to -0.164-unit standard deviation
in sustainable supply chain. Ideally if there was going to be an increase in stock out, this would
lead to a decrease in sustainable supply chain. The hypothesis that stock out has no significant
effect on sustainable supply chain was therefore rejected.
Lead time was established to be having a significant effect on Sustainable Supply Chain
(β=0.609; α = 0.01<0.05). This implies that a unit deviation in lead time would lead to a 0.609
standard unit deviation in sustainable supply chain. Ideally this implies that an increase in lead
time would translate lead to an enhance sustainable supply chain. The hypothesis that lead time
has no significant effect on sustainable supply chain was therefore rejected.
45
Inventory cost has a significant effect on sustainable supply chain (β=0.468, α =0.000<0.05).
This implies that a unit deviation in inventory cost would lead to 0.468 standard unit deviation in
sustainable supply chain. Practically this implies that an increase in inventory cost would lead to
an increase in sustainable supply chain. The hypothesis that inventory cost has no significant
effect on sustainable chain was therefore rejected.
These findings give credence to adoption of inadequate customer service expectations, demand
uncertainty, and the flexibility of the supply chain (Ballou, 2004) by the organization. This
finding seems to go against the demands of Agile theory which argues for responding quickly to
short-term changes in demand or supply and ensure that the company handles external
disruptions smoothly (Lee, 2004). Wilson (2004) urges for careful analysis to identify an
economic order quantity (EOQ), being the quantity of an item that should be regularly ordered,
so as to minimize total cost of ordering and holding cost.
46
CHAPTER FIVE: SUMMARY OF FINDINGS, CONCLUSIONS AND
RECOMMENDATIONS
This chapter presents a summary of the findings of the study, conclusions and recommendations.
The researcher also suggests other areas for further studies based on the study findings.
5.1 Summary of the findings
The general objective of this study was to examine the effect of demand driven approaches on
sustainable supply chain in the County of Homa Bay. The demand driven approaches assessed
were stock out, inventory cost, and lead time. The study found that the sampled employees
disagreed that stock out as practiced at the county affect sustainable supply. However, inventory
cost and lead time were found to affect sustainable supply chain to neither a small extent nor a
large extent.
Similarly, all the demand driven approaches examined were found to have a positive relationship
with sustainable supply chain. A high and positive significant relationship was found with all of
the independent variables; lead time (.816**), inventory cost (.811**), and stock out (.508**) all
significant at the 0.01 level (2-tailed).
Stepwise multiple regression analysis to examine the effects of the potential predictors (demand
driven approaches) on sustainable supply chain in Homa Bay County was also done. It revealed
that stock out, lead time, as well as inventory cost all together predicted about 79% of the
observed variance in sustainable supply chain, with a significant model fitting (F=360.83;
p<0.000).
Model fitting predicted that the most important demand driven approach in determining
sustainable supply chain was lead time (Beta=0.609; p<0.01). It was also established that
47
inventory cost was significantly critical in predicting sustainable supply chain (Beta=0.468;
p<0.01). However, stock out (Beta= -.164; p<0.01) as practiced at the county was found not to be
significant in predicting sustainable supply chain.
5.2 Conclusion
From the objectives, it is concluded that demand driven approaches have effect on sustainable
supply chain in the county. On the results of the first objective, it is concluded that stock out
approaches as practiced is not positively associated with sustainable supply chain in the county.
Based on the results of the second objective, it is concluded that lead time has significant
positively relationship with sustainable supply chain in the company. Similarly, concerning the
third objective, inventory cost and sustainable supply chain was found to have strong positive
relationships.
5.3 Recommendations for Improving Sustainable Supply Chain
The study found out that stock out approaches as practiced at the county do not lead to
sustainable supply chain. To aid in the attainment of sustainable supply chain, it is recommended
that inventory management at the county be enhanced to adapt quickly to changes in the supply
chain environment. To this end, appropriate sharing of information between internal users and
suppliers need to be adopted.
Lead time approaches as practiced at the county was found to have affected sustainable supply
chain. For further improvement in sustainable supply chain, it is recommended that the county
need to adopt e procurement. This would enable Efficient Customer Response (ECR) designed to
integrate and rationalize product assortment, promotion, new product development and
replenishment across the supply chain.
48
Inventory cost, being the costs associated with keeping of stock or storage, is found to be
significant in predicting sustainable supply chain at the county. To practice this kind of approach
so that it enhances sustainable supply chain, it is recommended that information technology that
employs virtual reality be adopted so that acquisition as well as placement costs can be
appropriately minimized.
5.4 Recommendation for Further Research
The researcher recommends that further research be done in the following areas: The effects of
stock-out costs approach on sustainable supply chain at the County Government of Kisumu.
The effect of lead time approaches on the performance of supply chain department at the County
Government of Kisumu.
49
REFERENCE
Arnheiter, E.D. & Maleyeff, J. (2005). The integration of lean management and six sigma. The
TQM Magazine, 17(1), 5- 18.
Carter, J., & Narasimhan, R. (1996). Purchasing and Supply Chain Management: Future
Directions and Trends. International Journal of Purchasing & Materials Management
32. 2, 2.
Chopra, S., & Meindl, P. (2015).Supply Chain Management: Strategy, Planning, and Operation
(6th Edition.). New Jersey: Prentice Hall.
Cooper, D. R., & Schindler, P. S. (2001). Business Research Methods. New York: McGraw Hill
International Edition.
Davis, T. (1993). Effective Supply Chain Management. Sloan Management Review vol 34 no4,
35-46.
Davis, M.M., & Heineke, J. (2005). Operation Management: Integrating Manufacturing and
Services, (5th Edition). New York: McGraw Hill.
Doyle, P., & Stern, P. (2006). Marketing Management and Strategy, (4th Edition) New Jersey:
Prentice Hall
Fisher, M. (1997). What is the Right Supply Chain For your Product. Harvard Business Review
75 (2), 105-116.
Frohlich, M.T. & Westbrook, R. (2001). Arcs of Integration: An International Study of Supply
Chain Strategies. Journal of Operations Management, 19(2), 185-200.
Gunasekaran, A., Patel, C., & McGaughey, R.E. (2004). A framework for supply chain
performance measurement. International Journal of Production Economics, 87(3), 333-
347.
Harrison, A. & Van Hork, R. (2011). Logistics Management and Strategy: Competing through
the Supply Chain, (4th Edition) New Jersey: Prentice -Hall.
50
Holweg, M. (2007). The genealogy of lean production. Journal of Operations Management,
25(2), 420-437.
Ivanov, D. (2010). An adaptive framework for aligning (re)planning decisions on supply chain
strategy, design, tactics, and operations. International Journal of Production Research
Vol. 48, No. 13, 3999–4017.
Kim, S.W., & Narasimhan, R. (2002). Information system utilization in supply chain integration
efforts. International Journal of Production Research, 40(18), 4585 - 4609.
Kwon, I.G., & Suh, T. (2004). Factors affecting the level of trust and commitment in supply
chain relationships. Journal of Supply Chain Management, 40(2), 4–14
Kothari, C.R. (2012). Research Methodology Methods and Techniques. New Delhi: Age
International Publishers.
Krajewski, L.J., Ritzman, L.P., & Malhotra, M.K. (2009). Operations Management, (9th
Edition). New Jersey: Prentice Hall.
Lambert, D. M., Stock, J. R., & Ellram, L. M. (1998). Fundamentals of Logistics Management.
Boston, M.A: Irwin/ McGraw- Hill.
Lambert, D., & Terrance, L. (2001). Supply Chain Metrics. International Journal of Logistics
Management 9.2, 1-19
Lee, C., Kwon, I.-W., & Severance, D. (2007). Relationship between supply chain performance
and degree of linkage among supplier, internal integration and customer. Supply Chain
Management: An International Journal 12/6, 444-452.
Lummus, R. R., Duclos, L. K., & Vokurka, R. J. (2003). Supply Chain Flexibility: Building a
New Model. Global Journal of Flexible Systems Management, 4(4), 1-13.
Lysons, K., & Farrington, B. (2012). Purchasing and Supply Chain Management, (8th Edition).
Pearson Harlow: CIPS Textbook.
Manrodt, K.B., Abott, J., & Vitasek, K. (2008). Lean practices in the supply chain. Report on
Lean Practices in the Supply Chain, APICS. Retrieved from www.apics.org.
51
Mentzer, J.T. (2004). Fundamentals of Supply Chain Management: Twelve Drivers for
Competitive Advantage. Thousand Oaks, CA: Sage Publications, Inc.
Nuthall, L. (2003). Supply Chain Performance Measures and Systems. Journal of Logistics, 248-
66.
O'Marah, K. (2015, March 6). SCM World? Retrieved from www.Forbes.Com .
Osagie, S. (2015, April 6). SCM in 2015 & Beyond. SCM Review Magazine
Narasimhan, Jayaram, & Carter, (2001). An empirical investigation of supply chain strategy
typologies and relationships to performance. International Journal of Production
Research, 5231-5259.
Orodho, A. J. (2003). Essentials of Educational and Social Sciences Research Method, Nairobi:
Masola Publishers.
Pagell, M. (2004). Understanding the factors that enable and inhibit the integration of
Operations, Purchasing and Logistics. Journal of Operations Management, 22(5), 459–
487.
Porter, M. (2008) Competitive Strategy. New York: Free Press.
Power, D. (2005). Supply chain management integration and implementation: A literature
review. Supply Chain Management, 10(3), 252–263.
Quinn, F. (1997). What is the Buzz? Logistics Management 36.2, 43-46.
Rao, S. S. (2002). Making enterprises Internet ready: E-business for process Industries: Work
Study, 51(4), 248-253.
Sekaran, U. (2003). Research Methods for Business: A skill building approach 4th Edition. New
York: Hermitage Publishing Services
Simatupang, T. M., & Sridharan, R. (2005). The collaboration index: A measure for supply chain
collaboration. International Journal of Physical Distribution & Logistics Management,
35(1), 44-62.
52
Simchi-Levi, D., Kaminsky, P., & Simchi-Levi, E. (2009). Designing and Managing the Supply
Chain: Concepts, Strategies and Case Studies (3rd edition). New York: McGraw-Hill.
Skjøtt‐Larsen, T., Schary, P., Mikkola, J.H. & Kotzab, H. (2007). Managing the Global Supply
Chain. (3rd Edition), Copenhagen: Copenhagen Business School Press.
Stadtler, H., & Kilger, C. (2008). Supply Chain Management and Advanced Planning:
Concepts, Models, Software and Case Studies, (4th Edition).Berlin: Springer.
Womack, J. P. & Jones D. T. (2003). Lean thinking, (2nd Edition) London: Free Press Business
Yu, Z., Yan, H., Cheng, T.C. (2001). Benefits of information sharing with supply chain
partnerships. Industrial Management & Data Systems, 101(3), 114- 119.
Yusuf, Y.Y., Gunasekaran, A., Adeleye, E.O. & Sivayoganathan, K. (2004). Agile Supply Chain
Capabilities: Determinants of Competitive Objectives, European Journal Of operational
Research, 159(2), 379-392
Zikmund, W. & Babin, J. (2003). Exploring Marketing Research (9th Edition.): USA:
Thompson-South Western.
53
APPENDICES
APPENDIX I: LETTER OF INTRODUCTION
Dear Respondent
My name is Michael Okeyo Suna. I am a student of Maseno University pursuing a Master of
Supply Chain Management Degree. Am carrying out a research project titled: the effects of
demand driven approaches on sustainable supply chain: A Case of Homa-Bay County
Government. You have been selected to participate in this survey to obtain your perception and
views on the same. Your honest response in answering the questions will assist in establishing
the effects of demand driven approaches on sustainable supply chain: A Case of Homa-Bay
County Government. The information obtained from this exercise shall only be used for the
purpose of research and shall be treated with utmost confidentiality.
Thanking you in advance
_______________________
MICHAEL OKEYO SUNA
Maseno University
54
APPENDIX II: QUESTIONAIRE
Dear Respondent
Kindly fill this questionnaire. Information obtained from the study will be treated with utmost
confidentiality and strictly used for academic purposes only. Your cooperation will be highly
appreciated. Please answer the questions as objective as possible as your contributions will be
highly valuable to this study. You are kindly requested not to write your name on the
questionnaire.
Tick or write answers in full where applicable.
SECTION A: DEMOGRAPHIC DISTRIBUTION OF RESPONDENTS (please tick as
appropriate)
Respondents Profile:
1 Gender
Male [ ]
Female [ ]
2 Level of education
Primary [ ]
Secondary [ ]
University [ ] Undergraduate [ ] Postgraduate[ ]
Others (specify)....................................................................................................
3 Number of Years Worked In the Procurement Department
0- 1 year [ ]
1-5 years [ ]
6- 10 years [ ]
Above 10 years [ ]
55
SECTION B: Indicators of Sustainable Supply Chain
Kindly rate the extent to which you agree with the following information regarding stock out and
sustainable supply chain at the department.
Key: 5- Strongly agree 4- Agree 3- undecided 2- Disagree 1- Strongly disagree
5 4 3 2 1
1 Reduction in process cost
2 Improvement in responsiveness
3 Facilitate Decision making
4 Improvement in Relationship with Trading Partners
5 Reduction in Cycle times
6 Reduced Delivery on incorrect Items
SECTION C: Stock – Out on Supply Chain
Kindly rate the extent to which you agree with the following information regarding stock out and
sustainable supply chain at the department.
Key: 5- Strongly agree 4- Agree 3- undecided 2- Disagree 1- Strongly disagree
5 4 3 2 1
Stock is checked and updated
Reporting tools are used in stock validation
Large stock are maintained
Monitoring and oversight mechanism is necessary for stock outs and
sustainable supply chain
Staff qualification is necessary for stock outs and sustainable supply
chain
56
SECTION D: Lead time on Supply Chain
Kindly rate the extent to which you agree with the following information.
Key: 5- Strongly agree 4- Agree 3- undecided 2- Disagree 1- Strongly disagree
5 4 3 2 1
The County procurement department order cycle time is very short
There is strict adherence to order planning schedule
The County procurement department has a lower lead time relative
to the industry norm
The County procurement department order scheduling techniques
are very effective
The County procurement department experience a minimum number
of faultless notes invoiced
SECTION E: Inventory Cost on Supply Chain
Kindly rate the extent to which you agree with the following information.
Key: 5- Strongly agree 4- Agree 3- undecided 2- Disagree 1- Strongly disagree
Application of Economic Order Quantity helps improve
organizational supply chain performance by way of quantities
required and when they are required.
5 4 3 2 1
Activity Based Costing (ABC) analysis application necessitates
organizations to attain optimal supply chain performance.
Inventory planning helps organizations achieve optimal supply chain
performance in simulation both financially and on service delivery.
Vendor management inventory system eases management’s work for
inventory replenishment.
Lack of inventory management techniques has contributed to poor
supply chain performance.
57
APPENDIX III: WORK PLAN
ACTIVITY DEC
2017
DEC
2017
DEC
2017
JAN
2018
JAN
2018
FEB
2018
MAR
2018
APR
2018
MAY
2018
Considering
the best
approach
towards
chosen study
project.
Stating study
problem and
determining
research
design.
Defending the
proposal
Data
collection
piloting
Data
collection
Writing and
Presentation
of Research
findings(1st
draft)
Writing the
final draft
Presenting of
the Final draft
58
APPENDIX 1V: RESEARCH BUDGET
ITEM QUANTITY UNIT COST Ksh TOTAL-AMOUNT
Ksh
STATIONERY
-Photocopying 400 copies 3 1,200
-Foolscaps 2 rims 300 600
-Pencils 10 pieces 25 250
-Rubbers 10 pieces 20 200
-Printing 5 copies@100 10 5, 000
TRAINING 4 day 300x4 people 4, 800
ALLOWANCES (Research
assistants)
4x7 days 3,000 84,000
DATA ANALYSIS - - 30,000
DISSEMINATION - - -
Binding copies 5 60 300
TOTAL 126 350
CONTIGENCY 12, 635
GRANT TOTAL 138, 985
59
APPENDIX V: MAP OF HOMA-BAY COUNTY
Source: (Google Maps, 2018)