Page 1
Int. J. Electrochem. Sci., 16 (2021) 151044, doi: 10.20964/2021.01.57
International Journal of
ELECTROCHEMICAL SCIENCE
www.electrochemsci.org
Effect of Deposition Potential on the Mechanism and Corrosion
Behavior of Zn-Fe-Co Thin Coatings Electrochemically
Deposited on a Steel Substrate
Arafat Toghan1,2,*, M. M. Abou-krisha1,2, F. H. Assaf 1, F. El-Sheref1
1 Chemistry Department, Faculty of Science, South Valley University, Qena 83523, Egypt 2 Chemistry Department, College of Science, Imam Mohammad Ibn Saud Islamic University (IMSIU),
Riyadh 11623, Saudi Arabia *E-mail: [email protected]
Received: 16 September 2020 / Accepted: 31 October 2020 / Published: 30 November 2020
Herein, the effect of deposition voltage on the chemical composition, corrosion resistance, structure
and surface properties of Zn-Fe-Co coatings was explored using potentiostatic measurements, cyclic
voltammetry, linear sweep voltammetry, anodic linear polarization, atomic absorption spectroscopy,
scanning electron microscope, and X- ray diffraction. The results indicated that the corrosion
resistance is directly related to Co and Fe contents in Zn-Fe-Co deposits. A significant increase in the
quantities, contents and efficiency of zinc was achieved by increasing the deposition voltage which led
to a sharp decrease the polarization resistance of the coated alloys. This is due to the ease of
dissolution of zinc compared to Co and Fe. Moreover, Zn-Fe-Co coatings with a high content of cobalt
up to 37% possess superior corrosion resistance compared to the pure Zn coatings and Zn-Fe-Co
coatings with low values of cobalt contents less than 6%. A mechanism for electrodeposition model
has been proposed and discussed.
Keywords: Electrodeposition; thin coatings; Zn-Fe-Co alloy; competitive adsorption;
characterizations; mechanism
1. INTRODUCTION
The development and use of steel is witnessing a continuous technological revolution as it is
used in many industrial applications as well as in construction and shipbuilding, cars, machines,
equipment and others. However, as is well known, it faces a serious corrosion problem especially in an
acidic environment. No one can deny the scientist's outstanding efforts to solve this problem a long
time ago using many different techniques and possibilities. One possibility is to coat the steel surface
Page 2
Int. J. Electrochem. Sci., Vol. 16, 2021
2
with a protective film using a variety of processes such as electroplating, magnetron sputtering,
thermal spraying, pulse laser deposition, and chemical vapor deposition [1-7].
An alternative possibility is to use organic corrosion inhibitors [8-10]. Among all these
technologies, electrochemical deposition is a highly effective method due to cost savings, energy
saving, no need to use toxic reagents, and the thickness, structures, particle sizes and shapes of the
deposited film that can be controlled by simply changing experimental conditions such as
electroplating bath composition, temperature, concentration, deposition time, pH of solution as well as
the applied voltage or current.
In particular, the electroplating of zinc-metal alloy on the steel surface has great benefits
against corrosion problems [11-15]. Although the fabrication of zinc alloys with other metals,
especially transition metals such as Ni, Cu, Fe, Mn, and Co can reduce the rate of dissolution of steel,
but the corrosion stability and durability of these binary alloys is still insufficient to complete its
protection. Recently, the incorporation of a third metal into the protective film to form triple alloys
such as Zn-Ni-Co, Zn-Co-Fe, Zn-Ni-Mn and Zn-Fe-Co has significantly enhanced steel corrosion
resistance [17-22]. It is well known that Zn-M alloys obey the abnormal codeposition type, preferring
zinc deposition first because it is a less noble metal compared to other noble metals associated with the
fabrication of alloys such as Cu, Ni, Co and Fe which may give them a unique characteristic, and
therefore their alloys have attracted great interest recently.
Deposition potential is one of the most important variables in the electrochemical deposition
process, which is directly related to economic efficiency, film properties as well as the chemical
structure, composition, corrosion performance and alloy quality [23, 24]. From this standpoint, the
present work aims to study the effect of setting the working electrode (steel substrate) at different
constant deposition voltages in sulfate bath containing Zn2+, Fe2+ and Co2+ species at room
temperature. Based on the results obtained, the optimum range of deposition potentials that provide the
best corrosion resistance for this type of alloy will be discussed on the steel substrate as well as
electrodeposition mechanisms.
2. EXPERIMENTAL
All electrochemical experiments were conducted in a 100.0 cm3 electrochemical cell with a 3-
electrodes set up. The working electrode (cathode) consists of a steel rod (type 9021I, 99.98% Fe) that
has been mechanically machined and mounted in Teflon. Thus, only an area of 0.196 cm2 cross-section
is exposed to the experiment solution. This type has been used for potentiostatic current-time
measurements, cyclic voltammetry (CV), anodic linear sweep voltammetry and anodic linear
polarization experiments. Whereas, a 304 stainless-steel sheet (0.08% C, 17.5–20 % Cr, 8–11% Ni, 2%
Mn, 1% Si, 0.045% P, 0.03% S, and balance Fe) has dimensions of 1.0 cm x 1.0 cm x 0.05 cm was
used as a second type of working electrode for chemical analysis experiments of electrodeposited thin
coatings, i.e. to determine the contents of Zn, Co and Fe. A platinum-rod (6.0 cm2) was used as an
auxiliary electrode, and saturated calomel electrode (SCE) as a reference electrode.
Page 3
Int. J. Electrochem. Sci., Vol. 16, 2021
3
All experiments have been carried out in duplicate and at 25oC and showed good
reproducibility. For a standard bath deposition, a series of electrodeposition experiments on stainless
steel sheets, at different duration were carried out and the relative standard deviation (RSD%) was
found to be 2.5%, 4.3% and 3.2% for the Zn, Fe and Co contents in the deposit, respectively.
EG&G potentiostat\galvanostat (model 237A) controlled by a computer (using corrosion
program 352) was used to perform all the experiments. Analar chemicals were used, without further
refinement, to prepare all solutions using double distilled water. The electroplating sulfate bath, which
is used for the preparation of Zn-Fe-Co thin Coatings on steel and stainless steel substrates, has a
chemical composition: 0.20 M FeSO4, 0.20 M CoSO4, 0.20 M ZnSO4, 0.20 M Na2SO4, 0.01 M H2SO4
and 0.20 M H3BO3 [15]. The pH of the solution was adjusted by adding few drops of dilute sulfuric
acid until a pH of 2.5 was obtained [10]. To study the corrosion resistance of the electrically deposited
Zn-Fe-Co layer on the steel surface, anodized linear polarization method (ALP), also called Tafel plot,
was applied in 0.05 M HCl as a corrosive medium. The steel coated was washed with distilled water
and then transferred to an electrochemical cell containing 100 cm3 of 0.05 M HCl, accordingly. The
corresponding electrochemical corrosion potential (Ecorr) is therefore obtained for each thin coating
(see Table 1).
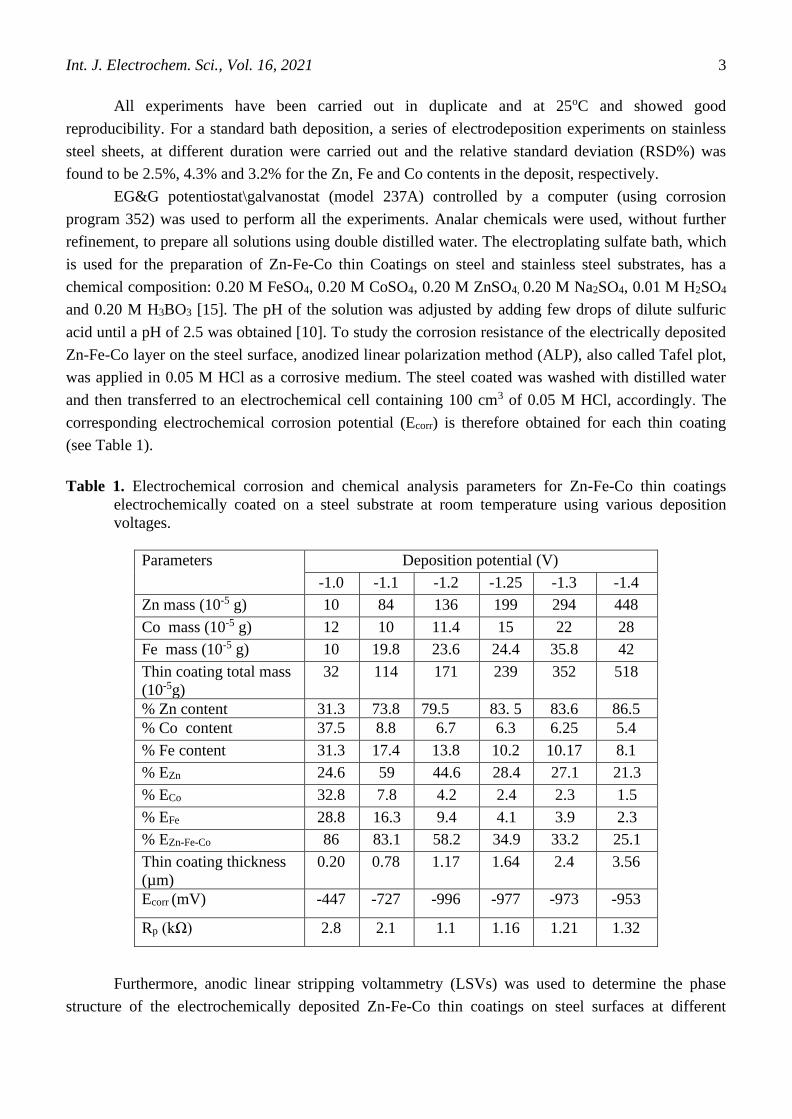
Table 1. Electrochemical corrosion and chemical analysis parameters for Zn-Fe-Co thin coatings
electrochemically coated on a steel substrate at room temperature using various deposition
voltages.
Parameters Deposition potential (V)
-1.0 -1.1 -1.2 -1.25 -1.3 -1.4
Zn mass (10-5 g) 10 84 136 199 294 448
Co mass (10-5 g) 12 10 11.4 15 22 28
Fe mass (10-5 g) 10 19.8 23.6 24.4 35.8 42
Thin coating total mass
(10-5g)
32 114 171 239 352 518
% Zn content 31.3 73.8 79.5 83. 5 83.6 86.5
% Co content 37.5 8.8 6.7 6.3 6.25 5.4
% Fe content 31.3 17.4 13.8 10.2 10.17 8.1
% EZn 24.6 59 44.6 28.4 27.1 21.3
% ECo 32.8 7.8 4.2 2.4 2.3 1.5
% EFe 28.8 16.3 9.4 4.1 3.9 2.3
% EZn-Fe-Co 86 83.1 58.2 34.9 33.2 25.1
Thin coating thickness
(µm)
0.20 0.78 1.17 1.64 2.4 3.56
Ecorr (mV) -447 -727 -996 -977 -973 -953
Rp (kΩ) 2.8 2.1 1.1 1.16 1.21 1.32
Furthermore, anodic linear stripping voltammetry (LSVs) was used to determine the phase
structure of the electrochemically deposited Zn-Fe-Co thin coatings on steel surfaces at different
Page 4
Int. J. Electrochem. Sci., Vol. 16, 2021
4
deposition potentials. The stripping voltammogram experiments were recorded in a solution containing
0.5 M Na2SO4 and 0.05 M EDTA. Using a slow sweep rate of 5 mV s-1, a wide-range of anodic
voltage from -1.2 to +0.4 V was applied (all vs. SCE) at room temperature. In order to obtain more
information about the kinetics of electrochemical deposition/dissolution process, cyclic voltammetry
(CV) was performed in a sulfate electroplating bath containing pure Zn2+, pure Co2+, pure Fe2+ and a
combination of the three ions. CVs were performed in a potential window from + 0.4 to -1.3 V (vs.
SCE) with a scan rate of 5 mV s-1 at room temperature.
Atomic Absorption Spectroscopy (AAS, Variian spectr AA 55) and Energy Dispersive X-ray
Spectrometer (EDX, Isis® link software and X-ray detector 6587 model, Oxford, England) were used
to analyze the electrochemically coated Zn-Fe-Co film on stainless-steel substrates, i.e. to determine
the contents of Zn, Co and Fe. Therefore, for the analysis of AAS, the film was first washed with
double distilled water, then left to dissolve in a beaker containing 50 cm3 of HCl (20%). After
confirming that it was completely dissolved, its contents were diluted with double distilled water in a
100 cm3 volumetric flask. Thus, the total deposit mass, Zn %, Co %, Fe %, and current efficiencies and
thickness of thin coatings were calculated [25]. A blank experiment was also performed as a
preliminary step using a pure stainless steel substrate (i.e. without Zn-Fe-Co thin coating) immersed in
a 20 % HCl solution. AAS analysis confirmed that there was no contribution of stainless steel to the
content of Fe (Fe %). Scanning Electron Microscope (SEM, equipped with EDX, model JSM-5500 LV
(JEOL, Japan) was used to inspect the surface morphology of coated thin coatings. The crystalline
constituents as well as particle size of the coatings were analyzed by XRD model Bruker Axs-D8
Advance with Cu Ka radiation (k= 1.5406 A˚ and 40 mA).
3. RESULTS AND DISCUSSION
(a)
0 2 4 6 8 10
-80
-70
-60
-50
-40
-30
-20
-10
0
i /
mA
cm
-2 -0.60 V
-0.90 V
-1.00 V
-1.10 V
-1.20 V
-1.25 V
-1.30 V
-1.40 V
time / min
(a)
0 2 4 6 8 10
-80
-70
-60
-50
-40
-30
-20
-10
0
i /
mA
cm
-2 -0.60 V
-0.90 V
-1.00 V
-1.10 V
-1.20 V
-1.25 V
-1.30 V
-1.40 V
time / min
Page 5
Int. J. Electrochem. Sci., Vol. 16, 2021
5
-0.6 -0.7 -0.8 -0.9 -1.0 -1.1 -1.2 -1.3 -1.4
0
-10
-20
-30
-40
-50
-60
i
/ m
A c
m-2
Deposition potential / V
A B
(b)
-0.6 -0.7 -0.8 -0.9 -1.0 -1.1 -1.2 -1.3 -1.4
0
-10
-20
-30
-40
-50
-60
i
/ m
A c
m-2
Deposition potential / V
A B
(b)
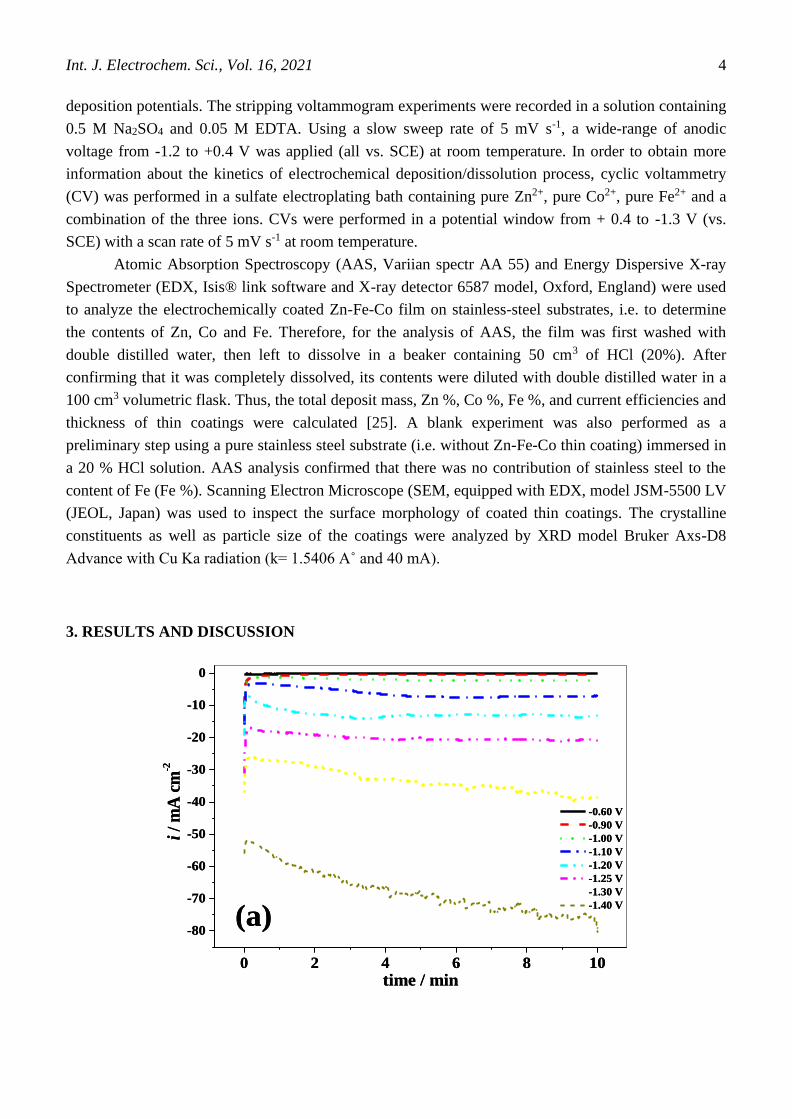
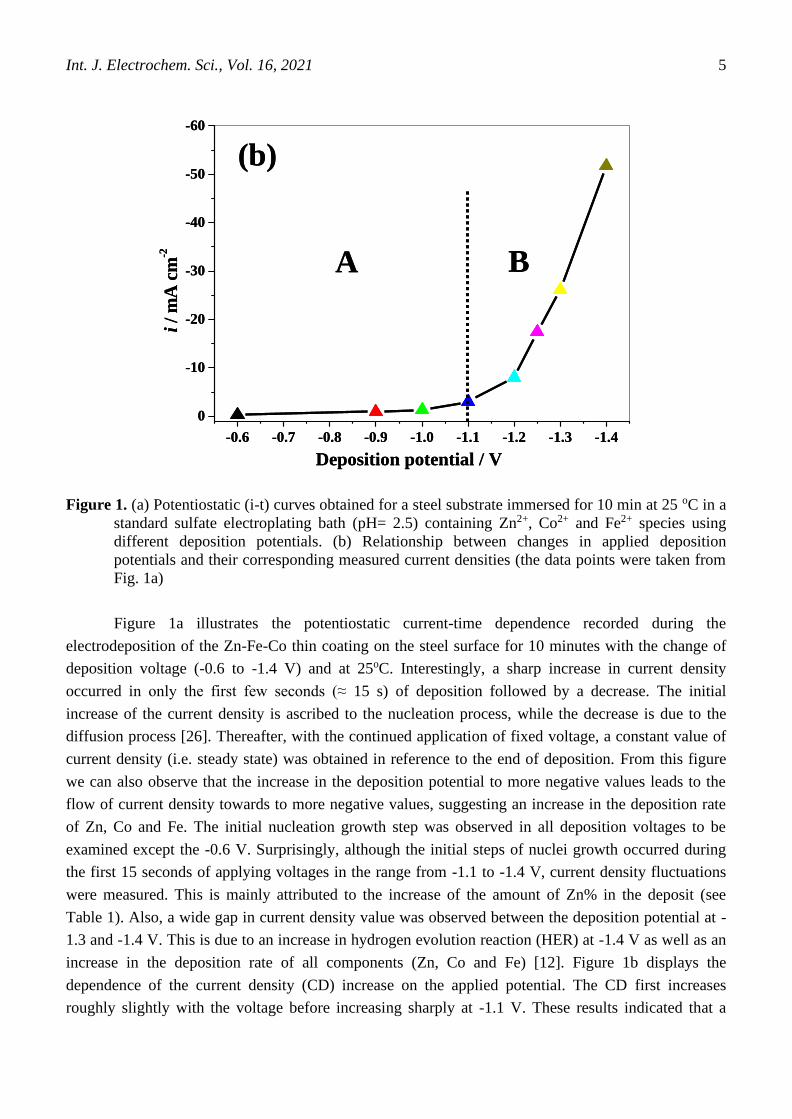
Figure 1. (a) Potentiostatic (i-t) curves obtained for a steel substrate immersed for 10 min at 25 oC in a
standard sulfate electroplating bath (pH= 2.5) containing Zn2+, Co2+ and Fe2+ species using
different deposition potentials. (b) Relationship between changes in applied deposition
potentials and their corresponding measured current densities (the data points were taken from
Fig. 1a)
Figure 1a illustrates the potentiostatic current-time dependence recorded during the
electrodeposition of the Zn-Fe-Co thin coating on the steel surface for 10 minutes with the change of
deposition voltage (-0.6 to -1.4 V) and at 25oC. Interestingly, a sharp increase in current density
occurred in only the first few seconds (≈ 15 s) of deposition followed by a decrease. The initial
increase of the current density is ascribed to the nucleation process, while the decrease is due to the
diffusion process [26]. Thereafter, with the continued application of fixed voltage, a constant value of
current density (i.e. steady state) was obtained in reference to the end of deposition. From this figure
we can also observe that the increase in the deposition potential to more negative values leads to the
flow of current density towards to more negative values, suggesting an increase in the deposition rate
of Zn, Co and Fe. The initial nucleation growth step was observed in all deposition voltages to be
examined except the -0.6 V. Surprisingly, although the initial steps of nuclei growth occurred during
the first 15 seconds of applying voltages in the range from -1.1 to -1.4 V, current density fluctuations
were measured. This is mainly attributed to the increase of the amount of Zn% in the deposit (see
Table 1). Also, a wide gap in current density value was observed between the deposition potential at -
1.3 and -1.4 V. This is due to an increase in hydrogen evolution reaction (HER) at -1.4 V as well as an
increase in the deposition rate of all components (Zn, Co and Fe) [12]. Figure 1b displays the
dependence of the current density (CD) increase on the applied potential. The CD first increases
roughly slightly with the voltage before increasing sharply at -1.1 V. These results indicated that a
Page 6
Int. J. Electrochem. Sci., Vol. 16, 2021
6
regular co-deposition of Zn-Fe-Co alloy (part A), i.e. cobalt and iron deposited preferentially
compared to zinc, at potential < -1.1 V and abnormal co-deposition of Zn-Fe-Co (part B), i.e.
preferential deposition of less noble metal zinc, at value > -1.1 V obtained [27].
-1.0 -1.1 -1.2 -1.3 -1.40
10
20
30
40
50
60
70
80
90
Deposition potential / V
Com
posi
tion
(%
) % Zn
% Co
% Fe
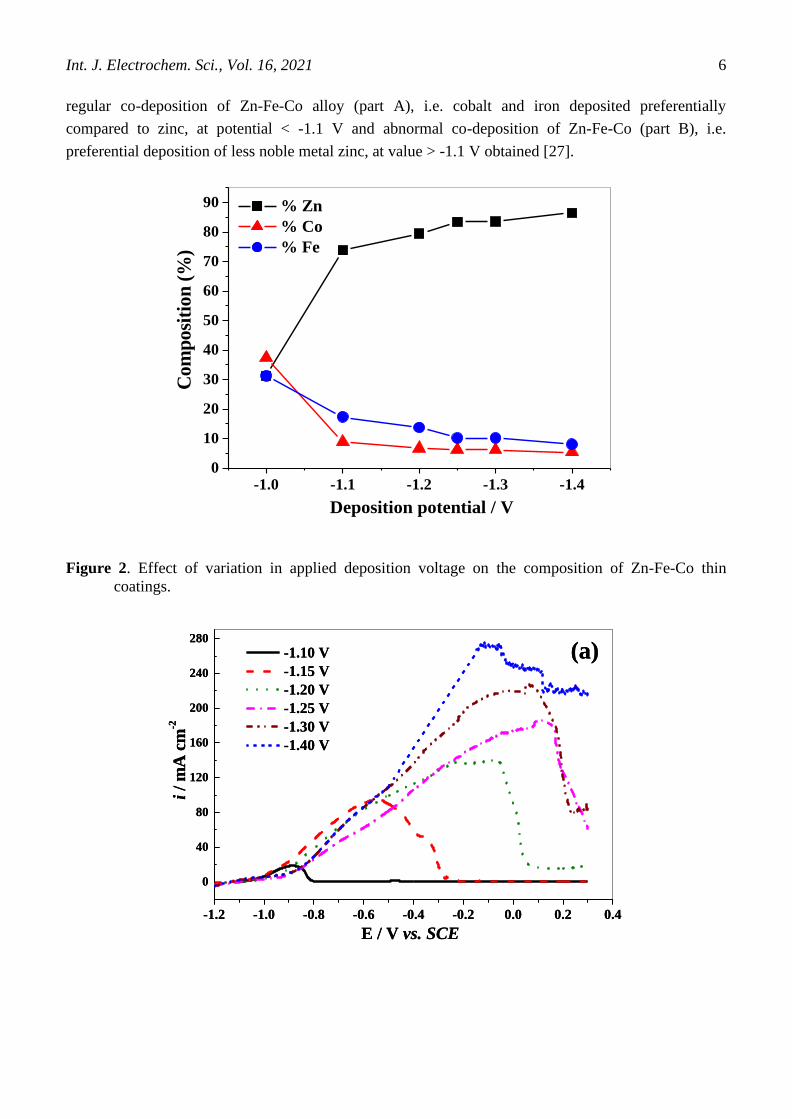
Figure 2. Effect of variation in applied deposition voltage on the composition of Zn-Fe-Co thin
coatings.
-1.2 -1.0 -0.8 -0.6 -0.4 -0.2 0.0 0.2 0.4
0
40
80
120
160
200
240
280
i
/ m
A c
m-2
E / V vs. SCE
-1.10 V
-1.15 V
-1.20 V
-1.25 V
-1.30 V
-1.40 V
(a)
-1.2 -1.0 -0.8 -0.6 -0.4 -0.2 0.0 0.2 0.4
0
40
80
120
160
200
240
280
i
/ m
A c
m-2
E / V vs. SCE
-1.10 V
-1.15 V
-1.20 V
-1.25 V
-1.30 V
-1.40 V
(a)
Page 7
Int. J. Electrochem. Sci., Vol. 16, 2021
7
(b)
-1.2 -1.0 -0.8 -0.6 -0.4 -0.2 0.0 0.2 0.4
0
2
4
6
8
10
12
14
16
18
20
E / V vs. SCE
i /
mA
cm
-2
(b)
-1.2 -1.0 -0.8 -0.6 -0.4 -0.2 0.0 0.2 0.4
0
2
4
6
8
10
12
14
16
18
20
E / V vs. SCE
i /
mA
cm
-2
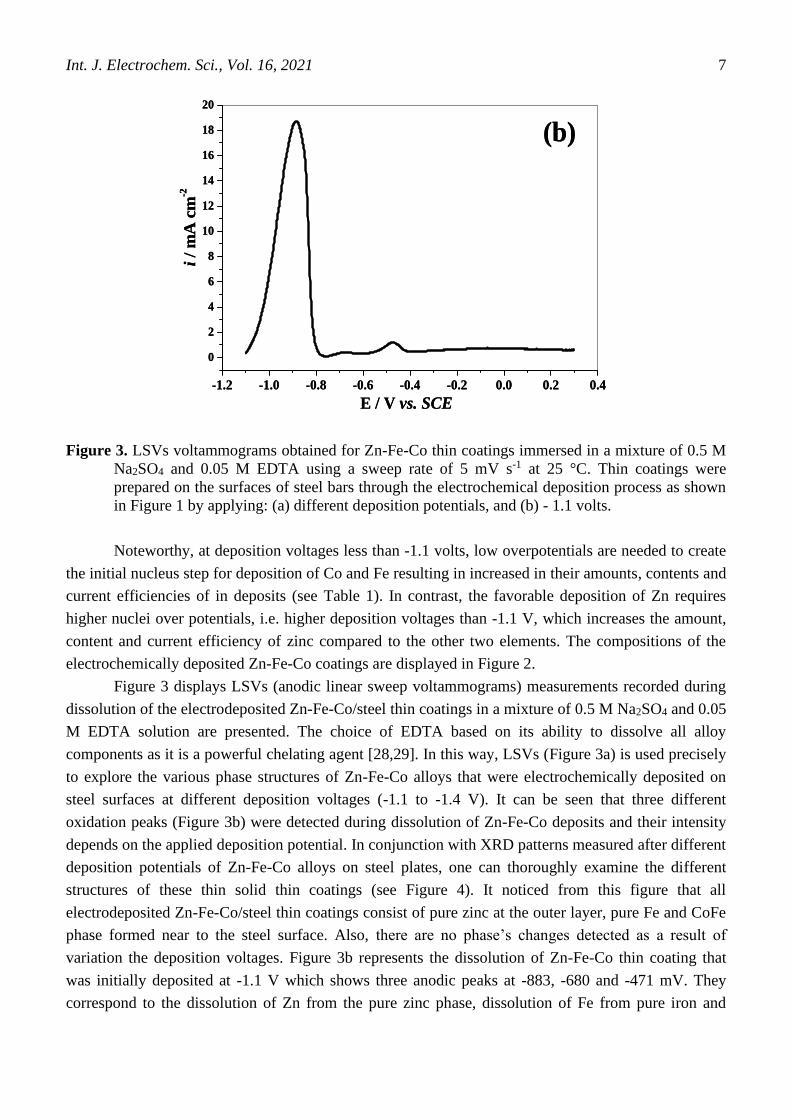
Figure 3. LSVs voltammograms obtained for Zn-Fe-Co thin coatings immersed in a mixture of 0.5 M
Na2SO4 and 0.05 M EDTA using a sweep rate of 5 mV s-1 at 25 °C. Thin coatings were
prepared on the surfaces of steel bars through the electrochemical deposition process as shown
in Figure 1 by applying: (a) different deposition potentials, and (b) - 1.1 volts.
Noteworthy, at deposition voltages less than -1.1 volts, low overpotentials are needed to create
the initial nucleus step for deposition of Co and Fe resulting in increased in their amounts, contents and
current efficiencies of in deposits (see Table 1). In contrast, the favorable deposition of Zn requires
higher nuclei over potentials, i.e. higher deposition voltages than -1.1 V, which increases the amount,
content and current efficiency of zinc compared to the other two elements. The compositions of the
electrochemically deposited Zn-Fe-Co coatings are displayed in Figure 2.
Figure 3 displays LSVs (anodic linear sweep voltammograms) measurements recorded during
dissolution of the electrodeposited Zn-Fe-Co/steel thin coatings in a mixture of 0.5 M Na2SO4 and 0.05
M EDTA solution are presented. The choice of EDTA based on its ability to dissolve all alloy
components as it is a powerful chelating agent [28,29]. In this way, LSVs (Figure 3a) is used precisely
to explore the various phase structures of Zn-Fe-Co alloys that were electrochemically deposited on
steel surfaces at different deposition voltages (-1.1 to -1.4 V). It can be seen that three different
oxidation peaks (Figure 3b) were detected during dissolution of Zn-Fe-Co deposits and their intensity
depends on the applied deposition potential. In conjunction with XRD patterns measured after different
deposition potentials of Zn-Fe-Co alloys on steel plates, one can thoroughly examine the different
structures of these thin solid thin coatings (see Figure 4). It noticed from this figure that all
electrodeposited Zn-Fe-Co/steel thin coatings consist of pure zinc at the outer layer, pure Fe and CoFe
phase formed near to the steel surface. Also, there are no phase’s changes detected as a result of
variation the deposition voltages. Figure 3b represents the dissolution of Zn-Fe-Co thin coating that
was initially deposited at -1.1 V which shows three anodic peaks at -883, -680 and -471 mV. They
correspond to the dissolution of Zn from the pure zinc phase, dissolution of Fe from pure iron and
Page 8
Int. J. Electrochem. Sci., Vol. 16, 2021
8
FeCo phase, and the third anodic dissolution peak comes from the dissolution of Co from FeCo phase,
respectively.
20 30 40 50 60 70 80 90 100
0
200
400
600
800
CoF
e, F
e
CoF
e, F
e
CoF
e, F
e
CoF
e, F
e
Zn
Lin
(co
un
ts)
2 - scale
Zn
(a)
2θ
▪ CoFe,Fe
▫ Zn
Inte
nsi
ty (
a u
)
▪
▫
▪▪
▪
20 30 40 50 60 70 80 90 100
0
200
400
600
800
CoF
e, F
e
CoF
e, F
e
CoF
e, F
e
CoF
e, F
e
Zn
Lin
(co
un
ts)
2 - scale
Zn
20 30 40 50 60 70 80 90 100
0
200
400
600
800
CoF
e, F
e
CoF
e, F
e
CoF
e, F
e
CoF
e, F
e
Zn
Lin
(co
un
ts)
2 - scale
Zn
(a)
2θ
▪ CoFe,Fe
▫ Zn
Inte
nsi
ty (
a u
)
▪
▫
▪▪
▪
30 40 50 60 70 80 90 1000
200
400
600
800
1000
CoF
e , F
e
CoF
e , F
e
CoF
e , F
e
CoF
e , F
e
Lin
(co
un
ts)
2 - scale
Zn
Zn
(b)
2θ
▪ CoFe,Fe
▫ Zn
Inte
nsi
ty (
a u
)
▫
▪
▪▪
▪
30 40 50 60 70 80 90 1000
200
400
600
800
1000
CoF
e , F
e
CoF
e , F
e
CoF
e , F
e
CoF
e , F
e
Lin
(co
un
ts)
2 - scale
Zn
Zn
(b)
2θ
▪ CoFe,Fe
▫ Zn
Inte
nsi
ty (
a u
)
▫
▪
▪▪
▪
Figure 4. XRD patterns for Zn-Fe-Co alloys electrochemically deposited on steel sheets using
different deposition potentials: (a) -1.1 V, and (b) -1.3 V.
Page 9
Int. J. Electrochem. Sci., Vol. 16, 2021
9
-1.2 -1.0 -0.8 -0.6 -0.4 -0.2 0.0
-50
-40
-30
-20
-10
0
10
20
30
40
50
60
E / V vs. SCE
i /
mA
cm
-2
Zn
Co
Fe
Zn-Fe-Co
A1
A2 A3S1
-1.2 -1.0 -0.8 -0.6 -0.4 -0.2 0.0
-50
-40
-30
-20
-10
0
10
20
30
40
50
60
E / V vs. SCE
i /
mA
cm
-2
Zn
Co
Fe
Zn-Fe-Co
A1
A2 A3S1
Figure 5. CVs curves recorded during the electrodeposition of pure Zn, pure Co, pure Fe and Zn-Fe-
Co coatings on a steel substrate using sulfate bath with 0.01 M H2SO4 , 0.20 M Na2SO4, 0.20 M
H3BO3 and 0.20 M ZnSO4 for pure Zn, 0.20 M CoSO4 for pure Co, 0.2 M FeSO4 for pure Fe or
mix of 0.20 M ZnSO4 + 0.20 M CoSO4 + 0.20 M FeSO4 for Zn-Fe-Co coatings with a scan rate
of 5 mV s-1 at 25 °C.
Interestingly, on one hand the observed oxidation in peak dissolution height resulting from
deposition at -1.1 V confirms the small amount of Zn, Co and Fe (see Table 1). On the other hand,
there is a marked increase in the peak dissolution height when the deposition voltages increases (i.e. >
-1.1 V) indicating an increase in the quantities of alloy components. Surprisingly, the current density
did not reach a zero value at higher deposition potentials (from -1.2 to -1.4 V) indicating the
incomplete stripping of the deposited thin coatings due to the significant increase in film thickness (see
Table 1). Furthermore, peak distortions and fluctuations in the current values were observed with
increase in deposition potential, which can be attributed to the increase of HER reaction during Zn-Fe-
Co deposition resulting distortion of the deposited film (Figure 3a). In addition, the anodic peaks shift
to a more positive direction, because of the increase in the amount of the nobler components of the
alloy (i.e., Co and Fe) with increasing the deposition potential giving rise to more improvement of the
corrosion resistance of the deposit.
Figure 5 shows a comparison between the CVs obtained during the deposition/dissolution of
pure Zn, pure Fe, pure Co and Zn- Fe-Co coatings on the steel rod electrode. In the cathodic sweep, a
reduction peak was observed during the electrochemical deposition of pure Co and pure Fe at
potentials -870 and -970 mV; respectively, while, this peak was not seen the case of for pure Zn and
Zn- Fe-Co coatings due to the interference between the deposition potential of zinc and its alloys with
Page 10
Int. J. Electrochem. Sci., Vol. 16, 2021
10
HER reaction [21]. In the anodic scan, an anodic peak was observed at -850, -380 and -113 mV for
dissolution of pure Zn, pure Fe, pure Co; respectively, while anodic dissolution of Zn-Fe-Co coating
shows three oxidation peaks (A1-3) at -936, -634 and -502 mV and also a small shoulder at -844 mV.
The first peak (A1) and the shoulder (S1) arise from the preferential dissolution of Zn from the pure Zn
phase. The second peak (A2) resulting from the anodic dissolution of Fe from pure Fe and Fe from the
FeCo structure formed near to the steel surface, while the third peak (A3) corresponds to the
dissolution of Co from the FeCo phase. The height of A2 and A3 peaks is much smaller than A1,
which can be expected because the contents of Fe and Co in Zn-Fe-Co coating alloys were very low
under these conditions (≈ 6 wt %). Also, obviously the anodic peaks that correspond to the dissolution
of Fe and Co in the Zn-Fe-Co coating strongly turned into more negative potentials of about -250, -400
mV; respectively, compared to the anodic peaks in the case of pure Fe coating and pure Co coating as
a result of formation of the FeCo phase.
-1.1 -1.0 -0.9 -0.8 -0.7 -0.6 -0.5 -0.4
-6.5
-6.0
-5.5
-5.0
-4.5
-4.0
-3.5
-3.0
-2.5
E / V vs. SCE
log i
/ A
cm
-2
-0.60 V
-1.00 V
-1.10 V
-1.15 V
-1.20 V
-1.25 V
-1.30 V
-1.40 V
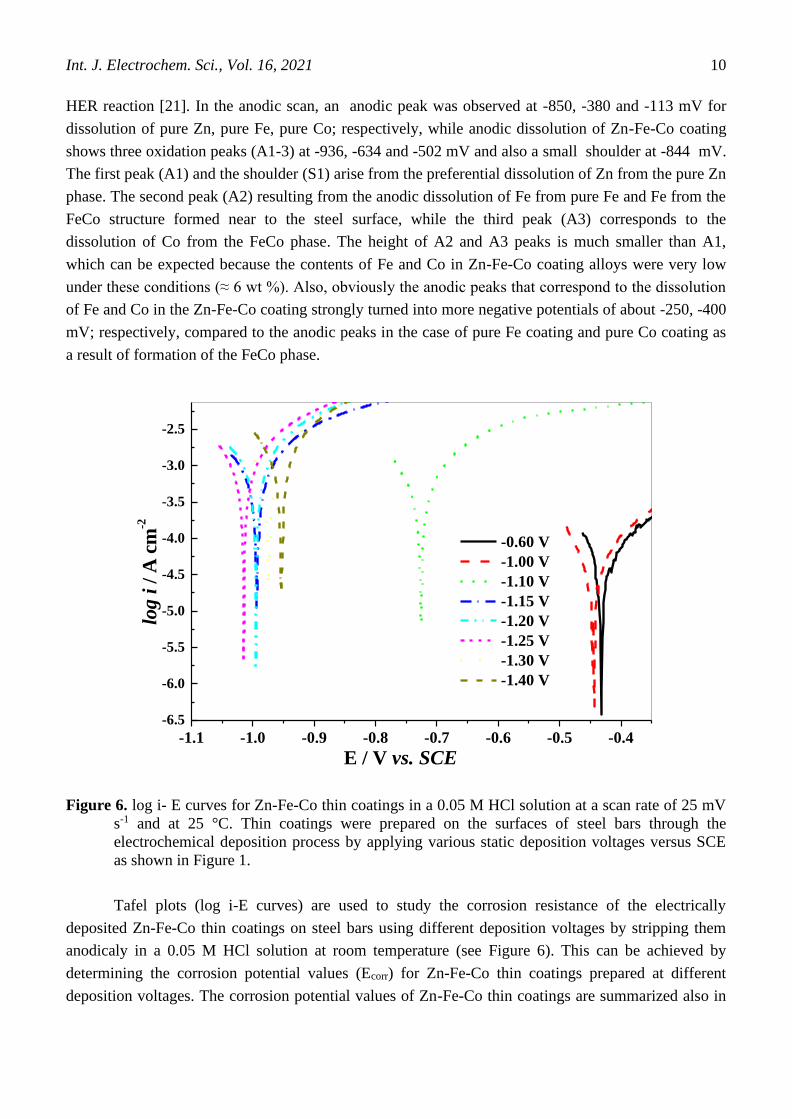
Figure 6. log i- E curves for Zn-Fe-Co thin coatings in a 0.05 M HCl solution at a scan rate of 25 mV
s-1 and at 25 °C. Thin coatings were prepared on the surfaces of steel bars through the
electrochemical deposition process by applying various static deposition voltages versus SCE
as shown in Figure 1.
Tafel plots (log i-E curves) are used to study the corrosion resistance of the electrically
deposited Zn-Fe-Co thin coatings on steel bars using different deposition voltages by stripping them
anodicaly in a 0.05 M HCl solution at room temperature (see Figure 6). This can be achieved by
determining the corrosion potential values (Ecorr) for Zn-Fe-Co thin coatings prepared at different
deposition voltages. The corrosion potential values of Zn-Fe-Co thin coatings are summarized also in
Page 11
Int. J. Electrochem. Sci., Vol. 16, 2021
11
Table 1. It is clear from this figure that the corrosion potential values for thin coatings deposited at low
deposition potentials of – 0.6 and -1.0 V, lie in the most positive direction at - 432.8 mV and - 447
mV, respectively, suggesting high corrosion resistance of these thin coatings due to high contents of
noble metals (%Fe and %Co) in the deposit, i.e. normal co-deposition. Whereas, a remarkable shift in
the corrosion potential value to a more negative direction (-996 mV) for Zn-Fe-Co thin coatings
deposited at higher deposition voltages of -1.2 V, indicating switch from normal to abnormal co-
deposition. Indeed, with abnormal codeposition the amount of zinc contents increases sharply, thus the
polarization resistance decreases from 2.8 to 1.1 kΩ. The results also showed that the Zn-Fe-Co triple
alloy coating which has a high cobalt ratio of up to 37% has superior corrosion resistance compared to
a layer of pure Zn coating or from a triple alloy of Zn-Fe-Co containing a value less than 6% of cobalt
as shown in Table 1.The results obtained here are fully consistent with previous work [18,30].
The question is what is the effect of applying very high deposition voltages (i.e. > -1.2 volts) on
the polarization resistance of the Zn-Fe-Co composite thin coatings? One might expect a shift the Ecorr
of Zn-Fe-Co thin coatings deposited in very high deposition potentials to more negative and thus
reduce the corresponding Rp values. The answer to this question was surprising as the corrosion
potential values of the formed thin coatings at extremely high deposition voltages of -1.3 and -1.4 volts
were again turned into less negative values of -975 and -952; respectively, indicating further
polarization resistance and this is due to the significant increase in film thickness (≈ 3.5 µm) as shown
in Figure 6. Obviously, the polarization resistance of the Zn-Fe-Co thin coating depends not only on
the amount of Co, Fe, or Zn in the film but also on the thickness of the film itself.
As we know, Zn deposition is preferably at high deposition voltage of -1.1 V (abnormal co-
deposition) which of course leads to a sharp increase in its quantities and contents in electroplated Zn-
Fe-Co thin coatings as well as an increase in film thickness (see Table 1). Accordingly, one would
expect the polarization resistance of the thin coatings deposited using a very high deposition voltage
(i.e. - 1.4 V) to be extremely high, as they have the highest thickness (3.56 µm), but because the
dissolution of zinc from the deposits is also preferred than Co and Fe ((Eq. 1). Whereas, zinc content
represents the highest percentage of alloys under these conditions (more than 80%). In this sense, a
slight increase in polarization resistance was achieved from 1.1 to 1.32 kΩ with a significant increase
in the deposition voltage from -1.2 to -1.4 volts, respectively. Therefore, when Zn-Fe-Co erodes, Zn
begins to preferably dissolve first (anodic reaction) due to its high negative corrosion potential (Eq. 1).
At the same time, the reduction of dissolved oxygen at the cathode occurs (Eq. 2). In this way, OH−
and Zn2+ ions are released while the film is corroding, which increases the local pH. Eventually, the
dissolved Zn2+ reacts with OH− species forming Zn(OH)2(s) which acts as a passive film on the surface
of the eroded electrode as shown in Eq. 3 [23, 31]:
Zn(s) → Zn2+(aq) + 2e− (1)
O2(g) + 2H2O(l) + 4e− → 4OH−(aq) (2)
Zn2+(aq) + 2OH−(aq) → Zn(OH)2(s) (3)
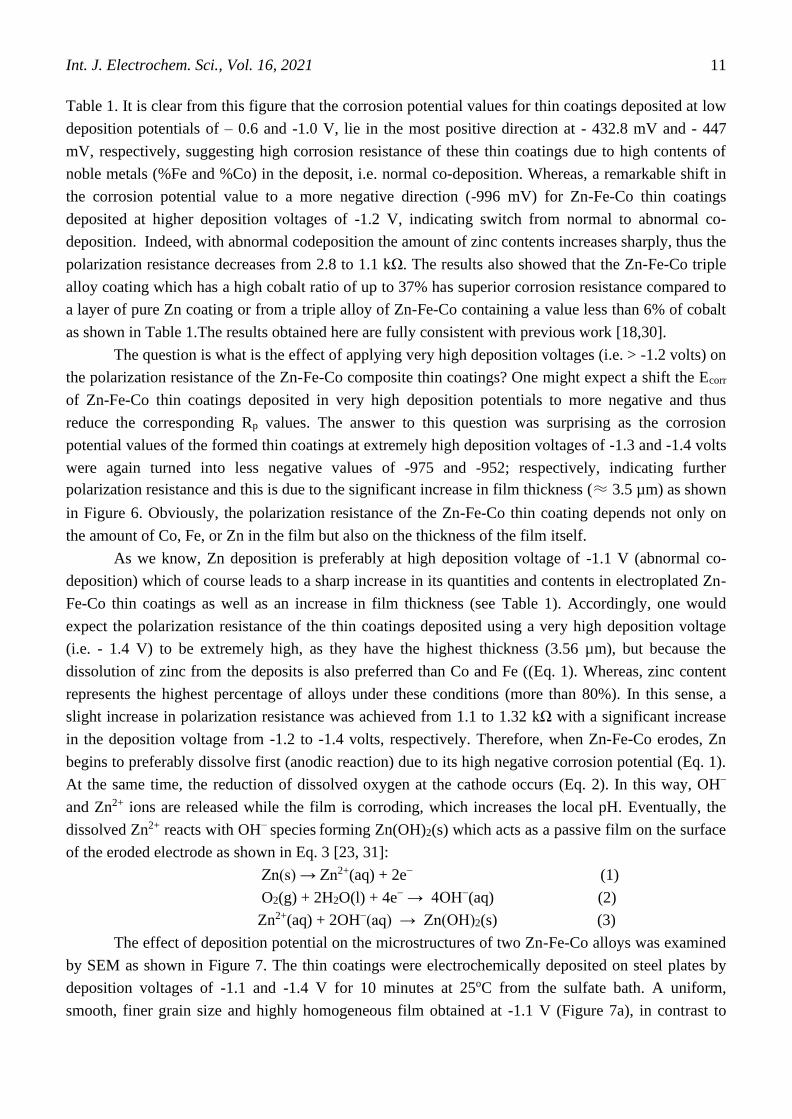
The effect of deposition potential on the microstructures of two Zn-Fe-Co alloys was examined
by SEM as shown in Figure 7. The thin coatings were electrochemically deposited on steel plates by
deposition voltages of -1.1 and -1.4 V for 10 minutes at 25oC from the sulfate bath. A uniform,
smooth, finer grain size and highly homogeneous film obtained at -1.1 V (Figure 7a), in contrast to
Page 12
Int. J. Electrochem. Sci., Vol. 16, 2021
12
rough, non-uniform and inhomogeneous structure of the Zn-Fe-Co thin coating deposited at very high
deposition potential of -1.4 V (Figure 7b). This is mainly due to an increase in the zinc content in the
coating as well as the HER reaction, and therefore the film is distorted. In fact, the hydrogen evolution
reaction has a strong impact on the nucleation process, the physical and structural properties of zinc
coatings and this is due to the high reduction current required in the cathodic sweep process that makes
it difficult to control the important properties of the formed film such as grain size, uniformity,
adhesion, etc [32, 33].
(b)(a) (b)(a)
Figure 7. SEM micrographs for Zn-Fe-Co thin coatings electrochemically deposited on steel sheets for
10 min at 25 °C using different deposition potentials: (a) -1.1 V, and (b) -1.4 V.
Returning to the XRD patterns shown in Figure 4, the average particle size of Zn–Fe-Co thin
coatings can be estimated using Debye-Scherrer equation [34]:
D = 0.9 λ / β cos θ
where λ, β, θ, and D refer to the X-ray wave length (0.1541 nm), full width at half maximum
(FWHM), and diffraction angle and particle size; respectively. The grain size was calculated around
the most intense peak. The estimated grain size of electrically deposited Zn-Fe-Co thin coatings on
steel plates with a deposition voltage of -1.1 and -1.4 V for 10 minutes at room temperature from the
sulfate bath was 68.8 and 170 nm, respectively. This finding confirms that the particle size in Zn-Fe-
Co thin coatings has increased by increasing the deposition potential.
Inspection of the data summarized in Table 1, one can notice that the current efficiency (%E) of
Zn, Fe and Co and Zn-Fe-Co alloy depends strongly on the applied fixed deposition potential. In fact,
Zn2+ has deposition potential more negative compared to the potential for hydrogen evolution reaction,
thus H2 evolution is always in a competition with the alloy deposition process. Thus, the %E of the Zn-
Fe-Co alloys will be always less than 100%. The results indicated that the current efficiency of Zn, Co
and Fe and Zn-Fe-Co thin coatings decreased with shifting the deposition potential to more cathodic
values. Due to the normal co-deposition (part A in Figure 1b) at low cathodic potentials (more
positive), the current efficiency of zinc deposited in the deposition potential < -1.0 V is lower than that
at > -1.1 V.
Page 13
Int. J. Electrochem. Sci., Vol. 16, 2021
13
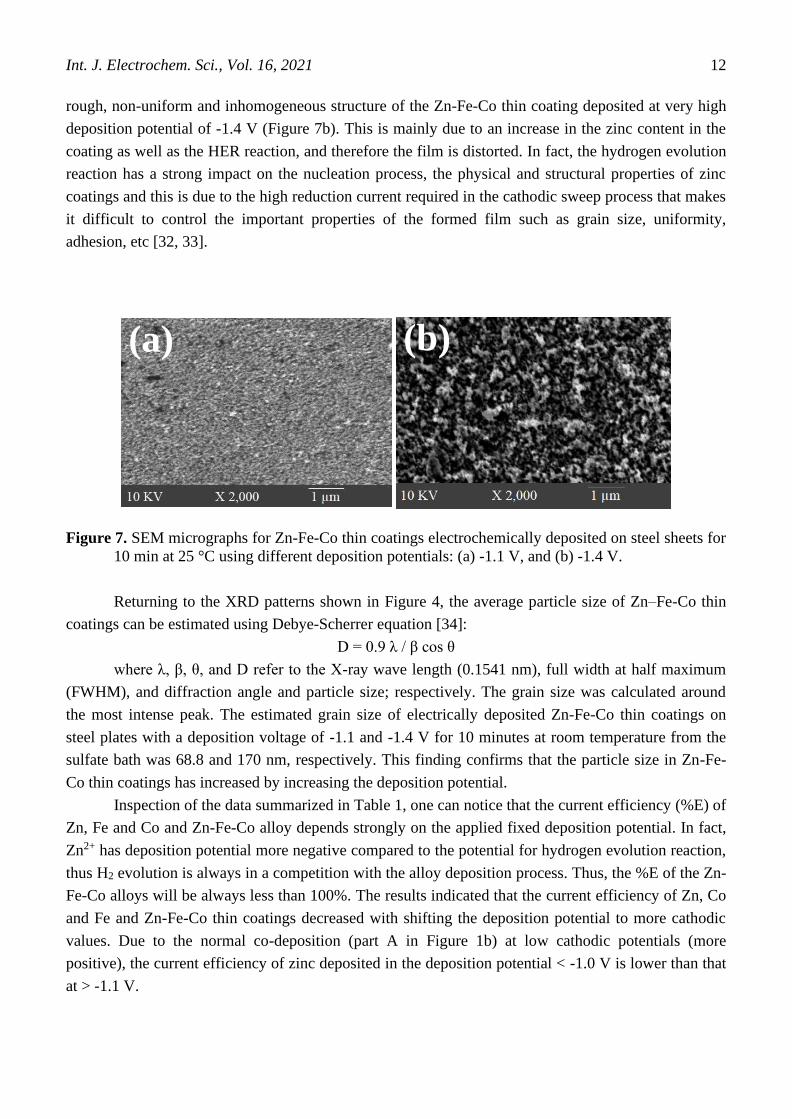
4. MECHANISM
According to previous studies conducted during the electrochemical deposition of Zn-Ni-Co
alloys on a steel substrate, it has been suggested that the anomalous co-deposition trend observed at
higher deposition potentials is due to the formation of zinc hydroxide layer on the steel surface due to
increase of HER reaction that suppressed the discharge of most noble metals, e.g. Ni2+ and Co2+species
[35]. By following this mechanism in a coating bath containing a mixture of zinc, iron, and cobalt
species, zinc hydroxide will be deposited first, making a structure rich in Zn than Co and Fe. This is
due to the lower solubility product constant (Ksp) of Zn(OH)2 (1.2×10⁻¹⁷), which induces its
precipitation first compared to Co(OH)2 and Fe(OH)3 which have higher solubility product constants of
1.6×10⁻¹⁵, 8.0×10⁻¹⁶; respectively. By examining the data shown in Table 1 and Fig. 2, it is clear that
zinc is the most deposited species, indicating that the results that we obtained from this work are more
consistent with this theory. Interestingly, one can also clearly observe that the deposition of cobalt and
iron is preferred than zinc at low voltages and vice versa occurred with increased the deposition
potentials. The findings indicate that, initially, deposition of Fe2+and Co2+ ions, or their monovalent
cations intermediates, occurs on the working electrode surface, followed by deposition of Zn2+ ions, or
its monovalent cation intermediate, on newly deposited CoFe/steel surface, which inhibits the
subsequent deposition of Fe and Co, although it does not completely block them. The degree of
inhibition depends on the value of the applied voltage since they are directly related to each other.
Zn2+ Fe2+ Co2+
SubstrateApplying
negative voltage
> -1 V
< -1 VSubstrate
Substrate
regular co-deposition
anomalous co-deposition
Initial step
Zn2+ Fe2+ Co2+
SubstrateApplying
negative voltage
> -1 V
< -1 VSubstrate
Substrate
regular co-deposition
anomalous co-deposition
Initial step
Figure 8. Schematic diagram of the proposed co-deposition mechanism.
Figure 8 illustrates a schematic diagram of the proposed mechanism. Accordingly, the shift in
the corrosion potential of coatings deposited using very high deposition voltages (-1.2 to -1.4 V) to
more positive values as well as increasing their corrosion resistance can be associated with two
important factors: the first is the significant increase in thickness of these alloys (≈ 3.5 µm), and the
second is due to selective dissolution of zinc from the deposited thin coatings, leaving behind coatings
that are rich in iron and cobalt on the steel surface, and this process is known as dezincification
Page 14
Int. J. Electrochem. Sci., Vol. 16, 2021
14
[30,36,37]. Subsequently, the dissolved Zn2+ interacts with OH− species forming non soluble zinc
hydroxide film that passivate the electrode surface.
5. CONCLUSIONS
In this work, the influence of deposition potential on the properties of Zn-Fe-Co alloy coatings
has been studied. The results indicated that the change of reduction potentials to more negative values
(from -0.6 to -1.0 V) followed by a slight increase in current density indicating the occurrence of
regular codeposition process under this conditions. A sharp increase in current density occurred after
the coating voltage increased to -1.0 volts, indicating that anomalous co deposition approached.
Increased deposition voltages led to a remarkable increase in zinc amounts and contents, contrariwise a
decrease in quantities and contents of Co and Fe in the deposits. Coatings with a high content of cobalt
up to 37% exhibit superior corrosion resistance. When Zn-Fe-Co is eroded, Zn first begins to dissolve
preferably. XRD patterns confirmed that the alloy consist of three different phases. Finally, an
adsorption inhibition mechanism has been proposed to explain the observed results.
ACKNOWLEDGMENTS
The authors are truly indebted to Dr. Arafat Toghan for writing the original draft as well as for his
valuable assistance in analyzing experimental data.
References
1. P. P. Chung, J. Wang, Y. Durandet, Friction, 7(5) (2019) 389-416.
2. S. Sabooni, E. Galinmoghaddam, A. A.Turkin, L. Q. Lu, R. J. Westerwaal, C. Boelsma, E.
Zoestbergen, Y. T. Pei, J. Alloys Compd., 836 (2020) 155448.
3. A. Toghan, M. Khodari, F. Steinbach, R. Imbihl, Thin Solid Thin coatings 519 (2011) 8139- 8143.
4. M. Marín-Sánchez, E. Gracia-Escosa, A. Conde, C. Palacio, I. García, Materials, 11(2018)2035.
5. P. Ferstl, S. Mehl, M. Arman, M. Schuler, A. Toghan, B. Laszlo, Y. Lykhach, O. Brummel,
E.Lundgren, J. Knudsen, L. Hammer1, M.A. Schneider, J. Libuda, J. Phys.l Chem. C, 119 (29)
(2015) 16688-16699
6. F. Faisal, A. Toghan, M. Vorokhta, I. Khalakan, V. Matolin, J. Libuda, Appl. Surf. Sci., 350 (2015)
142-148.
7. A. Toghan, L. M. Rösken, R. Imbihl, ChemPhysChem 11(2010)1452; Phys Chem Chem Phys.,
12(2010)9811-9815.
8. S. Sampath, M. Vadivelu, R. Ravindran, P. T. Perumal, V. Velkannan, K. Karthikeyan,
ChemistrySelect, 5(2020) 2130.
9. M. Heikal, A. Ali, B. S.Ibrahim, A.Toghan, Constr Build Mater., 243 (2020) 118309.
10. M. M. Abou-Krisha, H. M. Rageh, E. A. Matter, Surf. Coat. Technol., 202(15) (2008), 3739-3746
11. T. Boiadjieva-Scherzer, G. Avdeev, T. Vassilev, V. Chakarova, H. Kronberger, M. Monev, M., Surf
Eng., 35( 2019) 1055.
12. C. Oulmas, S. Mameri, D. Boughrara, A. Kadri, J. Delhalle, Z. Mekhalif, B. Benfedda, Heliyon,
5(2019) e02058.
13. M. M. Abou-Krisha, A. M. Zaky, A. A. Toghan, Asian J. Biochem., 1(2006) 84.
Page 15
Int. J. Electrochem. Sci., Vol. 16, 2021
15
14. Y. T. Hsieh, R. W. Tsai, C. J. Su, L. W. Sun, J. Phys. Chem. C, 118( 2014) 22347.
15. M. M. Abou-Krisha, F. H. Assaf, A. A. Toghan, Electrodeposition of Zn–Ni alloys from sulfate
bath, J. Solid State Electr., 11 (2) (2007) 244-252.
16. X. Zhang, R. Liu, R., In.t J. Energy Res. 2020. https://doi.org/10.1002/er.5103
17. S. Fashu, R. Khan, Anti-Corrs Method M., 66(2019) 66, 45.
18. F. Assaf, M. Abou-Krisha, T. A. Yousef, A. Abushoffa, F. El-Sheref, A. Toghan, Russ. J. Phys.
Chem., 94(8) (2020) 1708-1715.
19. R. Solmaz, B. D. Karahan, Int. J. Mine.r Metall Mater. 27(2020)74.
20. R. S. Bhat, U. Bhat, A. Hegde, Anal. Bioana.l Electrochem., 3(2011)302.
21. J. Cheng, L. Ding, Q. Li, C. Chen, R. Wang, X. Kong, Z. Song, X. Zhao, Y. Niu, J Appl
Electrochem., 2020. https://doi.org/10.1007/s10800-020-01405-4
22. G. Tsurtsumia, D. Gogoli, N. Koiava, I. Kakhniashvili, N. Jokhadze, T. Lezhava, N. Nioradze, D.
Tatishvili, IOP Conf. Series: Earth and Environmental Science, 95(2017)042035.
23. H. Faid, L. Mentar, M. R. Khelladi, A. Azizi, Surf. Eng., 33( 2017) 529.
24. W. Li, P. Liu, P. K. Liaw, Mat. Res. Lett., 6(2018)199.
25. M. M. Abou-Krisha, Appl. Surf. Sci., 252(2005)1035.
26. M. G. Hosseini, H. Ashassi-Sorkhabi, H. A. Ghiasvand, J. Surf. Coat. Technol., 202(2008)2897.
27. Z.F.Lodhi, J.M.C.Mol, https://www.sciencedirect.com/science/article/abs/pii/S0257897207004495
- !A. Hovestad, H.Terryn, J.H.W.de Wit, Surf. Coat. Technol., 202(2007)84.
28. J.B. Bajat, M.D. Maksimović, G.R. Radović, J. Serb. Chem. Soc., 67(2002)625-634.
29. H. Kazimierczak, https://www.sciencedirect.com/science/article/pii/S0013468620302814 - !Z.
Świątek, P. Ozg, Electrochim. Acta, 338(2020)135889.
30. Z. F. Lodhi, J. M. C. Mol, A. Hovestad, L. Hoen-Velterop, H. Terryn, J. H. W. De Wit, Surf. Coat.
Technol., 203(2009)1415.
31. T. Kim, Y. Lee, S. Sanyal, Y. Woo, I. Choi, J. Yi, Appl. Sci., 10(2020) 423.
32. F. M. Rivas-Esquivel, G. M. Brisard, R. Ortega-Borges, G. Trejo, Y. Meas, Int. J. Electrochem.
Sci., 12( 2017)2026.
33. A. Lasia, Handbook of Fuel Cells, Fundamentals, Technology and Applications. John Wiley &
Sons, Inc., 2(2010) 416.
34. B. D. Hall, D. Zanchet, D. Ugarte, J. App.l Crystallogr., 33(2000)1335.
35. M. M. Abou-Krisha, H. M. Rageh, E. A. Matter, Surf. Coat. Technol., 202( 2008)3739.
36. J. Choucri, F. Zanotto, V. Grassi, A. Balbo, M. Touhami, I. Mansouri, C. Monticelli, Metals,
9(2019)649.
37. M. D. Fazio, A. C. Felici, F. Catalli, C. D. Vito, Sci. Rep., 9(2019)12668.
© 2021 The Authors. Published by ESG (www.electrochemsci.org). This article is an open access
article distributed under the terms and conditions of the Creative Commons Attribution license
(http://creativecommons.org/licenses/by/4.0/).