13

OPEN ACCESS International Journal of Poultry Science
ISSN 1682-8356DOI: 10.3923/ijps.2021.1.12
Research ArticleEffect of Dietary Hemp Seed Cake on Systemic, Tissue and OrganHealth of Commercial Laying Hens1Rajasekhar Kasula, 1Fausto Solis, 2Byron Shaffer, 2Frank Connett, 2Chris Barrett, 2Rodney Cocker and3Eric Willinghan
1Wenger Animal Nutrient and Technology Innovation Center, The Wenger Group, 101 West Harrisburg Ave, Rheems, PA 17570, United States2Kreider Farms, 1461 Lancaster Rd, Manheim, PA 17545, United States310119 Berlin-Mitte, Germany
AbstractBackground and Objective: Although the inclusion of Hemp Seed Cake (HSC) in animal diets has shown benefits in animal performance,egg quality and human health, its inclusion in animal feed is still prohibited due to the potential residues of the of )-9tetrahydrocannabinol, a psychoactive substance present in the hemp plant. Systemic and organ health are indicators of general healthstatus of animals and any deviation from the expected parameters is an indication of the influence on health and safety of the nutritionprovided to the animals, especially when a new ingredient is included in the ration. The objectives of this study were to determine theeffect of HSC on systemic, tissue, organ, gut health and bone mineralization in commercial layer hens. Materials and Methods: Eighthundred (800) Bovan caged hens in lay at 30 weeks of age were distributed in 4 treatments of 200 hens per treatment based on inclusionlevels of HSC, 0, 10, 20 and 30%. Each treatment comprised of 8 cages of 25 hens each that served as replicates. The observations perprotocol were made over a period of 16 weeks following a 3 week acclimation. Results: The results of the study showed that feedingincreasing levels of HSC up to 30% to commercial laying hens did not affect systemic parameters such as blood pH, blood profile, totalprotein and the mineral profiles; similarly, there was not effect on tissues and organ health parameters. A significant trend of reductionin moisture excretion over the control with HSC feeding was noted. The bone mineralization parameters were not significantly affectedby the supplementation of HSC. Conclusion: The results of this trial confirm that feeding HSC up to 30% does not adversely affect thephysiology of laying hens.
Key words: Hemp seed cake, poultry diet, poultry health, laying hens, tetrahydrocannabinol
Citation: Rajasekhar Kasula, Fausto Solis, Byron Shaffer, Frank Connett, Chris Barrett, Rodney Cocker and Eric Willinghan, 2021. Effect of dietary hemp seedcake on systemic, tissue and organ health of commercial laying hens. Int. J. Poult. Sci., 20: 1-12.
Corresponding Author: Fausto Solis, Wenger Group, Wenger Animal Nutrient & Technology Innovation Center, 101 West Harrisburg Ave, P. O. Box 26,Rheems, PA 17570, United States Tel: 717-361-4211, 717-917-7545, 1-800-692-6008
Copyright: © 2021 Rajasekhar Kasula et al. This is an open access article distributed under the terms of the creative commons attribution License, whichpermits unrestricted use, distribution and reproduction in any medium, provided the original author and source are credited.
Competing Interest: The authors have declared that no competing interest exists.
Data Availability: All relevant data are within the paper and its supporting information files.

Int. J. Poult. Sci., 20 (1); 1-12, 2021
INTRODUCTION
Hemp (Cannabis sativa L.) is an annual herbaceous plantbelonging to the family Cannabinaceae1, traditionally grownfor fiber and seed production. Whole hemp seed containsapproximately 25% crude protein, 33-35% oil and 34%carbohydrate, in addition to a broad range of vitamins andminerals2-4. Hemp seed oil contains 75 to 80% polyunsaturatedfatty acids (PUFA), including 60% linoleic acid and 17-19%α-linolenic acid (ALA)5. The nutrient composition of hempproducts provides evidence that these products may serve aspotentially valuable livestock feed ingredients.
In the past, the cultivation of hemp was prohibited due tothe high content of )-9 tetrahydrocannabinol, a psychoactivesubstance present in the hemp plant. In the recent decades,regulatory changes undertaken by several countries across theglobe allowed for the legal cultivation of industry hemp undera license that permits plants and plant parts of the generaCannabis, the leaves and flowering heads of which do notcontain more than 0.3% )-9 tetrahydrocannabinol (wt/wt)and includes the derivatives of such plants and plant parts.The nutritional profile, in addition to the increase inproduction and availability of hemp and hemp productscreate opportunities to use them in livestock diets6. Significantresearch across the globe that has gone into evaluating thesafety of the ingredient showed that including hemp inanimal feed is safe and offers benefits for improved animalperformance and human health6,7. Initial research indicateshemp products in layers, in addition to the proteincontribution, also are valuable sources of linoleic acid whichis important to improve egg weight5,8,9 and linolenic acid andomega fatty acids, which have proven to have beneficialeffects on human health10-12 . Hemp products are also shownto be excellent sources of yolk pigmentation, lutein and fattyacid enrichment of eggs. Genetic improvements to limit )-9tetrahydrocannabinol to less than 0.3% (w/w) in hemp leavesand flowering heads of the genera Cannabis, have made themsafer as a feed ingredient.
The use of hemp seed cake (HSC) has not been approvedin diets for any class of livestock in the USA due to a lack ofadequate research in support of its safety and efficacy. Thecurrent study was designed to determine the feeding safety ofHSC and its effects on systemic, tissue and organ health incommercial laying hens.
Objectives: The objectives of the study were to determine theeffect of increasing levels of dietary HSC at 10, 20 and 30% onsystemic, tissue and organ health, gut health and bonemineralization in commercial laying hens, as determined by:
Systemic health parameters such as blood pH, blood profile(total erythrocyte count (TEC), total leucocyte count (TLC),differential leucocyte count (DLC), packed cell volume (PCV),mean corpuscular volume (MCV), hemoglobin (Hb), meancorpuscular hemoglobin concentration (MCHC), total bloodprotein and serum mineral profile (Ca, P and Mg):
C Tissue and organ health parameters such as gross patho-morphology and histo-pathology of gut mucosa, spleen,duodenum, pancreas, liver and kidneys
C Gut health and environment as measured by manurequality (moisture, total nitrogen, ammonium nitrogenand mineral profile)
C Bone mineralization, as measured by fresh weight, dryweight, moisture content, ash mass and tibia bonebreaking strength
MATERIALS AND METHODS
Experimental design: The study was conducted at acommercial layer farm in Lancaster County, PA. A part of thecommercial layer farm was ear marked for the study and henswere organized in treatments as below. Eight hundred (800)Bovan white caged hens in lay, 30 weeks of age, weredistributed in 4 treatments of 200 hens per treatment basedon inclusion levels of HSC, as follows: Control diet (C0)-regulardiet with no HSC, (H10)-regular diet with 10% HSC, (H20)-regular diet with 20% HSC, (H30)-regular diet with 30% HSC.Each treatment was comprised of 8 cages of 25 hens each thatserved as replicates. The observations per protocol were madeover a period of 16 weeks following a 3 week acclimation.
Acclimation of test animals: In order to eliminate theimpact of the new ingredient and its differential inclusionlevels, the hens under study were subjected to a period ofacclimatization for 3 weeks when the respective treatmentswere fed with the study diets allowing for acclimatization offeed consumption and gut environment. Observations anddata from the period of acclimation were not considered forthe purpose of this study.
Environment and management: All the hens understudy were subjected to the following environmental andmanagement uniformly. Special feed troughs were designedto bypass the existing auto-feeders and the hens werefed manually once a day. An iso-caloric, iso-nitrogenousdiet of nutrient levels at 25lb/100 hens/day consumption asper breed standard was designed across all treatments.Continuous water, identical environment and management
2

Int. J. Poult. Sci., 20 (1); 1-12, 2021
were offered uniformly across treatments. Hens were weighedprior to start of study by cage and composition of hens percage was managed for uniformity of body weight acrosstreatments. Environmental conditions were maintained at74-76EF house temperature, 40-60% humidity, 30 Lux lightingfor 15-16 h of lighting per day and air movement between2550 and 3400 m3 hG1 per 1000 hens.
In order to establish uniformity of population acrosstreatments, the cages were individually weighed for initialweights and, hens moved between cages so as to maintain atotal body weight difference not exceeding 2.5%. Theseweight-adjusted cages were then randomized within the 32
cage locations with 2 cages of same treatment together. Aplastic plate was installed between each cage thus preventinghens from picking feed from adjacent cage feeder.
Nutritional composition of HSC and finished feed: Theanalysis of nutritional composition of HSC and the studydiets formulated with HSC are presented in Table 1 and theformulation of the feed is presented in Table 2.
Heavy metals in HSC and study diets: The levels of heavymetals arsenic, cadmium and lead in HSC and experimentaldiets are reported in Table 3. The levels of heavy metals in HSC
Table 1: Hemp seed cake and study diet nutritional analysis (%)HSC/treatments HSC SD C0 SD H10 SD H20 SD H30 SDMoisture 7.53 0.31 12.12 0.01 11.21 0.38 10.03 0.47 8.40 0.20Protein (crude) 32.06 0.30 14.81 0.51 16.31 0.19 16.75 0.06 16.57 0.25Fat (crude) 9.02 0.03 2.70 0.00 5.57 0.05 8.78 0.26 11.47 0.16Fiber (crude) 32.21 0.44 1.79 0.11 4.92 0.87 7.07 0.18 9.82 0.11Ash 5.38 0.05 11.27 0.21 11.48 0.28 12.71 0.04 12.21 0.55Minerals (%)Ca 0.17 0.01 3.38 0.03 3.18 0.08 3.61 0.24 3.45 0.14P 0.71 0.47 0.50 0.06 0.50 0.01 0.56 0.04 0.57 0.01Na 0.01 0.00 0.14 0.01 0.14 0.01 0.16 0.01 0.15 0.01Mg 0.48 0.01 0.17 0.01 0.21 0.00 0.26 0.01 0.28 0.00Mn (ppm) 133.00 0.58 78.50 3.54 93.55 1.77 135.00 9.90 145.00 7.07Fe (ppm) 133.67 2.01 283.50 38.89 260.00 7.07 261.50 13.44 244.00 12.21Zn (ppm) 77.83 0.56 86.15 7.85 89.60 4.53 123.50 10.61 128.00 2.83Cu (ppm) 18.83 0.46 19.40 0.28 17.55 0.35 17.95 0.07 19.20 3.54K 0.95 0.02 0.73 0.05 0.72 0.01 0.73 0.04 0.62 0.00Amino acids (%)Methionine 0.51 0.12 0.42 0.10 0.42 0.01 0.44 0.10 0.52 0.01Cysteine 0.34 0.05 0.24 0.04 0.23 0.00 0.22 0.02 0.24 0.01Lysine 1.13 0.02 0.86 0.05 1.04 0.05 1.00 0.05 0.97 0.16Phenylalanine 1.24 0.01 0.72 0.02 0.81 0.01 0.71 0.00 0.75 0.00Leucine 1.93 0.02 1.34 0.03 1.45 0.03 1.25 0.01 1.29 0.00Isoleucine 0.91 0.01 0.52 0.02 0.69 0.02 0.52 0.01 0.61 0.01Threonine 1.18 0.03 0.59 0.07 0.72 0.01 0.67 0.02 0.66 0.06Valine 1.13 0.02 0.57 0.03 0.77 0.01 0.61 0.02 0.76 0.01Histidine 0.73 0.02 0.41 0.02 0.50 0.01 0.41 0.00 0.48 0.00Arginine 4.00 0.05 0.93 0.06 1.26 0.01 1.39 0.02 1.82 0.04Aspartic acid 1.37 0.03 1.60 0.13 1.63 0.02 1.76 0.00 1.56 0.11Serine 3.55 0.03 0.82 0.07 0.87 0.05 0.82 0.02 0.77 0.05Glutamic acid 1.45 0.02 2.73 0.23 2.70 0.01 2.75 0.03 2.46 0.23Proline 4.94 0.03 1.07 0.06 1.03 0.02 0.99 0.01 0.98 0.06Hydroxyproline 1.35 0.04 0.13 0.01 0.08 0.01 0.17 0.01 0.14 0.00Alanine 1.16 0.01 0.78 0.05 0.84 0.01 0.70 0.04 0.78 0.01Tyrosine 0.89 0.01 0.51 0.01 0.54 0.01 0.50 0.01 0.51 0.01Tryptophan 0.27 0.00 0.10 0.01 0.11 0.01 0.19 0.01 0.13 0.01Fatty acids (%)Oleic 18:1 w7 1.05 0.01 0.80 0.00 1.16 0.01 1.21 0.01 1.26 0.01Linoleic 18:2 w6 55.26 0.05 55.30 0.16 54.59 0.23 54.73 0.10 54.91 0.04Linolenic 18:3 w6 3.43 0.02 0.00 0.00 0.45 0.01 0.69 0.02 0.81 0.01Linolenic 18:3w3 14.47 0.05 2.66 0.15 6.01 0.00 7.33 0.16 8.00 0.11Total% W3 15.34 0.06 2.66 0.15 6.10 0.00 7.63 0.16 8.23 0.12Total% W6 58.69 0.06 55.30 0.16 55.03 0.23 55.51 0.12 55.72 0.06Data are the mean of three replicates (n = 3) of HSC and two replicates (n = 2) of each feed type, SD: Standard deviation
3

Int. J. Poult. Sci., 20 (1); 1-12, 2021
Table 2: Study diets formulated by treatment (lb)Ingredient/treatment C0 H10 H20 H30Corn 1304.70 1187.90 1066.70 919.10Soybean meal- solvent 463.00 334.00 206.00 102.00Calcium chip 98.00 97.00 98.00 98.00Limestone 98.00 97.00 98.00 98.00Monocalcium phosphate 21% 20.40 18.10 15.80 13.30Salt 5.09 5.13 5.17 5.22Methionine, DL 4.00 4.00 4.00 3.80Sodium sesquicarbonate 3.60 3.60 3.60 3.60Vitamin premix 1.00 1.00 1.00 1.00Trace minerals premix 1.00 1.00 1.00 1.00Choline, Liq. 70% 0.62 1.43 2.25 2.97Alpha-gal 280 P 0.33 0.33 0.33 0.33Phytase 0.16 0.16 0.16 0.16HSC 0.00 200.00 400.00 600.00Soybean oil 0.00 44.00 90.00 139.00Lysine sulfate 60% 0.00 3.48 6.95 9.28Tryptophan 0.00 0.49 0.97 1.33Threonine 0.00 0.40 0.90 1.00Ingredient total 2000.00 2000.00 2000.00 2000.00Calculated nutritional compositionMoisture 11.57 13.32 16.13 17.06Crude protein 15.86 15.88 15.90 16.34Fat (Ether extract) 2.65 5.39 8.20 11.16Crude fiber 1.99 5.01 8.01 11.04Ash 12.34 11.80 11.79 10.79Minerals (%)Avail Ca 4.17 4.11 4.13 4.12Avail P 0.44 0.44 0.44 0.44Na 0.17 0.17 0.17 0.17Cl 0.195 0.195 0.195 0.195Poultry ME 1290.23 1290.64 1290.62 1290.39Amino acidsLysine, digestible 0.75 0.76 0.78 0.79Methionine, dig 0.43 0.43 0.43 0.42Met and Cys, dig 0.65 0.65 0.64 0.63Tryptophan, dig 0.17 0.17 0.17 0.16Threonine, dig 0.53 0.53 0.52 0.52Glycine, dig 0.59 0.58 0.56 0.57Phenylalanine, dig 0.74 0.69 0.64 0.61Leucine, dig 1.32 1.22 1.12 1.05Histidine, dig 0.40 0.37 0.35 0.34
Table 3: Levels of heavy metals in HSC and study diets (mg kgG1)Heavy metals/treatment HSC C0 H10 H20 H30 p-value SDArsenic <0.05 0.20a 0.10b 0.10b 0.10b 0.0001 0.00Cadmium <0.05 0.09a 0.06b 0.06b 0.06b 0.0001 0.00Lead <0.05 0.20 0.20 0.15 0.20 0.4789 0.04Data are the mean of three 3 replicates (n = 3) of HSC and 2 samples (n = 2) of feed diets. Means with different superscripts are significantly different (p<0.05)
were below laboratory detectable levels. The control rationshowed significantly higher levels of arsenic and cadmiumover HSC diets. The lead profiles of experimental rations didnot vary significantly.
Feeding program: Experimental birds were offered a uniformrestricted amount of feed at 25lb/100 per day across alltreatments. A pre-weighed 6.25lb of feed was provided to
each cage of 25 hens every day at the same time. At this level,it was expected that the hens consumed nutrients per breedrecommendation for the age and stage of production.
Preparation of composite egg sample: A specific compositesampling procedure was followed for analyzing certainparameters of egg quality, that included of the followingsteps:
4
Int. J. Poult. Sci., 20 (1); 1-12, 2021
C Collect 3 eggs from each of the 8 cages of the treatmentunder process, a total of 24 eggs per treatment.
C Prepare 3 sets of 8 eggs each with 1 egg representingeach of the cages.
C Break the 8 eggs from each set, mix and homogenizethe whole egg contents for a minute with an egghomogenizer (easy mix mixer-bowl rest feature of5 speed), pour in a sterile plastic bottle previouslyidentified with details of treatment. This makes 1composite sample.
C Prepare 3 such composite samples per treatment.C Repeat the procedure for other treatments.
Study parameters, test and analytical methods: The studyparameters were classified under four categories: 1. Systemichealth parameters, 2. Tissue and organ health, 3. Gut healthand environment and 4. Bone mineralization and wereobserved as follows:
Systemic health parameters: A set of systemic parameterswere identified to determine the impact of feeding HSCon the general health of laying hens as any toxic, adverseor unfavorable reaction would be reflected as a change inblood profile. All blood parameters were determined onday 1, at the end of week 8 and week 16 by collecting0.75 mL blood from the wing vein with an 18-gauge syringe needle at the rate of 1 random hen sampleper cage or replicate across all treatments (n = 8 pertreatment).
Blood pH: The blood pH observation was performed usinga Coleman Metrion 11 pH meter equipped with standardpurpose glass electrodes. Blood pH was determined on Day 1,at the end of week 8 and week 16 at the rate of 1 sample percage across all treatments.
Blood profile: The complete blood count included thewhite blood cells (WBC), red blood cells (RBC), packed cellvolume (PCV), mean corpuscular volume (MCV), totalprotein (TP), heterophils/neutrophils (HetNeuts), lymphocytes(Lymph), basophils (Baso), eosinophils (Eosi), monocytes(Monoc), hemoglobin (HGB), and mean corpuscularhemoglobin Concentration (MCHC) was performed.
Heparinized blood sample tubes were used to collectblood which were sent to the Avian and Exotic Animal ClinicPath Laboratory for test using the Natt and Herrick13
procedure, as follows:
Preparation of reagent:
C Dissolve 3.88 g of NaCl, 2.50 g of Na2SO4, 2.91 g ofNa2HPO4-12H2O, 0.25 g of KH2PO4, 7.50 cc of Formalin(37%) and 0.10 g of Methyl Violet 2B in the orderprescribed in distilled water and dilute to a total volumeof 1000cc in a volumetric flask.
C Stand the solution overnight and filter through fine filterpaper (Whatman No. 2). This reagent has a pH of 7.3 andready to use.
C Count all blood cells using a Spencer "Bright-Line"Haemocytometer at a magnification of X440.
C Count TEC in all the 80 small squares.C Count TLC in the entire central 1 mm. square (400 small
squares)13.C Calculate the percentage of each of 5 basic leucocytes
(heterophils, lymphocytes, monocytes, eosinophils andbasophils) as described by Çetin et al.14.
Total blood protein: The total protein was determined byusing a refractometer following the method developed byYam et al.15; briefly, 3 mL of blood were pooled from the wingvein and transferred to a heparinized coated tube from a henper cage; the samples were centrifuged at 1358 g for 10 minat 4EC. The supernatant plasma pipetted and transferred intoplastic tubes and stored at -80EC until the day of processingwhich occurred 3 weeks of initial plasma collection. On theday of sample processing, heparinized plasma was thawed atroom temperature and diluted with 0.9% saline (NaCl) in ratioof plasma: fluid of 9:1. The refractometric assay was performedfor the dilution. Plasma dilution was further aliquoted for theassay. Temperature-corrected refractometer (Reichert VET 360,Depew, NY, USA) was calibrated with de-ionized water prior toprotein analysis. Protein measurements were performed induplicate and readings were measured and recorded15.
Serum mineral profile (Ca, P and Mg): Individual samples ofserum from 8 hens (1 per cage = 8 per treatment), centrifugedat 15000 RPM for 10 min were sent to Veterinary DiagnosticLaboratory, University of Kentucky, Lexington KY) forcalcium, phosphorus and magnesium determination using anautomated clinical chemistry analyzer.
Tissue and organ health: Tissue and organ samples weretaken at the end of week 16 at the rate of 1 hen per cage, or8 hens per treatment (n = 8) and analyzed for gross patho-morphology and histo-pathology.
5

Int. J. Poult. Sci., 20 (1); 1-12, 2021
Gut mucosa: An enteric morphometric analysis wasperformed on a 1 cm segment from the midpoint of theduodenum. The tissues were removed and fixed in 10%buffered formalin for 72 h. The intestinal sample was thenembedded in paraffin and a 2 :m section was placed on aglass slide and stained with hematoxylin and eosin forexamination under a light microscope16 for villus height, villusbase, villus surface area and crypt depth. Morphologicalparameters were measured using the Image Pro Plus v 4.5software package. Villus height was measured from the topof the villus to the top of the lamina propria. Villus surface areawas calculated using the formula
(2π) (VW/2) (VL)
WhereVW : Villus width VL : Villus length17
Spleen, duodenum, pancreas, liver and kidneys: Spleen,duodenum, pancreas, liver and kidney samples (n = 8) pertreatment were preserved in 10% buffered formalin inplastic tubes. Organ samples were collected as 1 cm widepieces, incised through mid-organ, placed in neutralbuffered formalin for 48 h, sub-gross trimmed to 2 mmsections and routinely processed for paraffin embeddedhistologic sections. Five-micrometer thick paraffin sectionswere cut on a microtome, processed and stained withhematoxylin and eosin. Histologic examination wasperformed with an Olympus BX41 microscope (OlympusAmerica, Center Valley, PA) with an attached Model MU1400Amscope camera (Amscope, Chino, CA). The patho-morphology of the samples was performed at the VeterinaryDiagnostic Pathology, LLC, Fort Valley, VA, USA for parametersas follows:
Spleen: Spleen germinal center, spleen lymphoreticularcell hypertrophy and spleen periarteriolar lymphoid sheath(T cells).
Duodenum: Duodenal coccidia, duodenal villus atrophia,duodenal crypt hypertrophy, duodenal lymphocytic infiltrates,gut associated, duodenal heterophil count, duodenalbacteriosis/dysbacteriosis, duodenal cystic crypts, duodenalinter-epithelial leucocytes, duodenal hemorrhage andduodenal serositis.
Pancreas: Pancreas lymphocytic foci and peri pancreatitis.
Liver: Liver periportal inflammation, cholangiohepatitis, liverhemorrhage, liver steatosis/lipidosis, liver lymphoid nodules,liver thrombosis, liver necrosis/infarcts, liver duct hyperplasiaand liver extramedullary myelopoiesis/hematopoiesis.
Kidneys: Kidney lymphocytic foci, nephritis,glomerulonephritis, tubular casts, hemorrhage and ureteritis.The lesion panels in the report represent common lesion andtissue responses identified in chickens raised in a commercialor research environment and exposed to myriad nutritionaland environmental factors. In addition, lesions that were noton these panels were noted, first as an overview examinationof the study specimens and as the study progressed. Theselesions are added to the panel and scored for all specimens.
Lesions (abnormal tissue, departure from normal) andtissue responses were scored semi-quantitatively to reflect aprogression of standard pathology terms for the severity ofthe lesion: normal, minimal, mild, moderate, marked andsevere. For spreadsheet recording of data, lesion scoresare assigned to each term, as 0 = normal, 1 = minimal,2 = mild, 3 = moderate, 4 = marked and 5 = severe. Whilespecific definitions exist for every lesion, the scores generallyrepresented the spectrum of biological response of theorgan to disease, for each lesion parameter. In general,normal (0) implies the absence of a response. Traceappearance of a lesion warrants a minimal (1) score, throughgradation of responses to severe (5) representing 80% ormore of the biological limit for response in that organ. For this study, no actual measurements (morphometrics)were applied. Cumulative pathology was calculated bysumming all lesion scores for each organ (VeterinaryDiagnostic Pathology, LLC 638 South Fort Valley Road FortValley, Virginia 22652 USA office 540-933-6409/cell 334-750-7566).
Gut health and environment: Changes to manure parameterswas considered representative of disturbances to gutenvironment and health, therefore, a detailed analysis of themanure was performed to determine the impact of feedingHSC treatments to laying hens. Three composite samples offecal material per treatment were prepared by collectingsamples from under each cage, thoroughly mixing thesamples and dividing them into 3 composite samples pertreatment. Composite samples thus prepared in sterile plasticbags were sent to Waypoint Analytical, Leola, Lancaster, PAand analyzed as follows:
6

Int. J. Poult. Sci., 20 (1); 1-12, 2021
Moisture: Each composite sample was dried in an oven at95EC for 24 h or until the sample weighted constant. Themoisture content was determined by the formula:
WW-DWWW
WhereWW : Wet weightDW : Dry weight
Total nitrogen: The protein content was determined byassaying the total Nitrogen content of the excreta by using aLECO model FP 2000 N combustion analyzer (LECO Corp., St.Joseph, MI; AOAC International, 2000; method 990.03) andmultiplying the result by a factor of 6.25.
Mineral profile: The mineral content was determinedby using an ICP-OES (Inductively Coupled Plasma OpticalEmission Spectroscopy)18.
Bone mineralization: Calcium and related mineral dynamicsplay a key role in laying hens and bone mineralization profileas determined by tibia bone composition and breakingstrength was identified for determining the impact of feedingHSC.
Tibia composition and breaking strength (kgf gG1): Thesamples of tibia were collected from 1 hen from eachtreatment cage (8 per treatment) at the end of week 16,de-fleshed, packed in plastic bags and were overnighted toAhpharma Research and Development Firm, Hebron, MD fordetermining tibia bone strength and tibia composition.
Hens were euthanized by cervical dislocation. One henper cage was selected for the purpose and the right tibia wasexcised from the fresh carcass, de-fleshed without boiling. Thetibiae were individually sealed in 4-oz (113.4 g) plastic bags tominimize moisture loss. The sample bags were placed into aplastic container and stored in a 4EC walk-in cooler for 1 dayor a 20EC walk-in freezer for 7 days. The tibiae were dried at105oC for 24 hours and placed in a desiccator and bone weightwas recorded. Tibia breaking strength (breaking force dividedby bone weight expressed as kilograms per gram) wasmeasured using an Instron with 50 kg-load cell at 50 kg-loadrange with a crosshead speed of 50 mm minG1 with tibiasupported on a 3.35 cm span19. Moisture free tibial ash wasdetermined by ashing in tarred ceramic crucibles for 24 h at615EC. The percentage of tibia ash was calculated by dividing
tibia ash weights by tibia dry weight and multiplying by 100 asreported by Al-Batshan et al.20 and Park et al.21.
Statistical analysis: Systemic health parameters, tissue,organ health, gut mucosa, bone mineralization were analyzedusing a completely randomized design with cage as theexperimental unit with the General Linear Model Procedure(PROC GLM) of SAS (SAS Institute Inc., Cary, NC)22. Thetreatment mean separation were carried out with the TukeyMultiple Range test with a probability of error of 5% (p<0.05).
RESULTS
Systemic health parametersBlood pH: There was no significant difference in blood pHacross all treatments, including control, during the study(Table 4).
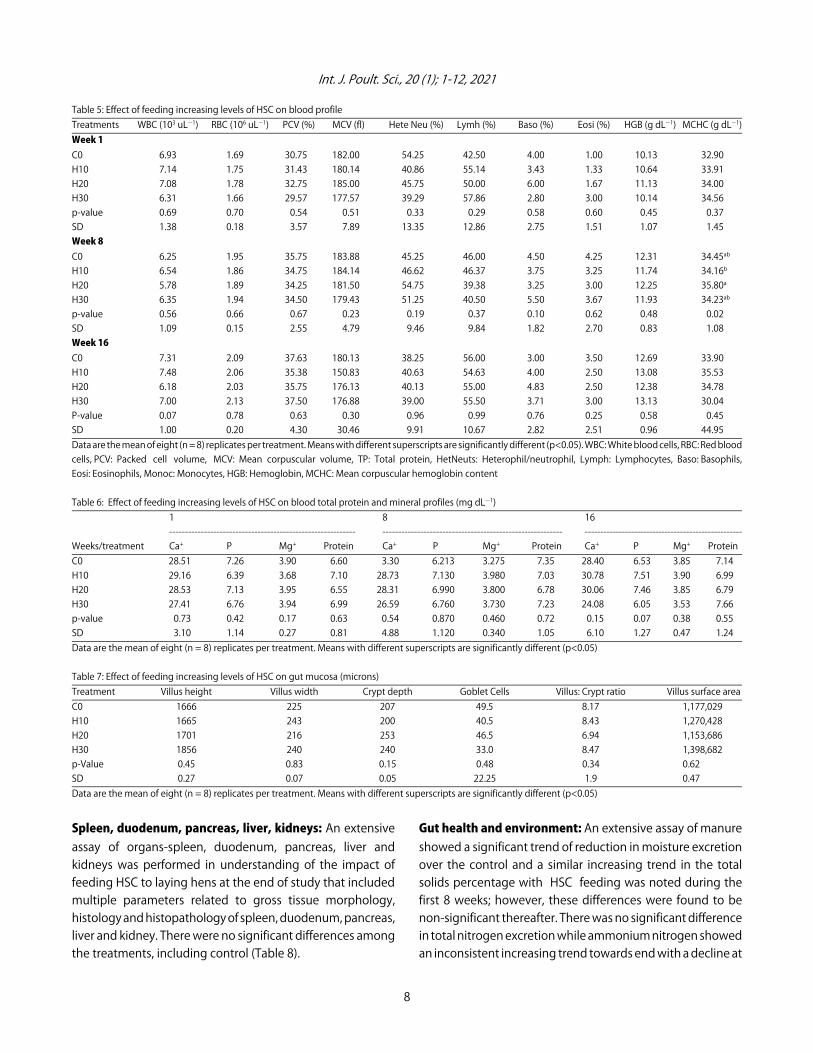
Blood profile: The mean value of complete blood profile ofhens from various treatments are presented in Table 5. Otherthan minor and random instances in parameters, MCHCbetween the 10 and 20% in week 8, no significant differencesbetween the treatments were observed during the study.
Blood total protein and mineral profiles: The mean valuesof blood total protein and mineral profiles of hens fedvarious HSC treatments are presented in Table 6. Nosignificant differences between the treatments were observed.Supplementation of HSC did not significantly affect the bloodmineral and blood protein profiles of hens during the study.
Tissue and organ healthGut mucosa: There was no evidence of adverse impact offeeding varying levels of HSC on gastrointestinal tissueintegrity and health during the current study. Although notstatistically significant, the villus height and villus surface areaof H30 showed favorable trends over control and othertreatments. (Table 7).
Table 4: Effect of feeding increasing levels of HSC on blood pHTreatment/week 1 8 16C0 7.47 7.56 7.15H10 7.47 7.59 7.11H20 7.48 7.59 7.15H30 7.51 7.62 7.06P-Value 0.49 0.56 0.66SD 0.05 0.08 0.16Data are the mean of eight (n = 8) replicates per treatment. Means with differentsuperscripts are significantly different (p<0.05)
7
Int. J. Poult. Sci., 20 (1); 1-12, 2021
Table 5: Effect of feeding increasing levels of HSC on blood profileTreatments WBC (103 uLG1) RBC (106 uLG1) PCV (%) MCV (fl) Hete Neu (%) Lymh (%) Baso (%) Eosi (%) HGB (g dLG1) MCHC (g dLG1)Week 1C0 6.93 1.69 30.75 182.00 54.25 42.50 4.00 1.00 10.13 32.90H10 7.14 1.75 31.43 180.14 40.86 55.14 3.43 1.33 10.64 33.91H20 7.08 1.78 32.75 185.00 45.75 50.00 6.00 1.67 11.13 34.00H30 6.31 1.66 29.57 177.57 39.29 57.86 2.80 3.00 10.14 34.56p-value 0.69 0.70 0.54 0.51 0.33 0.29 0.58 0.60 0.45 0.37SD 1.38 0.18 3.57 7.89 13.35 12.86 2.75 1.51 1.07 1.45Week 8C0 6.25 1.95 35.75 183.88 45.25 46.00 4.50 4.25 12.31 34.45ab
H10 6.54 1.86 34.75 184.14 46.62 46.37 3.75 3.25 11.74 34.16b
H20 5.78 1.89 34.25 181.50 54.75 39.38 3.25 3.00 12.25 35.80a
H30 6.35 1.94 34.50 179.43 51.25 40.50 5.50 3.67 11.93 34.23ab
p-value 0.56 0.66 0.67 0.23 0.19 0.37 0.10 0.62 0.48 0.02SD 1.09 0.15 2.55 4.79 9.46 9.84 1.82 2.70 0.83 1.08Week 16C0 7.31 2.09 37.63 180.13 38.25 56.00 3.00 3.50 12.69 33.90H10 7.48 2.06 35.38 150.83 40.63 54.63 4.00 2.50 13.08 35.53H20 6.18 2.03 35.75 176.13 40.13 55.00 4.83 2.50 12.38 34.78H30 7.00 2.13 37.50 176.88 39.00 55.50 3.71 3.00 13.13 30.04P-value 0.07 0.78 0.63 0.30 0.96 0.99 0.76 0.25 0.58 0.45SD 1.00 0.20 4.30 30.46 9.91 10.67 2.82 2.51 0.96 44.95Data are the mean of eight (n = 8) replicates per treatment. Means with different superscripts are significantly different (p<0.05). WBC: White blood cells, RBC: Red bloodcells, PCV: Packed cell volume, MCV: Mean corpuscular volume, TP: Total protein, HetNeuts: Heterophil/neutrophil, Lymph: Lymphocytes, Baso: Basophils,Eosi: Eosinophils, Monoc: Monocytes, HGB: Hemoglobin, MCHC: Mean corpuscular hemoglobin content
Table 6: Effect of feeding increasing levels of HSC on blood total protein and mineral profiles (mg dLG1)1 8 16----------------------------------------------------------- --------------------------------------------------------- ---------------------------------------------------
Weeks/treatment Ca+ P Mg+ Protein Ca+ P Mg+ Protein Ca+ P Mg+ ProteinC0 28.51 7.26 3.90 6.60 3.30 6.213 3.275 7.35 28.40 6.53 3.85 7.14H10 29.16 6.39 3.68 7.10 28.73 7.130 3.980 7.03 30.78 7.51 3.90 6.99H20 28.53 7.13 3.95 6.55 28.31 6.990 3.800 6.78 30.06 7.46 3.85 6.79H30 27.41 6.76 3.94 6.99 26.59 6.760 3.730 7.23 24.08 6.05 3.53 7.66p-value 0.73 0.42 0.17 0.63 0.54 0.870 0.460 0.72 0.15 0.07 0.38 0.55SD 3.10 1.14 0.27 0.81 4.88 1.120 0.340 1.05 6.10 1.27 0.47 1.24Data are the mean of eight (n = 8) replicates per treatment. Means with different superscripts are significantly different (p<0.05)
Table 7: Effect of feeding increasing levels of HSC on gut mucosa (microns)Treatment Villus height Villus width Crypt depth Goblet Cells Villus: Crypt ratio Villus surface areaC0 1666 225 207 49.5 8.17 1,177,029H10 1665 243 200 40.5 8.43 1,270,428H20 1701 216 253 46.5 6.94 1,153,686H30 1856 240 240 33.0 8.47 1,398,682p-Value 0.45 0.83 0.15 0.48 0.34 0.62SD 0.27 0.07 0.05 22.25 1.9 0.47Data are the mean of eight (n = 8) replicates per treatment. Means with different superscripts are significantly different (p<0.05)
Spleen, duodenum, pancreas, liver, kidneys: An extensiveassay of organs-spleen, duodenum, pancreas, liver andkidneys was performed in understanding of the impact offeeding HSC to laying hens at the end of study that includedmultiple parameters related to gross tissue morphology,histology and histopathology of spleen, duodenum, pancreas,liver and kidney. There were no significant differences amongthe treatments, including control (Table 8).
Gut health and environment: An extensive assay of manureshowed a significant trend of reduction in moisture excretionover the control and a similar increasing trend in the totalsolids percentage with HSC feeding was noted during thefirst 8 weeks; however, these differences were found to benon-significant thereafter. There was no significant differencein total nitrogen excretion while ammonium nitrogen showedan inconsistent increasing trend towards end with a decline at
8

Int. J. Poult. Sci., 20 (1); 1-12, 2021
Table 8: Effect of feeding increasing levels of HSC on patho-morphology of spleen, duodenum pancreas, liver and kidneysParameter/treatment C0 H10 H20 H30 p-value SDSpleenSpleen GC 1.63 1.00 1.81 1.31 0.59 1.26Spleen LyRet Hp 1.38 0.88 1.38 1.50 0.69 1.11Spleen PALS Hp 2.25 2.25 2.50 2.63 0.46 0.56DuodenumDuodenal coccidia 0.00 0.00 0.00 0.00 0.00 0.00Duodenal Villus Atrophia 0.00 0.00 0.00 0.00 0.00 0.00Duodenal Crypt HP 0.38 0.88 0.50 0.88 0.23 0.59Duodenal Lp/Galt 2.00 2.13 2.38 2.00 0.50 0.56Duodenal Heterophils LP 0.38 0.38 0.63 0.13 0.25 0.48Duodenal bacteria/dysbact 0.38 0.38 0.00 0.50 0.38 0.59Duodenal cystic crypts 0.00 0.00 0.00 0.00 0.00 0.00Duodenal Intraepith Leukocyte 1.75 1.75 1.38 1.38 0.22 0.49Duodenal hemorrhage 0.00 0.13 0.00 0.00 0.41 0.18Duodenal serositis 0.38 0.13 0.13 0.25 0.72 0.50PancreasPancreas LC Foci 0.00 0.25 0.00 0.00 0.41 0.35Peri Pancreatitis f/MF 0.63 0.88 0.88 1.00 0.90 1.03LiverLiver MF/Periportal Inflammation 1.88 1.13 1.38 2.00 0.28 0.99Liver Cholangiohepatitis 0.25 0.00 0.00 0.00 0.41 0.35Liver Hemorrhage 0.75 0.63 1.00 0.25 0.63 0.35Liver EMH 0.13 0.00 0.00 0.00 0.41 0.18Liver Lym Nodule 0.75 0.25 0.50 0.38 0.57 0.73Liver Steatosis (Lipidosis) 0.38 0.00 0.00 0.00 0.41 0.53Liver Thrombosis 0.25 0.00 0.00 0.38 0.56 0.64Liver Necrosis (infarct) 0.25 0.00 0.00 0.00 0.41 0.35Liver Duct Hyperplasia 0.25 0.00 0.00 0.00 0.41 0.35KidneysKid. LC Nephritis 0.88 0.50 0.25 1.00 0.47 0.90Kid. Glomerulonephritis 0.88 0.75 0.50 0.38 0.60 0.81Kid. Tubular casts 0.25 0.00 0.38 0.00 0.56 0.64Kid. Hemorrhage 0.25 0.25 0.63 0.00 0.46 0.78Kid. Ureteritis 1.88 0.89 1.13 0.88 0.30 1.19Data are the mean of eight (n=8) replicates per treatment. Means with different superscripts are significantly different (p<0.05). GC: Germinal center, LyRet Hp:Lymphoreticular cell hypertrophy, LP: Lamina propria, LC Foci: Lymphocytic foci, EMH: Extramedullary myelopoiesis or hematopoiesis
30% inclusion. Phosphorus, sulfur, sodium, zinc, copper andiron showed certain differences but were not found to beconsistent across the treatments during the study. The levelsof boron showed a reduction in excretion at week 8 in all HSCtreatments compared to the control, however, was notsignificant across the periods of observation. Aluminumtrended to reduce with HSC levels of feeding until 8 weeks andat week 16 compared to the control with 10% HSC; the samedid not persist towards end of the study. A trend of increase inmagnesium excretion was noticed with HSC inclusion levels,however the difference was significant with 30% HSC at bothweeks 8 and 16. The H10 and H20 treatments did not showconsistent differences with rest of the treatments during thestudy. No trends or statistical significance in excretion ofcalcium, phosphorous, sodium, potassium and manganese,were noted across treatments during the study (Table 9).
Bone mineralizationTibial bone strength and total ash content: The nature ofimpact of feeding HSC on mineral metabolism in laying henswas determined by measuring the composition and breakingstrength of tibial bone at the end of study. The observationsrevealed no impact of feeding HSC on either the compositionor breaking strength of tibia. Although there were numericaldifferences in bone breaking strengths, no trend or statisticaldifference was noted. The composition parameters did notdiffer significantly (Table 10).
DISCUSSION
Most of the published literature on the effect ofdietary HSC is in other species and with using wholehemp seed, hemp oil or other hemp products. Extremely
9

Int. J. Poult. Sci., 20 (1); 1-12, 2021
Table 9: Effect on increasing levels of HSC on manure mineral profileWeek 8 Week 16------------------------------------------------------------------------------------------ ------------------------------------------------------------------------------------------0 10 20 30 PV SD 0 10 20 30 PV SD
TotalN (%) 1.13 1.57 1.88 1.63 0.79 0.88 1.02 1.43 0.99 1.03 0.3500 0.38AmmN (%) 0.31 0.38 0.33 0.29 0.66 0.09 0.50ab 0.53ab 0.59a 0.40b 0.0400 0.08P (%) 1.77 1.44 1.59 1.63 0.44 0.23 1.67 1.27 1.94 1.59 0.1800 0.39K (%) 0.72 0.70 0.51 0.55 0.29 0.16 0.65 0.62 0.58 0.64 0.9000 0.14S (%) 0.10ab 0.09b 0.10ab 0.12a 0.05 0.01 0.10 0.10 0.120 0.12 0.1400 0.02Mg (%) 0.17b 0.16b 0.22ab 0.27a 0.004 0.03 0.12b 0.14b 0.15b 0.19a 0.0010 0.02Ca (%) 2.19 1.96 2.37 3.20 0.13 0.59 1.84 2.12 1.56 1.67 0.6700 0.67Na (ppm) 865.6 369.33 696.33 664.67 0.07 189.20 370.00 412.00 534.50 425.00 0.4300 141.20Fe (ppm) 337.67a 206.67b 247.67a 277.33ab 0.04 45.40 265.50 178.25 229.50 220.75 0.0800 42.39Al (ppm) 138.00b 73.03a 83.80a 83.17a 0.007 17.25 104.83a 63.10b 112.00a 111.05a 0.0050 17.54Mn (ppm) 120.37ab 98.97b 139.67ab 164.33a 0.013 18.28 83.13ab 71.30b 96.00ab 126.73a 0.0200 21.09Cu (ppm) 12.40 7.57 11.90 14.09 0.16 3.19 9.47b 8.45b 9.86b 22.10a 0.0001 2.64Zn ppm) 123.37 85.50 136.33 155.33 0.13 31.96 101.50 82.43 90.90 127.43 0.1100 24.61B (ppm) 12.77a 8.95b 8.81b 7.72b 0.007 1.31 8.41 8.13 8.22 8.78 0.6800 0.80Moist (%) 73.20a 75.00a 69.00b 66.00a 0.003 0.02 77.93 74.97 61.63 68.85 0.2900 0.12Solid (%) 27.00b 25.00b 31.00a 34.00a 0.003 0.02 22.8 25.03 38.38 31.15 0.440 5.67Data are the mean of three composite (n = 3) replicates per treatment. Means with different superscripts are significantly different (p<0.05). TotalN (total nitrogen),AmmN (ammonia nitrogen), moist: Moisture, PV: p-value
Table 10: Effect of feeding increasing levels of HSC on tibial bone parameters (kgf gG1)Treatment Fresh weight (g) Dry weight (g) Moisture (%) Breaking strength (kgf gG1) Ash mass (g) Ash (%)C0 10.54 6.51 38.25 0.53 2.83 0.43H10 11.26 6.87 39.00 0.66 2.89 0.42H20 10.71 6.63 38.12 0.61 2.83 0.43H30 10.21 6.52 36.13 0.72 2.67 0.41P-value 0.53 0.66 0.48 0.64 0.50 0.61SD 0.92 0.64 0.04 0.30 0.29 0.05Data are the mean of eight (n = 8) replicates per treatment. Means with different superscripts are significantly different (p<0.05)
limited published researches are available regarding the effectof feeding HSC on systemic, tissue and organ health ofcommercial laying hens, the authors are constrained with fewsupporting references to quote on the findings.
Effect on systemic health: In the current study, the findingsregarding the systemic health parameters strongly supportthe innocuous nature of the HSC as evidenced by thesignificant differences in blood pH, total erythrocyte count(TEC), total leucocyte count (TLC), differential leucocyte count(DLC), pack cell volume (PCV), mean corpuscular volume(MCV), hemoglobin (Hb), mean corpuscular hemoglobinconcentration diet MCHC), total protein and serum calcium,serum phosphorus and magnesium levels. These findings areconsistent with some previous studies conducted byGakhar et al.6; Silversides and Lefrancois9 who studied internalphysiology in laying hens.
Effect on tissue and organs: The current study unfolds theinnocuous nature of HSC as evidenced by non-significantdifferences between control and HSC fed treatments in histo-morphological (villus height, villus width, villus depth, villus
surface area, crypt depth, villus : crypt ratio and goblet cells)parameters of gut mucosa and histopathological findings ofduodenum, liver, spleen, kidneys and pancreas. This finding isan addition to the current knowledge pool of safely feedingHSC to laying hens and could not be cross verified for want ofrelated published literature.
Effect on gut health and environment: The gross impact ofHSC on gut health and environment was determined byanalyzing the manure for its quality during the study. Thestrong tendency to reducing moisture excretion and non-significant difference in total nitrogen excreted, are in favor ofimproving litter quality. While it could not be sufficientlybacked with other findings in this study, the fact that the trendprevailed across all treatments, including control, insinuatesthat the HSC did not have an adverse effect on the gutphysiology and environment. While the trend of excretionwith the rest of minerals remained inconsistent and mostlynon-significant, that of increasing trend of magnesium cannotbe explained without further investigation. This finding is anaddition to the current knowledge pool of safely feeding HSCto laying hens and could not be cross verified for want ofrelated published literature.
10
Int. J. Poult. Sci., 20 (1); 1-12, 2021
Effect on bone mineralization: The gross effect of HSCfeeding on mineral metabolism was determined by thecomposition and breaking strength of tibia in this study. Anon-significant and inconsistent numerical differences in thefresh weight, dry weight, moisture content, ash mass, ashpercentage and breaking strength of tibia was observed, itmay be inferred that HSC did not interfere with bonemineralization. SkÍivan et al.23 who studied dietary hempseed and reported that the breaking strengths of rawtibias were increased significantly (p<0.001) with all dietaryconcentrations of hempseed, with no difference between theexperimental hempseed diet treatments. Medical research24
and experiments with rats25 showed positive effect ofhempseed on bone strength of tibia. The authors opined thatbone structure morphology and mesenchymal bone cellgrowth are possibly affected by feeding hempseed.
CONCLUSION
The current study has sufficiently evaluated and capturedsafety aspects of feeding HSC to commercial laying hens andconcluded that dietary HSC up to 30% in layer feed didnot adversely affect the systemic health. Moreover, dietaryHSC up to 30% in layer feed did not have significant effect ontissues, organ health, gut health, environment and bonemineralization.
RECOMMENDATIONS
The current study explored several new areas of health,performance, toxic and residual effects of HSC for the firsttime and additional research may be recommended toreconfirm the findings. A further detailed study may berecommended to understand further the trend on reducingexcretion moisture levels and increasing magnesium excretionwhile feeding HSC to commercial laying hens.
ACKNOWLEDGMENTS
The authors thankfully acknowledge Tom Beachler,Kreider Farms and Jennifer Reed-Harry, Pennsylvania Centerfor Poultry and Livestock for their infrastructure and financialsupport which made possible to successfully complete thisresearch study.
REFERENCES
1. Turner, C., P. Cheng, G. Lewis, M. Russell and G. Sharma, 2009. Constituents of Cannabis sativa. Planta Med., 37: 217-225.
2. Kelley, D.S and I.L. Rudolph, 2002. Effect of individual fattyacids of T-6 and T-3 type on human immune status and roleof eicosanoids. Nutrition 16: 143-145.
3. Callaway, J.C., 2004. Hempseed as a nutritional resource: Anoverview. Euphytica, 140: 65-72.
4. House, J.D., J. Neufeld and G. Leson, 2010. Evaluating thequality of protein from hemp seed (Cannabis sativa L.)products through the use of the protein digestibility-corrected amino acid score method. J. Agric. Food Chem.,58: 11801-11807.
5. Parker, T.D., D.A. Adams, K. Zhou, A. Harris and L. Yu, 2003.Fatty acid composition and oxidative stability of cold-pressededible seed oils. J. Food Sci., 68: 1240-1243.
6. Gakhar, N., E. Goldberg, M. Jing, R. Gibson and J.D. House,2012. Effect of feeding hemp seed and hemp seed oil onlaying hen performance and egg yolk fatty acid content:Evidence of their safety and efficacy for laying hen diets.Poult. Sci., 91: 701-711.
7. Jing, M., S. Zhao and J.D. House, 2017. Performance and tissuefatty acid profile of broiler chickens and laying hens fed hempoil and HempOmegaTM. Poult. Sci., 96: 1809-1819.
8. March, B.E. and C. MacMillan, 1990. Linoleic acid as a mediatorof egg size. Poult. Sci., 69: 634-639.
9. Silversides, F.G. and M.R. LefranÇois, 2007. The effect offeeding hemp seed meal to laying hens. Br. Poult. Sci.,46: 231-235.
10. Lewis, N.M., S. Seburg and N.L. Flanagan, 2000. Enriched eggsas a source of N-3 polyunsaturated fatty acids for humans.Poult. Sci., 79: 971-974.
11. Erasmus, U., 1993. Fats that Heal, Fats that Kill. 3rd Edn., AliveBooks, Burnaby, BC, Canada, Pages: 456.
12. Silversides, F.G., K.L. Budgell and M.R. Lefrancois, 2002. Effectof feeding HS meal to laying hens. APRI Factsheet 16, AtlanticPoultry Research Institute.
13. Natt, M.P. and C.A. Herrick, 1952. A new blood diluent forcounting the erythrocytes and leucocytes of the chicken.Poult. Sci., 31: 735-738.
14. Çetin, E., S. Silici, N. Çetin and B.K. Güçlü, 2010. Effects of dietscontaining different concentrations of propolis onhematological and immunological variables in laying hens.Poult. Sci., 89: 1703-1708.
15. Yam, E., G. Hosgood, G. Rossi and L. Smart, 2018. Syntheticcolloid fluids (6% hydroxyethyl starch 130/0.4 and 4%succinylated gelatin) interfere with total plasma proteinmeasurements in vitro. Vet. Clin. Pathol., 47: 575-581.
16. Sakamoto, K., H. Hirose, A. Onizuka, M. Hayashi,N. Futamura, Y. Kawamura and T. Ezaki, 2000. Quantitativestudy of changes in intestinal morphology and mucus gel ontotal parenteral nutrition in rats. J. Surg. Res., 94: 99-106.
17. De los Santos, F.S., A.M. Donoghue, M.B. Farnell,G.R. Farnell, G.R. Huff, W.E. Huff and D.J. Donoghue, 2007.Gastrointestinal maturation is accelerated in turkey poultssupplemented with a mannan-oligosaccharide yeast extract(Alphamune). Poult. Sci., 86: 921-930.
11

Int. J. Poult. Sci., 20 (1); 1-12, 2021
18. Applegate, T.J., C. Troche, Z. Jiang and T. Johnson, 2009. Thenutritional value of high-protein corn distillers dried grains forbroiler chickens and its effect on nutrient excretion. Poult.Sci., 88: 354-359.
19. Shafer, D.J., R.P. Burgess, K.A. Conrad, J.F. Prochaska andJ.B. Carey, 2001. Characterization of alkaline hydroxide-preserved whole poultry as a dry byproduct meal. Poult. Sci.,80: 1543-1548.
20. Al-Batshan, H.A., S.E. Sceideler, B.L. Black, J.D. Garlich andK.E. Anderson, 1994. Duodenal calcium uptake, femur ash andeggshell quality decline with age and increase followingmolt. Poult. Sci., 73: 1590-1596.
21. Park, S.Y., S.G. Birkhold, L.F. Kubena, D.J. Nisbet and S.C. Ricke,2003. Effect of storage condition on bone breaking strengthand bone ash in laying hens at different stages in production cycles. Poult. Sci., 82: 1688-1691.
22. SAS., 2001. The SAS System for Microsoft Windows, release8.2. SAS Institute Inc., Cary, NC.
23. SkÍivan, M., M. Englmaierová, T. Vít and E. SkÍivanová, 2019.Hempseed increases gamma-tocopherol in egg yolks and thebreaking strength of tibias in laying hens. PLoS ONE10.1371/journal.pone.0217509
24. Kogan, N.M., E. Melamed, E. Wasserman, B. Raphael andA. Breuer et al., 2015. Cannabidiol, a major non-psychotropiccannabis constituent enhances fracture healing andstimulates lysyl hydroxylase activity in osteoblasts. J. BoneMiner Res., 30: 1905-1913.
25. Sazmand, M., D. Mehrabani, S.E. Hosseini, M. Amini, 2018. Theeffect of hydroalcoholic extract of Cannabis sativa onmorphology and growth of bone marrow mesenchymal stemcells in rat. Electron J. Gen. Med., 10.29333/ejgm/86195.
12


