BIOTECHNOLOGY AND BIOENGINEERING, VOL. XIX, PAGES 1761-1772 (1977) Effect of Drop Interactions on the Performance of Hydrocarbon Fermentors R. K. BAJPAI" and D. RAMKRISHNA,? Department of Chemical Engineering, Indian Institute of Technology, Kanpur, U.P. 208016, India and A. PROKOP, Department of Technical Microbiology, Institute of Microbiology, Czechoslovak Academy of Science, 14220 Prague 4, Czechoslovakia Summary A drop-interaction model devised by the authors. which successfully predicts experimentally observed drop-size distributions in stirred batch vessels. has been used to assess the importance of droplet coalescence and redispersion in hydrocar- bon fermentation yields. Calculations. which have been made with both n-alkane and gas-oil fermentations, have been compared with previous calculations based on simpler and, hence, less realistic droplet interaction mechanisms. The comparison shows that the differences in yield are not spectacularly different. INTRODUCTION A hydrogen fermentation system consists of the hydrocarbon phase distributed in the form of droplets in the aqueous continuous phase. The droplets are in a state of dynamic equilibrium size distribution, because of continuous coalescence and redispersion processes in the agitated fermentor. The importance of droplet coalescence and redispersion processes in hydrocarbon fermenta- tion yields has been recognized by Shah et al.' and others.' The first attempt to account for droplet coalescence and redispersion on chemical reaction rates in a liquid-liquid system was made by Cu1-1,~ who assumed that all the drops were of identical size and the * Present address: Biochemical Engineering Division, Indian Institute of Technol- t Present address: School of Chemical Engineering, Purdue University, West ogy, Hauz Khas, New Delhi 110029, India. Lafayette, Ind. 47907. 176 I @ 1977 by John Wiley & Sons, Inc.
Transcript
BIOTECHNOLOGY AND BIOENGINEERING, VOL. XIX, PAGES 1761-1772 (1977)
Effect of Drop Interactions on the Performance of Hydrocarbon Fermentors
R. K. BAJPAI" and D. RAMKRISHNA,? Department of Chemical Engineering, Indian Institute of Technology, Kanpur, U.P. 208016, India and A. PROKOP, Department of Technical Microbiology, Institute of Microbiology, Czechoslovak Academy of Science,
14220 Prague 4, Czechoslovakia
Summary A drop-interaction model devised by the authors. which successfully predicts
experimentally observed drop-size distributions in stirred batch vessels. has been used to assess the importance of droplet coalescence and redispersion in hydrocar- bon fermentation yields. Calculations. which have been made with both n-alkane and gas-oil fermentations, have been compared with previous calculations based on simpler and, hence, less realistic droplet interaction mechanisms. The comparison shows that the differences in yield are not spectacularly different.
INTRODUCTION
A hydrogen fermentation system consists of the hydrocarbon phase distributed in the form of droplets in the aqueous continuous phase. The droplets are in a state of dynamic equilibrium size distribution, because of continuous coalescence and redispersion processes in the agitated fermentor. The importance of droplet coalescence and redispersion processes in hydrocarbon fermenta- tion yields has been recognized by Shah et al.' and others.' The first attempt to account for droplet coalescence and redispersion on chemical reaction rates in a liquid-liquid system was made by Cu1-1,~ who assumed that all the drops were of identical size and the
* Present address: Biochemical Engineering Division, Indian Institute of Technol-
t Present address: School of Chemical Engineering, Purdue University, West ogy, Hauz Khas, New Delhi 110029, India.
Lafayette, Ind. 47907.
176 I @ 1977 by John Wiley & Sons, Inc.
1762 BAJPAI. RAMKRISHNA. A N D PROKOP
coalescence-redispersion process can be modeled as coalescence followed by immediate redispersion, i.e., a one-step interaction between two droplets which results in the mixing of their respec- tive contents. In an effort to answer the obvious objection to identically size droplets, Shah et al.' classified the droplets into discrete sizes according to the observed dropsize distribution and proposed a one-step interaction mechanism similar to that of Curl but with the modification that two coalescing droplets of different sizes, redispersed into the same pair as before coalesce. This interaction mechanism preserves the drop-size distribution, while accounting for mixing.
The coalescence-redispersion mechanism proposed by Shah et al. is somewhat unrealistic because redispersion of a drop formed by coalescence of a droplet pair into the same pair is a very unlikely event. On the other hand, to do away with this assumption by an alternative redispersion process, is to undertake to predict the equilibrium size distribution. Bajpai et al.4 have recently shown that, by assuming that a droplet formed by coalescence redisperses instantaneously into a pair whose volumes, aside from summing to the parent drop volume, are perfectly random, the population balance equation can be solved analytically to obtain an exponen- tial drop-volume distribution. This drop-size distribution has been shown by Bajpai et aL4 to fit well a remarkably wide variety of experimental size distributions obtained by different investigators with different systems, under varying conditions.
In a batch fermentation system, one could reasonably expect the transient processes of microbial growth and substrate utilization to depend on the droplet interaction mechanism. This is because the alternative droplet interaction mechanism of Bajpai et al. ,4 while preserving the drop-size distribution, would produce a substrate concentration distribution among the droplets (such as in gas-oil fermentation) different from that predicted by the mechanism of Shah et al. The microbial growth rate would depend on the substrate concentration distribution so that it is of interest to obtain the effect of droplet interaction on biomass yields in a hydrocarbon fermentation system, as predicted by the model of Bajpai et al.
This work investigates analytically both n-alkane and gas-oil fermentations, accounting for droplet interaction using the mecha- nism of Bajpai et al. and comparing the results with those based on the mechanism of Shah et al.' Also, comparisons have been made of the results from models based on complete mixing and complete segregation.
EFFECT OF DROP INTERACTIONS ON FERMENTORS 1763
GROWTH MODEL
Consider substrate-limited growth of microorganisms with the specific growth rate (p) whose dependence upon substrate concen- tration (S) has been assumed to follow Monod’s kinetic expression
where pm is the maximum specific growth rate and K, is the saturation constant; p and S take the subscript c or d depending upon whether these are referring to conditions in the continuous phase or the dispersed phase. Complete mixing has been assumed in the continuous phase.
Since in the n-alkane fermentation, the dispersed phase consists of pure substrate (as against a mixture of consumable and noncon- sumable hydrocarbons in gas-oil), the microorganisms on the n- alkane drops have been assumed to grow at maximum specific growth rate
p,(n-alkanes) = pm
Further, since the microorganisms present on the dispersed phase interface and those in the continuous phase are in continuous exchange,’ the exchange has been assumed to be controlled by a Langmuir-type adsorption-desorption mechanism. The rate of ad- sorption of cells on a drop surface having biomass density n is proportional to the biomass concentration in the continuous phase (a ‘ ) and to the excess capacity of drops to absorb more cells on it [ ( n , - n)A]. Thus,
r, a n’(n, - n)A
where n, is the maximum biomass density on the interface and A is the surface area of the droplet.
The rate of desorption of cells has been assumed to be propor- tional to the amount of biomass on the interface,
r, nA
In essence, the kinetic model for biomass growth is the same as that used by Humphrey and Erickson.‘ Discretized forms of growth equations are as follows: for substrate concentration in a single droplet
d p d . - (uiSi) = - dt Y niA, - k(Seqi - S’)Ai , i - 1, 2, . . . , N,, (1)
I764 BAJPAI, RAMKRISHNA, A N D PROKOP
and for biomass density on the drop
d - ( 4 n i ) = pdiniAi + k,(n, - ni)n’Ai - kdniA, dt
Similarly for substrate and biomass concentration in the continuous phase
( 2 )
i = 1, 2 , . . ., N,,
where Seq, is the continuous phase substrate concentration in equilibrium with substrate concentration in drop i , and is expressed as
s e q , = K e q S i
For n-alkane fermentations, S i is constant and equal to the density of substrate (because the dispersed phase consists of pure sub- strate).
If the concentration of consumable substrate in gas-oil is small, changes of dispersed phase fraction will be rather small and can be i g n ~ r e d . ~ Thus, it has been assumed in this investigation that 4. and vi in the case of gas-oil fermentation do not change with time.
MODELS FOR DROP PHENOMENA
Coalescence-redispersion-type models have been used to repre- sent the droplet interactions. The following three types of coales- cence-redispersion (C-R) events have been considered:
A) Any two drops can coalesce and the coalesced drop breaks into two drops having the same sizes as those which coalesced. The C-R event results in homogenization of substrate concentra- tions and the biomass densities on the surface of the drops. This model of drop interactions (owing to Shah et a1.l) may be consid- ered as a modification of Curl’s3 model and in fact reduces to the original model of Curl for the case of the Dirac-6 initial drop-size distribution, which is left unaltered as a result of drop phenomena.
B) The breakage of the coalesced drop is similar to that in A but the C-R event does not affect the individual biomass concentra- tions on the interface. The substrate mixing is represented by a
EFFECT OF DROP INTERACTIONS ON FERMENTORS 1765
mass-transfer coefficient term, as proposed by Erickson et al.5 This model of drop interactions, however, is applicable only to gas-oil fermentations. For n-alkane fermentations, this model is equivalent to the case of complete segregation of hydrocarbon droplets.
C) Two drops coalesce and the coalesced drop breaks immedi- ately into two drops of arbitrary sizes. The C-R event results in uniform biomass and substrate concentrations in the two drops (same as that in model A). This model differs from model A in that here the redistribution has been assumed to be uniform with respect to the parent drop volume in the statistical sense. This type of redispersion mechanism has been proposed by the authors in a recent paper.4 An analytical solution derived for the case of dynamic equilibrium in systems unaccompanied by any other transport/chemical process, has been shown to represent experi- mentally observed drop-size distribution in widely different sys- tems fairly well.
These models differ from each other in the nature of the drop phenomena and the results of the interactions. A schematic repre- sentation of the three models is as follows:
n,, S, n,, S, n’, S‘ n’, S‘
n1, Sl n,, s2 n’, S’ n’, S‘
V,’ + V,’ = v, + v,,
I766 BAJPAI, RAMKRISHNA, AND PROKOP
Population balance equations for these models are to be solved in conjunction with the growth equations (eqs. (1)-(4)) in order to predict the performance of these systems. For model B, however, the effect of drop interactions is accounted for by an additional term’ on the right-hand side of eq. (3) for substrate consumption in a drop, given by
where k , is the coalescence-redispersion frequency and the term under the summation implies gain or loss of substrate by the ith drop through a C-R event with other drops.
In any case, no analytical solution can be found and numerical techniques must be employed. Growth equations were solved using a Hamming Runge-Kutta predictor-corrector scheme. Equation (3) proved to be extremely “stiff” and a quasi-steady state for continuous phase substrate concentration was assumed, as was done by Shah et al.’
For the case of models A and B, the population balance equations are integro-partial-differential equations with multiple integrals. Therefore a Monte-Carlo simulation technique of Shah et al. has been employed for these calculations. This technique requires the calculation of an “interval of quiescence” (an interval during which no C-R event takes place) and solving growth equations to advance the state of system to the end of this interval when a C-R event occurs causing the state of system to change abruptly. Another interval of quiescence is then calculated and the process repeated.
RESULTS
Growth performances of gas-oil and n-alkane fermentations have been simulated for the extreme cases of complete mixing and complete segregation between drops, as well as for intermediate cases of mixing using the three models discussed above. For the intermediate mixing case, a coalescence-redispersion frequency of 10 hr-’ was used. Coalescence-redispersion frequencies of this order of magnitude were experimentally obtained by the authors, lo
for n-alkane-water-Waldhof agitated systems. These results have been presented in Figures 1-4 for two different initial drop-size distributions (uniform and exponential).
EFFECT OF DROP INTERACTIONS ON FERMENTORS 1767
These solutions were obtained for the following initial conditions and values of constants: initial average volume of a droplet, 1 X
lo-' cm3; dispersed phase fraction, 0.10; substrate concentration in gas-oil drops, 0.17 g/cm3 DP; biomass density in continuous phase, 1.0 g/lCP; biomass density on dispersed phase, 0.0 g/cm2 DP; y = 0.85; Ps = 0.85 g/cm3; = 0.75 hr-l; k, = 0.013 ICP/g dry wt./hr; kd = 0.75 hr-l; k, = 10 hr-'; S, = 9.0 cm/hr; kq = 2.36 x (2.35 x 10-6)cm3 DP/lCP; k, = 0.17 g/cm3 DP; k,, = 2 x g/lDP; n, = 2 x lop4 g/cm2 DP.
Effect of Segregation in Dispersed Phase
In all the calculations (Fig. 1-4) growth performances for the extreme cases of complete mixing are significantly different from those for complete segregation. For example, for the case of uniform initial drop-size distribution in gas-oil fermentation, as much as 97.5% fermentation is completed for the case of complete mixing (between dispersed phase drops), while for
I
the case of
0 4 8 12 15 20 24
T ime(h rs )
Fig. I . n-Alkane fermentation. uniform initial drop-size distribution (DSD). ( I ) Complete mixing. (2) model A, (3) model C. (4) complete segregation.
1768 BAJPAI. RAMKRISHNA, AND PROKOP
32
28
24
a
4
0 0 4 8 12 16 20 24
Time (h rs )
model C, (3) model A, (4) complete segregation. Fig. 2. n-Alkane fermentation, exponential initial DSD. ( I ) Complete mixing. (2)
complete segregation only 90% fermentation is over in 24 hr. In terms of fermentation time required to convert 95% consumable substrate into biomass, a difference of as much as 7 hr can be expected between the two cases. Also these extreme cases envelop the growth curves for intermediate degree of mixing, represented by the three models of drop phenomena. This establishes that the drop interactions are important and cannot as such be neglected while attempting to predict the biomass growth performance in these fermentors.
Effect of Nature of Droplet Interactions
The equilibrium drop-size distribution in a batch, agitated vessel is not attained instantaneously. In fact, it evolves in time from some initial drop-size distribution to the equilibrium value, during which rate processes would of course be occurring in the disper- sion. The interaction mechanism of Shah et al.' is not designed to account for such transient effects, because the drop-size distribu- tion will not vary with time. This objection is not serious for slow
EFFECT OF DROP INTERACTIONS ON FERMENTORS 1769
processes, such as hydrocarbon fermentation, as long as the equilibrium drop-size distribution is used in the calculation. The present investigation is therefore essentially used to assess the second objection to the interaction mechanism of Shah et al.,' which may be related to inappropriate substrate concentration or biomass distribution among the droplet population, and its conse- quent effect on fermentation rates.
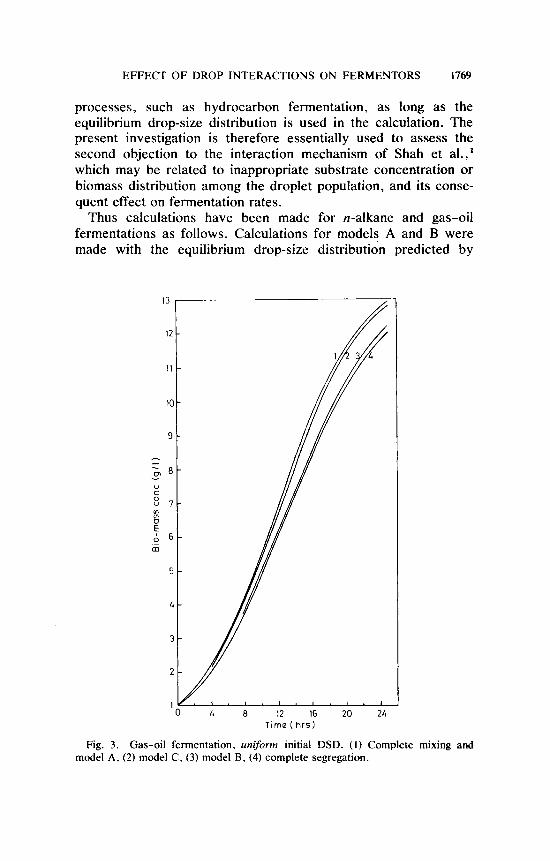
Thus calculations have been made for n-alkane and gas-oil fermentations as follows. Calculations for models A and B were made with the equilibrium drop-size distribution predicted by
12 -
11 -
I0 -
9 -
- - - - o l e -
8 7 - B
0 m
U C
!I 6 -
5 -
4 -
3 -
2 -
Time (h rs )
Fig. 3. Gas-oil fermentation. uniform initial DSD. ( I ) Complete mixing and model A, (2) model C. (3) model B. (4) complete segregation.
1770 BAJPAI, RAMKRISHNA. A N D PROKOP
0 4 8 12 16 20 24 28 Timo(hrs)
Fig. 4. Gas-oil fermentation, exponential initial DSD. ( I ) Complete mixing. (2) model A and model C; (3) model B; (4) complete segregation.
Bajpai et al.," as the initial drop-size distribution. Since fermenta- tion rates are small, it is immaterial what initial drop-size distribu- tion is used for model C. Specifically, calculations for model C were calculated with two initial distributions; one of these was a uniform size distribution while the other was the equilibrium drop- size distribution.
The results are displayed in Figures 1-4. In all the situations analyzed the difference between the predictions of models A and C is quite small. The maximum difference is no more than 5% in biomass concentration at any given time in the case of n-alkane fermentation (Fig. 1). Virtually, no difference exists between
EFFECT OF DROP INTERACTIONS ON FERMENTORS 1771
models A and C in the prediction of biomass yields for gas-oil fermentation as evident from Figures 3 and 4. Calculations for model B place the biomass yield curve very close to that for complete segregation. If it is recalled that in model B, drop interaction had been presumed to result in substrate mixing but not biomass, then the proximity of the biomass curve for model B to that for complete segregation can be interpreted as follows: Micro- bial growth is not sufficiently sensitive to substrate mixing because despite a significant difference between the substrate concentration distribution among the drop population for model B and that for the completely segregated model, the microbial yields do not differ very much. Thus it must be concluded that the difference between the substrate concentration distributions for models A and C were not sufficiently different to produce significant changes in biomass yields as predicted by these two models.
These results could not have been surmised without the analysis we have presented here, because the initial substrate concentration had been picked to be equal to the value of the Michaelis constant K s , which implies that growth rate should be sensitive to the substrate concentration. However, sensitivity to substrate concen- tration does not necessarily imply sensitivity to concentration distribution among the drop population.
KS' ICP n n' n,
S S' t U
N o t
VO
Nomenclature surface area of a drop of volume, u, cm* continuous phase dispersed phase adsorption constant, ICP/g dry wt./hr coalescence-redispersion frequency, hr-' desorption constant, hr-' mass transfer coefficient, c d h r distribution factor for substrate, between two phases, cmS/lCP saturation constant for growth of biomass on dispersed phase, g substrate/cm3 DP saturation constant for growth of biomass, g substrate/lCP liter of continuous phase biomass density on dispersed phase, g dry wt./cm2 DP biomass density in continuous phase, g dry wt./lCP maximum surface biomass density, g dry wt./cm2 DP total number of drops in the system concentration of substrate in dispersed phase, g substrate/cm3 DP concentration of substrate in continuous phase, g substrate/lCP time, hr volume of a droplet, cm3 initial volume of droplet, cm3
1772 BAJPAI. RAMKRISHNA, AND PROKOP
v c Vd
volume of continuous phase, liter volume of dispersed phase, cm3
Y Greek P Pm, &ax
Ps 4
Subscripts C
d i , j
yield constant, g dry wt./g substrate
specific growth rate of biomass, hr-' maximum specific growth rate of biomass, hr-' density of substrate, g substrate/cm3 dispersed phase fraction
References I . P. S. Shah, L. E. Erickson. and L. T. Fan, Biotechnol. Bioeng. 14,533 (1972). 2 . H. W. Blanch and A. Fiechter. Biofechnol. Bioeng.. 16, 539 (1974). 3. R. L. Curl. AIChE J., 9, 175 (1963). 4. R. K. Bajpai. D. Ramkrishna, and A. Prokop. Chem. Eng. Sci.. 31,913 (1976). 5 . L. E. Erickson. L. T. Fan, P. S. Shah, and M. S. K. Chen, Biofechnol.
6. A. E. Humphrey and L. E. Erickson. J. Appl . Chem. Biofechnol., 4, 125
7. L. E. Erickson, A. E. Humphrey, and A. Prokop. Biofechnol. Bioeng., 11,
8. B. Carnahan. H. A. Luther, and J. 0. Wilkes. Applied Numerics/ Methods.
9. B. H. Shah, J. D. Borwanker, and D. Ramkrishna, Murh. Biosci., 31, l(1976). 10. R. K. Bajpai, D. Ramkrishna, and A. Prokop, Biofechnol. Bioeng., 17, 1697