JOURNAL OF RARE EARTHS, Vol. 30, No. 2, Feb. 2012, P. 105 Foundation item: Project supported by the National Natural Science Foundation of China (20871033) Corresponding authors: WANG Yinhai, MO Maosong (E-mail: [email protected], [email protected]; Tel.: +86-20-39322260) DOI: 10.1016/S1002-0721(12)60003-9 Effect of electron traps on long afterglow behavior of Sr 3 Al 2 O 6 :Eu 0.01 2+ ,Dy 0.02– x 3+ ,Ho x 3+ LI Ya ( ) 1 , WANG Yinhai ( ) 1 , XIONG Yi ( ) 1 , PENG Tieqiu ( ) 1 , MO Maosong ( ) 2 (1. School of Physics and Optoelectronic Engineering, Guangdong University of Technology, Guangzhou 510006, China; 2. Advanced Electronic Materials Institute, Gen- eral Research Institute of Nonferrous Metals, Beijing 100088, China) Received 1 June 2011; revised 20 November 2011 Abstract: The long persistent phosphors Sr 3 Al 2 O 6 :Eu 0.01 2+ ,Dy 0.02–x 3+ ,Ho x 3+ (x=0, 0.01, 0.02) were prepared by a high temperature solid state reaction. All samples showed a broad band emission peaking at ~510 nm, which could be ascribed to Eu 2+ transition between 4f 6 5d 1 and 4f 7 electron configurations. With the increase of substitution of Ho 3+ ions for the Dy 3+ ions in the as-prepared phosphors Sr 3 Al 2 O 6 :Eu 0.01 2+ ,Dy 0.02–x 3+ ,Ho x 3+ (x=0, 0.01, 0.02), the initial intensity of the afterglow obviously decreased. From the thermoluminescence (TL) curves of the samples, we concluded that codoped Ho 3+ ions led to a decline of the trap depth and redistribution of the trap. This may be responsible for the change of afterglow of Sr 3 Al 2 O 6 :Eu 0.01 2+ ,Dy 0.02–x 3+ ,Ho x 3+ (x=0, 0.01, 0.02). Keywords: electron transfer; defect band; thermoluminescence; trap energy level; rare earths As one new type of materials, aluminate-based phosphors have attracted much attention in recent years. Compared with traditional sulfide phosphors, aluminate phosphors have many excellent properties, such as high quantum efficiency, long persistence of phosphorescence and good wa- ter-resistantce [1–3] . Moreover, phosphors SrAl 2 O 4 :Eu 2+ ,Dy 3+ and Sr 4 Al 14 O 25 :Eu 2+ ,Dy 3+ have achieved commercial appli- cations because of their superior afterglow behavior. How- ever, till now, the generation mechanism of afterglow re- mains unclear. Therefore, the discussions of the generation mechanism of afterglow become particularly important. In the previous literatures, there are quite a few discus- sions about the generation mechanism of afterglow. Lin et al. [4] reported that Eu 2+ ions can act as luminescent centers while the co-doping RE 3+ ions may act as the traps in the host. While another group [5] claimed that the co-doped Dy 3+ ions tend to replace the original Sr 2+ ions and produce de- fects around the lattice positions. Such defects with positive valence serve as the traps for the activated electrons from Eu 2+ photoluminescent. Some other researchers [6] proposed a cluster model involving the cation vacancies, the oxygen vacancies and the Dy 3+ ions. This cluster of defects signifi- cantly improves the persistent luminescence properties of the phosphors. However, no agreement on the generation mechanism of afterglow has been achieved until now. In the phosphor Sr 3 Al 2 O 6 :Eu 0.01 2+ ,Dy 0.01 3+ ,Ho 0.01 3+ , there are two TL peaks corresponding to two trap energy levels. With the increase of the delay time, the intensity of TL peak in low temperature reduces gradually. However, the intensity of TL peak in high temperature reduces, then increases, and finally reduces rapidly. The origin of this phenomenon may be as- cribed to electron transfer between traps. However, the in- fluence of electron transfer between the traps on long after- glow behavior of phosphors remains to be investigated, In this work, the phosphors Sr 3 Al 2 O 6 :Eu 0.01 2+ ,Dy 0.02–x 3+ ,Ho x 3+ (x=0, 0.01, 0.02) were prepared by a high temperature solid state reaction. With an increase in the substitution of Ho 3+ ions for the Dy 3+ ions, the change of long-persistent behavior of Sr 3 Al 2 O 6 :Eu 0.01 2+ ,Dy 0.02–x 3+ ,Ho x 3+ (x=0, 0.01, 0.02) were investigated in detail. According to the TL curves, the mechanism of afterglow decay is analyzed in depth based on electron transfer between the traps. 1 Experimental 1.1 Synthesis Samples of Sr 3 Al 2 O 6 :Eu 0.01 2+ ,Dy 0.02–x 3+ ,Ho x 3+ were synthe- sized by a high temperature solid state reaction. The analyti- cal-pure SrCO 3 , Al 2 O 3 , Eu 2 O 3 , Dy 2 O 3 , H 3 BO 3 , were utilized as starting materials in this experiment. A small amount of H 3 BO 3 (10 mol.%) was added into the starting materials as a flux. The starting materials were weighed in the light of the nominal compositions of Sr 3 Al 2 O 6 :Eu 0.01 2+ ,Dy 0.02–x 3+ ,Ho x 3+ . Then the starting powders were milled for 1 h. Subsequently, the mixed powders were sintered at 1350 ºC in a weak re- ducing atmosphere (95%N 2 +5%H 2 ) for 4 h. Finally, the samples of Sr 3 Al 2 O 6 : Eu 0.01 2+ ,Dy 0.02 3+ (marked as S1), Sr 3 Al 2 O 6 :Eu 0.01 2+ ,Dy 0.01 3+ ,Ho 0.01 3+ (marked as S2) and Sr 3 Al 2 O 6 :Eu 0.01 2+ ,Ho 0.02 3+ (marked as S3) were obtained, re- spectively.
Transcript
JOURNAL OF RARE EARTHS, Vol. 30, No. 2, Feb. 2012, P. 105
Foundation item: Project supported by the National Natural Science Foundation of China (20871033)
Effect of electron traps on long afterglow behavior of Sr3Al2O6:Eu0.012+,Dy0.02–x
3+,Hox3+
LI Ya ( )1, WANG Yinhai ( )1, XIONG Yi ( )1, PENG Tieqiu ( )1, MO Maosong ( )2 (1. School of Physics and Optoelectronic Engineering, Guangdong University of Technology, Guangzhou 510006, China; 2. Advanced Electronic Materials Institute, Gen-eral Research Institute of Nonferrous Metals, Beijing 100088, China)
Received 1 June 2011; revised 20 November 2011
Abstract: The long persistent phosphors Sr3Al2O6:Eu0.012+,Dy0.02–x
3+,Hox3+ (x=0, 0.01, 0.02) were prepared by a high temperature solid state
reaction. All samples showed a broad band emission peaking at ~510 nm, which could be ascribed to Eu2+ transition between 4f65d1 and 4f7 electron configurations. With the increase of substitution of Ho3+ ions for the Dy3+ ions in the as-prepared phosphors Sr3Al2O6:Eu0.01
2+,Dy0.02–x3+,Hox
3+ (x=0, 0.01, 0.02), the initial intensity of the afterglow obviously decreased. From the thermoluminescence (TL) curves of the samples, we concluded that codoped Ho3+ ions led to a decline of the trap depth and redistribution of the trap. This may be responsible for the change of afterglow of Sr3Al2O6:Eu0.01
2+,Dy0.02–x3+,Hox
3+ (x=0, 0.01, 0.02).
Keywords: electron transfer; defect band; thermoluminescence; trap energy level; rare earths
As one new type of materials, aluminate-based phosphors have attracted much attention in recent years. Compared with traditional sulfide phosphors, aluminate phosphors have many excellent properties, such as high quantum efficiency, long persistence of phosphorescence and good wa-ter-resistantce[1–3]. Moreover, phosphors SrAl2O4:Eu2+,Dy3+
and Sr4Al14O25:Eu2+,Dy3+ have achieved commercial appli-cations because of their superior afterglow behavior. How-ever, till now, the generation mechanism of afterglow re-mains unclear. Therefore, the discussions of the generation mechanism of afterglow become particularly important.
In the previous literatures, there are quite a few discus-sions about the generation mechanism of afterglow. Lin et al.[4] reported that Eu2+ ions can act as luminescent centers while the co-doping RE3+ ions may act as the traps in the host. While another group[5] claimed that the co-doped Dy3+
ions tend to replace the original Sr2+ ions and produce de-fects around the lattice positions. Such defects with positive valence serve as the traps for the activated electrons from Eu2+ photoluminescent. Some other researchers[6] proposed a cluster model involving the cation vacancies, the oxygen vacancies and the Dy3+ ions. This cluster of defects signifi-cantly improves the persistent luminescence properties of the phosphors. However, no agreement on the generation mechanism of afterglow has been achieved until now. In the phosphor Sr3Al2O6:Eu0.01
2+,Dy0.013+,Ho0.01
3+, there are two TL peaks corresponding to two trap energy levels. With the increase of the delay time, the intensity of TL peak in low temperature reduces gradually. However, the intensity of TL peak in high temperature reduces, then increases, and finally reduces rapidly. The origin of this phenomenon may be as-
cribed to electron transfer between traps. However, the in-fluence of electron transfer between the traps on long after-glow behavior of phosphors remains to be investigated,
In this work, the phosphors Sr3Al2O6:Eu0.012+,Dy0.02–x
3+,Hox3+
(x=0, 0.01, 0.02) were prepared by a high temperature solid state reaction. With an increase in the substitution of Ho3+ ions for the Dy3+ ions, the change of long-persistent behavior of Sr3Al2O6:Eu0.01
2+,Dy0.02–x3+,Hox
3+ (x=0, 0.01, 0.02) were investigated in detail. According to the TL curves, the mechanism of afterglow decay is analyzed in depth based on electron transfer between the traps.
1 Experimental
1.1 Synthesis
Samples of Sr3Al2O6:Eu0.012+,Dy0.02–x
3+,Hox3+ were synthe-
sized by a high temperature solid state reaction. The analyti-cal-pure SrCO3, Al2O3, Eu2O3, Dy2O3, H3BO3, were utilized as starting materials in this experiment. A small amount of H3BO3 (10 mol.%) was added into the starting materials as a flux. The starting materials were weighed in the light of the nominal compositions of Sr3Al2O6:Eu0.01
2+,Dy0.02–x3+,Hox
3+. Then the starting powders were milled for 1 h. Subsequently, the mixed powders were sintered at 1350 ºC in a weak re-ducing atmosphere (95%N2+5%H2) for 4 h. Finally, the samples of Sr3Al2O6: Eu0.01
The emission spectra of all the samples were recorded by a Hitachi F-700 fluorescence spectrophotometer with a xe-non flash lamp as the source of excitation. GFZF-2A sin-gle-photon counter system was used to measure the decay curves of afterglow. The thermoluminescence curves were detected via a FJ427A1 thermoluminescent dosimeter. The samples were excited by UV for 5 min and the measurement started with 5, 15, 30, 60 and 120 min delaying times, re-spectively, after switching off the excitation source. The heating rate is 1 ºC/s. The crystalline structure of the samples were investigated by X-ray powder diffraction (XRD) using an equipment with Cu K� irradiation at 36 kV tube voltage and 20 mA tube current.
2 Results and discussion
2.1 XRD phase analysis
Fig. 1 shows the XRD patterns of the as-prepared Sr3Al2O6:Eu0.01
2+,Dy0.02–x3+,Hox
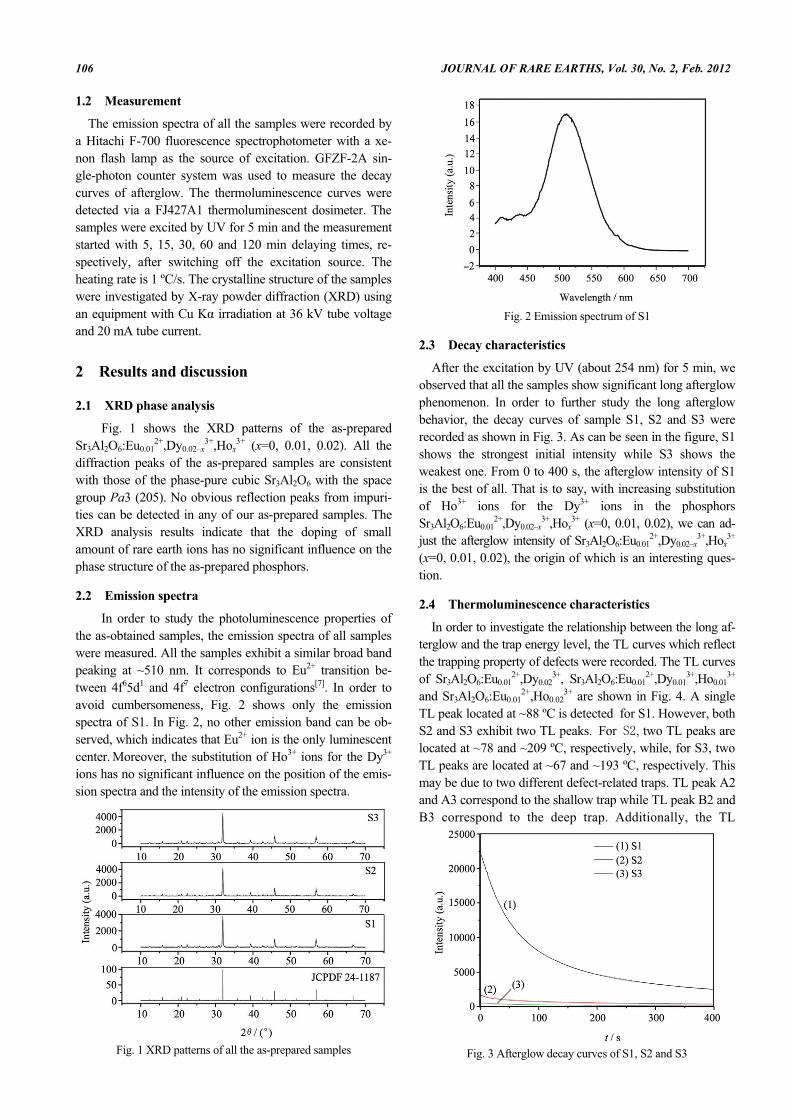
3+ (x=0, 0.01, 0.02). All the diffraction peaks of the as-prepared samples are consistent with those of the phase-pure cubic Sr3Al2O6 with the space group Pa3 (205). No obvious reflection peaks from impuri-ties can be detected in any of our as-prepared samples. The XRD analysis results indicate that the doping of small amount of rare earth ions has no significant influence on the phase structure of the as-prepared phosphors.
2.2 Emission spectra
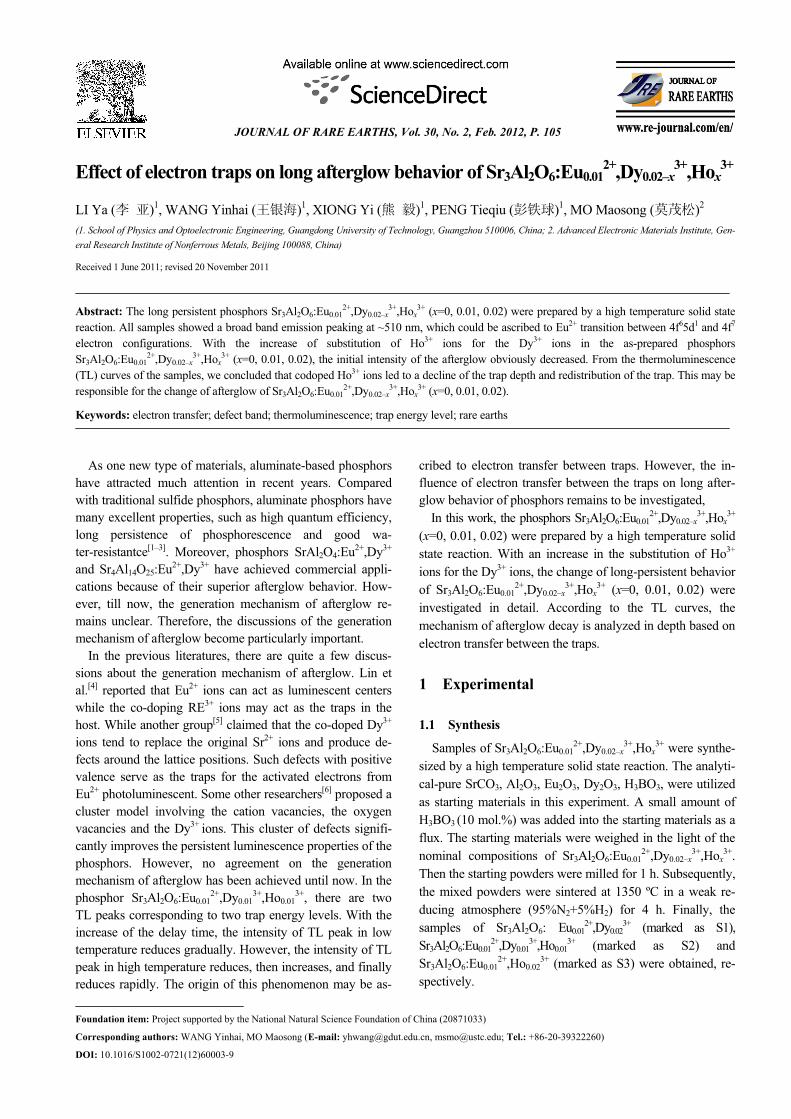
In order to study the photoluminescence properties of the as-obtained samples, the emission spectra of all samples were measured. All the samples exhibit a similar broad band peaking at ~510 nm. It corresponds to Eu2+ transition be-tween 4f65d1 and 4f7 electron configurations[7]. In order to avoid cumbersomeness, Fig. 2 shows only the emission spectra of S1. In Fig. 2, no other emission band can be ob-served, which indicates that Eu2+ ion is the only luminescent center. Moreover, the substitution of Ho3+ ions for the Dy3+ ions has no significant influence on the position of the emis-sion spectra and the intensity of the emission spectra.
Fig. 1 XRD patterns of all the as-prepared samples
Fig. 2 Emission spectrum of S1
2.3 Decay characteristics
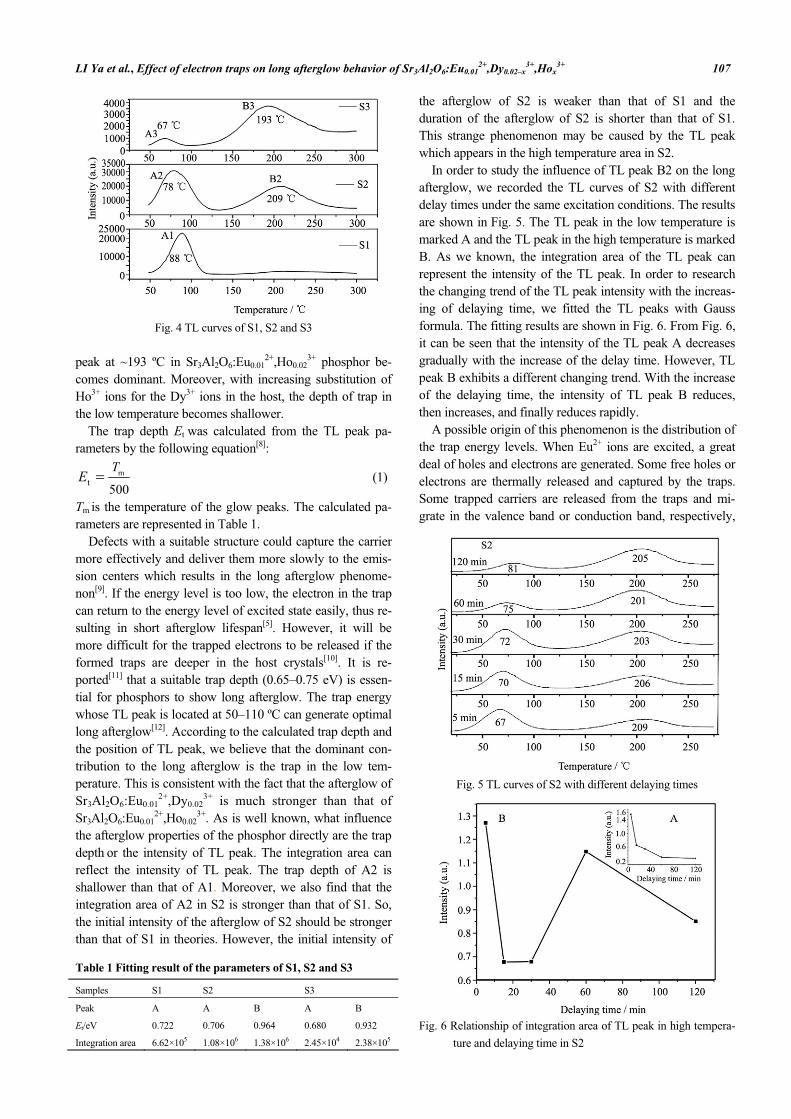
After the excitation by UV (about 254 nm) for 5 min, we observed that all the samples show significant long afterglow phenomenon. In order to further study the long afterglow behavior, the decay curves of sample S1, S2 and S3 were recorded as shown in Fig. 3. As can be seen in the figure, S1 shows the strongest initial intensity while S3 shows the weakest one. From 0 to 400 s, the afterglow intensity of S1 is the best of all. That is to say, with increasing substitution of Ho3+ ions for the Dy3+ ions in the phosphors Sr3Al2O6:Eu0.01
2+,Dy0.02–x3+,Hox
3+ (x=0, 0.01, 0.02), we can ad-just the afterglow intensity of Sr3Al2O6:Eu0.01
2+,Dy0.02–x3+,Hox
3+ (x=0, 0.01, 0.02), the origin of which is an interesting ques-tion.
2.4 Thermoluminescence characteristics
In order to investigate the relationship between the long af-terglow and the trap energy level, the TL curves which reflect the trapping property of defects were recorded. The TL curves of Sr3Al2O6:Eu0.01
2+,Dy0.023+, Sr3Al2O6:Eu0.01
2+,Dy0.013+,Ho0.01
3+ and Sr3Al2O6:Eu0.01
2+,Ho0.023+ are shown in Fig. 4. A single
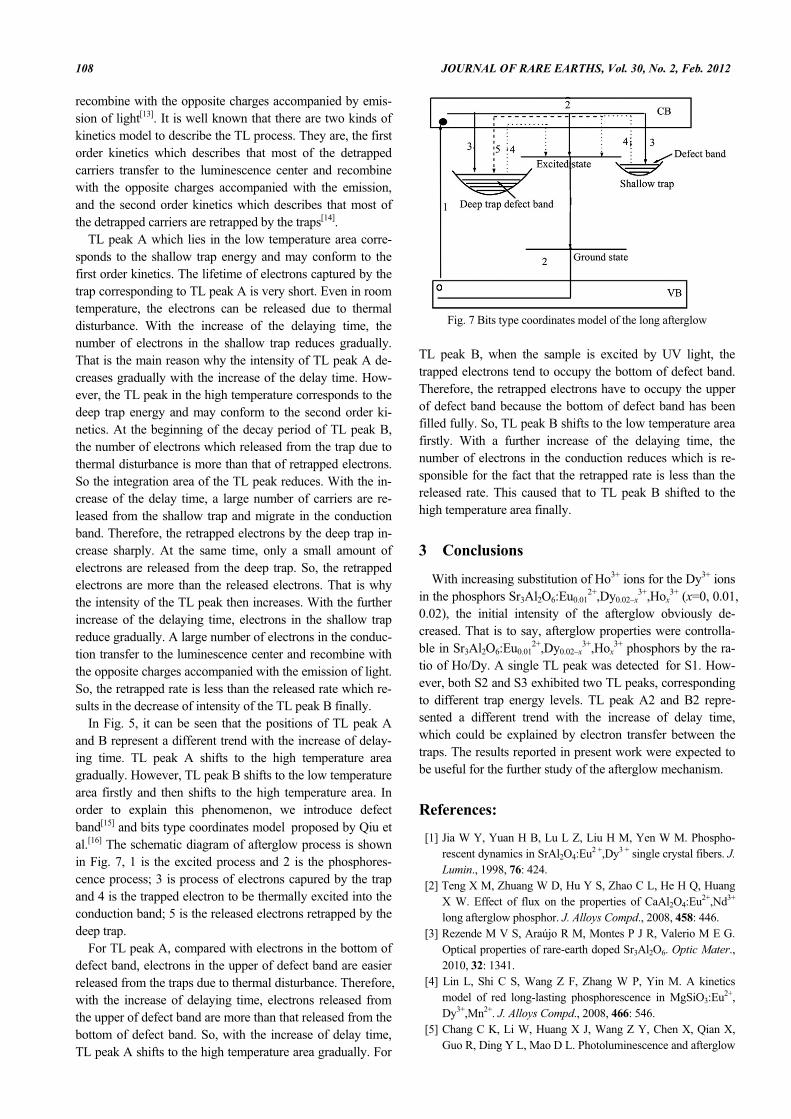
TL peak located at ~88 ºC is detected for S1. However, both S2 and S3 exhibit two TL peaks. For , two TL peaks are located at ~78 and ~209 ºC, respectively, while, for S3, two TL peaks are located at ~67 and ~193 ºC, respectively. This may be due to two different defect-related traps. TL peak A2 and A3 correspond to the shallow trap while TL peak B2 and B3 correspond to the deep trap. Additionally, the TL
Fig. 3 Afterglow decay curves of S1, S2 and S3
LI Ya et al., Effect of electron traps on long afterglow behavior of Sr3Al2O6:Eu0.012+,Dy0.02–x
3+,Hox3+ 107
Fig. 4 TL curves of S1, S2 and S3
peak at ~193 ºC in Sr3Al2O6:Eu0.01
2+,Ho0.023+ phosphor be-
comes dominant. Moreover, with increasing substitution of Ho3+ ions for the Dy3+ ions in the host, the depth of trap in the low temperature becomes shallower.
The trap depth Et was calculated from the TL peak pa-rameters by the following equation[8]:
mt 500
TE � (1)
Tm is the temperature of the glow peaks. The calculated pa-rameters are represented in Table 1. Defects with a suitable structure could capture the carrier more effectively and deliver them more slowly to the emis-sion centers which results in the long afterglow phenome-non[9]. If the energy level is too low, the electron in the trap can return to the energy level of excited state easily, thus re-sulting in short afterglow lifespan[5]. However, it will be more difficult for the trapped electrons to be released if the formed traps are deeper in the host crystals[10]. It is re-ported[11] that a suitable trap depth (0.65–0.75 eV) is essen-tial for phosphors to show long afterglow. The trap energy whose TL peak is located at 50–110 ºC can generate optimal long afterglow[12]. According to the calculated trap depth and the position of TL peak, we believe that the dominant con-tribution to the long afterglow is the trap in the low tem-perature. This is consistent with the fact that the afterglow of Sr3Al2O6:Eu0.01
2+,Dy0.023+ is much stronger than that of
Sr3Al2O6:Eu0.012+,Ho0.02
3+. As is well known, what influence the afterglow properties of the phosphor directly are the trap depth or the intensity of TL peak. The integration area can reflect the intensity of TL peak. The trap depth of A2 is shallower than that of A1. Moreover, we also find that the integration area of A2 in S2 is stronger than that of S1. So, the initial intensity of the afterglow of S2 should be stronger than that of S1 in theories. However, the initial intensity of
Table 1 Fitting result of the parameters of S1, S2 and S3
Samples S1 S2 S3
Peak A A B A B
Et/eV 0.722 0.706 0.964 0.680 0.932
Integration area 6.62×10⁵ 1.08×10⁶ 1.38×10⁶ 2.45×10⁴ 2.38×10⁵
the afterglow of S2 is weaker than that of S1 and the duration of the afterglow of S2 is shorter than that of S1. This strange phenomenon may be caused by the TL peak which appears in the high temperature area in S2.
In order to study the influence of TL peak B2 on the long afterglow, we recorded the TL curves of S2 with different delay times under the same excitation conditions. The results are shown in Fig. 5. The TL peak in the low temperature is marked A and the TL peak in the high temperature is marked B. As we known, the integration area of the TL peak can represent the intensity of the TL peak. In order to research the changing trend of the TL peak intensity with the increas-ing of delaying time, we fitted the TL peaks with Gauss formula. The fitting results are shown in Fig. 6. From Fig. 6, it can be seen that the intensity of the TL peak A decreases gradually with the increase of the delay time. However, TL peak B exhibits a different changing trend. With the increase of the delaying time, the intensity of TL peak B reduces, then increases, and finally reduces rapidly.
A possible origin of this phenomenon is the distribution of the trap energy levels. When Eu2+ ions are excited, a great deal of holes and electrons are generated. Some free holes or electrons are thermally released and captured by the traps. Some trapped carriers are released from the traps and mi-grate in the valence band or conduction band, respectively,
Fig. 5 TL curves of S2 with different delaying times
Fig. 6 Relationship of integration area of TL peak in high tempera-
recombine with the opposite charges accompanied by emis-sion of light[13]. It is well known that there are two kinds of kinetics model to describe the TL process. They are, the first order kinetics which describes that most of the detrapped carriers transfer to the luminescence center and recombine with the opposite charges accompanied with the emission, and the second order kinetics which describes that most of the detrapped carriers are retrapped by the traps[14].
TL peak A which lies in the low temperature area corre-sponds to the shallow trap energy and may conform to the first order kinetics. The lifetime of electrons captured by the trap corresponding to TL peak A is very short. Even in room temperature, the electrons can be released due to thermal disturbance. With the increase of the delaying time, the number of electrons in the shallow trap reduces gradually. That is the main reason why the intensity of TL peak A de-creases gradually with the increase of the delay time. How-ever, the TL peak in the high temperature corresponds to the deep trap energy and may conform to the second order ki-netics. At the beginning of the decay period of TL peak B, the number of electrons which released from the trap due to thermal disturbance is more than that of retrapped electrons. So the integration area of the TL peak reduces. With the in-crease of the delay time, a large number of carriers are re-leased from the shallow trap and migrate in the conduction band. Therefore, the retrapped electrons by the deep trap in-crease sharply. At the same time, only a small amount of electrons are released from the deep trap. So, the retrapped electrons are more than the released electrons. That is why the intensity of the TL peak then increases. With the further increase of the delaying time, electrons in the shallow trap reduce gradually. A large number of electrons in the conduc-tion transfer to the luminescence center and recombine with the opposite charges accompanied with the emission of light. So, the retrapped rate is less than the released rate which re-sults in the decrease of intensity of the TL peak B finally.
In Fig. 5, it can be seen that the positions of TL peak A and B represent a different trend with the increase of delay-ing time. TL peak A shifts to the high temperature area gradually. However, TL peak B shifts to the low temperature area firstly and then shifts to the high temperature area. In order to explain this phenomenon, we introduce defect band[15] and bits type coordinates model proposed by Qiu et al.[16] The schematic diagram of afterglow process is shown in Fig. 7, 1 is the excited process and 2 is the phosphores-cence process; 3 is process of electrons capured by the trap and 4 is the trapped electron to be thermally excited into the conduction band; 5 is the released electrons retrapped by the deep trap.
For TL peak A, compared with electrons in the bottom of defect band, electrons in the upper of defect band are easier released from the traps due to thermal disturbance. Therefore, with the increase of delaying time, electrons released from the upper of defect band are more than that released from the bottom of defect band. So, with the increase of delay time, TL peak A shifts to the high temperature area gradually. For
Fig. 7 Bits type coordinates model of the long afterglow
TL peak B, when the sample is excited by UV light, the trapped electrons tend to occupy the bottom of defect band. Therefore, the retrapped electrons have to occupy the upper of defect band because the bottom of defect band has been filled fully. So, TL peak B shifts to the low temperature area firstly. With a further increase of the delaying time, the number of electrons in the conduction reduces which is re-sponsible for the fact that the retrapped rate is less than the released rate. This caused that to TL peak B shifted to the high temperature area finally.
3 Conclusions
With increasing substitution of Ho3+ ions for the Dy3+ ions in the phosphors Sr3Al2O6:Eu0.01
2+,Dy0.02–x3+,Hox
3+ (x=0, 0.01, 0.02), the initial intensity of the afterglow obviously de-creased. That is to say, afterglow properties were controlla-ble in Sr3Al2O6:Eu0.01
2+,Dy0.02–x3+,Hox
3+ phosphors by the ra-tio of Ho/Dy. A single TL peak was detected for S1. How-ever, both S2 and S3 exhibited two TL peaks, corresponding to different trap energy levels. TL peak A2 and B2 repre-sented a different trend with the increase of delay time, which could be explained by electron transfer between the traps. The results reported in present work were expected to be useful for the further study of the afterglow mechanism.
References:
[1] Jia W Y, Yuan H B, Lu L Z, Liu H M, Yen W M. Phospho-rescent dynamics in SrAl2O4:Eu2 +,Dy3 + single crystal fibers. J. Lumin., 1998, 76: 424.
[2] Teng X M, Zhuang W D, Hu Y S, Zhao C L, He H Q, Huang X W. Effect of flux on the properties of CaAl2O4:Eu2+,Nd3+ long afterglow phosphor. J. Alloys Compd., 2008, 458: 446.
[3] Rezende M V S, Araújo R M, Montes P J R, Valerio M E G.Optical properties of rare-earth doped Sr3Al2O6. Optic Mater., 2010, 32: 1341.
[4] Lin L, Shi C S, Wang Z F, Zhang W P, Yin M. A kinetics model of red long-lasting phosphorescence in MgSiO3:Eu2+, Dy3+,Mn2+. J. Alloys Compd., 2008, 466: 546.
[5] Chang C K, Li W, Huang X J, Wang Z Y, Chen X, Qian X, Guo R, Ding Y L, Mao D L. Photoluminescence and afterglow
LI Ya et al., Effect of electron traps on long afterglow behavior of Sr3Al2O6:Eu0.012+,Dy0.02–x
3+,Hox3+ 109
behavior of Eu2+, Dy3+ and Eu3+, Dy3+ in Sr3Al2O6 matrix. J. Lumin., 2010, 130: 347.
[6] Wu H Y, Hu Y H, Wang Y H, Fu C J. Influence on the lumi-nescence properties of the lattice defects in Sr2MgSi2O7: Eu2+,M (M= Dy3+, La3+ or Na1+). J. Alloys Compd., 2010, 497: 330.
[7] Akiyama M, Xu C N, Nonaka K, Watanabe T. Intense visible light emission from Sr3Al2O6:Eu,Dy. Appl. Phys. Lett., 1998, 73: 3046.
[8] Guo C F, Tang Q, Zhang C X, Huang D X, Su Q. Thermolu-minescent properties of Eu2+ and RE3+ co-doped phosphors CaGa2S4:Eu2+, RE3+ (RE=Ln, excluding Pm, Eu and Lu). J. Lumin., 2007, 126: 333.
[9] Xu X H, Wang Y H, Li Y Q, Gong Y. Energy transfer between Eu2+ and Mn2+ in long-afterglow phosphor CaAl2O4:Eu2+,Nd3+, and Mn2+. J. Appl. Phys., 2009, 105: 0835021.
[10] Lin Y H, Zhang Z T, Tang Z L, Zhang J Y, Zheng Z S, Lu X. The characterization and mechanism of long afterglow in alka-line earth aluminates phosphors co-doped by Eu2O3 and Dy2O3. Mater. Chem. Phys., 2001, 70: 156.
[11] Aitasalo T, Hölsä J, Kirm M, Laamanen T, Lastusaari M, Niit-tykoski J, Raud J, Valtonen R. Persistent luminescence and synchrotron radiation study of the Ca2MgSi2O7:Eu2+,R3+ mate-rials. Radiat. Meas., 2007, 42: 644.
[12] Li C Y, Su Q, Qiu J R. Development of long-lasting phospho-rescent materials doped by re ions. Chin. J. Lumin., 2003, 24: 21.
[13] Lakshminarasimhan N, Varadaraju U V. Luminescence and afterglow in Sr2SiO4:Eu2+,RE3+ [RE=Ce, Nd, Sm and Dy] phosphors—Role of co-dopants in search for afterglow. Mater. Res. Bull., 2008, 43: 2946.
[14] Chen R, Mckeever S W S. Theory of thermoluminescence and related phenomena. Singapore: World Scientific, 1997.
[15] Wu F G, Liu Y Y. Acoustic band gaps and defect states in two- dimensional composite materials. Acta Phys. Sin., 2002, 51: 1434.
[16] Qiu J R, Hirao K. Long lasting phosphorescence in Eu2+-doped calcium alumino borate glasses. Solid State Commun., 1998, 12: 795.