20

Steel and Composite Structures, Vol. 12, No. 1 (2011) 73-92 73
Effect of element interaction and material nonlinearityon the ultimate capacity of stainless steel cross-sections
M. Theofanous1* and L. Gardner
2
1Department of Civil Engineering, Aristotle University of Thessaloniki, Thessaloniki GR-541 24, Greece2Department of Civil and Environmental Engineering, Imperial College London, London SW7 2AZ, UK
(Received January 25, 2011, Revised October 14, 2011, Accepted November 13, 2011)
Abstract. The effect of element interaction and material nonlinearity on the ultimate capacity of stainless steel plated cross-sections is investigated in this paper. The focus of the research lies in cross-sections failing by local buckling; member instabilities, distortional buckling and interactions thereof with local buckling are not considered. The cross-sections investigated include rectangular hollow sections (RHS), I sections and parallel flange channels (PFC). Based on previous finite element investigations of structural stainless steel stub columns, parametric studies were conducted and the ultimate capacity of the aforementioned cross-sections with a range of element slendernesses and aspect ratios has been obtained. Various design methods, including the effective width approach, the direct strength method (DSM), the continuous strength method (CSM) and a design method based on regression analysis, which accounts for element interaction, were assessed on the basis of the numerical results, and the relative merits and weaknesses of each design approach have been highlighted. Element interaction has been shown to be significant for slender cross-sections, whilst the behaviour of stocky cross-sections is more strongly influenced by the material strain-hardening characteristics. A modification to the continuous strength method has been proposed to allow for the effect of element interaction, which leads to more reliable ultimate capacity predictions. Comparisons with available test data have also been made to demonstrate the enhanced accuracy of the proposed method and its suitability for the treatment of local buckling in stainless steel cross-sections.
Keywords: classification, cross-section, element interaction, local buckling, numerical modelling, slenderness, stainless steel, stub column
1. Introduction
Practical applications of stainless steel in construction are growing steadily (Baddoo 2008, Gardner and Ng 2006). Most structural stainless steel components are cold-formed, comprising plated elements of varying slenderness and are hence susceptible to local buckling when subjected to high compressive stresses. The occurrence of local buckling limits the exploitation of the material’s full potential and is particularly detrimental to cross-sections employing high strength stainless steel grades.
The treatment of local buckling within the framework of EN 1993-1-4 (2006), the European structural design rules for stainless steel, draws heavily from the respective design guidance for carbon steel EN 1993-1-1 (2005) and follows the familiar cross-section classification approach. The constituent plate
* Corresponding author, Ph. D., E-mail: [email protected]

74 M. Theofanous and L. Gardner
elements of a cross-section are placed into discrete behavioural classes by comparing their width to thickness ratio with codified slenderness limits, which depend on the element’s boundary conditions, the applied stress gradient and the manufacturing process (whether cold-formed or welded). The cross-section itself is classified according to its most slender constituent element. Since the constituent plate elements are treated in isolation, the effect of element interaction on both the elastic buckling and ultimate response is neglected. Boundary conditions at element junctions are assumed to be simply-supported (i.e., zero rotational stiffness), as reflected in the plate buckling coefficients kσ specified in EN 1993-1-5 (2006). However, the embedded conservatism is not uniform for all cross-sections, but varies, depending on how close the actual boundary conditions are to the assumed ones. In a uniformly compressed square hollow section, for example, the four elements offer equal restraint to one another, effectively resulting in simply-supported boundary conditions for each element. In a uniformly compressed rectangular hollow section, on the other hand, the two shorter faces of the section offer greater restraint to the two longer faces; as the aspect ratio increases, the restraint afforded to the two longer faces increases, and the boundary conditions approach fixed supports.
Ignoring element interaction is a simplifying assumption common to both carbon steel and stainless steel. A further simplifying assumption which has greater significance for stainless steel is that of a bilinear (elastic, perfectly-plastic) material response, which ensures consistency between carbon steel and stainless steel design specifications. The deviation of stainless steel’s stress-strain response from that of carbon steel is depicted in Fig. 1. Despite the absence of a well-defined yield point, an equivalent yield stress, termed the 0.2% proof stress σ0.2, is employed and an elastic, perfectly-plastic material response is assumed for stainless steel as for carbon steel, thereby neglecting the actual material behaviour and pronounced strain-hardening. This assumption is of little significance for very slender elements, the failure of which is governed by stiffness, but severely compromises accuracy and design efficiency in the case of stocky stainless steel plated elements, failure of which is mainly governed by material response.
With the increasing usage of high strength stainless steel grades, which effectively leads to more slender cross-sections, together with the high initial material cost associated with stainless steel, reassessment of the validity of the aforementioned assumptions and elimination of any associated conservatism is warranted. Advanced design methods that allow for element interaction, actual material response or both, which have been previously employed or proposed for carbon steel and/or stainless
Fig. 1 Indicative stainless steel and carbon steel stress-strain behaviour

Effect of element interaction and material nonlinearity on the ultimate capacity of stainless steel cross-sections 75
steel components, are discussed in the following section. The suitability and performance of these methods is assessed thereafter on the basis of a series of FE parametric studies on stainless steel RHS, I sections and PFC stub columns covering a wide range of element slendernesses and aspect ratios.
2. Design methods for the treatment of local buckling
The method of cross-section classification coupled with the effective width approach, which was originally derived for carbon steel (Winter 1947, 1950) and later adapted to stainless steel (Johnson and Winter 1966) is employed in most stainless steel design specifications for the treatment of local buckling (EN 1993-1-4 2006, SEI/ASCE 8-02 2002). The width of any constituent plate element that is classified as Class 4 (slender) is reduced to an effective width (which is a function of the element slenderness) and to account for loss of effectiveness due to local buckling. Although conceptually simple, application of the effective width method is often cumbersome, since having established the effective width of the individual elements, calculation of the properties of the effective cross-section is then required. Moreover, it may have to be applied iteratively, when a shift of a cross-section’s neutral axis and a corresponding modification of the applied stress distribution is caused by the loss of effectiveness of some parts of the cross-section.
As previously discussed, element interaction and material nonlinearity are not accounted for within the classification framework. Failure to account for element interaction leads to overly conservative design for both carbon steel and stainless steel components in cases where the slenderness of the constituent plate elements varies significantly (e.g., RHS with large aspect ratios), whilst less conservativeresults are obtained when all plate elements have similar slenderness (e.g., SHS). On the other hand, the effect of the actual material response on ultimate cross-section capacity is more important for stainless steel due to its pronounced strain-hardening and becomes increasingly significant with decreasing cross-section slenderness.
The shortcomings of the codified provisions have been highlighted by many researchers and more advanced design methods, allowing for element interaction and material strain-hardening, have been proposed. Some of these methods, including a statistical method proposed by Kato (1989, 1990), the Direct Strength Method (DSM) and the Continuous Strength Method (CSM), are briefly summarised in the present paper and assessed on the basis of an extensive FE parametric study. An overview of the methods considered, their origin and whether or not they account for material nonlinearity and element interaction is given in Table 1.
2.1. Ultimate capacity predictions based on regression analysis
In his studies on the rotation capacity of carbon steel structures, Kato (1989, 1990) acknowledged
Table 1 Various design methods for the treatment of local buckling
Design methods Originally devised for Element interaction Material response
Classification / Effective width Hot-rolled steel Not considered Bilinear
Linear regression analysis Hot-rolled I sections Yes Bilinear
Direct strength method Cold-formed steel Yes Bilinear
Continuous strength method Stainless steel Not considered Actual

76 M. Theofanous and L. Gardner
both the mutual restraint between the flanges and the web of I-sections and the strain-hardening exhibited by carbon steel at high strains. He devised a semi-analytical method for predicting the rotation capacity of an I-section as an explicit function of the stress at which local buckling occurs, normalised by the yield stress. The general form of the normalised buckling strength, referred to as σcr/fy (Kato 1989, 1990), is given by Eq. (1)
(1)
where af and aw are slenderness parameters for the flange and the web respectively and A, B and C are parameters determined by multivariable linear regression analysis of stub column test data. In the present paper, the stress at which local buckling occurs is denoted σLB, whilst the equivalent yield stress of stainless steel is taken as the 0.2% proof stress σ0.2.
This method was shown to be quite accurate for carbon steel I section stub columns and was able to correctly predict the ultimate capacity of stocky cross-sections above the yield load, whilst the flange-web interaction was explicitly accounted for. Once calibrated on the basis of stub column tests, the method can be extended to predict the ultimate moment capacity of beams. Daali and Korol (1995) adapted the method to predict the ultimate capacity of carbon steel I section beams, whilst a similar approach was followed by Beg and Hladnik (1996) for high strength steel I section beams.
To date this method has been applied to the prediction of the ultimate capacity of carbon steel and high strength steel I section stub columns and beams failing by local buckling, but is, in principle, applicable to other cross-section types and materials, provided that a sufficiently large set of stub column test data exists for its calibration. Its accuracy, simplicity, explicit nature and its ability to account for both element interaction and strain-hardening, render this method an attractive alternative to cross-section classification. However its mere statistical nature and the need for calibration and derivation of a separate design equation for each cross-section type are its main drawbacks.
2.2. The Direct Strength Method (DSM)
Increasingly sophisticated manufacturing facilities and the desire to minimise material use in cold-formed carbon steel structures have lead to the emergence of very slender cross-sections, frequently employing edge stiffeners and intermediate stiffeners of various geometries to delay the onset of local buckling. The complexity of many recently developed cross-sections and their deviation from the traditional assembly of flat plated elements renders application of the effective width method questionable and awkward. Moreover, optimization of the properties of cold-formed steel cross-sections may result in the triggering of numerous buckling modes (e.g., local, distortional and global) at similar load levels, leading to interaction phenomena.
The cumbersome nature of the effective width method when applied to slender cold-formed steel cross-sections of complex geometries and concerns about its ability to account for all possible failure modes including interaction buckling, led to the development of the Direct Strength Method (DSM) by Schafer and Peköz (1998), a review of which is given by Schafer (2008). The DSM is based on determining the strength of a structural component as an explicit function of its gross cross-sectional properties, elastic critical buckling stresses for all relevant instability modes (i.e., global buckling, local buckling and distortional buckling) and yield strength. To this end, a linear eigenvalue buckling analysis of the full cross-section by means of the constrained finite strip method is utilised (Schafer and
fy
σcr
------- ABaf
---- Caw
-----+ +=

Effect of element interaction and material nonlinearity on the ultimate capacity of stainless steel cross-sections 77
Ádány 2006, Ádány and Schafer 2008) the relevant critical stresses are obtained. In the present paper the software CUFSM (Schafer and Ádány 2006) has been utilised.
The DSM has been calibrated on the basis of numerous test data on cold-formed carbon steel components and has been adopted in the North American (AISI 2004) and Australian (AS/NZS 4600 2005) specifications for cold-formed steel design as an alternative design method to the effective width approach. Following its successful application to cold-formed steel, the DSM was subsequently extended to structural stainless steel members in compression (Becque et al. 2008) and aluminium alloy flexural members (Zhu and Young 2009).
Its versatility, capability of treating complex cross-sections, loading cases and failure modes and ease of application, provided that a suitable software for the calculation of the critical stresses and buckling modes is available, are the main merits of the DSM. It should be noted that the DSM assumes a bilinear elastic-perfectly plastic material response and is therefore best suited to the treatment of slender cross-sections and components, the failure of which is mainly governed by elastic buckling and post-buckling and remains largely unaffected by strain-hardening. The capacity of stocky stainless steel (Becque et al. 2008) and aluminium (Zhu and Young 2009) cross-sections and members is underpredicted by the DSM, since it does not allow for stresses greater than the yield stress σ0.2 to be achieved. Furthermore, DSM does not apply to CHS.
2.3. The Continuous Strength Method (CSM)
The Continuous Strength Method (CSM) was initially proposed for the treatment of local buckling of stainless steel cross-sections (Gardner and Nethercot 2004a, Ashraf et al. 2006a) subjected to compression or/and bending. The basis of the method lies in an experimentally derived ‘base’ curve, calibrated against all available stub column test data, which relates a cross-section’s slenderness, denoted , to its deformation capacity, denoted εLB. The cross-section slenderness is assumed to equal the slenderness of the most slender constituent plate element, determined according to EN 1993-1-4 (2006) and depends on the stress distribution to which the plate element is subjected. The deformation capacity εLB is the maximum attainable strain for a given cross-section in compression or the outer fibre strain of an assumed linear strain distribution of a cross-section in bending. The deformation capacity is utilized in conjunction with an accurate material law, which in the case of stainless steel is a compound Ramberg-Osgood model (Mirambell and Real 2000, Rasmussen 2003), to obtain the corresponding stress σLB. For cross-sections in compression, the local buckling stress σLB is multiplied by the gross cross-section area to yield the cross-section compression resistance Nc,Rd, whereas for cross-sections in bending, the obtained stress distribution is integrated over the cross-section to yield the ultimate moment capacity Mc,Rd.
Additional features of the method include an explicit equation to account for corner strength enhancements (Cruise and Gardner 2008), and member instabilities (Ashraf et al. 2008). The CSM was later adapted for aluminium alloys, high strength steel (Gardner and Ashraf 2006) and carbon steel (Gardner 2008). The method is capable of accurately predicting the ultimate capacity of stocky cross-sections, since it explicitly accounts for strain-hardening and does not impose unnecessary limitations on the maximum attainable stress. However, the method does not account for the effect of element interaction on the local buckling capacity of the cross-section and utilizes only the slenderness of the most slender constituent plate element. This leads to conservative predictions of the capacity of cross-sections consisting of plated elements of varying slenderness and optimistic predictions of the capacity of cross-sections employing elements of similar slenderness (e.g., the capacity of RHS is marginally
λp λp

78 M. Theofanous and L. Gardner
under-predicted whilst that of SHS is marginally over-predicted by Ashraf et al. (2006a)).
3. Numerical modelling
The accuracy of the described design methods is assessed in Section 4 of this paper on the basis of an extensive numerical study conducted on stainless steel stub columns by means of the general purpose finite element (FE) programme ABAQUS (2006). The FE models were developed following the guidelines given by Gardner and Nethercot (2004c) and Ashraf et al. (2006b), which were shown to give accurate capacity predictions. FE models of stainless steel SHS, RHS, PFC, lipped channel section, I section and angle stub columns were developed and validated against 136 test data by Ashraf et al. (2006b). The FE models were shown to marginally over-predict the capacity by 1% with a coefficient of variation of 0.08 and were deemed acceptable for the purpose of the current study.
The cross-sections considered herein include RHS (with SHS as a special case), PFC and I sections with the focus being on local buckling alone. All cross-sections had an outer flange width of 100 mm, whilst the web height and cross-section thickness were varied to obtain a wide range of local slendernesses and aspect ratios. For all RHS and PFC sections the internal root radii were assumed to be equal to the cross-section thickness. A uniform section thickness was assumed for RHS and PFC, whereas two flange-to-web thickness ratios were considered for the I sections. Each stub column length was fixed to three times the largest cross-section dimension. A total of 65 geometric configurations were considered, a summary of which is given in Table 2.
The models were discretized with the reduced integration 4-noded doubly curved general-purpose shell element S4R with finite membrane strains (ABAQUS 2006). Symmetry was exploited to reduce computational time and hence half the cross-sections of the I sections and PFC and a quarter of the RHS were modelled, with suitable boundary conditions applied along the axes of symmetry. All degrees of freedom were fixed at the stub columns’ ends except for the vertical displacement at the loaded edge. Kinematic coupling was employed to impose uniform end-shortening at the loaded edge.
A linear eigenvalue buckling analysis was initially conducted to extract the lowest buckling mode shape for each cross-section; this was thereafter introduced as the geometric imperfection pattern in the subsequently performed geometrically and materially non-linear analyses. Typical lowest elastic buckling mode shapes for the different cross-section types are depicted in Fig. 2. The amplitude of the geometric imperfection was given by a modification to the Dawson and Walker (1972) model, proposedby Gardner and Nethercot (2004c) and Ashraf et al. (2006b). The non-linear analyses employed the modified Riks method (ABAQUS 2006), which enabled tracing the post-ultimate response of the modelled stub columns. All stub columns failed by local buckling as shown in Fig. 3.
The compound Ramberg-Osgood model (Mirambell and Real 2000, Rasmussen 2003) as modified
Table 2 Geometric configurations modelled in the parametric studies
Crosssection
Outer flangewidth (mm)
Ratio of web to flangeouter dimensions
(aspect ratio)
Flange thickness(mm)
Web to flangethickness ratio
No. of geometricconfigurations considered
RHS 100 1, 2, 3 8, 6, 5, 4, 3 1 15
I sections 100 1, 1.5, 2 8, 6, 5, 4, 3 1, 0.6 30
PFC 100 1, 2, 3, 4 8, 6, 5, 4, 3 1 20

Effect of element interaction and material nonlinearity on the ultimate capacity of stainless steel cross-sections 79
by Gardner and Nethercot (2004a, 2004c) was incorporated in the FE models in the true stress-logarithmic plastic strain format. Two sets of material properties were considered in the parametric studies for each modelled cross-section, resembling a typical austenitic stainless steel and a typical duplex stainless steel. For both materials, the Young’s modulus E was taken as 200000 N/mm2 and typical values for the ratio of 1% proof stress to 0.2% proof stress σ1.0 / σ0.2, and strain-hardening exponentsn and n0.2,1.0 obtained by averaging numerous coupon test results, were adopted. The considered 0.2% proof stresses σ0.2 were 306.1 N/mm2 and 592 N/mm2 for the austenitic and duplex material respectively,
Fig. 2 Typical lowest elastic buckling mode shapes for stub columns
Fig. 3 Typical stub column failure modes

80 M. Theofanous and L. Gardner
in accordance with the statistical analysis on mill certificate data carried out by Groth and Johansson (1990). All adopted material properties are given in Table 3.
Given the inherent high scatter and uncertainty in the distribution and magnitude of the residual stresses and the small effect they have been found to have on the ultimate capacity of stainless steel stub columns (Gardner and Nethercot 2004c, Ashraf et al. 2006b), it was decided not to explicitly incorporateresidual stresses in the models. Moreover, it was decided not to explicitly incorporate the enhanced corner properties typically present in press-braked (PFC) and roll-formed (RHS) (Cruise and Gardner 2008) sections, since the parametric studies focus on determining the effect of element interaction on the ultimate capacity of stub columns rather than on replicating test data. For simplicity, the design methods outlined in the preceding section are calibrated, and their accuracy is assessed, assuming uniform material properties throughout the whole cross-section. In this way the accuracy of each design approach solely depends on the method’s ability to account for element interaction and actual material response, after which, the effect of corner enhancements on ultimate capacity can be added (Gardner and Nethercot 2004a, Ashraf et al. 2006b, Cruise and Gardner 2008).
4. Assessment of the design methods
The ultimate capacities of the 130 modelled stub columns are utilised in this section to assess the suitability of the various design methods for the treatment of local buckling of stainless steel cross-sections and highlight their relative merits and drawbacks. The cross-section classification procedure with the slenderness limits codified in EN 1993-1-4 (2006) is utilized in conjunction with effective width equations for Class 4 internal and outstand elements, also specified therein, to predict the ultimate capacity of the modelled stub columns. Additionally, a modified version of the classification procedure with revised slenderness limits and effective width equations recently proposed by Gardner and Theofanous (2008), which is based upon a statistical analysis of all available test data, is also assessed. The revised effective width equations for outstand elements and internal elements are given by Eqs. (2) and (3) respectively.
(2)
(3)
where ρ is the reduction factor due to local buckling and is the plate slenderness.The ultimate capacity predictions of the codified (EN 1993-1-4 2006) and revised (Gardner and
Theofanous 2008) effective width equations are normalized by the squash load (Aσ0.2) and plotted
ρ 1
λp
----- 0.188
λp2
------------- 1≤–=
ρ 0.772
λp
------------- 0.079
λp2
------------- 1≤–=
λp fy/σcr=
Table 3 Material properties employed in the parametric studies
Material E (N/mm2) σ0.2 (N/mm2) σ1.0 / σ0.2 n n0.2,1.0
Austenitic 200000 306.1 1.20 5.6 2.7
Duplex 200000 592.0 1.15 5.0 3.4
Effect of element interaction and material nonlinearity on the ultimate capacity of stainless steel cross-sections 81
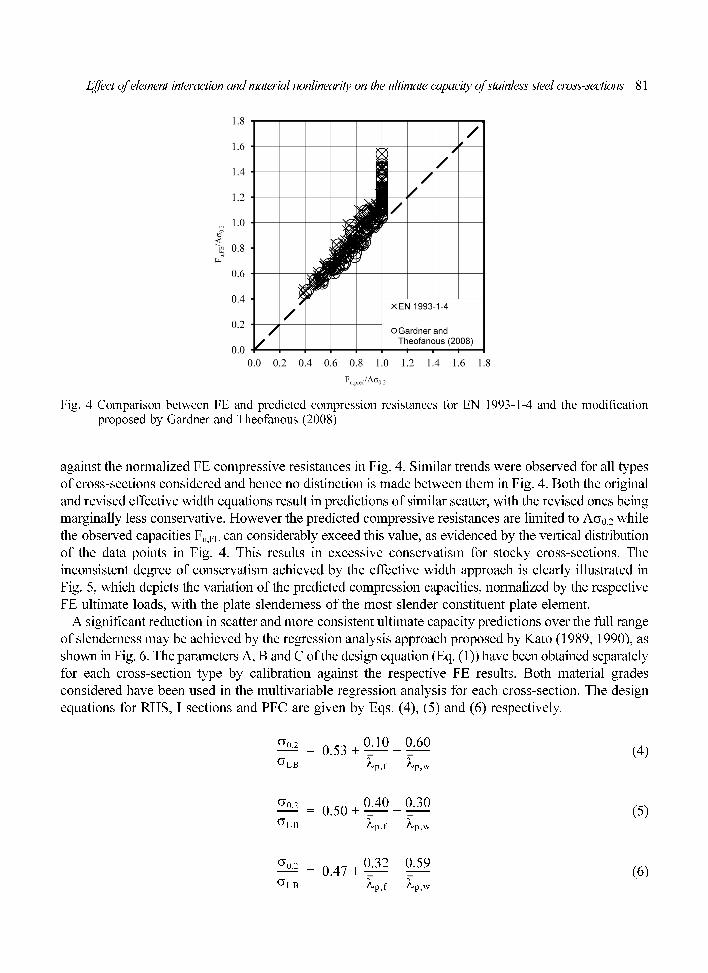
against the normalized FE compressive resistances in Fig. 4. Similar trends were observed for all types of cross-sections considered and hence no distinction is made between them in Fig. 4. Both the original and revised effective width equations result in predictions of similar scatter, with the revised ones being marginally less conservative. However the predicted compressive resistances are limited to Aσ0.2 while the observed capacities Fu,FE can considerably exceed this value, as evidenced by the vertical distribution of the data points in Fig. 4. This results in excessive conservatism for stocky cross-sections. The inconsistent degree of conservatism achieved by the effective width approach is clearly illustrated in Fig. 5, which depicts the variation of the predicted compression capacities, normalized by the respective FE ultimate loads, with the plate slenderness of the most slender constituent plate element.
A significant reduction in scatter and more consistent ultimate capacity predictions over the full range of slenderness may be achieved by the regression analysis approach proposed by Kato (1989, 1990), as shown in Fig. 6. The parameters A, B and C of the design equation (Eq. (1)) have been obtained separately for each cross-section type by calibration against the respective FE results. Both material grades considered have been used in the multivariable regression analysis for each cross-section. The design equations for RHS, I sections and PFC are given by Eqs. (4), (5) and (6) respectively.
(4)
(5)
(6)
σ0.2
σLB
--------- 0.530.10
λp,f
---------- 0.60
λp,w
----------+ +=
σ0.2
σLB
--------- 0.500.40
λp,f
---------- 0.30
λp,w
----------+ +=
σ0.2
σLB
--------- 0.470.32
λp,f
---------- 0.59
λp,w
----------+ +=
Fig. 4 Comparison between FE and predicted compression resistances for EN 1993-1-4 and the modification proposed by Gardner and Theofanous (2008)

82 M. Theofanous and L. Gardner
It should be noted that in the investigations carried out by Kato (1989, 1990), Daali and Korol (1995) and Beg and Hladnik (1996), the squares of the flange slenderness and the web slenderness were incorporated into the design equations. The reasoning for this stems from definition of the slenderness as the square root of the yield stress σ0.2 divided by the elastic critical plate buckling stress σcr. This is not necessarily appropriate however for ultimate capacity, since, when post-buckling effects are considered, normalized capacity tends towards rather than . In the present paper, regressionanalysis has been based on the flange slenderness and the web slenderness , rather than their squares, as this was shown to result in more consistent predictions.
The direct strength equation utilized in the present study (Eq. (7)) is the one proposed by Becque et al
1/λp 1/λp2
λp,f λp,w
Fig. 5 Accuracy of EN 1993-1-4 and its proposed modification (Gardner and Theofanous 2008) as a function of slenderness
Fig. 6 Comparison between FE and predicted compression resistances for the regression analysis approach

Effect of element interaction and material nonlinearity on the ultimate capacity of stainless steel cross-sections 83
(2008) for stainless steel members, which, in the absence of member buckling, reads
(7)
where Ncl is the axial resistance accounting for local buckling according to the DSM and , in which σcrl is the elastic critical local buckling stress of the cross-section.
A comparison between the normalised FE resistance and that predicted by the DSM is shown in Fig. 7. As expected the DSM suffers from the same shortcoming as the effective width approach due to the limitation of the maximum attainable stress; stresses beyond the σ0.2 are not allowed, and hence strain-hardening of stocky cross-sections is not accounted for, whilst similar scatter to the effective width approach is displayed. It should be noted that the direct strength equation Eq. (7) has been calibrated by Becque et al. (2008) against numerous test data involving local, distortional and member buckling and is hence capable of dealing with more complex failure modes and their interactions, whereas all other method considered focus on local buckling alone.
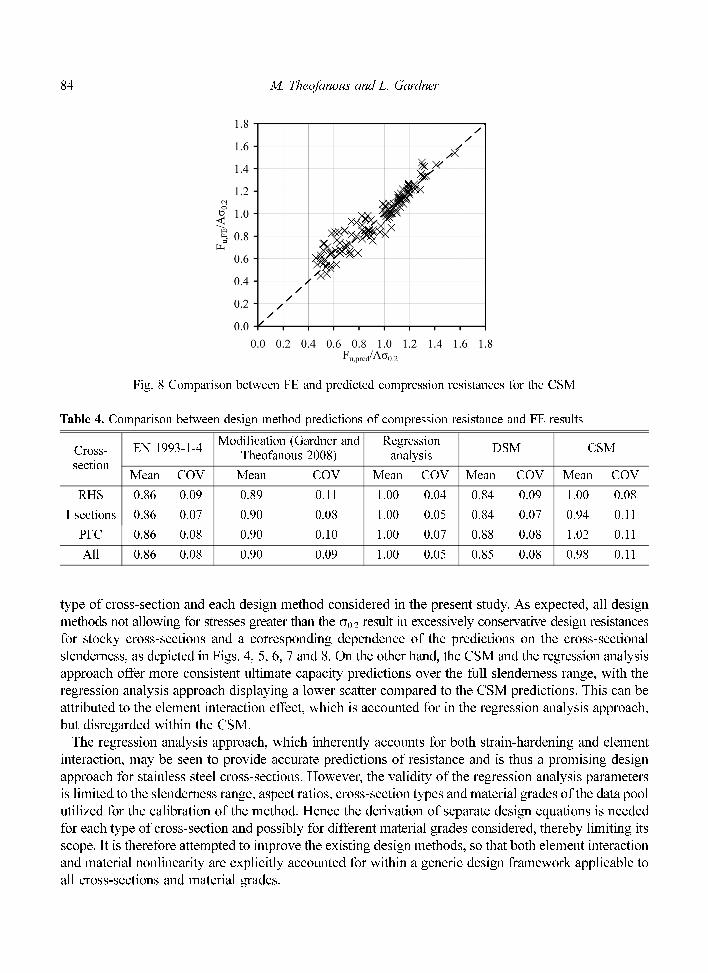
The CSM predictions are compared with the FE compressive resistances in Fig. 8. The normalized local buckling strain is determined from the slenderness of the most slender constituent plate element by means of Eq. (8)
(8)
where ε0 is the elastic strain corresponding to the σ0.2 proof stress (ε0 = σ0.2/E)An overview of the accuracy attained by each method is given in Table 4, where the mean value and
coefficient of variation of the predicted capacities normalized by the FE ultimate load are given for each
Ncl
Aσ0.2 for λ1 0.55≤
0.95λ1
---------- 0.22
λ1
2----------–⎝ ⎠
⎛ ⎞Aσ0.2 for λ1 0.55>⎩⎪⎨⎪⎧
=
λ1
σ0.2
σcrl
--------=
εLBε0
-------- 1.43
λp
2.71 0.69λp–--------------------------=
Fig. 7 Comparison between FE and predicted compression resistances for the DSM
84 M. Theofanous and L. Gardner
type of cross-section and each design method considered in the present study. As expected, all design methods not allowing for stresses greater than the σ0.2 result in excessively conservative design resistancesfor stocky cross-sections and a corresponding dependence of the predictions on the cross-sectional slenderness, as depicted in Figs. 4, 5, 6, 7 and 8. On the other hand, the CSM and the regression analysis approach offer more consistent ultimate capacity predictions over the full slenderness range, with the regression analysis approach displaying a lower scatter compared to the CSM predictions. This can be attributed to the element interaction effect, which is accounted for in the regression analysis approach, but disregarded within the CSM.
The regression analysis approach, which inherently accounts for both strain-hardening and element interaction, may be seen to provide accurate predictions of resistance and is thus a promising design approach for stainless steel cross-sections. However, the validity of the regression analysis parameters is limited to the slenderness range, aspect ratios, cross-section types and material grades of the data pool utilized for the calibration of the method. Hence the derivation of separate design equations is needed for each type of cross-section and possibly for different material grades considered, thereby limiting its scope. It is therefore attempted to improve the existing design methods, so that both element interaction and material nonlinearity are explicitly accounted for within a generic design framework applicable to all cross-sections and material grades.
Table 4. Comparison between design method predictions of compression resistance and FE results
Cross-section
EN 1993-1-4 Modification (Gardner and Theofanous 2008)
Regressionanalysis DSM CSM
Mean COV Mean COV Mean COV Mean COV Mean COV
RHS 0.86 0.09 0.89 0.11 1.00 0.04 0.84 0.09 1.00 0.08
I sections 0.86 0.07 0.90 0.08 1.00 0.05 0.84 0.07 0.94 0.11
PFC 0.86 0.08 0.90 0.10 1.00 0.07 0.88 0.08 1.02 0.11
All 0.86 0.08 0.90 0.09 1.00 0.05 0.85 0.08 0.98 0.11
Fig. 8 Comparison between FE and predicted compression resistances for the CSM

Effect of element interaction and material nonlinearity on the ultimate capacity of stainless steel cross-sections 85
5. The continuous strength method allowing for element interaction
As previously discussed, the DSM accounts for element interaction and the CSM accounts for material nonlinearity. Hence the DSM seems the appropriate design approach for slender cross-sections, which are least affected by material nonlinearity, whereas the CSM should be used for stocky cross-sections, where strain-hardening is significant. However the majority of stainless steel cross-sections used in structural applications are affected by both element interaction and material nonlinearity, and hence a combination of the merits of both design methods is desirable.
Expanding the DSM to account for material nonlinearity by specifying direct strength equations that are not bounded by the σ0.2 would alleviate the embedded conservatism. However the format of the direct strength equations incorporates only the conventional yield stress σ0.2 and Young’s modulus E, since it was originally derived for carbon steel. Hence different design equations should be specified for different material grades. On the other hand the CSM relies on relating the cross-sectional geometry to its deformation capacity and thereafter obtaining the ultimate resistance via accurate material modeling; hence the geometrical effects are decoupled from the effect of material nonlinearity. It is therefore attempted to improve the CSM so that element interaction is explicitly accounted for.
To this end, the definition of the cross-sectional slenderness utilized in the DSM is adopted herein as a modification to the CSM; hence the critical buckling stress of the whole cross-section, derived by means of CUFSM (Schafer and Ádány 2006), is incorporated into the definition of cross-section slenderness. The cross-section slenderness is thereafter utilized to obtain the normalized deformation capacity εLB / ε0, and finally the stress at failure σLB via the compound Ramberg-Osgood constitutive law. The CSM design equation (Eq. (8)) has to be modified in light of the revised slenderness definition. The modified CSM equation Eq. (9), as derived on the basis of the FE results, reads
(9)
where λ1 is the local buckling slenderness of the whole cross-section, which it is proposed to be employed in place of the slenderness of the most slender plate element , as utilised in the original CSM.
The predictions of the modified CSM are plotted together with those of the original CSM in Fig. 9, where a significant reduction in scatter may be observed. The curves defined by Eqs. (8) and (9) have a minimum at and therefore overpredict the deformation capacity εLB and hence the failure stress σLB of cross-sections beyond this slenderness value. Moreover, it has been observed in previous studies (Gardner and Nethercot 2004a, Ashraf et al. 2006a, Ashraf et al. 2008) that the CSM overestimatesthe ultimate capacity of very slender cross-sections. For these reasons and given that the importance of strain-hardening vanishes at high slenderness, it is proposed that the applicability of the CSM is limited to a maximum slenderness value. An upper slenderness limit = 1.8 (or = 1.8 when using the most slender element) is therefore proposed herein. Cross-sections of higher slenderness should be designed according to the effective width approach or the DSM. Additionally, adoption of an upper limit of εLB / ε0 = 15 on the exploitation of strain-hardening, in accordance with the minimum ductility requirements specified in EN 1993-1-4 (2006) and EN 1993-1-1 (2005), is also proposed. The new CSM curve relating the cross-section slenderness to its deformation capacity is plotted together with the original CSM curve and the elastic critical buckling curve in Fig. 10. The proposed limitations on slenderness and deformation capacity are also depicted as cut-offs on the CSM curve.
εLBε0
-------- 1.22
λ1
2.71 0.69λ1–------------------------ 15 for λ1 1.8≤≤=
λp
λp 2.2≈
λ1 λp

86 M. Theofanous and L. Gardner
The accuracy of the modified CSM is assessed in Table 5. The mean values and coefficients of variation of the predicted ultimate capacities normalized by the corresponding FE capacities are shown for each cross-section type and for the original CSM, the modified CSM without slenderness and deformation capacity limitations and the modified CSM with limitations. It can be seen that, while the mean predictions are similar, significant reductions in scatter are achieved by the modified CSM compared to the original proposal. The bounds imposed on the slenderness and deformation capacity do not significantly affect the results, since the vast majority (118/130) of the FE data considered lie within the specified limits.
6. Comparison with test data
In this section, the accuracy of the modified CSM, including the proposed limitations on deformation
Fig. 9 Comparison between FE and predicted compression resistances for the original and modified CSM
Fig. 10 Elastic critical buckling curve, original CSM design curve and modified CSM design curve

Effect of element interaction and material nonlinearity on the ultimate capacity of stainless steel cross-sections 87
capacity and slenderness, is assessed on the basis of available test data. To this end, all published test data on stainless steel stub columns comprising I sections, RHS and PFC, summarized in Table 6, have been gathered. These include test data published by Kuwamura (2003), ECSC (2000), Gardner and Nethercot (2004a), Talja and Salmi (1995), Rasmussen and Hancock (1993a), Liu and Young (2003), Young and Liu (2003), Young and Lui (2006), Young and Ellobody (2006), Gardner et al. (2006) and Theofanous and Gardner (2009). The predictions of the other four methods considered in the present paper are also assessed. The effect of the corner strength enhancements is accounted for via a corner enhancement factor derived according to the proposals of Ashraf et al. (2006a), Cruise and Gardner (2008) and Ashraf et al. (2008), which is multiplied by the regression analysis, original CSM and modified CSM predictions. No account for the corner enhancements was taken for the remaining
Table 5 Comparison of original and modified CSM predictions of compression resistance with FE results
CrosssectionOriginal CSM CSM with element interaction CSM with element
interaction and cutoffs
Mean COV Mean COV Mean COV
RHS 1.00 0.08 0.96 0.08 0.96 0.08
I sections 0.94 0.11 0.96 0.09 0.97 0.08
PFC 1.02 0.11 1.00 0.04 0.99 0.04
All 0.98 0.11 0.97 0.08 0.97 0.07
Table 6 Summary of available stub column test data
Reference Section type No. of tests Material grade
Kuwamura (2003)
Channel 11
1.4301 1.4318I (welded) 16
SHS 12
ECSC (2000) I (welded) 4 1.4301 1.4462
Gardner and Nethercot (2004a)SHS 17
1.4301RHS 16
Talja and Salmi (1995)SHS 1
1.4301RHS 2
Rasmussen and Hancock (1993a) SHS 2 1.4306
Liu and Young (2003) SHS 4 1.4301
Young and Liu (2003) RHS 8 1.4301
Young and Lui (2006)SHS 6
DuplexRHS 3
Young and Ellobody (2006)SHS 2
1.4462RHS 3
Gardner et al. (2006)SHS 4
1.4318RHS 4
Theofanous and Gardner (2009)SHS 6
1.4162RHS 2

88 M. Theofanous and L. Gardner
design methods. The mean values and coefficients of variation of the predicted ultimate capacities normalized by the
corresponding test results are shown in Table 7, whereas comparisons of the predictions with both test and FE results are displayed in Table 8. Similarly to the comparison based on FE results (Table 5), all methods not accounting for material strain-hardening significantly underpredict the compressive resistance and display a relatively large scatter in the predictions, mainly due to their poor predictions of the capacity of stocky cross-sections. As before, the regression analysis approach and the CSM (both original and modified) offer more accurate predictions and a significant reduction in scatter, with the modified CSM displaying the lowest coefficient of variation of 0.08.
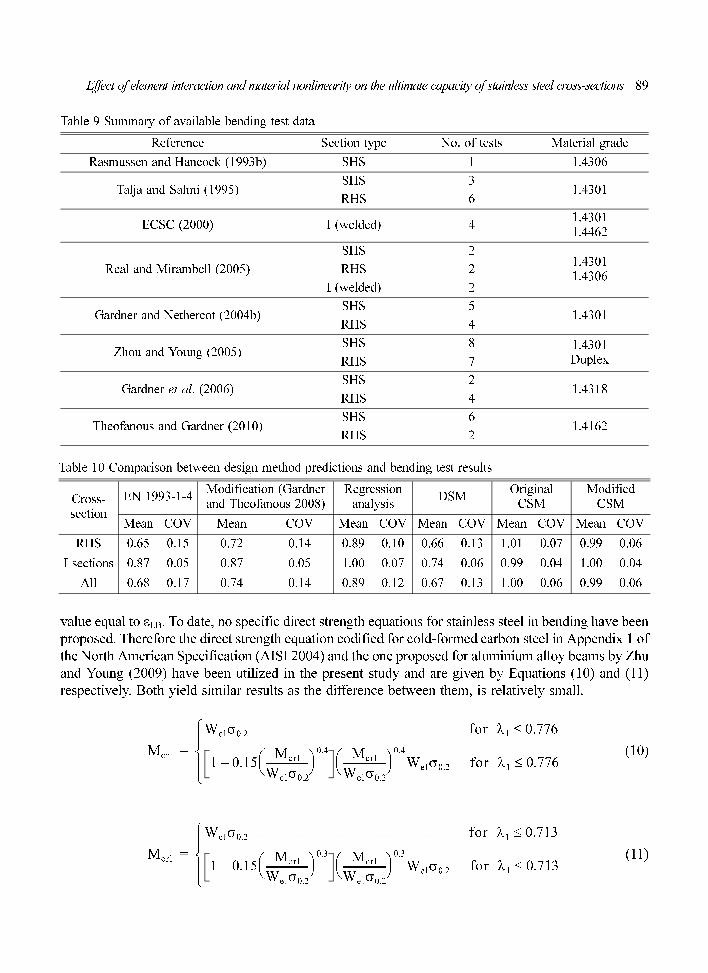
The accuracy of the various design methods in predicting the cross-section capacity of beams tested in 3- and 4-point bending is also assessed. All relevant published test data on stainless steel beams (reported by Rasmussen and Hancock (1993b), Talja and Salmi (1995), ECSC (2000), Real and Mirambell (2005), Gardner and Nethercot (2004b), Zhou and Young (2005), Gardner et al. (2006) and Theofanous and Gardner (2010)), have been collected and are summarized in Table 9. However the tests reported by Zhou and Young (2005) could not be utilized to assess the CSM, as insufficient data on material strain-hardening were reported. For consistency, the tests reported by Zhou and Young (2005) were also disregarded for the remaining design methods.
The effect of the stress gradient on the web slenderness was accounted for by means of the appropriate buckling factor kσ specified in EN 1993-1-5 (2005). For the effective width approach, the original version of the CSM and the regression analysis method, the design equations specified for compression were then used. For the modified CSM and the DSM the slenderness of the cross-sections subjected to bending was obtained by performing constrained finite strip analyses with the CUFSM software (Schafer and Ádány 2006). Within the framework of the CSM (both original and modified), the ultimate moment resistance was determined by means of numerical integration of the stress distribution, which was derived from an assumed linearly-varying strain distribution with an extreme
Table 7 Comparison between design method predictions and stub column test results
Cross-section
EN 1993-1-4 Modification (Gardner and Theofanous, 2008)
Regressionanalysis DSM Original
CSMModified
CSM
Mean COV Mean COV Mean COV Mean COV Mean COV Mean COV
RHS 0.81 0.14 0.83 0.15 1.00 0.11 0.79 0.14 1.01 0.13 1.00 0.09
I sections 0.90 0.10 0.94 0.11 1.09 0.09 0.93 0.10 1.00 0.09 1.02 0.06
PFC 0.85 0.11 0.90 0.12 1.03 0.04 0.88 0.11 1.02 0.10 1.05 0.05
All 0.83 0.14 0.86 0.15 1.02 0.10 0.82 0.15 1.01 0.12 1.01 0.08
Table 8 Comparison between design method predictions and stub column test and FE results
Cross-section
EN 1993-1-4 Modification (Gardner and Theofanous 2008)
Regressionanalysis DSM Original
CSMModified
CSM
Mean COV Mean COV Mean COV Mean COV Mean COV Mean COV
RHS 0.82 0.13 0.81 0.15 1.00 0.09 0.81 0.14 1.01 0.12 0.99 0.09
I sections 0.87 0.08 0.91 0.09 1.02 0.07 0.86 0.09 0.96 0.11 0.98 0.09
PFC 0.86 0.08 0.90 0.10 1.01 0.06 0.88 0.08 1.02 0.10 1.01 0.05
All 0.84 0.11 0.88 0.13 1.01 0.08 0.84 0.12 1.00 0.12 0.99 0.08
Effect of element interaction and material nonlinearity on the ultimate capacity of stainless steel cross-sections 89
value equal to εLB. To date, no specific direct strength equations for stainless steel in bending have been proposed. Therefore the direct strength equation codified for cold-formed carbon steel in Appendix 1 of the North American Specification (AISI 2004) and the one proposed for aluminium alloy beams by Zhu and Young (2009) have been utilized in the present study and are given by Equations (10) and (11) respectively. Both yield similar results as the difference between them, is relatively small.
(10)
(11)
Mcrl
Welσ0.2 for λ1 0.776≤
1 0.15Mcrl
Welσ0.2
-----------------⎝ ⎠⎛ ⎞
0.4
–Mcrl
Welσ0.2
-----------------⎝ ⎠⎛ ⎞
0.4
Welσ0.2 for λ1 0.776≤⎩⎪⎨⎪⎧
=
Mcrl
Welσ0.2 for λ1 0.713≤
1 0.15Mcrl
Welσ0.2
-----------------⎝ ⎠⎛ ⎞
0.3
–Mcrl
Welσ0.2
-----------------⎝ ⎠⎛ ⎞
0.3
Welσ0.2 for λ1 0.713≤⎩⎪⎨⎪⎧
=
Table 9 Summary of available bending test data
Reference Section type No. of tests Material grade
Rasmussen and Hancock (1993b) SHS 1 1.4306
Talja and Salmi (1995)SHS 3
1.4301RHS 6
ECSC (2000) I (welded) 4 1.43011.4462
Real and Mirambell (2005)
SHS 21.43011.4306RHS 2
I (welded) 2
Gardner and Nethercot (2004b)SHS 5
1.4301RHS 4
Zhou and Young (2005)SHS 8 1.4301
DuplexRHS 7
Gardner et al. (2006)SHS 2
1.4318RHS 4
Theofanous and Gardner (2010)SHS 6
1.4162RHS 2
Table 10 Comparison between design method predictions and bending test results
Cross-section
EN 1993-1-4 Modification (Gardnerand Theofanous 2008)
Regressionanalysis DSM Original
CSMModified
CSM
Mean COV Mean COV Mean COV Mean COV Mean COV Mean COV
RHS 0.65 0.15 0.72 0.14 0.89 0.10 0.66 0.13 1.01 0.07 0.99 0.06
I sections 0.87 0.05 0.87 0.05 1.00 0.07 0.74 0.06 0.99 0.04 1.00 0.04
All 0.68 0.17 0.74 0.14 0.89 0.12 0.67 0.13 1.00 0.06 0.99 0.06

90 M. Theofanous and L. Gardner
where Mcrl is the elastic critical moment causing local buckling of the cross-section.The predictions of all design methods, normalised by the respective test results, are summarized in
Table 10, from which similar conclusions to the ones mentioned for the case of compression can be drawn. The low coefficient of variation exhibited by the modified CSM for both compression (0.08) and bending (0.06) is due to the incorporation of both element interaction and material nonlinearity in the design approach and demonstrates the applicability of the method for the treatment of local buckling of stainless steel cross-sections.
7. Conclusions
Various design methods for the treatment of local buckling in stainless steel cross-sections have been outlined in the present paper and their relative merits and drawbacks have been highlighted. Among the methods considered, the cross-section classification coupled with effective width approach is the simplest from a conceptual point of view, as it treats plate elements individually and assumes a bilinear elastic perfectly-plastic material constitutive law. More advanced methods include the direct strength method (DSM), which accounts for element interaction but not for material strain-hardening, the continuous strength method (CSM), which accounts for the material strain-hardening but ignores element interaction, and a method based on regression analysis, which accounts implicitly for both element interaction and material nonlinearity.
Based on an extensive parametric study on stainless steel stub columns, all methods have been assessed and the value of incorporating both element interaction and material nonlinearity within one design method was highlighted. A modification to the CSM, by redefining the considered slenderness to include element interaction, has been described. The modified CSM combines the merits of both the original CSM and the DSM and has been shown to offer accurate capacity predictions for cross-sections in compression, based on both FE and published test results from the literature. Furthermore the applicability of the method to cross-sections subjected to bending has been demonstrated and the incorporation of the method into future design guidance is proposed.
References
ABAQUS. (2006), ABAQUS/Standard user’s manual volumes I-III and ABAQUS CAE manual. Version 6.6. (Pawtucket, USA): Hibbitt, Karlsson & Sorensen, Inc.
Ádány, S. and Schafer, B.W. (2008), “A full modal decomposition of thin-walled, single-branched open cross-section members via the constrained finite strip method”, J. Constr. Steel Res., 64(1), 12-29.
American Society of Civil Engineers (ASCE) (2002), Specification for the design of cold-formed stainless steel structural members (SEI/ASCE 8-02).
Ashraf, M., Gardner, L. and Nethercot, D.A. (2006a), “Compression strength of stainless steel cross-sections”, J. Constr. Steel Res., 62(1-2), 105-115.
Ashraf, M., Gardner, L. and Nethercot, D.A. (2006b), “Finite element modelling of structural stainless steel cross-sections”, Thin Wall Struct., 44(10), 1048-1062.
Ashraf, M., Gardner, L. and Nethercot, D. A. (2008), “Structural stainless steel design: Resistance based on deformation capacity”, J. Struct. Eng., ASCE, 134(3), 402-411.
Baddoo, N. R. (2008), “Stainless steel in construction: A review of research, applications, challenges and opportunities”, J. Constr. Steel Res., 64(11), 1199-1206.
Beg, D. and Hladnik, L. (1996), “Slenderness limit of class 3 I cross-sections made of high strength steel”, J.
Effect of element interaction and material nonlinearity on the ultimate capacity of stainless steel cross-sections 91
Constr. Steel Res., 38(3), 201-217.Becque, J., Lecce, M. and Rasmussen, K.J.R. (2008), “The direct strength method for stainless steel compression
members”, J. Constr. Steel Res., 64(11), 1231-1238.Cruise, R.B. and Gardner, L. (2008), “Strength enhancements induced during cold forming of stainless steel
sections”, J. Constr. Steel Res., 64(11), 1310-1316.Daali, M.L. and Korol, R.M. (1995), “Prediction of local buckling and rotation capacity at maximum moment”,
J. Constr. Steel Res., 32(1), 1-13. Dawson, R.G. and Walker, A.C. (1972), “Post-buckling of geometrically imperfect plates”, J. Struct. Div., ASCE,
98(1), ST1, 75-94.ECSC (2000), Final Report. ECSC project-Development of the use of stainless steel in construction. Document
RT810, Contract No. 7210 SA/ 842, The Steel Construction Institute, UK.EN 1993-1-1 (2005) Eurocode 3. Design of Steel Structures: Part 1-1: General rules and rules for buildings,
CEN.EN 1993-1-4. (2006) Eurocode 3: Design of steel structures - Part 1.4: General rules - Supplementary rules for
stainless steel, CEN.EN 1993-1-5 (2006), Eurocode 3. Design of Steel Structures: Part 1-5: Plated structural elements, CEN.Gardner, L. (2008), “The continuous strength method”, Proceedings of the Institution of Civil Engineers-
Structures and Buildings, 161(3), 127-133. Gardner, L. and Ashraf, M. (2006), “Structural design for non-linear metallic materials”, Eng. Struct., 28(6), 926-
934.Gardner, L. and Nethercot, D.A. (2004a), “Experiments on stainless steel hollow sections - Part 1: Material and
cross-sectional behaviour”, J. Constr. Steel Res., 60(9), 1291-1318.Gardner L. and Nethercot D.A. (2004b), “Experiments on stainless steel hollow sections - Part 2: Member
behaviour of columns and beams”, J. Constr. Steel Res., 60(9), 1319-1332.Gardner, L. and Nethercot D.A. (2004c), “Numerical Modeling of Stainless Steel Structural Components-A
Consistent Approach”, J. Struct. Eng., ASCE, 130(10), 1586-1601.Gardner, L. and Ng, K. T. (2006). “Temperature development in structural stainless steel sections exposed to
fire”, Fire Safety Journal, 41(3), 185-203.Gardner, L., Talja, A. and Baddoo, N. (2006), “Structural design of high-strength austenitic stainless steel”, Thin
Wall Struct., 44(5), 517-528.Gardner, L. and Theofanous, M. (2008), “Discrete and continuous treatment of local buckling in stainless steel
elements”, J. Constr. Steel Res., 64(11), 1207-1216. Groth, H.L. and Johansson, R.E. (1990), “Statistics of the mechanical strength of stainless steels”, Proceeding of
the Nordic Symposium on Mechanical Properties of Stainless Steels SIMR, Sigtuna, Sweden, October, 17-31.Johnson, A.L. and Winter, G. (1966), “Behaviour of stainless steel columns and beams”, J. Struct. Div., ASCE,
ST5, 97-118.Kato B. (1989), “Rotation capacity of H-section members as determined by local buckling”, J. Constr. Steel Res.,
13(2-3), 95-109.Kato B. (1990), “Deformation capacity of steel structures”, J. Constr. Steel Res., 17(1-2), 33-94.Kuwamura H. (2003), “Local buckling of thin-walled stainless steel members”, Steel Structures, 3, 191–201.Liu Y. and Young B. (2003), “Buckling of stainless steel square hollow section compression members”, J.
Constr. Steel Res., 59(2), 165–177.Mirambell, E. and Real, E. (2000), “On the calculation of deflections in structural stainless steel beams: an
experimental and numerical investigation”, J. Constr. Steel Res., 54(1), 109-133.North American Specification. (2004), “Appendix 1: Design of cold-formed steel structural members using the
Direct Strength Method”, In: 2004 supplement to the North American Specification for the design of cold-formedsteel structures. Washington (DC): American Iron and Steel Institute.
Rasmussen, K.J.R. (2003), “Full-range stress-strain curves for stainless steel alloys”, J, Constr. Steel Res., 59(1), 47-61.
Rasmussen K.J.R. and Hancock G.J. (1993a), “Design of cold-formed stainless steel tubular members. I: Columns”, J. Struct. Eng., ASCE, 119(8), 2349-2367.
Rasmussen, K.J.R. and Hancock, G.J. (1993b), “Design of cold-formed stainless steel tubular members II:

92 M. Theofanous and L. Gardner
Beams”, J. Struct. Eng., ASCE, 119(8), 2368-2386.Real, E. and Mirambell, E. (2005), “Flexural behaviour of stainless steel beams”, Eng. Struct., 27(10), 1465-
1475.Schafer, B.W. (2008), “Review: The Direct Strength Method of cold-formed steel member design”, J. Constr.
Steel Res., 64(7-8), 766-778.Schafer, B.W., Ádány, S. (2006), “Buckling analysis of cold-formed steel members using CUFSM: conventional
and constrained finite strip methods”, Eighteenth International Specialty Conference on Cold-Formed Steel Structures, Orlando, FL. October.
Schafer, B.W, Peköz, T. (1998), “Direct strength prediction of cold-formed steel members using numerical elastic buckling solutions”. In: Shanmugam N., Liew, J., Thevendran, V. editors. Thin-walled structures, research and developments. NewYork: Elsevier, 137-144.
Standards Australia (2005), “Cold-formed steel structures. AS/NZS 4600: 2005”, Sydney, Australia.Talja A. and Salmi P. (1995), “Design of stainless steel RHS beams, columns and beam–columns”, Research
note 1619. Finland: VTT Building Technology. Theofanous, M. and Gardner, L. (2009), “Testing and numerical modelling of lean duplex stainless steel hollow
section columns”, Eng. Struct., 31(12), 3047-3058.Theofanous, M. and Gardner, L. (2010), “Experimental and numerical studies of lean duplex stainless steel
beams”, J. Constr. Steel Res., 66(6), 816-825.Winter, G. (1947), “Strength of thin steel compression flanges”, Bulletin No. 35/3, Engrg. Experiment Sta.,
Cornell University, Ithaca, N.Y.Winter, G. (1950), “Performance of thin steel compression flanges”, Bulletin No. 33, Engrg. Experiment Sta.,
Cornell University, Ithaca, N.Y.Young, B. and Ellobody, E. (2006), “Experimental investigation of concrete-filled cold-formed high strength
stainless steel tube columns”, J. Constr. Steel Res., 62(5), 484-492.Young, B. and Liu, Y. (2003), “Experimental investigation of cold-formed stainless steel columns”, J. Struct.
Eng., ASCE, 129(2), 169-176.Young, B. and Lui, W. M. (2006), “Tests of cold formed high strength stainless steel compression members”,
Thin Wall Struct., 44(2), 224-234.Zhou, F. and Young, B. (2005), “Tests of cold-formed stainless steel tubular flexural members”, Thin Wall
Struct., 43(9), 1325-1337.Zhu, J.-H. and Young, B. (2009), “Design of aluminium alloy flexural members using the direct strength
method”, J. Struct. Eng., ASCE, 135(5), 558-566.
DN


