Effect of Entrained Air on Strength and Durability of Concrete with Various Sizes of Aggregates PAUL KLIEGER, Senior Research Engineer Portland Cement Association Previous tests using a natural sand and a curshed siliceous gravel indi- cated that, for concretes of constant cement content and consistency (vary- ing water-cement ratio), adequate resistance to freezing and thawing of air-dried concretes was secured when the air content of the mortar fraction was 9 ± 1 percent, regardless of the maximum size of aggregate used. The tests reported herein are for concretes made with cements from the same source as the initial tests and the same natural sand. However, the coarse aggregate used was a crushed limestone with particle shape and texture different from those of the gravel previously used. Three cement contents were used at a constant slump of 5 to 6 inches: 4.0, 5.5 and 7.0 sacks per cubic yard of concrete. The maximum sizes of aggregate used were %-in., %-in. and lV2 -in. For each combination of cement content and maximum size of aggregate, five concretes covering a fairly wide range of air contents were prepared. The results of freezing and thawing tests of these concretes confirmed the results of the earlier tests. Adequate resistance to freezing and thaw- ing was obtained when the air content of the mortar fraction was in the range of 9 ± 1 percent. The report also includes information on the effect of entrained air on strength, resistance to salt scaling, volume change and absorption of these concretes. #THK is a second report concerning a group of tests designed to provide quantitative information regarding the proper amount of entrained air for adequate frost resistance and the effect of the entrained air on the strength of concretes made with various maxi- mum sizes of aggregate. The first series of tests^ using a natural sand and a crushed gravel indicated that, for concretes of constant cement content and consistency, adequate resistance to freezmg and thawing of air-dried concretes was secured when the air content of the mortar fraction was in the range of 9 ± 1 percent regardless of the maximum size of aggregate used. In these tests, the Type lA cement generally provided this neces- sary amount of air as required. The second series of tests, the results of which are reported herein, were made using a different type of coarse aggregate and concrete of higher slump to determine whether, with these changes, the same requirement would be found for air content of mortar. SCOPE OF TESTS The concretes used in this second series of tests had cement contents of 4.0, 5.5 and 7.0 sk. per cu. yd. with net water-cement ratios varied so that the consistency was maintained at 5 to 6 inches as measured by the slump test. For each cement con- tent, three maximum sizes of aggregate were used: VS -in., 'A -in. and IVA -in. Five concretes were prepared for a particular cement content and maximum size of aggre- gate covering a fairly wide range of air contents. The range in air contents was ob- '• "Effect of Entrained Air on Strength and Durability of Concrete Made With Various Maximum Sizes of Aggregate," by Paul Klieger, Proceedings Thirty-First Annual Meeting, 1952 Highway Research Board. Reprinted as Bulletin 40, Portland Cement Association, Chicago, 111. 1
Transcript
Effect of Entrained Air on Strength and Durability of Concrete with Various Sizes of Aggregates PAUL KLIEGER, Senior Research Engineer Portland Cement Association
Previous tests using a natural sand and a curshed siliceous gravel indicated that, for concretes of constant cement content and consistency (varying water-cement ratio), adequate resistance to freezing and thawing of air-dried concretes was secured when the air content of the mortar fraction was 9 ± 1 percent, regardless of the maximum size of aggregate used.
The tests reported herein are for concretes made with cements from the same source as the initial tests and the same natural sand. However, the coarse aggregate used was a crushed limestone with particle shape and texture different from those of the gravel previously used. Three cement contents were used at a constant slump of 5 to 6 inches: 4.0, 5.5 and 7.0 sacks per cubic yard of concrete. The maximum sizes of aggregate used were % - i n . , % - i n . and lV2-in. For each combination of cement content and maximum size of aggregate, five concretes covering a fairly wide range of air contents were prepared.
The results of freezing and thawing tests of these concretes confirmed the results of the earlier tests. Adequate resistance to freezing and thawing was obtained when the air content of the mortar fraction was in the range of 9 ± 1 percent.
The report also includes information on the effect of entrained air on strength, resistance to salt scaling, volume change and absorption of these concretes.
# T H K is a second report concerning a group of tests designed to provide quantitative information regarding the proper amount of entrained air for adequate frost resistance and the effect of the entrained air on the strength of concretes made with various maximum sizes of aggregate.
The f i rs t series of tests^ using a natural sand and a crushed gravel indicated that, for concretes of constant cement content and consistency, adequate resistance to freezmg and thawing of air-dried concretes was secured when the air content of the mortar fraction was in the range of 9 ± 1 percent regardless of the maximum size of aggregate used. In these tests, the Type lA cement generally provided this necessary amount of air as required.
The second series of tests, the results of which are reported herein, were made using a different type of coarse aggregate and concrete of higher slump to determine whether, with these changes, the same requirement would be found for air content of mortar.
SCOPE OF TESTS The concretes used in this second series of tests had cement contents of 4.0, 5.5
and 7.0 sk. per cu. yd. with net water-cement ratios varied so that the consistency was maintained at 5 to 6 inches as measured by the slump test. For each cement content, three maximum sizes of aggregate were used: V S - i n . , ' A - i n . and I V A - i n . Five concretes were prepared for a particular cement content and maximum size of aggregate covering a fairly wide range of air contents. The range in air contents was ob-
'• "Effect of Entrained Air on Strength and Durability of Concrete Made With Various Maximum Sizes of Aggregate," by Paul Klieger, Proceedings Thirty-First Annual Meeting, 1952 Highway Research Board. Reprinted as Bulletin 40, Portland Cement Association, Chicago, 111.
1
TABLE 1 CHEMICAL COMPOSITION OF CEMENTS
Chemical analyses of cements made va accordance with ASTM Methods of Test current in February, 1953. Sodium oxide and potassium oxide by flame photo-metry, ASTM C228-49T.
Cement Lot Si02 No.
Major Components - ^ Minor Components - ^ AlzOs FeaOs Total
CaO MgO SOs Ign. MnaOs Free Insol. Alkalies
Loss CaO Res. NagO K2O Total as NatO
TYPE I CEMENTS 2.45 1.90 2.43 2.26
18787 22.03 18788 20.77 18789 20.73 18790*21.18
5.98 6.28 6.10 6.12
2.40 3.12 2.78 2.77
62.35 63.67 63.16 63.06
2.30 1.79 2.11 2.07
1.06 1.30 1.64 1.33
0.07 0. 20 0.47 0.25
09 11 72 31
0.18 0.11 0.16 0.15
0.13 0.27 0.11 0.17
1.12 0.87 0.55 0.63 0.15 0.21 0. 16 0.57
TYPE lA CEMENTS 2.39 2.04 2.80 2.41
18791 21.98 18792 20.59 18793 21.31 18794*21.29
5.76 6.55 5.27 5.86
2.38 3.17 2.48 2.68
62.66 63.90 64.01 63.52
2.39 1.82 1.90 2.04
1.00 0.68 1.51 1.06
0.07 0. 23 0.49 0. 26
0.79 0.64 1.73 1.05
0.10 0.11 0.16 0.12
0.14 0.27 0.08 0.16
1.07 0.84 0.55 0.63 0.14 0.17 0.59 0.55
* These are blends of the three individual brands of each type. The analyses indicated are the arithmetical averages of the analyses of the individual cements.
tained by using Type I cement, Type I and Type lA blend. Type lA and Type lA plus the addition of neutralized Vinsol resin in solution during mixing.
The concretes prepared were subjected to the following tests: (1) flexural and compressive strength tests of 6 by 6 by 30-in. beams at 28 days, (2) freezing and thawing tests of 3 by 3 by 11% -in. prisms, both air dried and continuously moist cured, (3) resistance to surface scaling resulting from the use of salts for ice removal purposes and (4) drying shrinkage and absorption tests.
In addition, the characteristics of the air voids in the hardened concrete are being determined, together with actual determinations of freezable water and length change during freezing. These data wi l l form the basis for a future report evaluating their influence on the measured durabilities.
MATERIALS The cements were a Type I blend and a Type lA blend, each prepared from three
TABLE 2 POTENTIAL COMPOUND COMPOSITION OF CEMENTS
Corrected for free CaO Cement Calculated Compomd Composition 7o
TYPE lA CEMENTS 18791 1750 96.3 3.153 26.5 3:55 6:40 4:40 6:40 0.19 16.7 18792 1760 94.1 3.170 25.0 3:00 6:05 4:10 6:10 0.20 18.1 18793 1860 93.7 3.127 27.5 3:50 6:30 4:35 6:40 0.10 20.4 18794 1790a 94.7a 3.150a 26.0 4:00 7:00 4:55 7:10 0.14 18.3 a Arithmetical average of three individual cements.
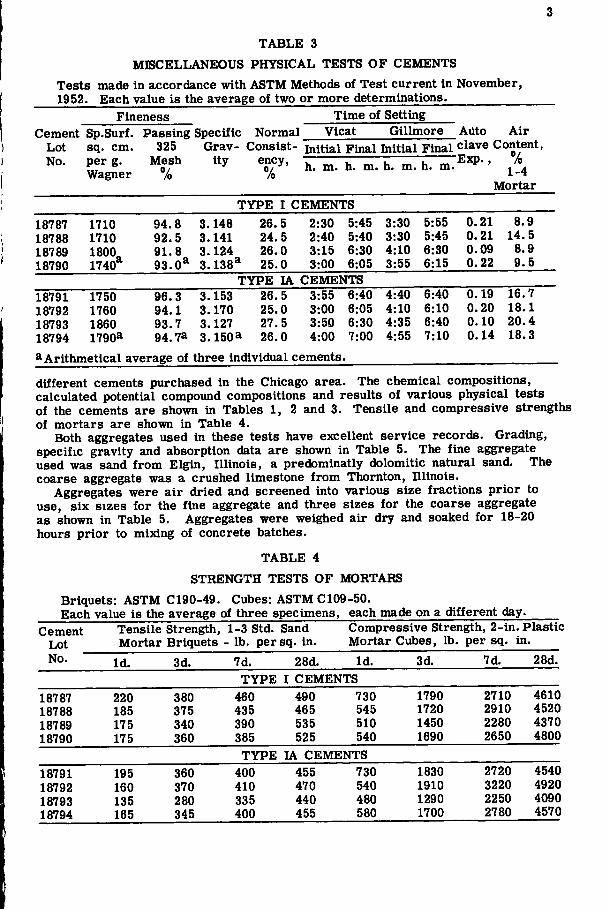
different cements purchased in the Chicago area. The chemical compositions, calculated potential compound compositions and results of various physical tests of the cements are shown in Tables 1, 2 and 3. Tensile and compressive strengths of mortars are shown in Table 4.
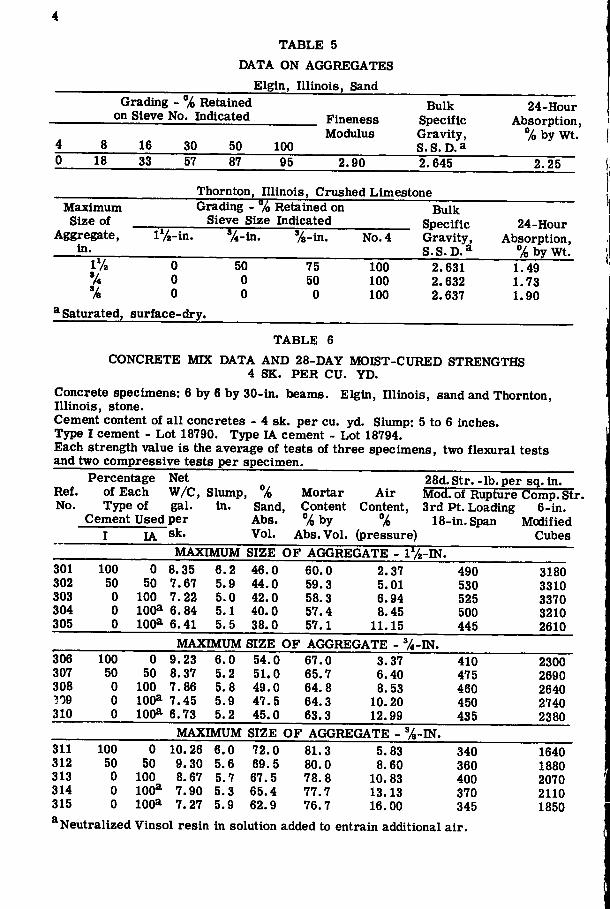
Both aggregates used in these tests have excellent service records. Grading, specific gravity and absorption data are shown in Table 5. The fine aggregate used was sand from Elgin, Illinois, a predominatly dolomitic natural sand. The coarse aggregate was a crushed limestone from Thornton, Illinois.
Aggregates were air dried and screened into various size fractions prior to use, six sizes for the fine aggregate and three sizes for the coarse aggregate as shown in Table 5. Aggregates were weighed air dry and soaked for 18-20 hours prior to mixing of concrete batches.
TABLE 4 STRENGTH TESTS OF MORTARS
Briquets: ASTM C190-49. Cubes: ASTM C109-50.
Cement Tensile Strength, v..«, — — — — — J
1-3 Std. Sand Compressive Strength, 2-in. Plastic Lot Mortar Briquets - lb. persq. in. Mortar Cubes, lb. per sq. in. No. Id. 3d. 7d. 28d. Id . 3d. 7d. 28d.
Thornton, Illinois, Crushed Limestone % Retained on Maximum
Size of Aggregate,
in.
Grading Sieve Size Indicated
lV2-in. % In. Vs-in. No. 4
Bulk Specific Gravity, S.S.D.*
24-Hour Absorption,
7o by Wt. 0 0 0
50 0 0
75 50
0
100 100 100
2.631 2.632 2.637
1.49 1.73 1.90
^Saturated, surface-dry.
TABLE 6 CONCRETE MIX DATA AND 28-DAY MOIST-CURED STRENGTHS
4 SK. PER CU. YD. Concrete specimens: 6 by 6 by 30-in. beams. E^in , Illinois, sand and Thornton, Illinois, stone. Cement content of all concretes - 4 sk. per cu. yd. Slump: 5 to 6 inches. Type I cement - Lot 18790. Type lA cement - Lot 18794. Each strength value is the average of tests of three specimens, two flexural tests and two compressive tests per specimen.
Percentage Net ReL of Each W/C, Slump, *'̂ No. Type of gal. in. Sand,
Cement Used per Abs. Vol. lA sk.
Mortar Content %by
Abs. Vol.
Air Content,
(pressure)
28d.Str.-Ib.per sq.in. Mod. of Rupture Comp. Str. 3rd Pt. Loading 6-in.
Neutralized Vinsol resin in solution added to entrain additional air.
FABRICATION OF SPECIMENS Al l materials were at 73" F. at the time of mixing. Concrete batches were mixed
for 3 minutes in an open-tub Lancirick mixer. Each batch contained 1.30 cu. f t . of concrete. For each particular concrete, three like batches were prepared, each on a different day, containing sufficient concrete to make one 6 by 6 by 30-in. beam, one 3 by 6 by 15-in. slab and four 3 by 3 by llV4-in. prisms. A slump test and an air content determination by the pressure method were made on each batch of concrete.
Specimen molds (steel) were filled in two equal layers each rodded with a ' ^ - in . diameter bullet-nose tamper, 63 roddings per layer for the beams, 25 per layer for the prisms and 50 per layer for the slabs. Immediately after casting, the surface of the prism was finished with a steel trowel, and the surfaces of the beam and slab were finished with a wood float.
T A B L E 7
CONCRETE MIX DATA AND 28-DAY MOIST-CURED STRENGTHS 5'/, SK. P E R CU. YD.
Concrete specimens 6 by 6 by 30-in. beams. Elgm, lUmois, sand and Thornton, Illmois, stone. Cement content of all concretes - S'/g sk. per cu. yd. Slump: 5 to 6 mches. Type I cement - Lot 18790. Type lA cement - Lot 18794. Each strength value is the average ol tests of three specimens, two flexural tests and two compressive tests per specimen.
Percentage Ref. of Each No. Type of
Cement Used lA
Net W / C , gal. per sk.
Slump, in.
28d. Str. - lb, per sq. in. % Mortar Air Mod. of Rupture Comp. Str.
MAXIMUM SIZE O F AGGREGATE - I'/^-IN. 316 317 318 319 320
100 50 0 0 0
0 50
100 lOOa lOOa
6.04 5.75 5.60 5.47 5.26
5.0 5.0 5.4 5.3 5.5
43.0 40.5 39.0 37.5 35.6
59.1 58.2 58.0 57.8 57.4
2.25 4.29 6.15 7.90
10.03
710 695 685 650 600
5860 5760 5440 4920 4090
MAXIMUM SIZE O F AGGREGATE - y4-IN. 321 322 323 324 325
100 50 0 0 0
0 50
100 100^ lOOa
6.55 6.10 5.88 5.68 5.46
6.0 5.3 5.7 5.6 5.5
51.0 49.0 47.0 44.9 43.0
66.0 65.3 64.6 64.2 63.8
3.15 5.60 7.44 9.77
11.95
670 665 645 620 585
4580 4780 4540 4190 3850
MAXIMUM SIZE O F AGGREGATE - %-IN. 326 327 328 329 330
100 SO 0 0 0
0 50
100 100* lOOa
7.03 6.57 6.34 5.97 5.73
5.2 5.8 5.7 5.8 5.7
68.9 66.0 64.4 62.4 60.4
79.5 78.0 77.3 76.6 75.9
5.28 7.55 9.30
11.75 13.70
570 595 585 570 530
3650 3910 3820 3620 3330
a Neutralized Vinsol resm m solution added to entrain additional air.
The specimens were covered with two layers of damp burlap (not in contact with the surface) and a tarpaulin over the burlap. The following day the molds were stripped.
B slab specimens were then provided with a 1:2 mortar dike, approximately *4 by in. in section, aroimd the perimeter of the finished top surface.
CURING CONDITIONS The beams for strength tests were cured continuously moist until time for test.
Some of the prisms used in the freezing and thawing tests were cured 1 day in molds, 13 days in the moist room, 14 days in the airofthe laboratory (50 percent R.H.) and 3 days in water prior to the start of tests. The remainder of the prisms were cured 1 day in molds, 27 days in the moist room and 3 days in water prior to test. Curing temperature was 73.4 ± 3° F.
The slabs for scaling test were cured 1 day in molds, 13 days in the moist room, 14 days in the air of the laboratory (50 percent R. H.) and 3 more days in air with a %- in layer of water on the top surface.
TEST METHODS Strength tests of beams and cylincters were made in accordance with current ASTM
methods of test. Beams were tested in flexure using third-point loading over an 18-in. span, permitting two flexural breaks per beam. The beam ends were used as 6-in. modified cubes for compressive strength tests.
Two complete cycles of freezing and thawing were obtained every 24 hours, the prisms being immersed in tap water at all times. The rate of cooling was approximately 20" F. per hour. Periodic determinations of changes in weight, length and sonic modulus were used as criteria of durability.
T A B L E 8 CONCRETE MIX DATA AND 28-DAy MOBT-CURED STRENGTHS 7 SK. P E R C U . YD.
Concrete specimens- 6 by 6 by 30-in. beams. Elgm, Illmois, sand and Thornton, Illinois, stone. Cement content of all concretes - 7 sk. per cu. yd. Slump: 5 to 6 inches. .{ Type I cement - Lot 18790. Type lA cement - Lot 18794. <i Each strength value is the average of tests of three specimens, two flexural tests and two compressive tests per specimen.
Ref. No.
Percentage of Each Type of
Cement Used I lA
Net W / C , gal. per sk.
Slump, in.
% Sand, Abs. Vol.
Mortar Content
%by Abs. Vol.
Air Content,
'A (pressure)
28d. Str. - lb. per sq. m. Mod. of Rupture Comp. Str. 3rd Pt. Loadmg 6-m.
The surface scaling test consisted of freezing a '^^-in. layer of water on the top surface of the slab and then thawing the ice with flake calcium chloride, applied in an amount equivalent to 2.4 lb. per sq. yd. of surface area. The slabs were subjected to one cycle of this freezing and thawing per day. The amount of scaling was determined by visual examination and rated numerically as follows:
0 - no scale 1 - slight
2 - slight to moderate 3 - moderate
4 - moderate to bad 5 - bad
The middle section of each 6 by 6 by 30-in. beam is being used for determining the air void characteristics of these concretes, such as bubble distribution and spacing. These determinations are being made by the linear traverse method. ^
Companion prisms to those being subjected to the freezing and thawing test are being used for determinations of freezable water and length changes during freezing using a specially designed calorimeter strain apparatus, to be described in a future report.
* "Linear Traverse Technique for Measurement of Air in Hardened Concrete," by L.S. Brown and C.U. Pierson, ACI Proc. Vol. 47, October, 1950.
TABLE 9 EFFECT OF ENTRAINED AIR ON CONCRETE STRENGTHS
Flexure: 6 by 6 by 30-in. beams. Third-point loading, 18-in. span. Two breaks per beam. Compression: 6-in. modified cubes. Two cubes per beam. Age at test: 2 8 days. Curing: continously moist. Data obtained by averagmg results of tests on three like specimens.
Maximum Size
of Aggregate -
Average Percentage Change in Strength for Each One Percent of Entrained Air for Total Amounts of Entrained Air Shown
Flexure 1!% n 3% 4%
Compression 5% 6'% 1% 2'^ 3̂ 0 ?7o S% 6 V
4 SK. PER CU. YD. 5 TO 6-IN SLUMP iVa-in. '^-in. Vs-in.
+3.7 +7.3 +3.0
+3.1 +6.1 +3.0
+2.2 +4.9 +3.1
+1.5 +1.1 +3.7 +2.8 +3.1 +2.8
+0.5 +2.0 +2.2
+1.9 +6.1 +4.9
+1.9 +1.7 +6.3 +5.7 +4.9 +5.7
+1.4 +5.0 +5.5
+0.8 +4.3 +5.0
+0.2 +3.6 +4.7
5V2 SK. PER CU. YD. 5 to 6-IN. SLUMP iVa-in. V4-in. '^-in.
-1.1 -0.4 +2.1
-0.9 -0.4 +2.0
-0.9 -0.5 +1.5
-1.0 -1.4 -0.7 -0.9 +1.0 +0.4
-1.6 -1.1
0
-0.9 +2.6 +3.3
-0.7 -1.4 +2.1 +1.2 +2.1 +2.0
-2.0 +0.1 +1.3
-2.4 -0.3 +0.8
-3.0 -0.8 +0.2
7 SK. PER CU. YD. 5 to 6-IN. SLUMP iVa-in. V4-in. '^-in.
-1.3 0
-0.5
-1.4 -0.3 -0.4
-1.7 -0.8 -0.9
-1.9 -2.0 -1.3 -1.5 -1.2 -1.4
-2.2 -1.8 -1.7
-3.3 -2.5 -0.7
-3.3 -3.6 -2.3 -2.7 -0.7 -0.9
-3.8 -2.8 -1.3
-4.0 -3.0 -1.7
-4.2 -3.0 -2.0
TABLE 10 LENGTH AND WEIGHT CHANGES OF CONCRETES PRIOR
TO FREEZING AND THAWING Cement content: 4sk. per cu. yd. Slump: 5 to 6 inches. Specimen size: 3 by 3 by l lV4-in. prisms.
Net Air Length Changes During Weight Changes During Ref. w / c , Content, Periods Indicated - % Periods Indicated -7o No. gal. •̂ 14d. 14d. 3d. in 14d. 14d. 3d. in
per Pressure Moist Air Water Moist Air Water sk. (+) (-) (+) (+) (-) (+)
These data regarding air void characteristics, freezable water and length changes wil l be presented in a future report.
DISCUSSION OF RESULTS
2 100
si <
90
60
eo
50
< 40
5 to 6-in Slump
o - 4 sks per cu yd . - 5 ' / 4 - " " •
Elg in , I l l inois sand and Thornton, I l l inois crushed limestone
% - i n % - i n Maximum S i z e
l/2-ir of Aggregate
Characteristics of Concretes Tables 6, 7 and 8 show data on the con
crete mixes used in these tests. Figure 1 shows the changes in mortar content resulting from changes in maximum size of aggregate in mixes of constant cement content and consistency.
Figure 2 shows the changes in air content with changes in maximum size of aggregate and the average mortar content for each size of aggregate.
The water requirements of the concretes as a function of entrained air, for each maximum size of aggregate, are shown in Figure 3.
Effect of Entrained Air on Concrete Strength
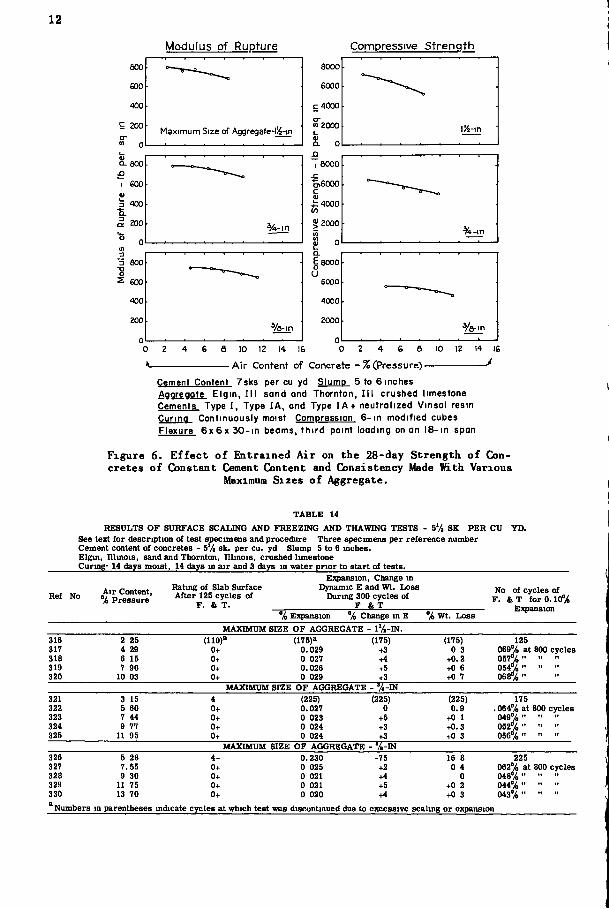
Flexural and compressive strength data are shown in Tables 6, 7 and 8 and in Figure 4, 5 and 6.
Figure 1. R e l a t i o n s h i p Between Maximum Size of Aggregate and Mortar Content for Concretes of Constant Cement Content and
Consistency.
Table 9 summarizes the results of the strength tests and shows the average percentage change in strength for each one percent of intentionally entrained air up to 6 percent
Figures in parentheses are the average mortar contents of the concretes made with the particular maximum size of aggregate
%-in 'A-in Ij-in Maximum Size of Aggregate
Figure 2. Relationships Between Maximum Size of Aggregate and Air Content for Concretes of Constant Cement Content and Consistency.
(intentionally entrained air is defined as that portion of air entrained in addition to the amount entrained with the Type I cement alone). These percentage changes in strength are calculated from the average air content-strenglh relationships shown in Figures
2 o ^ 10
I
B 8
E (5
z
4 sks per cu ud 5 to 6-jn slump
Max I , of Aggregate- l i^- in
B'k sks per cu ijd 5 to 6-in s lum|3
7 sks per cu_yd 5 to 6-1n slump
10 12 "0 2 4 6 8 10 12 14 16 0 2 4 6 6
* Air Content of Concrete - pe rcen t *
Elg in , Illinois sand and Thornton, Il l inois crushed limestone
Figure 3. E f f e c t of A ir Content on the Water Requirement of Concretes of Constant Cement Content and Consistency Made With Various
Maximum Sizes of Aggregate.
TABLE 11
LENGTH AND WEIGHT CHANGES OF CONCRETES PRIOR TO FREEZING AND THAWING
Cement content: 5% sk. per cu. yd. Slump: 5 to 6 inches. Specimen size: 3 by 3 by 1174-in. prisms.
Cement Content 4sks per cu yd Slump 5 to 6 inches Aooreaote Elgin, III sand and Thornton, III crushed limestone Cements Type I, Type lA , ond Type lA + neutrolized Vmsol resin Curing Continuously moist Compression 6-in modified cubes Flexure 6x 6 x 30-in beams, third point loading on an 18-in span
Figure 4. E f f e c t of Entrained Air on the 28-day Strength of Concretes of Constant Cement Content and Consistency Made With Various
Maximum Sizes of Aggregate.
TABLE 12 LENGTH AND WEIGHT CHANGES OF CONCRETES PRIOR
TO FREEZING AND THAWING Cement content: 7sk. per cu. yd. Slump: 5 to 6 inches. Specimen size: 3 by 3 by 11%- in. prisms.
Net Air Length Changes During Weight Changes During Ref. W/C, Content, Periods Indicated-% Periods Indicated-% No. gal. % 14d. 14d. 3d. in. 14d. 14d. 3d. in.
per Pressure Moist Air Water Moist Air Water sk. (+) (-) (+) (+) (-) (+)
Cement Content 5 ^ sks per cu yd Slump 5 to 6 inches Aggregate. E l g i n , III sand and Thornton, I I I c rushed l imestone Cements Type I , Type l A , and Type l A 4- neutral ized Vinsol resin Curing Continuously moist Compression 6 - i n modified cubes Flexure 6 x 6 x 3 0 - i n b e a m s , third point loading on an 18-in s p a n
Figure 5. Effect of Entrained Air on the 28-day Strength of Concretes of Constant Cement Content and Consistency Made With Various
Maximum Sizes of Aggregate.
TABLE 13 RESULTS OF SURFACE SCALING AND FREEZING AND THAWING TESTS - 4 SK. PER CU YD
See text for description of test specimens and procedure Three specimens per reference number Cement content of concretes - 4 sk. per cu yd. Slump- S to 6 inches Elgin, lUuois, sand and Thornton, Illinois crushed limestone Curing- 14 days moist, 14 days in air and 3 days in water prior to start of tests.
MAXIMUM SIZE OF AGGREGATE-'^-IN. 311 5.83 (65) (70) (70) (70) 39 312 8.60 1+ 0.027 -27 12 6 825 313 10.83 1- 0 020 -5 4.4 054% at 800 cycles 314 13.13 1- 0 020 -1 2.1 052% 315 16 00 1- 0.021 -2 1.8 053% ^Numbers in parentheses mdicate cycles at which test was discontinued di le to excessive scalmg or expansion
12
Modulus of Rupture Compressive Strength
800
GOO
400
9 200 a-
m 0
o- 800 I eoo e 3 400 •s. e 200
eoo
Maximum Size of Aggregate-l/j-in
8000
eooo
c400O
«2000
i 0 JQ
I 8000 J :
o>6000 c u i:4000 in 5 2000 I 0 a. Eaooo u
EOOO
4000
2000
l>4-in
0 Z 4 6 e 10 12 14 I& 0 2 4 e S 10 IZ 14 le * Air Content of Concrete - % (Pressure) ^
Cement Content 7 s k s per cu yd Slumn 5 to 6 inches Aggregate. E l g i n , I I I s a n d and Thornton, I I I c rushed limestone Cements Type I, Type l A , and Type l A t neutra l ized Vmso l resin Curing Continuously moist Compression 6 - i n modified cubes Flexure 6 x 6 x 3 0 - i n b e a m s , th i rd point loading on an 18- in span
Figure 6. Effect of Entrained Air on the 28-day Strength of Concretes of Constant Cement Content and Consistency Made With Various
Maximum Sizes of Aggregate.
TABLE 14 RESULTS OF SURFACE SCALING AND FREEZING AND THAWING TESTS - 5'^ SK PER i
See text for description of test specimens and procedure Three specimens per reference number Cement content of concretes - 5% sk. per cu. yd Slump 5 to 6 mches. Elgin, nimois, sand and Thornton, Illinois, crushed limestone Curmg- 14 days moist, 14 days in air and 3 days in water prior to start of tests.
Ref No Air Content, % Pressure
Rating of Slab Surface After 125 cycles of
F. & T.
Eigiansion, Change in Dynamic E and Wt. Loss
During 300 cycles of F & T
% Expansion % Change in E % Wt. Loss
No of cycles of F. SiT for 0.10%
Expansion
MAXIMUM SIZE OF AGGREGATE - l ' ^ - IN . 316 2 25 (110)» (175)a (175) (175) 125 317 4 29 0+ 0.029 +3 0 3 069% at 800 cycles 318 6 15 0+ 0 027 +4 +0.2 057%
MAXIMUM SIZE OF AGGREGATE - % - I N 326 5 28 4- 0.230 -75 16 8 225 327 7. 55 0+ 0 025 +2 0 4 062% at 800 cycles 328 9 30 0+ 0 021 +4 0 048% 329 11 75 0+ 0 021 +5 +0 2 044% 330 13 TO 0+ 0 020 +4 +0 3 043% ^Numbers in parentheses indicate cycl SB at which test was discontinued due to excessive scaling or expansion
13
TABLE 15
RESULTS OF SURFACE SCALING AND FREEZING AND THAWING TESTS 7 SK. PER CU. YD.
See text for description of test specimens and procedure. Three specimens per reference number.
Cement content of concretes - 7 sk. per cu. yd. Slump: 5 to 6 inches. Elgin, Illinois, sand and Thornton, Illinois, crushed limestone. Curing: 14 days moist, 14 days in air and 3 days in water prior to start of of tests.
Ref. Air
Content, %
Pressure
Rating of Slab Surface
After 125
E:!q}ansion, Change in Dynamic E and Wt. Loss During 300 Cycles of T. & T.
No. of Cycles of F. & T. for
No.
Air Content,
% Pressure
Cycles of F. & T. %
E2q)ansion % Change
in E % Wt. Loss
0.10% E:q)ansion
MAXIMUM SIZE OF AGGREGATE - iVa-IN. 331 332 333 334 335
2.16 3.68 4.99 6.65 8.38
4 0+ 0 0 0
(lOO)a 0.043 0.034 0.031 0.031
(100) -2 +4 +2 +4
(100) 0.1
+0.3 +0.4 +0.7
62 560
. 070% at 800 cycles
. 063% " " "
. 061% " " " MAXIMUM SIZE OF AGGREGATE - ' A - w .
a Numbers in parentheses indicate cycles at which test was discontinued due to excessive scaling or expansion.
4, 5 and 6, using the strength of the non-air entrained concrete in each group as the reference strength.
The data shown in Table 9 indicate that al l of the 4-sk. concretes showed increases in strength with entrainment of up to 6 percent additional air. In these mixes, the reductions in water requirement with entrainment of air were large enough to offset the effect of the entrained air on the strength. The 5V2-sk. concretes made with the %- in . aggregate showed strength increases. In the remainder of the 5'^-sk. and all of the 7-sk. mixes, the entrainment of air resulted in small decreases in strengths. The greater reductions in water requirement effected by the entrained air as the size of aggregate was decreased resulted in less of a decrease in strength for these mixes.
The maximum air contents used in these tests were well above those which would ordinarily be used in practice on well controlled jobs. These higher air contents were used to aid in establishing trends revealed by the data.
Effect of Entrained Air on Length and Weight Changes During Curing Tables 10, 11 and 12 show the length and weight chaises of the freezing and thaw
ing prisms determined during the curing period consisting of 14 days moist, 14 days in the air of the laboratory and 3 days in water prior to the start of freezing and thawing tests.
14
20
IS
16
Discontinued i % 6
14 c
8 12 ' t- 12 '
(U a . 1 10 cn c i 08 CO
1- 06 •D c (0 04 D5 C
' f j .02 U 01
I j I 0 0
0 V) 0) 20 u
U 18 o o CO .16 IJ> c u 3 14
Q
c .12 g in c 10 (0 Q. X
u 08
06
04
.02
4 sks per cu ud 5 to 6-in slump
mum Size Aggregate
20
.la
16
14
12
10
oa
06
04
02
Discontinued
7 sks per cu Ljd 5 to e-in slump
Maximum Size of Aggregate
14 A i r Content of Concrete - p e r c e n t (Pressure)
14
Discontinued t i I
5!^ sks per cuud 5 to 6-in slump
Maximum Size of Aggregate
Curing : I day in molds, 13 days in moist room, 14 days in the air of the laboratory and 3 days in water prior to the start of the freezing and thawing tests
Specimen: 3 by 3 by llJ4-in. prisms
Frozen and thawed while immersed in tap water, two cycles per day
Figure 7. Expansion of Concretes During 300 Cycles of Freezing and Ihawing.
As in the f i rs t series of tests, there appears to be no significant effect of entrained air on the length changes during the initial 14 days of moist storage, a slight increase in contraction with increase in air content during the following 14 days in the air and only a slight trend toward increased e:q>ansion with increase in air content during the 3 days storage in water.
Al l of the concretes showed increasing weight gains with increase in air content
15
during the initial 14 days of moist storage. During the 14 days in the air of the laboratory, none of the concretes showed any signigicant differences in loss of water with
c m o L_ (U Q .
I
c i CD x: H X I c CD
20
18
16
I 4 i
12
10
08
06
041
C35
c N 02
•5 0
3> u
cn _c *L_ 3 Q c o c CD D . X
in
L 0
Discontinued
1 1 l i l
! :
1 1 4 sks per cu yd
1 1 i '
5 to 6-in s l ump
%-in
% - m Maximum Size of Aggregate
\ A
20
18
16
14
.12
10
oa
06
04
02
Discontinued I t I i
7 sks per cu Md 5 t o 6 - i n s l u m a
l5-in
in Maximum Size of Aggregate
8 _ 10 12 14 16 0 Z 4 6 e 10 • A i r C o n t e n t o f C o n c r e t e — p e r c e n t ( P r e s s u r e )
14
Discontinued t i 1 u
51^ sks per cu ud 5 to 6-ia s lump
l i - in
\^''8-in Maximum Size of Aggregate
Curing- I day in molds, 27 days m moist room, and 3 days in water prior to the start of freezing and thawing tests
Specimen: 3 by 3 by llJ4-in. prisms.
Frozen and thawed while immersed in tap water, two cycles per day.
Figure 8. Expansion of Concretes During 300 Cycles of Freezing and Ihawing.
air content. In general the absorptions decreased slightly for all concretes with increase in air content.
16
Effect of Entrained Air on Resistance to Freezing and Thawing of Concretes
Tables 13, 14 and 15 show the expansions, changes in dynamic modulus and changes in weight for the air-dried concretes during 300 cycles of freezing and thawing. Concretes in the f i rs t series of tests were also compared as to durabilities during 300 cycles. In addition, where available, the number of cycles for 0.10 percent expansion are also shown. Where the specimens have not yet reached 0.10 percent expansion, the latest available e}q)ansion data are presented.
c
o.
c o
o
g 18
o U 16
< 14
•n pj 12
5 to 6-in slump
3
u
ZO
18
16
14
12
10
6
6
4
Maximum Size of Aggregate ij-in
1 sks per cu 5 to 6-in. slump
10 12 14 16 Air Content of Concrete —per cent (Pressure")-
0 2 4 6 & 10 12 14 16 Air Content of Concrete - percent CPressure)
Figure 9. Relationships Between Air Content of Concrete and Calculated Air Content of Mortar Fraction.
17
Figure 7 shows the expansion during the 300 cycles of freezing and thawing as a function of the air content of the air-dried concretes. Figure 8 shows the same relationships for the continuously moist-cured concretes. For both curing conditions, the resistance to freezing and thawing increased greatly as the air content was increased to some particular level. Further increases in air showed no commensurate further increase in durability, particularly for the air-dried concretes. This level of air content was defined in the f i rs t report on this study as that minimum air content beyond which further increases in air result in only a marginal decrease in expansion and is therefore considered to be a balance point between increase in durability and reduction in strength. This air content has been termed the optimum concrete air content.
Table 16 shows the optimum concrete air contents for the air dried concretes as determined visually from Fig. 7. More emphasis is placed on the results of tests of
TABLE 16
CHARACTERISTICS OF CONCRETES AT OPTIMUM AIR CONTENTS Elgin, Illinois, sand and Thornton, Illinois, crushed limestone. Optimum concrete air contents determined visually from Figure 7. Air contents of mortar fractions calculated and shown in Figure 9. a Air contents of paste fractions calculated. ^ Maximum
Size of Aggregate,
in.
Air Content of concrete Made With
Type lA Cement, %
Data for Optimum Concretes Optimum Concrete
Air , 7o
Air in Mortar
Fraction 7o
Air in Paste
Fraction, 7o
1 ^ 4 SK. PER CU. YD.
6.9 (5.8)H 8.5 (7.4)
10.8 (9.6)
5.0 (4.5) 6. 5 (5. 5) 8. 0 (8. 5̂
8.5 (8.3) 10.0 (8.9) 10.0 (11.1)
18.2 (18.2) 21.5 (19.8) 23.4 (26.2)
7*
572 SK. PER CU. YD. 6.2 (4.0) 7.4 (5.6) 9.3 (8.3)
5. 0 (4. 5) 6.0 (5.0) 7. 5 (6.5)
8.6 (8.5) 9.2 (8.3) 9.6 (8.7)
16.6(16.4) 18.6 (16.9) 21.2 (19.7)
7 SK. PER CU. YD. 1 ^
1 5.0 (2.9) 6.4 (4.3) 8.0 (6.9)
5.0 (4. 5) 6.0 (5. 5) 7. 5 (7.0)
* Percent air in mortar fraction =
8.5 (8.4) 9.2 (9.2) 9.6 (9.6)
C+W+S+A X 100
14. 5 (14. 3) 16.4 (16.8) 19.4 (19.4>
P ercent air in paste fraction =
Where C •• W S =
C+W+A xlOO
: absolute volume of cement. = volume of net mixing water, absolute volume of sand (minus No. 4 mesh), saturated, surface-dry.
A = Volume of air voids. * F igures in parentheses are the data obtained in the f i rs t series of tests using a crushed gravel as the cqarse^aggregate.
the air-dried concretes than those of the continuously moist-cured concretes, since practically all concrete in service undergoes some drying during its early life. This drying is generally beneficial with regard to resistance of the concrete to freezing and thawing action.
18
The optimum concrete air contents shown in Table 16 are, for a particular maximum size of aggregate, practically the same for each of the three cement contents. At the same cement content, the optimum concrete air content increases with a decrease in the maximum size of aggregate.
These optimum concrete air contents may be used to determine the air contents of the mortar fraction by means of the relationships in Figure 9. Table 16 shows these mortar fraction air contents and it can be seen that they fa l l in the range of 9 + 1 percent of air, the same range determined in the f i rs t series of tests using a different coarse aggregate and concrete at a lower slump. The calculated paste air contents are also shown in this table, but while the mortar fraction air contents for the optimum concretes are relatively stable, the air requirements of the paste increase with a decrease in maximum size of aggregate. The method used to calculate the air contents of the mortar and paste fractions is shown in Table 16.
It appears from these data and the data obtained in the f i rs t report (shown in parentheses in Table 16) that concrete which wil l undergo some drying prior to exposure to frost action can be made resistant to freezing and thawing by providing a relatively constant amount of air in the mortar fraction, despite changes in cement content, maximum size of aggregate, consistency and probably types of aggregate. These tests were made with two types of coarse aggregate and two concrete consistencies.
The optimum concrete air contents for these limestone concretes were from to 1 percentage points higher than those for the gravel concretes in the f i rs t series of tests. This resulted from the higher mortar contents of the limestone concretes.
The continuously moist-cured concretes, although showing considerable increase in durability with entrainment of air, apparently require more air for the same degree of durability than do the air-dried concretes (See Figure 8). This difference in air requirements was less pronoimced as the cement content was increased from 4 to 7 sk. per cu. yd.
The Role of Type lA Cement in Providing Optimum Air Contents In the f i rs t series of tests the Type lA cement in most cases produced as much or
slightly more than the amount of air indicated to be necessary. In these tests, the air contents produced by the Type lA, shown in Table 16, were in every case equal to or somewhat greater than the indicated optimum concrete air contents, despite changes in maximum size of aggregate and cement content.
At the concrete air contents produced by the Type lA cement, the resistance to freezing and thawing for all of the moist-cured concretes in these tests during 300 cycles of test is considered satisfactory based on the e:q>ansion-air content relationships shown in Figure 8.
Effect of Entrained Air on Resistance to Surface Scaling Tables 13, 14 and 15 also show the results of tests for resistance to surface scaling
resulting from the use of calcium chloride for ice removal. Al l of the concretes with intentionally entrained air showed excellent resistance to
surface scaling, with the possible exception of the 4-sk. concrete made with the %- in . maximum size of aggregate, although even in this case the improvement in scale resistance was great.
GENERAL OBSERVATIONS This second series of tests has produced what might be considered excellent con
firmation of the conclusion reached in the f i rs t series of tests reported on earlier, namely that despite changes in cement content, maximum size of aggregate, consistency and type of coarse aggregate a relatively constant amount of air in the mortar fraction in the range of 9± 1 percent wi l l provide the optimum air content in concrete. These observations with regard to optimum concrete air content and air content of the mortar fraction should apply to concretes showing the normally occurring distribution of air void sizes, a situation which wi l l in general prevail. There may be instances where an abnormal distribution of air void sizes wi l l l imit the practical usefulness of this
19
criterion. However, it is believed that these occurrences wi l l be few in actual practice. This information provides a practical approach to the problem of specifying the
amount of air required for adequate resistance to frost action by specifying merely the air content of the mortar fraction. Based on the desired mix proportions, this mortar air content may then be converted to concrete air content. Control of actual mixing operations would then center about this concrete air content.
At this time, there appears to be no special theoretical significance to ascribe to the utility of the 9 ± 1 percent mortar fraction air content in producmg frost-resistant concrete.
Continued efforts are being made to determine the basic factors controlling the resistance of concrete to freezing and thawing. Previous tests indicated the importance of the air void characteristics, such as bubble spacing, and the influence of the amount of water actually freezing within the concrete. Data of this type are now being obtained for these concretes and the evaluation of these data wil l constitute a future report. The next phase of this study wil l place emphasis on the effect of concrete temperature during mixing on the air void characteristics together with the effect of different curing temperatures on the freezable water characteristics of the concretes. These data wil l then be correlated with actual laboratory freezing and thawing data. Further studies wi l l include the effect of vibration, mixing time, sand grading and other variables.
SUMMARY Based on both these recent tests and the f i rs t series of tests reported previously,
the following observations and conclusions appear pertinent. Many of these have been made as a result of prior tests* and tests by other investigators, but appear worthy of repetition. These conclusions were derived from concretes made and cured at normal temperature (73° F.) and having a normally occurring distribution of air void sizes such as produced by the commonly accepted air-entraining agents.
1. For constant cement content and consistency, the rechiction in strength with en-trainment of air decreases as the maximum size of aggregate decreases, due to the greater reductions in water requirements possible with the smaller size aggregates.
2. For a particular consistency, the reduction in strength with entrainment of air decreases with a decrease in cement content, due to the greater reduction in water requirements possible in the leaner mixes. These larger reductions in water requirements often result in increases in strength as air is entrained in the lean mixes.
3. There appears to be no significant effect of air content on volume change or weight change during moist storage or air storage, or on absorption during 3 days immersion in water.
4. In all cases, the entrainment of air increased the resistance of concrete to freezing and thawing and to surface scaling resulting from the use of salts for ice removal.
5. The optimum concrete air requirement for frost resistance increased as the maximum size of aggregate decreased.
6. For the air-dried concretes at a particular maximum size of aggregate there appears to be little effect of cement content on the optimum concrete air content.
7. For the air-dried concretes, the tests indicate that the optimum concrete air content can be obtained byproviding a relatively constant air content in the mortar fraction, despite changes in cement content, consistency, maximum size ofaggregate or type of aggregate. This mortar air content appears to be in the range of 9 ± 1 percent.
8. Concretes cured continously moist required more entrained air for adequate resistance to freezing and thawing than the air-dried concretes. The Type lA cement provided a sufficiently high level of air content for these concretes.
9. For any given cement, the use of a constant amount of air-entraining agent per unit of cement appears to provide a self-regulating means for obtaining optimum concrete air contents despite variations in the proportions of concrete mix constituents and changes in the type of aggregate.
' "Effect of Entrained Air Strength and Durability of Concrete Made With Various Maximum Sizes of Aggregate" by Paul Klieger, Bulletm 40, Portland Cement Association, Chicago, Illinois.