EFFECT OF FLAXSEED FIBER ON BREAD QUALITY OBTAINED FROM FROZEN DOUGH A Thesis Submitted to the Graduate Faculty of the North Dakota State University of Agriculture and Applied Science By Emily Beth Schlepp In Partial Fulfillment of the Requirements for the Degree of MASTER OF SCIENCE Major Program: Cereal Science April 2012 Fargo, North Dakota
Transcript
EFFECT OF FLAXSEED FIBER ON BREAD QUALITY
OBTAINED FROM FROZEN DOUGH
A Thesis Submitted to the Graduate Faculty
of the North Dakota State University
of Agriculture and Applied Science
By
Emily Beth Schlepp
In Partial Fulfillment of the Requirements for the Degree of
MASTER OF SCIENCE
Major Program: Cereal Science
April 2012
Fargo, North Dakota
North Dakota State University Graduate School Title EFFECT OF FLAXSEED FIBER ON BREAD QUALITY
OBTAINED FROM FROZEN DOUGH
By Emily Beth Schlepp
The Supervisory Committee certifies that this disquis i t ion complies with North Dakota State University’s regulations and meets the accepted standards for the degree of
MASTER OF SCIENCE
SUPERVISORY COMMITTEE:
Clifford Hall
Chair
Frank Manthey Senay Simsek
Charlene Wolf-Hall
Approved:
4-18-2012
Deland Myers, Sr.
Date Department Chair
iii
ABSTRACT
Fiber in frozen bread dough is thought to reduce the loss of yeast vitality and improve
nutrition and quality of bread. The objective of this study was to determine the applicability of
flaxseed fiber in frozen bread dough. Fiber was extracted from two sources of brown flaxseed and
added to bread formulas at 0%, 1% and 3%. Dough was blast chilled and kept frozen until thawed
at scheduled intervals. Thawed dough was proofed, baked into bread. Bread was tested analytically
and by a sensory panel. Loss of overall quality was observed overtime. Breads containing flaxseed
fiber had significantly larger loaf volumes (cc) and reduced firmness (g). A trained sensory panel
detected significantly lower crumb firmness and stale flavors in breads containing flaxseed fiber.
These results suggest flaxseed fiber has the potential to improve the perceived quality of frozen
bread dough.
iv
ACKNOWLEDGMENTS
I would like to take this time to acknowledge and thank the Department of Cereal and Food
Science and the School of Food Systems at North Dakota State University, for the opportunities
provided to me including:
Advisory support from Dr. Clifford Hall and Mary Niehaus: Dr. Hall, I both appreciate and
respect your expectations. You have provided me endless opportunities to become a more well-
rounded individual. It is your belief in me that provided motivation and confidence to embrace the
opportunities around me. Mary, I appreciate your seemingly endless knowledge of instruments and
the time you took to share it with me. Most of all, your ability to trust me and let me learn on my
own will always be remembered.
The challenges, expectations and feedback provided by my committee, Dr. Frank Manthey,
Dr. Seney Simsek, Dr. Clifford Hall and Dr. Charlene Wolf-Hall. I can only hope the effort I put
forth was worth the time you put in.
Time dedicated by Samantha Briss: Thank you for helping me during the weekdays and
weekends. I appreciate your organizational skills, time management and the motivation you showed
for the project.
Smiles provided by Char Kuss and Cindy Selstedt: Your patience, organizational skills, candy
dishes and great senses of humors have always been appreciated.
Lastly, I would like to thank Northern Crops Institute for the use of their facilities and time.
In addition, I would like to thank Chris Olson for his time and statistical support.
ACKNOWLEDGEMENTS .......................................................................................................................... iv
LIST OF TABLES............................................................................................................................................. x!
LIST OF FIGURES ......................................................................................................................................... xi!
2.0. LITERATURE REVIEW......................................................................................................................... 3!
2.1. Overview of flaxseed.............................................................................................................................. 3!
2.2. Composition of flaxseed........................................................................................................................ 3!
2.2.2. Protein ............................................................................................................................................... 5!
6.2.2.2. Time effect ..............................................................................................................................44!
6.2.3. Water activity..................................................................................................................................45!
6.3.1.2. Time effect ..............................................................................................................................47!
6.3.2. Stale Flavor .....................................................................................................................................48!
9.0. LITERATURE CITED...........................................................................................................................52!
x
LIST OF TABLES
Table Page 1. Mixolab Chopin + protocol for determining water absorption. ..........................................................28 2. Formulas for 0%, 1% and 3% flaxseed fiber bread dough based on baker’s percent. .....................30! 3. CT3 texture analyzer procedure to determine peak firmness. ..............................................................31! 4. Serving order of samples 1-6 for nine panelists. .....................................................................................34! 5. Water amount added to of bread dough formulas made with and without flaxseed fiber...............46 6. Changes in firmness responses (cm) in baked bread from frozen dough with and without flaxseed fiber, as indicated by sensory panelists. .....................................................47 7. Changes in firmness responses (cm) over time for bread made from frozen bread dough with or without flaxseed fiber as indicated by sensory panelists...................................48! 8. Changes in stale flavor responses (cm) in bread made from frozen bread dough with or without flaxseed fiber as indicated by sensory panelists..............................................48! 9. Changes in stale flavor responses (cm) over time for bread made from frozen bread dough with or without flaxseed fiber as indicated by sensory panelists...................................49
xi
LIST OF FIGURES
Figure Page
1. General proximate composition of flaxseed (lipid- 40%, carbohydrate-30%, protein-20%, ash-4%, and moisture-6%) as reported by Daun et al., 2003. ........................................ 4! 2. Affect of freezing rate on the amount of time foods spend in the critical zone during ice crystal formation (adopted from Fellows, 2000). .................................................................17! 3. Mixolab profile of the control flour (C1= Gluten development; C2= gluten weakening due to over mixing and temperature begins to rise; C3= starch gelatinizes/ peak viscosity; C4= amylose activity/break down; C5= starch retrogrades/final viscosity)...........28! 4. Sensory scale used by trained sensory panelist to determine the characteristics of flaxseed fiber bread over 20 weeks. .....................................................................................................33! 5. Percent loaf volume reduction of breads made from frozen dough with and without flaxseed fiber stored frozen over 20 weeks...............................................................................38! 6. Number of holes (px) in breads made from frozen dough with and without flaxseed stored frozen over 20 weeks.Values indicate number of holes after 20 weeks of frozen storage, values with different letters indicate significant differences at (p< 0.05). ..........39! 7. Loaf volumes of bread made with and without flaxseed fiber from frozen dough stored over 20 weeks.......................................................................................................................40! 8. C-Cell images of breads with or without flaxseed fiber made from frozen dough stored over 20 weeks.......................................................................................................................41! 9. Percent increase in firmness (g) of breads made from frozen dough with and without flaxseed fiber stored frozen for various periods of time over 20 weeks. ....................43! 10. Mixolab torque (Nm) at points C1, C2, C3, C4 and C5 for flour with and without flaxseed fiber. See Figure 3, page 28 for description of data collection. ............................44! 11. Water activity (Aw) of bread made from frozen dough with and without flaxseed fiber stored frozen over 20 weeks. ..........................................................................................46!
1
1.0. INTRODUCTION
Flaxseed, also known as linseed (Linum usitatissimum), is an ancient crop first grown in Turkey
over 9,000 years ago (Cullis, 2007). It was used as a source of fiber for linen, food and medicine
before being taken to North America during colonization (Vaisey-Genser and Morris, 2003). Today,
Canada is the largest producer (Li et al., 2008), with production ranging between two to three million
metric tons in the last decade (Wu et al., 2010). In food applications flaxseed is sought by
consumers for its dietary (soluble and insoluble) fiber, α-linolenic acid and lignans (Zhang et al.,
2009). These nutrients provide numerous benefits including: reducing the risk of stroke, coronary
heart disease, lowering blood cholesterol, and aiding in laxation (Vaisey-Genser and Morris, 2003).
The antioxidant activity providing protection for cardiovascular disease and cancer also has been
reported (Jenkins et al., 1999).
Since its domestication, the functionality of flaxseed has varied greatly. Non-food
applications of flaxseed have included: textiles, lamp oil, paint and varnishes, printing ink and
plastics (Cullis, 2007). While flaxseed has numerous non-food applications, it is also commercially
processed for food applications including: whole flaxseed, milled flaxseed (which can be placed in
baked goods) and premade/ready to eat products (Duan, 2003). While flaxseeds are utilizable in
food and non-food applications, flaxseed as a food ingredient is not as profitable as flaxseed utilized
by the paint industry and other non-food industries (Chen et al., 2006). Therefore, through
fractionation, scientists have made flaxseed more utilizable and economically applicable for food use
(Oomah, 2003).
Most recently, the functionality of flaxseed fractions in food applications has been
investigated. Of particular interest, the soluble fiber fraction of flaxseed has the potential to be a co-
product of the flaxseed oil industry suitable for food applications (Oomah, 2003). Pre-treating the
2
whole flaxseed prior to oil processing can provide a fiber (also known as mucilage) product that can
be used in food applications. The fiber fraction can be removed with little loss of oil (Zhang et al.,
2009). Alternatively, flaxseed fiber can be removed from the meal or the hull after oil extraction
(Cui, 2001; Chen et al., 2006).
While extraction of flaxseed fiber is industrially feasible, applications and functionality of
flaxseed gum can vary. It has been determined that the functionality of flaxseed gum changes
depending on cultivar (Cui and Mazza, 1996), extraction parameters (Cui et al., 1994), and drying
methods (Wang et al., 2010a). Currently flaxseed gum has been used to stabilize emulsions in salad
dressings and in meat applications (Wang et al., 2010b). With the current human fiber consumption
being about half (8g of fiber/1000 calories) (Anderson et al., 2010), of the Center for Disease
Control (CDC) recommendation (14g of fiber/1000 calories) (CDC, 2011), the incorporation of
flaxseed fiber into bread is an opportunistic market (Wang et al., 2002). Furthermore, its water
holding functionality makes flaxseed fiber an applicable ingredient in frozen bread dough systems
based on observations that fibers can be a functional ingredient in frozen dough (Sharardanant and
Khan, 2003a). This project will address the functionality of flaxseed fiber in frozen bread dough and
the quality of bread obtained from the dough.
3
2.0. LITERATURE REVIEW
2.1. Overview of flaxseed
Flaxseed, Linum usitatissimum, is an oilseed thought to have biologically evolved from Linum
angustifolium or Linum bienne (Cullis, 2007). There are three breeding programs for flaxseed in Canada
and one in the United States (Daun et al., 2003; Hammond, 2011). Breeding objectives include
disease resistance, improved yield and oil characteristics; however, objectives remain flexible to meet
new product development needs (Cullis, 2007).
While many may prefer yellow flaxseed for baking and beverages, brown flaxseed is more
common (Wilkes, 2007). Brown flaxseed was used in the following study. Physical and structural
properties of flaxseed have been studied and an attempt to correlate properties to flaxseed color.
However, little to no correlation between color and flaxseed properties have been made (Daun et al.,
2003). Aside from color, dimension is another physical property of flaxseed. In general, flaxseeds
have a length of 3.0-6.4 mm, a width of 1.8-3.4 mm and a thickness of 0.5-1.6 mm (Coskuner and
Karababa, 2007). Other flaxseed physical properties can be correlated to moisture content. For
example, both the true density of flaxseeds and porosity increases as the moisture content increases
(Coskurner and Karababa, 2007). While physical properties dictate how flaxseeds are mechanically
processed, the chemical composition of flaxseed dictates it’s final end use.
2.2. Composition of flaxseed
A general chemical composition of flaxseed is as follows (Figure 1): lipid- 40%,
carbohydrate-30%, protein-20%, ash-4%, and moisture-6% (Daun et al., 2003). However,
composition percentages range as different analytical techniques and procedures are used. A
discussion of each chemical component can be found in the proceeding sections.
4
Figure 1. General proximate composition of flaxseed (lipid- 40%, carbohydrate-30%, protein-20%,
ash-4%, and moisture-6%) as reported by Daun et al., 2003.
2.2.1. Lipid
A majority of the lipids found in flaxseed are neutral lipids, more specifically acylglycerols
and fatty acids (Daun et al., 2003). Of the fatty acids, over 50% of them are alpha-linolenic acid
(Muir and Westcott, 2003). In addition, oleic and linoleic acid make up 18% and 14% of the fatty
acids, respectively (Daun et al., 2003). Thus, over 82% of the fatty acids are unsaturated. The highest
degree of unsaturation is nutritionally desirable but undesirably unstable in food applications,
making quality control extremely difficult.
Recent research has indicated that enhanced quality and nutritional properties could be
obtained in flaxseed oil incorporated with flaxseed lignin. In addition, current studies have explored
the minor fractions of flaxseed oils such as phospholipids (Herchi et al., 2011). Herchi et al. (2011)
Lipids!
Carbohydrates!
Protein!
Ash!
Moisture!
5
reported phosopholipids ranged from 1.8-2.5% of the total lipids. More specifically,
phosphatidylethanolamine and phosphatidylinositol derivatives containing stearic and palmitic fatty
acids were the main phospholipids in flaxseed oil (Herchi et al., 2011).
2.2.2. Protein
While flaxseed is approximately 20% protein, in general, as the protein content of flaxseed
increases, the lipid content decreases, this inverse relationship is common in many oilseeds (Oomah
and Mazza, 1993). Although there is 20% protein in flaxseed, much difficulty has been encountered
during protein extraction due to water soluble mucilage (Oomah and Mazza, 1993). In general, most
studies reported a salt-soluble protein (High molecular weight, HMW) and a water soluble protein
(LMW) fraction (Wang et al., 2010a; Chung et al., 2003).
Functionally, in comparison to soybeans, flaxseed proteins are more lipophilic (Daun et al.,
2003) and mimic the solubility of sunflower proteins (Oomah and Mazza, 1993). However, crude
flaxseed proteins, containing water soluble mucilage and lipophilic proteins, have exhibited good
emulsifying and foaming capabilities and stability (Wang et al., 2010b; Oomah and Mazza, 1993).
Moreover, the extent of functionality is dependent on pH and presence of salts during extraction
(Oomah and Mazza, 1993).
2.2.3. Carbohydrate
Carbohydrates are often classified into two groups. Flaxseed contains small amounts (1-2%)
of monosaccharide, disaccharide and starch (Daun et al., 2003). In contrast, flaxseed contains a
substantial amount (28%) of non-digestible carbohydrates (i.e. dietary fiber) compared to other
oilseeds (Daun et al., 2003). The dietary fiber fraction includes both soluble and non-soluble
components (Kristensen et al., 2011). Of interest and topic of further discussion, flaxseed soluble
dietary fiber will be covered in section 2.3. Flaxseed Fiber.
6
2.2.4. Minor Components
Minor components that constitute flaxseed include minerals, vitamin B, phenolics and
lignans (Daun et al., 2003). Significant levels of potassium (0.55%), phosphorus (0.44%), iron
(3.7%), zinc (3.8%), copper (0.79%) and manganese (1.3%) (Daun et al., 2003). Phenolics and
lignans in flaxseeds have become a recent research interest due to potential health benefits (Bravi et
al., 2011). Of significant quantities and interest in flaxseeds is the lignan SDG and ferulic acid (Daun
et al., 2003). However, the quantity of these compounds varies with cultivar, growing environment
and extraction procedure (Hall et al., 2006).
2.3. Flaxseed Fiber
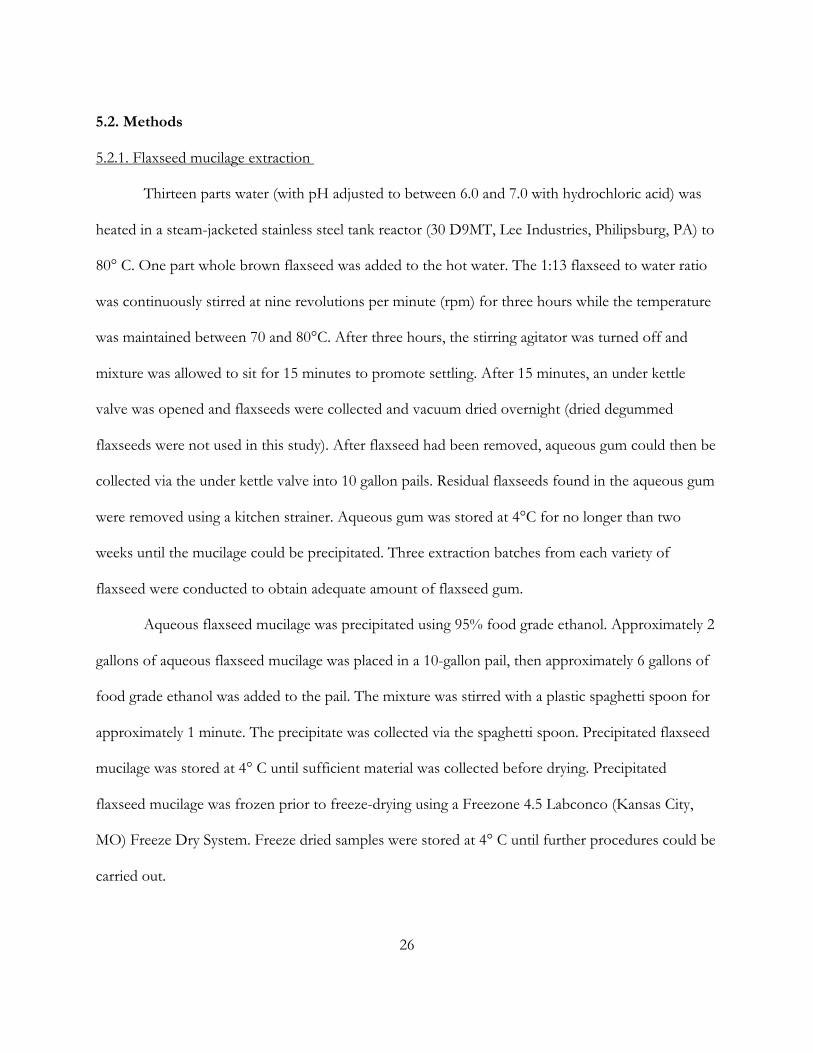
2.3.1. Extraction
The epidermal layer of flaxseed is a water soluble fiber (Ziolkovska, 2011) that is
approximately 8% of flaxseed by weight (Cui et al., 1994). The biological function of flaxseed
mucilage is to entrap water for seed germination (Naqvi et al., 2011). Water binding capabilities are
the premise for extraction. Thus, aqueous extraction of whole seed, followed by alcohol
precipitation and drying are sufficient to isolate the flaxseed mucilage (Oomah, 2003).
Various extraction yields have been reported. Yield is significantly influenced by
temperature; however, rheological properties and protein content depend on pH and seed to water
ratio (Cui et al., 1994). Cui et al. (1994) suggested that optimal conditions for obtaining mucilage
with desired rheological behavior was a three hour extraction with 13 parts water to 1 part whole
flaxseed (Cui et al., 1994). Water was at a pH of 6.7-7.0 and 85-90°C (Cui et al., 1994). Cui et al.
(1994) reported a yield of 8.0% and less than 80 g protein/kg mucliage. However, recent research
suggests that for commercial production of flaxseed mucilage, different parameters are needed
(Ziolkovska, 2011). Ziolkovska (2011) reported that flaxseed hulls exposed to a 30 minute
7
countercurrent extraction at a water to seed ratio of 25:1 with water at 78-82°C will result in yields
upwards to 8.2%. However, no protein analysis was reported in the Ziolkovska’s (2011) study.
Therefore, the true carbohydrate yield may be lower than their reported value due to higher protein
yields.
2.3.2. Composition
Compositional analysis on the mucilage fraction of flaxseed has been reported in several
studies. However, it should be noted that composition was limited to protein and carbohydrate
analysis.
2.3.2.1. Protein
Crude flaxseed mucilage may contain upwards to 20% protein after extraction (Cui, 2001).
This is due to mucilage being located at the epidermis, where it can be tightly linked to protein (Cui,
2001; Izydorczyk et al., 2005). Cultivar and growing environment influence the protein content of
flaxseed gum (Cui and Mazza, 1996; Oomah and Mazza, 1993). Reduction in pH and temperature
during extraction can reduce the amount of protein found in the crude flaxseed mucilage (Cui et al.,
1994; Zhang et al., 2009). While protein is often undesirable, no research has been completed on
purified flaxseed gum. Limited research on purified flaxseed gum is most likely due to handling
difficulties and product loss that occurs during the purification process.
While protein contamination seems inevitable, it may have some function in flaxseed
mucilage properties. In general, flaxseed proteins are lipophilic (Daun et al., 2003); therefore, it is
proposed that the emulsifying and interfacial properties may be due to proteins present in the
mucilage (Cui and Mazza 1996). However, no research has been reported that isolated and
characterized the protein from mucilage.
8
2.3.2.2. Carbohydrate
The polysaccharide portion of flaxseed gum, observed by Cui (2001), varies widely in
monosaccharide composition, mostly due to cultivar and growing condition (Cui and Mazza 1996).
Structural determination of flaxseed gum polysaccharides has been conducted. Izydorczyk et al.
(2005) reported flaxseed mucilage had two fractions. A backbone of (1→4)-linked β-D-
xylopyranosyl residues was observed for the neutral fraction. This fraction contained O-2 and/or O-
3 arabinose and galactose side chains. The second fraction is acidic and composed of (1→4)-linked
α-D-galacturonopyranosyl and (1→2)-linked α-L-rhamnopyranosyl backbone. This backbone
contains L-fucose and D-galactose chains (Izydorczyk et al., 2005). The galacturonopyranosyl
backbone provides carboxylic acid groups which cause the backbone to be acidic (Izydorczyk et al.,
2005).
While structural determination has been completed, Whistler and BeMiller (1997) noted that
mucilage and heterogeneous gums (i.e. flaxseed gums) are often highly branched with a number of
possible structures (Whistler and BeMiller, 1997). The wide range of monosaccharide composition
(Cui, 2001), neutral to acidic monosaccharide ratio (Izydorczyk et al., 2005) and knowledge of
mucilage and heterogeneous gums indicates a large number of possible structures for flaxseed gum
(Whistler and BeMiller, 1997).
2.3.3. Functional Properties
While it is applicable to place flaxseed mucilage in many products due to its health benefits
(Muir and Westcott, 2003), flaxseed mucilage in products causes changes in sensory attributes of the
final product (Pohjanheimo et al., 2006). Furthermore, variation can arise between batches of
flaxseed mucilage depending on flaxseed cultivar and component extraction methods (Cui et al.,
9
1994; Cui and Mazza, 1996). Thus it poses sensory, quality, and consistency challenges for product
development (Pohjanheimo et al., 2006; Cui et al., 1994; Cui and Mazza, 1996).
The chemical composition of flaxseed mucilage contributes to its functional properties (Cui
et al., 1994; Cui and Mazza, 1996; Chen et al., 2006). While functionality information about mucilage
proteins is minimal, in general it is reported that mucilage proteins contribute to the emulsifying
properties of mucilage via lipophilic interactions (Oomah and Mazza, 1993; Cui and Mazza, 1996).
In addition to protein, carbohydrates also possess functional properties. It was observed by Cui
(2001) that the neutral and acidic carbohydrate fraction of the flaxseed mucilage polysaccharides
exhibit individual flow properties. Cui and Mazza (1996) report that the smaller molecular weight
acidic carbohydrate fraction exhibits Newtonian flow with weak rheological properties. In contrast,
the larger molecular weight neutral fraction exhibits shear thinning and weak gel properties (Cui and
Mazza, 1996). Differences in flow properties could be a result of molecular size differences and
ability to hold water (Cui and Mazza, 1996).
While flaxseed is generally recognized as a non-gelling hydrocolloid (Cui et al., 1994), it’s
weak gel properties have been reported and studied. Chen et al. (2006) reported flaxseed mucilage
was a thermoreversible gel (melting upon heating and gelling upon cooling). However, gel strength
was dependent on source, concentration and additives (Chen et al., 2006). Cui and Mazza (1996)
observed weak gel properties at 1 and 2% (w/w) concentrations. However, as concentration
(upwards to 4%) increased the gel strength also increased (Chen et al., 2006). They proposed that
increasing the concentration resulted in more interactions (i.e. junction zones) between the
polysaccharide molecules. Chen et al. (2006) also reported that it was possible to alter the
functionality of flaxseed mucilage by controlling the number of junction zones with salts and altering
the pH. A pH of 3 to 4 resulted in the firmest gel. Sodium chloride (NaCl) reduced the strength of
10
the gel due to a reduction of junction zones via repulsive forces. In contrast, CaCl2 promoted gel
strength by bringing two polysaccharide molecules together (Chen et al., 2006).
In addition to chemical composition, different drying methods of the aqueous flaxseed
mucilage altered the functionality (Wang et al., 2010a). Wang et al. (2010a) reported that in
comparison to untreated samples, ethanol precipitated gum had the best emulsion stability. Gum
prepared by spray drying had the least emulsion stability, but had an increased foam stability. Oven
drying at 105° C increased foam capacity. In general, all drying methods reduced gel strength.
Research suggest that in addition to cultivar, a specific drying method should be considered for
desired functionality (Wang et al., 2010a).
2.3.4. Applications
Multiple researchers have reported several uses for flaxseed mucilage. Adjusting the pH of
flaxseed mucilage solutions can change the charge of flaxseed mucilage particles, allowing attraction
or repulsion to other compounds (Chen et al. 2006). Recently this technology has been applied to
stabilizing commercial drink products containing whey protein isolates (Khalloufi et al., 2009; Kuhn
et al., 2011). Qin et al. (2005) explained that flaxseed mucilage can stabilize cloudy carrot juice via
steric repulsion and reduce the creaming of carrot juice due to its emulsion capacity. Moreover,
Whistler and BeMiller (1997) suggested flaxseed mucilage could replace gum arabic in emulsion
systems. Flaxseed mucilage has numerous emulsion applications. Cui and Mazza (1996) reported
that flaxseed mucilage has the potential to replace all non-gelling gums.
Previous results suggest flaxseed mucilage can be successfully incorporated in a baked bread
product (Garden-Robinson, 1993; Unpublished data, 2007). Garden-Robinson (1993) reported that
flaxseed fiber increased loaf volume of fresh bread in comparison to bread with no fiber. However,
various effects of flaxseed fiber on texture have been reported. At storage day 0, 1 and 4, 3%
11
flaxseed fiber greatly increased the firmness of the fresh bread (Unpublished data, 2007). However,
Garden-Robinson (1993) reported less firm texture in bread with flaxseed gum in comparison to
bread containing xanthan and bread without gum.
It has been reported that flaxseed mucilage has the potential to be incorporated into food
systems; however, currently there are no large commercial applications of flaxseed mucilage
(Warrand et al., 2005), with the exception of a texturizing agent for the cosmetic industry (Khalloufi
et al., 2009). Moreover, it should be noted that flaxseed mucilage has a potential to be used in a
variety of applications with appropriate processing (extraction and drying methods) and cultivar
selection (Cui and Mazza, 1996; Cui et al., 1994).
2.4. Frozen bread dough
2.4.1. Applications
Currently, 7% of bread and pastries in Europe are frozen products (Ribotta et al., 2006).
These frozen goods include products such as: bread, prepared pizzas, pastries and other wheat
dough products (Ribotta et al., 2006). For individual consumers, restaurants and grocery stores,
frozen bread offers the convenience of fresh baked bread without the early mornings and laborious
work involved in making bread dough (Lorenz and Kulp, 1995; Minervini et al., 2011). However,
increased leavening time, small loaf volume and poor bread quality in breads baked from frozen
dough are common problems observed by users (Minervini et al., 2011). To increase overall quality
of breads made from frozen bread dough, researchers have explored processing and ingredient
factors to stabilize dough during frozen storage.
2.4.2. Processing
While researchers have discovered that ingredients can be added to frozen bread dough to
improve the quality, much research has explored how processing effects play a key role in final
12
quality of bread made from frozen dough. Key processing operations in frozen bread dough
production are mixing, pre-fermentation and freezing.
2.4.2.1. Mixing
The objectives of mixing are straight forward: combine all ingredients uniformly, hydrate the
ingredients, develop gluten and incorporate air (Ribotta et al., 2006). However, a number of
variables during mixing makes the process less straight forward. In frozen bread dough, Lorenz and
Kulp (1995) and Huang et al. (2008) both agree that the dough temperature during mixing can have
detrimental effects on bread quality. Due to the high amount of energy being introduced to the
dough system during mixing, the temperature of the dough begins to rise allowing for fermentation
to begin (Lorenz and Kulp, 1995). Fermentation prior to freezing can result in bread with lower
quality (i.e. proof time and loaf volume) in comparison to bread baked from frozen bread dough
with no fermentation prior to freezing (Hsu et al., 1979).
The temperature rise in dough during mixing is a result of friction between the dough, the
mixing bowl and the hook/pin/paddle (Ribotta et al., 2006). The longer the mixing time the more
heat will be generated; however cutting the mixing time short can also produce low quality product.
Mixing the dough to full development is critical to both fresh and frozen bread dough quality
(Lorenz and Kulp, 1995).
2.4.2.2. Fermentation
Although fermentation is necessary to leaven dough, fermentation prior to freezing can be
detrimental to bread quality (Gabric et al., 2011). As the fermentation time prior to freezing
increases, the reduction in loaf volume becomes increasingly significant (Nemeth et al., 1996). Due
to increased proof times required, researchers suggest that the reduction in loaf volume, as a result
13
of pre-fermentation, is often due to a loss of yeast viability caused by the freezing process (Nemeth
et al., 1996).
2.4.2.3. Freezing
The process of freezing converts a portion of the dough (water) from an amorphous
structure to a crystalline structure (ice) (Cauvain, 2003). The process of converting water into ice
requires nucleation (Kiani and Sun, 2011). In dough systems, when dough has been super-cooled
(Kiani and Sun, 2011), nucleation occurs at the gas pore interface and within the dough matrix
(Baier-Schenk et al., 2005). Either simultaneously or immediately after nucleation, crystal growth
begins (Kiani and Sun, 2011). Ice crystal growth results when water, within the dough, is
redistributed from dough constituents (i.e. protein, starch, etc) to ice crystal nucleation sites to
minimize the surface to volume ratio of ice (Leray et al., 2010; Baier-Schenk et al., 2005).
In bread dough, it has been reported that ice crystals at the gas pore interface are much
larger than the ice crystals within the dough matrix (Baier-Schenk et al., 2005). Large ice crystals at
the pore interface are a result of nucleation preference (Baier-Schenk et al., 2005). The gas pore
interface provides a solid surface with low interfacial energy, surface irregularities for promoting
nucleation (Baier-Schenk et al., 2005). Therefore, water is more readily redistributed there to
minimize the surface to volume ratio (Baier-Schenk et al., 2005).
Processing factors such as rate of cooling, the temperature and the length of time for which
dough is frozen, controls the ice crystal size. These parameters have been correlated to final bread
characteristics and are significantly important for final bread quality (Matuda et al., 2011). Research
has reported that at slower freezing rates yeast retains its gassing power or ability to produce CO2
(Yi and Kerr, 2009). However, at slower freezing rates ice crystal sizes are much larger and more
14
damaging to the gluten network (Kiani and Sun, 2011; Yi and Kerr, 2009). In addition to freezing
rate, temperature of storage also has an effect of yeast and gluten retention. According to Yi and
Kerr (2009), lower freezing temperatures are beneficial for both yeast vitality and retention of the
gluten structure. While freezing rate and freezing temperature are critical processing factors, the
most damaging to the gluten network and frozen bread dough quality was the amount of time
dough spends in frozen storage (Yi and Kerr, 2009).
2.4.3. Ingredients
Bread made from frozen dough has similar quality to bread made from fresh dough during
the first few weeks of storage. However, small loaf volume and lack of carbon dioxide production by
yeast has been reported after a few weeks of storage (Lorenz and Kulp, 1995). In frozen dough
systems, current research is being conducted to determine processing or ingredient treatments that
increase yeast viability (Nemeth et al., 1996). Most commonly, additional ingredients are used to
increase the viability of yeast (Lorenz and Kulp, 1995). Therefore, the following section will focus
on ingredients that can potentially increase the shelf life of frozen bread dough.
2.4.3.1. Flour
Flour is the source of protein and starch for bread’s structure. The type of flour used plays a
critical role in final bread quality (Giannou et al., 2003). Although, suppliers offer a wide array of
flours for bakers, there are a few key specifications that should be noted when purchasing flour to
be used for frozen bread dough.
While protein content generally increases water absorption, protein quality, more specifically,
gluten quality is generally more important than total protein in bread making (Hoseney, 1994).
Gluten is a viscoelastic mass formed when wheat flour proteins, glutenin and gliadin are hydrated
15
and mixed (Giannou et al., 2003). Gluten is extensible and able to stretch bi-axially facilitating
entrapment of carbon dioxide produced from yeast (Hoseney, 1994). However, it is also resistant to
extension; allowing for the formation of many bubbles instead of a few large bubbles (Hoseney,
1994). In bread dough, gluten forms a continuous network in contrast to starch, which is
discontinuous within the dough system (Schiraldi and Fessas, 2003).
Much of the reduced quality reported from frozen bread dough is due to stress and damage
on the gluten network (Ribotta et al., 2006). The process of freezing on bread dough is complex. In
general, ice crystals increase the amount of pores and reduce the thickness and uniformity of the
gluten strands (Ribotta et al., 2004). Lorenz and Kulp (1995) suggest flour with strong protein
quality is desirable for frozen dough to compensate for loss of strength during freezing; however,
extra strong flour can be undesirable for frozen dough (Bhattacharya et al., 2003). Bhattacharya et al.
(2003) and Lu and Grant (1999) reported that extra strong flour increased the amount of water
absorbed; therefore, increasing the amount of water available for redistribution during crystal growth
(i.e. freezable water). An increase in freezable water correlates to increased damage to the protein
network (Lu and Grant, 1999; Bhattacharya et al., 2003).
While protein plays a significant role in bread quality, starch has also been shown to play an
important role in bread quality made from frozen dough. When purchasing flour for frozen bread
dough it is suggested that starch granule damage and enzyme activities should be low to reduce
premature fermentation (Lorenz and Kulp, 1995). Ribotta et al. (2003) reported the freezing process
does have an effect on starch gelatinization properties. More specifically, Ribotta et al. (2003)
reported a more pronounced retrogradation with an increase in frozen storage time. It was
hypothesized that the redistribution of water could affect the arrangement of amylose and
16
amylopectin within the starch granule causing changes in the gelatinization and retrogradation
profile (Ribotta et al., 2003).
In addition, to the starch granule structure, the starch granule composition (amylose to
amylopectin ratio) can also have an effect on bread quality (Yi et al., 2009). Yi et al. (2009)
discovered that adding waxy wheat (high amylopectin) retained softness and loaf volume through 90
days of frozen storage. The increase in bread quality, due to waxy wheat was thought to be caused
by a reduction in water redistribution, thus reducing the ice crystal damage to the gluten network (Yi
et al., 2009).
Protein and starch are two main components in wheat flour affecting bread quality.
Complete removal of the starch or protein would not produce bread. However, mills often add
additional ingredients into flour such as bromate (Lorenz and Kulp, 1995). Hsu et al. (1979) suggests
that bromate have a negative effect on yeast activity, while other studies indicate that bromate
improves loaf volume (Lorenz and Kulp, 1995). Currently, bromate is allowed in baked products at
0.0075 part for each 100 parts flour (w/w) in the United States (21 CFR §136.110); however, the
European Union and other countries do not allow bromate in food products (Oreofero, 2011).
Water absorption is another important flour property. Dough is largely amorphous (Cauvain,
2003); however, during the freezing process water will reach a critical zone in which ice crystal
formation occurs (Kiani and Sun, 2011). The time it takes to pass the critical zone (rate of heat
transfer) is important for ice crystal size, shape and location (Kiani and Sun, 2011). The slower the
freezing rate the more time the product will stay in the critical zone, resulting in a large ice crystals.
In contrast, the faster the freezing rate the less time the product will stay in the critical zone,
resulting in a large amount of small ice crystals (Fellows, 2000).
17
Figure 2. Affect of freezing rate on the amount of time foods spend in the critical zone during ice
crystal formation (adopted from Fellows, 2000).
According to Matuda et al. (2011), the critical zone begins at -3.4˚C for bread dough.
However, this value can change based on the composition of the bread dough (Matuda et al., 2011).
For example, the amount and type of solutes can depress the freezing point of water to various
extents (Fellows, 2000). However, the addition of excess water to counter act the effects of solutes is
detrimental to both gluten structure and yeast viability (Lorenz and Kulp, 1995). As water turns to
ice the volume increases by approximately 9% (Fellows, 2000) resulting in damage to yeast cells and
gluten structure. Moreover, limiting water is not appropriate as complete hydration is required for
gluten development and starch gelatinization (Lorenz and Kulp, 1995).
2.4.3.2. Yeast
Similar to the gluten network, freezing for extended periods of time can damage the yeast
resulting in a lack of CO2 production and flavor development (Hino et al., 1987). Currently there is
an array of yeast types, i.e. compressed yeast, instant dry yeast, active dry yeast, (Lorenz and Kulp,
1995) and developments of new strains have given frozen dough producers more flexibility. In
18
contrast to yeast types and developments, there are several processing factors that can be controlled
to retain yeast vitality. A slow freezing rate can help retain yeast vitality and reduce the amount of
fermentation prior to freezing has also been reported to retain yeast vitality (Hino et al., 1987; Yi and
Kerr, 2009).
2.4.3.3. Dough additives
2.4.3.3.1. Oxidants. In frozen bread dough, the oxidant and the yeast contribute greatly to
dough and bread characteristics (De Stefanis, 1995). A variety of oxidants are available for bakers to
use; however, each has a different functionality and interchanging is not easy. Therefore, the baker
should be aware, not only of functionality, but of acceptable concentrations for each type of oxidant
set forth by the regulatory government. For example, the United States Food and Drug
Administration (FDA) requires that no more than 75 parts per million (ppm) for potassium
bromate; while, no more than 45 ppm for azodicarbonamide is acceptable (21 CFR §136.110).
While some countries have acceptable limits, others do not accept bromate as an oxidant
(De Stefanis, 1995). Formulation challenges arise because bromate (in the form of potassium
bromate) reacts at a slower rate than other available oxidants (De Stefanis, 1995). Therefore, finding
a replacement is difficult. Research suggests that ascorbic acid and extended mixing time (more
incorporation of air) can act as an effective bromate replacer (Chamberlin and Collins, 1979).
2.4.3.3.2. Non-fat dry milk (NFDM). NFDM, like other bread ingredients, has dual
functions. The first function is to improve crust color. NFDM is a source of lysine (United States
Dairy Export Council, 2011), which is an amino acid with an amine side group, which is limiting in
wheat. The amine side group is important as it is reactive in the Maillard browning reaction, which
involves reducing sugars and amine groups to form brown pigments (BeMiller and Huber 2008).
Buffering the effects of fermentation acids is a second function of NFDM (Lorenz and Kulp, 1995).
19
2.4.3.3.3. Vital wheat gluten (VWG). VWG can be added to flour to enhance strength,
nutrition and functionality. Most importantly, VWG provides additional strength to withstand
processing stressor such as mixing or in frozen dough the freezing process (Ribotta et al., 2006).
However, VWG should be used cautiously. Breads with extra strong gluten have been reported to
have poor quality in comparison with breads with strong gluten (Lu and Grant, 1999). Lu and Grant
(1999) report that dough with extra strong gluten is undesirable for frozen dough, as it has a higher
water-binding capacity.
2.4.3.4. Hydrocolloids
As discussed earlier, free water is detrimental to both the gluten network and yeast.
Therefore, the ability of hydrocolloids to hold water is desirable when trying to minimize ice crystal
formation and water mobility (Ribotta et al., 2006). Although, hydrocolloids do not completely
counter act the effects of the freezing process on dough, compared to control breads (no
hydrocolloids), hydrocolloids improve loaf volume (Sharadanant and Khan, 2003a,b). Sharadanant
and Khan (2003b) reported hydrocolloids better retained the continuous nature of the gluten
network more similarly to bread dough without frozen storage; thus allowing for better gas retention
(Sharadanant and Khan, 2003b). In addition, the amount of residual proteins found in dough’s made
with hydrocolloids was significantly more than the amount of residual proteins found in dough
without hydrocolloids (Sharadanant and Khan, 2003b). Increasing the amount of residual proteins
was positively correlated to increase in loaf volume (Sharadanant and Khan, 2003b).
Furthermore, the functionality of hydrocolloids is as numerous as the number of available
hydrocolloids (Ribotta et al., 2006). Some hydrocolloids, such as hydroxypropylmethylcellulose,
significantly affect the hydration properties of gluten. However, some hydrocolloids, such as gum
arabic, do not affect the hydration properties of gluten (Barcenas et al., 2009). In addition, each
20
hydrocolloid has a unique effect on the viscosity profiles of starch (Barcenas et al., 2009). Viscosity
profiles of starch have been correlated to the rate of bread firming (Barcenas et al., 2009). Therefore,
some hydrocolloids can increase or decrease the rate of bread firming.
2.4.3.5. Shortening/lipids
While an excessive amount of shortening can be detrimental, at optimal levels, shortening
can improve the processing and sensory characteristics of bread (De Stefanis, 1995). Shortening
provides flavor, structure, good crumb grain, anti-firming and many other desirable attributes to
bread in contrast to breads made without shortening (Pareyt et al., 2011). In addition, shortening
aids in the incorporation of air during mixing, lubricates dough, and plasticizes to increase final loaf
volume (Pareyt et al., 2011).
2.4.3.6. Sugar
The primary purpose of sugar is to provide an initial energy source for yeast (Ribotta et al.,
2006). However, an excessive quantity of sugar can actually reduce yeast cells via osmotic pressure
(Ribotta et al., 2006). In addition, only small amounts of sugar are needed because after enzymatic
activity of α-and β-amylase on starch, starch become yeast primary energy source (Selomulyo and
Zhou, 2007). Sugar is not only important for yeast survival, after invertase breaks it into glucose and
fructose it aids in crust color formation (BeMiller and Huber, 2008). Therefore, without sugar the
crust color would be light in color.
2.4.3.7. Sodium chloride (salt)
While salt provides desirable flavor, it also plays a biological and chemical role in bread
making (Day et al., 2009). Salt creates an osmotically stressful environment that delays yeast activity,
thereby preventing over fermentation and the biological activity of protease to retain gluten
structure (Kulp and Lorenz, 1995; Ribotta et al., 2006). Chemically, salt can create ionic links
21
(bridges) between gluten strands via ionic interactions. Salt links result in an increase in gluten
strength, most likely due to increase polymer size (Hammer et al., 2000).
2.5 Sensory analysis
While there are several instruments to describe characteristics of food, such as texture
analyzers and gas chromatographs, only sensory analysis takes into consideration predominate
characteristics perceived by humans. Furthermore, sensory analysis can give an indication of the
acceptance of a food product; ultimately, it can provide direction for the food industry (Stone and
Sidel, 1993). The consumer’s satisfaction of a product is important for a successful business (Lyon et
al., 1992). Determining how long a product will last on the shelf helps food manufacturing
companies maintain and expand business (Lyon et al., 1992). Although there are several sensory tests
available depending on the objective of the study (Lawless and Heymann, 1998), in this study a
trained panel was used to detect flavor differences in bread made from dough stored up to 20 weeks.
While the maintenance of a trained panel can be overwhelming, accurate results can provide
good insight to when an ingredient, processing, or time lapse causes a product to become
recognizable different (Meilgaard et al., 2007). Often, quantitative descriptive analysis is used to
determine these changes. However, it should be noted that these changes do not determine the
likeness of the product but rather the intensity of specific characteristics (Lawless and Heymann,
1998).
In bread, over 300 volatile compounds have been identified that correlate to bread flavor
(Jensen et al., 2011). However, chemical and physical changes occur over time that alters the flavor
and texture of bread (Selomulyo and Zhou, 2007). These changes are grouped together to form a
process called staling (Selomulyo and Zhou, 2007). In general, as bread undergoes staling the
firmness of the crumb increases (Selomulyo and Zhou, 2007), yeast flavor intensity declines, while
22
dusty and chemical acid flavors increase in intensity (Jensen et al., 2011). It should be noted that
differences in bread formulations between research studies make data comparison difficult due to
different flavor profiles. However, it is the changes in flavor and texture intensities detected by
trained sensory panel that ultimately give insight into the stability and acceptability of the bread.
23
3.0. HYPOTHESIS
The hypothesis of this research is that flaxseed fiber present in frozen bread dough will
improve the overall quality (i.e. loaf volume, texture and flavor) of bread in comparison to bread
baked from frozen dough without flaxseed fiber. In addition, the incorporation of flaxseed fiber will
help retain overall bread quality (i.e. loaf volume, texture and flavor) as dough frozen storage time
increases in comparison to bread baked from frozen dough without flaxseed fiber.
24
4.0. OBJECTIVE
Previous studies have incorporated hydrophilic gums in frozen bread dough (Sharardanant
and Khan, 2003a,b) and flaxseed gum into fresh bread dough with good results (Garden-Robinson,
1994). However, no research has been published on incorporate flaxseed gum into frozen bread
dough. The objective of this research was to assess quality changes in breads baked from frozen
bread dough with different frozen storage times, sources and concentrations. Quality changes will be
assessed by determining loaf volume, firmness, C-cell imaging, water activity and sensory profile of
the breads with different flaxseed fiber different sources, concentrations and frozen storage times.
25
5.0. MATERIALS AND METHODS
5.1. Materials
5.1.1. Flaxseed
Brown flaxseed was obtained from two separate sources. The first source was grown in
North Dakota, obtained from Heartland Flax: Valley City, North Dakota. Lot number 3C197-
020410-100. The second source of brown flaxseed was a product of Canada, obtained from
Specialty Commodities Inc: Fargo, North Dakota. Lot number 1368-G-644-BF10.
Ascorbic Acid 0.2% 0.2% 0.2% Water Optimum* Optimum* Optimum*
1Note: Two batches of 1% flaxseed fiber and 3% flaxseed fiber formulas were made. One batch used Specialty flaxseed fiber while the other used Heartland flaxseed fiber. *Note: The amount of water added varied to obtain optimal dough characteristics.
5.2.4. Bread quality
Bread loaves were analyzed for comparative quality. Texture, water activity and C-cell
imaging was conducted on center slices of bread as described below. In addition, center slices were
used for sensory analysis.
5.2.4.1. Loaf volume
Loaf volume was determined by canola seed displacement according to the AACC method
number 10-05.01 (AACC International, 1995).
5.2.4.2. Texture analysis
Peak firmness was determined by a CT3 texture analyzer (Brookfield Model CT3 10K). A
clear acrylic 9 mm diameter cylinder probe with the parameters found in Table 3, was used to test a
center slice of bread for firmness.
31
Table 3. CT3 texture analyzer procedure to determine peak firmness.
Parameter Target Value Test type Compression
Target type Distance Target Value 4.0 mm
Hold time 0 seconds Trigger Load 7.0g Test speed 0.50 mm/s
Probe TA3/100 Fixture TA-RT-KIT
5.2.4.3. C-Cell imaging
Bread slice characteristics from a center slice of bread including: number of cells, number of
holes, slice area, wrapper length, hole volume and cell wall thickness were analyzed by using a C-cell
imaging instrument by CCFRA Technology LTD (CC.200.05). The C-cell was calibrated before
testing using a grey card to standardize reflectance. Measurements were taken in units of pixels.
5.2.4.4. Water activity
Water activity was determined using an AquaLab (Series 3TE) Decagon meter from Devices
Inc. (Pullman, Washington). A center slice of bread from each loaf was selected and the center of
that slice was sampled for water activity.
5.2.4.5. Sensory analysis
Sensory analysis with nine-trained panelist was used to determine the staleness, firmness and
overall acceptability of the bread over time. Training of sensory panelists took place on three
consecutive days and involved two discussion sessions and one independent testing session.
Discussion sessions required panelists to taste, smell and touch fresh to stale bread at various
intensities. In the first discussion session, panelists were introduced to the continuous line scale they
would be using throughout the study (Figure 4). Panelists then touched, smelled and tasted the
fresh bread and identified flavors associated with fresh bread. Panelists then touched, smelled and
32
tasted stale bread and identified flavors associated with stale bread. The stale bread sample was
produced by storing fresh bread at 2.0°C for 7 days. A discussion of the two flavors, smells and
textures was conducted until a consensus of flavors identified could be reached.
In the second discussion session, panelists were refreshed with a written and verbal
description of aroma, flavors and textures discussed in the previous discussion session. Panelists
were then asked to touch, smell and taste three samples of bread of various staleness. Samples with
different intensities of staleness were produced by placing baked bread at 2.0°C for 3 (medium stale)
or 7 (high stale) days. Panelists were asked to identify the intensity of the stale flavor and texture on
a continuous scale. In addition, panelists indentified aromas by placing a check mark in a check box
next to an aroma descriptor. Aroma descriptors included yeasty, sweet, rancid, sour, cardboard or
other. After discussion and combining of results, average values for low, medium and high stale
flavor intensities and textures were determined. In the last training session, panelist were asked to
independently touch, smell and taste bread samples and rate the intensity of the stale flavor. These
results were analyzed to determine training effectiveness and reliability of panelist. Of the nine
panelists, seven were selected for their availability.
To determine detected intensity of stale flavor, crumb firmness and overall acceptability a
ruler with centimeter (cm) markings was used. The 0 cm marking was placed at the left most side of
the continuous line. The distance, in cm, from the left most point of the line to the point indicated
by the panelist with a vertical line was recorded as the intensity of the bread attribute.
33
Figure 4. Sensory scale used by trained sensory panelist to determine the characteristics of flaxseed
fiber bread over 20 weeks.
34
After training was completed, bread samples, with random three digit codes, were tested
every two or four weeks one day after baking. Samples were served to panelists according to the
randomized block design (Table 4). In addition to samples, panelists received standards every other
week to determine if extra training was needed. Standard of high or medium stale bread were
prepared in the same manner as high and medium stale bread was for training.
Table 4. Serving order of samples 1-6 for nine panelists.
Heartland flaxseed fiber (H3), 3% Specialty flaxseed fiber (S3). Results were analyzed using an
unpaired t-test with a two-tailed 95% confidence interval.
35
6.0. RESULTS AND DISCUSSION
6.1. Crude Flaxseed Fiber Analysis
6.1.1. Extraction yield
Crude fiber was extracted from Heartland and Specialty flaxseed at 2.02% and 2.61% of the
seed weight, respectively. Theoretically, an 8.0-9.0% seed weight extraction yield for flaxseed
mucilage is possible (Cui et al., 1994; Ziolkovska, 2011). Ziolkovska (2011) discussed the need for a
commercially optimized process of flaxseed fiber extraction. Previously much of the research
completed had been on a laboratory scale (Ziolkovska, 2011). However, in this study the low yield is
partially attributed to the large pilot scale equipment and lack of a better optimized process. The
equipment had many limitations. The first limitation would be the lack of a filter to separate
degummed flaxseeds from aqueous mucilage. Some aqueous gum was lost due to the inability to
remove sufficient amounts of flaxseed. A second limitation would be the surface area and crevices
present on the equipment. Large stirring paddles and unusual outlets on the interior of the steam
jacketed kettle caused a large amount of flaxseed mucilage to stick to the surface making it
uncollectable. Lastly, the amount of container transfers required to extract and precipitate fiber was
a limiting factor in extraction yield. A minimum of three transfers was needed before precipitated
flaxseed mucilage was obtained for freeze drying. In general, large amounts of aqueous flaxseed
mucilage was lost due to limitations of equipment.
Although large amounts of aqueous flaxseed mucilage were lost due to processing, the
extraction process was repeatable. Extraction yields from Heartland and Specialty flaxseed at 2.02%
and 2.61% of the seed weight, respectively, are very similar. Therefore, it may be possible to get
approximately 2.0-3.0% flaxseed fiber using another source of whole brown flaxseed.
36
6.1.2. Proximate analysis
6.1.2.1. Protein
Heartland and Specialty flaxseed fiber contained 14.7% and 12.6% protein, respectively.
Theoretically, protein content of flaxseed fiber has ranged from 0.0% to 20.0% (Cui et al., 1994). Cui
et al. (1994) reported that protein content in flaxseed fiber is inversely related to extraction pH.
However, a similar pH was used for the extraction of Heartland and Specialty flaxseed. In addition,
extraction-processing parameters were similar as indicated by similar extraction yields for Heartland
and Specialty sources. Moreover, variety and growing conditions can have a significant effect on
protein content (Cui and Mazza, 1996) and protein solubility (Mueller et al., 2010). For example,
while brown and yellow flaxseeds have similar protein contents, the solubility of brown flaxseed
protein is significantly more soluble than yellow flaxseed (Mueller et al., 2010).
Although it is possible that mucilage protein content is different due to processing
parameters, it is more likely that differences in protein content are due to source. Cui and Mazza
(1996) determined the protein content of four sources of flaxseed mucilage. It was reported that the
mucilage protein content ranged from 8.6%-16.8% with three of the four sources ranging between
13.8-16.8% (Cui and Mazza, 1996). Therefore, differences in protein content of the two sources of
flaxseed mucilage obtained are likely due the growing conditions, variety of flaxseed used and to a
lesser extent extraction protocols.
6.1.2.2. Dietary fiber
Total Dietary fiber for Heartland and Specialty flaxseed fiber was 73.6 % and 70.1%,
respectively. Singer et al. (2011) reported total dietary fiber of flaxseed mucilage to range from 20.8 -
86.1% depending on the extraction method. However, more recently using AOAC method number
985.29, Ibrügger et al. (2012) reported a dietary fiber of 70% in flaxseed fiber extracts. Therefore,
37
Heartland and Specialty flaxseed mucilage have similar dietary fiber as previously reported for other
flaxseed sources.
Insoluble fiber of Heartland and Specialty flaxseed mucilage was 10.3% and 9.8% of the
total fiber, respectively. In addition, soluble fiber for Heartland and Specialty flaxseed mucilage was
66.0% and 63.2% of the total fiber, respectively. No soluble and insoluble fiber values for flaxseed
mucilage have been reported. However, Carter (2001) reported whole flaxseed had 10% soluble
fiber and 30% insoluble fiber. Furthermore, in cereal grains, insoluble fiber ranges from 8.6% to
16.0% and soluble fiber ranges from 0.49% to 4.52% (Silva and Ciocca, 2005). High soluble fiber
content in flaxseed mucilage was due to the aqueous method used to extract flaxseed mucilage.
Insoluble fiber has limited water solubility due to the composition of the fiber being made up of
lignin, cellulose and hemicellulose (Bauer, 2005). In contrast, soluble fiber is soluble in water, usually
containing pectin’s, gums and mucilage (Bauer, 2005). Therefore, due to the aqueous method of
extraction flaxseed mucilage has a high amount of soluble fiber in comparison to the whole seed.
6.2. Objective Flaxseed Fiber Bread Quality
6.2.1. Loaf Volume
6.2.1.1. Treatment effect
In general, flaxseed fiber maintained the largest loaf volume percent retention in comparison
to breads without flaxseed fiber at a specific frozen storage time (Figure 5). For example, after two
weeks of frozen storage bread without flaxseed fiber loss 18% of it’s original loaf volume; however,
breads with flaxseed fiber lost less than 6% of their original loaf volume. With the exception of week
20, throughout the study bread without flaxseed fiber retained 5-12% more of its loaf volume than
bread with out flaxseed fiber. These results coincide with preliminary studies completed at North
Dakota State University (NDSU), where after 12 weeks of frozen storage breads containing flaxseed
38
hull had the largest loaf volumes and largest loaf volume percent retention (Hall et al., 2010). The
retention of loaf volume with the addition of flaxseed fiber was possibly due to additional structural
support provided to the gluten network. In fact, some hydrocolloids have been used in gluten free
breads as gluten replacers to provide structure to the bread (Guarda et al., 2004).
Figure 5. Percent loaf volume reduction of breads made from frozen dough with and without
flaxseed fiber stored frozen over 20 weeks.
Scanning electron microscopy completed by Sharadanant and Khan (2006) indicates that
hydrocolloids retain the continuous nature of the gluten network of dough in frozen storage;
therefore, resulting in loaf volume retention. Although loaf volume was retained with flaxseed fiber
after extended storage time, an increased amount of holes in the bread slice was observed in all
treatments except the 1% flaxseed fiber samples (Figure 6). After 20 weeks of frozen storage
control, S3% and H3% had a significantly larger amount of holes in the center slice of bread.
40%
56%
73%
89%
105%
0 2 4 8 12 16 20
% lo
af v
olum
e re
tent
ion
(rela
tive
to
wee
k 0)
Time (weeks)
Control Heartland 1% Heartland 3% Specialty 1% Speacialty 3%
39
Figure 6. Number of holes (px) in breads made from frozen dough with and without flaxseed stored frozen over 20 weeks.Values indicate number of holes after 20 weeks of frozen storage, values with different letters indicate significant differences at (p< 0.05).
Holes in bread indicate coalescence of gas cells (Scanlon and Zghal, 2001) due to a loss of
gluten properties (Liu and Scanon, 2003). Loss of gluten properties in the control bread was
expected as the loss of gluten properties of dough that has been stored frozen for a period of time
has been previously reported (Lorenz and Kulp, 1995). However, hydrocolloids are able to improve
loaf volume by providing support to the gluten structure and gas cell interface (Mandala et al., 2007),
it is possible that the increased amount of flaxseed fiber held large amounts of water close to the
gluten network causing larger amounts of ice damage in comparison to other treatments.
Sharadanant and Khan (2006) observed that different hydrocolloids had various amounts of dough
protein depolymerization after frozen storage. It was hypothesized that each hydrocolloid caused
different amounts and sizes of ice crystals to form (Sharadanant and Khan, 2006). Therefore,
hydrocolloids that formed larger amounts of ice crystals that were large in size depolymezired the
0 1 2 3 4 5 6 7 8 9
0 2 4 8 12 16 20
Hol
es (p
x)
Time (weeks)
Control Heartland 1% Heartland 3% Specialty 1% Specialty 3%
8.23a 8.15a
5.60a
2.64b 1.76b
40
gluten network. In addition, an increase in concentration of a hydrocolloid that forms large amounts
of large ice crystals would also result in increased depolymezired network. The increase in amount of
water held by the Heartland 3% and Specialty 3% flaxseed fiber could attract redistributing water
and hold the water close to the gluten network causing large holes in bread baked, (Figure 6).
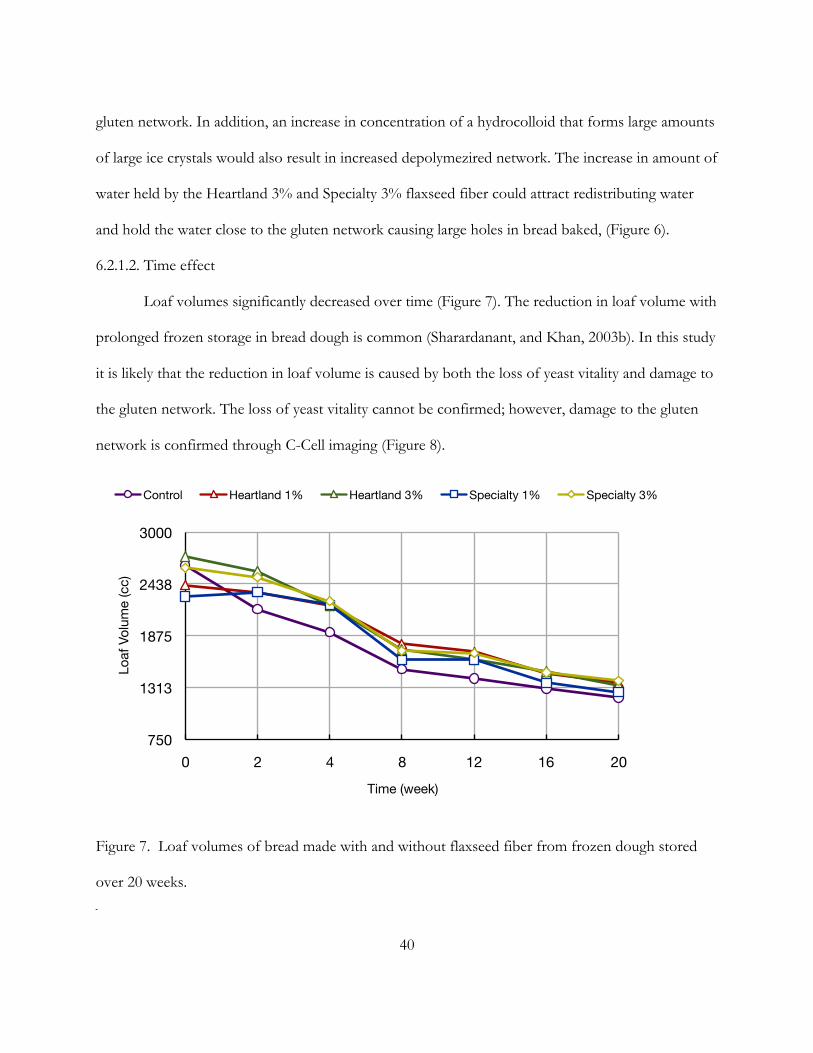
6.2.1.2. Time effect
Loaf volumes significantly decreased over time (Figure 7). The reduction in loaf volume with
prolonged frozen storage in bread dough is common (Sharardanant, and Khan, 2003b). In this study
it is likely that the reduction in loaf volume is caused by both the loss of yeast vitality and damage to
the gluten network. The loss of yeast vitality cannot be confirmed; however, damage to the gluten
network is confirmed through C-Cell imaging (Figure 8).
Figure 7. Loaf volumes of bread made with and without flaxseed fiber from frozen dough stored
over 20 weeks.
750
1313
1875
2438
3000
0 2 4 8 12 16 20
Loaf
Vol
ume
(cc)
Time (week)
Control Heartland 1% Heartland 3% Specialty 1% Specialty 3%
41
Figure 8. C-Cell images of breads with or without flaxseed fiber made from frozen dough stored
over 20 weeks.
42
The amount of holes in the bread slice crumb increased with frozen storage time (Figure 6).
Holes in bread indicate coalescence of gas cells (Scanlon and Zghal, 2001), due to loss of gluten
properties (Liu and Scanon, 2003). Therefore, it is suggested that the loss of loaf volume retention is
likely due to the break down of gluten network structure.
6.2.2. Firmness
6.2.2.1. Treatment effect
Use of other hydrocolloids to bread systems have had various influences on the firmness of
bread (Sharardanant, and Khan, 2003b; Zhou et al., 2008). At week 0, breads containing flaxseed
fiber were firmer than bread without flaxseed fiber. This trend was observed in preliminary studies
at NDSU. In fresh dough the addition of flaxseed fiber increased the firmness of the bread crumb
(Unpublished data, 2007). Furthermore, the addition of flaxseed hull to frozen dough increased the
firmness of bread crumb at week 0. However, after week 2 breads containing flaxseed hull were less
firm than breads containing oat, soy or no fiber at similar frozen storage times (Hall et al., 2010).
Similar results were observed in this study. The addition of flaxseed fiber retained the lowest percent
increase in firmness over time (Figure 9.) After 20 weeks of storage, the control had a firmness value
of 192 g. This value is significantly higher than all other treatments containing flaxseed fiber which
had firmness values ranging from 107 to 132 g after 20 weeks of frozen storage. Hall et al. (2010)
reported bread containing flaxseed hull baked from frozen dough produced the softest slices of
bread over 20 weeks in comparison to breads baked from frozen dough containing soy, oat or no
fiber.
43
Figure 9. Percent increase in firmness (g) of breads made from frozen dough with and without
flaxseed fiber stored frozen for various periods of time over 20 weeks.
Firmness of bread is often attributed to starch retrogradation characteristics (Hoseney,
1994). According to Mixolab results (Figure 10), flour mixtures with 3% Heartland or 3% Specialty
flaxseed fiber had the highest retrogradation torque. This could be due to the cold set gel properties
flaxseed mucilage exhibits (Chen et al., 2006). Increasing the concentration in flaxseed fiber
increased the number of interactions between the mucilage molecules. Thus, a gel network was built
and this increased the torque required by the mixolab to mix the retrograded sample.
A firmer crumb at week 0 in breads containing flaxseed fiber could be a result of flaxseeds
gel properties. However, the retention of a soft crumb throughout frozen storage in breads
containing flaxseed fiber may be due to effects of the freezing process. During the freezing process
it is possible that release of compounds such as glutathione from yeast cells (Meziani et al., 2012)
changed the pH resulting in gels that are weaker than in the mixolab analysis (Chen et al., 2006). It
has been reported that hydrocolloids can influence amylose-lipid complexes (Rojas et al., 1999) and
0%
200%
400%
600%
0 2 4 8 12 16 20
Text
ure
(% in
crea
se re
lativ
e to
wee
k 0)
Time (week)
Specialty 1% Heartland 3% Specialty 3% Heartland 1% Control
44
interfere with gluten-starch interactions; thus reducing firmness of bread (Davidou et al., 1996). In
addition, during bread making other ingredients such as sodium chloride, was added. Sodium
chloride reduces the gel strength of flaxseed mucilage (Chen et al., 2006). In general, hydrocolloids
intensified retrogradation, which is often associated with increased crumb firmness (Zhou et al.,
2008), during mixolab analysis. However, breads containing hydrocolloids had the softest crumb,
possibly due to gel-weakening ingredients and chemical changes during the freezing and baking
processes.
Figure 10. Mixolab torque (Nm) at points C1, C2, C3, C4 and C5 for flour with and without flaxseed
fiber. See Figure 3, page 28 for description of data collection.
6.2.2.2. Time effect
As frozen storage time increased breads became more significantly firm (Figure 10).
Sharardanant and Khan (2003b) also reported an increase in crumb firmness with frozen storage
0.4 0.6 0.8 1.0 1.2 1.4 1.6 1.8
C1 C2 C3 C4 C5
Torq
ue (N
m)
Mixolab property
Control Heartland 1% Heartland 3% Specialty 1% Specialty 3%
45
time. The increase in firmness with increased frozen storage time is likely due to changes in protein
and starch properties (Sharardanant and Khan, 2006). Ribotta et al., (2003) reported an increase in
frozen storage caused an increase in retrogradation of starch. The tendency for retrogradation during
frozen storage of wheat starch was not affected by the addition of hydrocolloids (Zhou et al., 2008).
However, the studies only analyzed wheat starch and not wheat flour (including gluten proteins). It
has been reported that interactions between starch and protein have significant effects on the
firming of bread (Davidou et al., 1996).
The mechanism for bread firming is highly dependent on starch retrogradation; however, it
does not explain the complete firming mechanism (Goesaert et al., 2009). Moisture migration from
gluten to starch also effects bread firming (Armero and Collar, 1998). As frozen storage time
increases, the gluten network becomes more discontinuous (Sharardanant and Khan, 2006), resulting
in increased freezable water (Lu and Grant, 1999; Bhattacharya et al., 2003). However, the addition
of specific hydrocolloids can act as moisture migration buffers by aiding in the retention of the
gluten network (Sharardanant and Khan, 2003b). Therefore, increasing the flaxseed fiber
concentration resulted in retention of water near the gluten network and thus reduced crumb
firmness.
6.2.3. Water activity
6.2.3.1. Treatment effect
No significant differences in water activity were detected among treatments. No detected
differences in water activity are possibly due to the differences in water added to specific formulas
and the water hold capacity of flaxseed fiber. The water absorptions obtained from Mixolab profiles
were used as a reference; however, dough was mixed to optimal consistency with various amounts
of water based on the feeling of the dough within the first two minutes of mixing. In general, more
46
water was added to breads containing more flaxseed mucilage (Table 5). This is due to increased
water holding capacity of flaxseed mucilage, as a result, no extra free water was available to increase
the water activity of the baked bread.
Table 5. Water amount added to of bread dough formulas made with and without flaxseed fiber.
Control Heartland 1% Specialty 1% Heartland 3% Specialty 3% Water (ml) 4160 4789 4641 5058 4855 Water (% Flour) 57% 66% 64% 70% 67% 6.2.3.2. Time effect
Limited differences in water activity among frozen storage time were observed (Figure 11).
Moisture migration between constituents in frozen bread dough has been reported in previous
studies (Lu and Grant, 1999; Bhattacharya et al., 2003). Moisture migration between constituents
could have occurred but due to extended periods of time between baking limited changes were
observed.
Figure 11. Water activity (Aw) of bread made from frozen dough with and without flaxseed fiber
stored frozen over 20 weeks.
0.945 0.95
0.955 0.96
0.965 0.97
0.975 0.98
0.985
0 2 4 8 12 16 20
Wat
er A
ctiv
ity
Time (week)
Control Heartland 1% Heartland 3% Specialty 1% Specialty 3%
47
6.3. Subjective Flaxseed Fiber Bread Quality
6.3.1. Crumb Firmness
6.3.1.1. Treatment effect
According to a trained sensory panel, the addition of flaxseed fiber result in bread with
crumb that was detected to be significantly softer than the crumb of bread made without flaxseed
fiber (Table 6). However, specific trends among the flaxseed fiber treatments were not observed. It
is likely that because a trained panel cannot detect the difference that consumers will also not likely
be able to detect the difference among flaxseed fiber source and concentration (Meilgaard et al.,
2007). Therefore, to reduce cost to bakers or users of frozen dough, 1% flaxseed fiber from
Heartland or Specialty is sufficient to reduce the firmness of bread made from frozen bread dough.
Table 6. Changes in firmness responses (cm) in baked bread from frozen dough with and without
flaxseed fiber, as indicated by sensory panelists.
Association of Official Analytical Chemists. Approved Methods of Analysis, 16th Ed. Method 991.43. Total, soluble and insoluble dietary fiber in foods. 1995. AAC, Arlington Virginia.
Armero, E., Collar, C., 1998. Crumb firming kinetics of wheat breads with anti-staling additives. Journal of Cereal Science 28(2), 165–174.
Baier-Schenk, A., Handschin, S., von Schonau, M., Bittermann, A. G., Bachi, T., Conde- Petit, B., 2005. In situ observation of the freezing process in wheat dough by confocal laser scanning microscopy (clsm): Formation of ice and changes in the gluten network. Journal of Cereal Science 42, 255-260.
Barcenas, M.E., De La O-Kellar, J. Rosell, C.M., 2009. Influence of different hydrocolloids on major wheat dough components (gluten and starch). Journal of Food Engineering 94, 241-247.
Bauer, J. 2005. The complete idiot's guide to total nutrition. New York, New York. BeMiller, J.N., Huber, K.C., 2008. Amino acids, peptides and protein and Carbohydrates. In:
Fennema, O. R., Damodaran, S., Parkin, K. L. (4th eds), Fennema's food chemistry. CRC Press, Boca Raton, FL, pp. 157-180,321-416.
Bhattacharya, M., Langstaff, T. M., Berzonsky, W. A., 2003. Effect of frozen storage and freeze–thaw cycles on the rheological and baking properties of frozen doughs. Food Research International 36(4), 365-372.
Bravi, E., Perretti, G., Marconi, O., Patrizi, E., Fantozzi, P., 2011. Secoisolariciresinol diglucoside determination in flaxseed (linum usitatissimum l.) oil and application to a shelf life study. Food Chemistry 126(4), 1553-1558.
Carter, J., 2001. Flaxseed as a functional food for people and feed for other animals. Retrieved from http://www.ag.ndsu.nodak.edu/plantsci/flaxseed.htm (Accessed March 1, 2012).
Cauvin, S.P., 2003. Foam formation in dough and bread quality. In: Cauvin, S.P., Bread making. Woodhead Publishing Limited, Boca Raton, Florida, pp. 315-317.
Center for Disease Control, 2011, February 23. Nutrition for everyone: carbohydrates.
53
Retrieved from http://www.cdc.gov/nutrition/everyone/basics/carbs.html (accessed February 29, 2012).
Chamberlin, N., Collins, T.H., 1979. The Chorleywood bread process: the role of oxygen and nitrogen. Baker’s Digest 53, 18-24.
Chen, H., Xu, S., Wang, Z, 2006. Gelation properties of flaxseed gum. Journal of Food Engineering 77, 295-303.
Chung M.W.Y, Lei, B., Li-Chan, E.C.Y., 2003. Isolation and structural characterization of the major protein fraction from NorMan flaxseed (linum usitatissimum L.) Food Chemistry 90, 271-279.
Coskuner, Y., Karabab, E., 2007. Some physical properties of flaxseed (linum usitatissimum). Journal of Food Engineering 78, 1067-1073. Code of Federal Regulations (CFR), Title 21: Subchapter B. Subsection 136.110. Cui, S.W., 2001. Flaxseed gum. In: Cui, S.W., Polysaccharide gums from agricultural products.
Technomic Publishing, Lancaster PA, pp. 59-101. Cui, S.W., Mazza, G., 1996. Physiochemical characteristics of flaxseed gum. Food Research
International 29(3-4), 397-402. Cui, S.W., Oomah, B.D., Mazza, G., Biliaderis, C.G., 1994. Optimization of an aqueous
extraction process for flaxseed gum by response surface methodology. Lebensmittel-Wissenschaft und-Technologie 27(4), 363-369.
Cullis, C.A., 2007. Flaxseed. In: Kole, C., Oilseeds. Springer, New York, pp. 275-302. Daun, J.K., Barthet, V.J., Chornick, T.I., Duguid, S., 2003. Structure, composition, and variety
development of flaxseed. In: Thompson, L., Cunnane, S., Flaxseed in human nutrition. AOCS Press. pp. 1-40.
Davidou, S., Le Meste, M., Debever, E., Bekaert, D., 1996. A contribution to the study of staling of white bread: effect of water and hydrocolloid. Food Hydrocolloids 10(4), 375–383.
Day, L., Augustin, M., Pearce, R. J., Batey, I. L., Wrigley, C. W., 2009. Enhancement of gluten quality combined with reduced lipid content through a new salt-washing process. Journal of Food Engineering 95(2), 365-372.
De Stefanis, V.A., 1995. Functional role of microingredients in frozen dough’s. In: Kulp, K., Lorenz, K., Brummer, J., Frozen refrigerated dough and batters. AACC, St. Paul, MN, pp. 91-118
Fellows, P. J., 2000. Freezing. In: Fellows, P.J., Food processing technology: Principles and practice (second ed). TJ International, Cornwall, England, pp. 420-422.
Gabric, D., Ben-Aissa, F., Le-Bail, A., Monteau, J. Y., Curic, D., 2011. Impact of process conditions on the structure of pre-fermented frozen dough. Journal of Food Engineering 105(2), 361-366.
Garden-Robinson, J., 1993. Flaxseed gum: Extraction, characterization, and functionality. (Doctoral dissertation, North Dakota State University).
Giannou, V., Kessoglou, V., Tzia, C., 2003. Quality and safety characteristics of bread made from frozen dough. Trends in Food Science Technology 14, 99-108.
Goesaert, H., Slade, L., Levine, H., Delcour, J.A., 2009. Amylases and bread firming – an integrated view. Journal of Cereal Science 50(3), 345–352.
Guarda, A., Rosell, C.M., Benedito, C., Galotto, M.J., 2004. Different hydrocolloids as bread
54
improvers and antistaling agents. Food Hydrocolloids 18, 241-247. Hall, C., Niehaus, M., Kuchynski, J., Tulbek, M.C., 2010. Use of flaxseed gum in frozen bread
dough. In: Proceedings of the 63rd flax institute of the untied states. pp.87-93. Hall, C., Tulbek, M. C., Xu, Y., 2006. Flaxseed. In: Taylor, S. (Vol 51), Advances in food and
nutrition research. Elsevier, San Diego, CA, pp. 1-97. Hammer, R. J., Vliet, T. V., 2000. Understanding the structure and properties of gluten: an overview
In: Shewry, P. R., Tatham, A. S. (7th ed), Wheat gluten. MPG Books ltd., Cornwall, United Kingdom, pp. 125.
Hammond, J., 2011. Flax breeding objectives. Retrieved from http://www.ag.ndsu.nodak.edu/plantsci/breeding/flax/objectives.htm (Accessed on February 29, 2012).
Herchi, W., Sakouhi, F., Khaled, S., Xiong, Y., Boukhchina, S., Kallel, B., Curtis, J.M., 2011. Characterization of the glycerophospholipid fraction in flaxseed oil using liquid chromatography–mass spectrometry. Food Chemistry 129(2), 437-442.
Hino, A., Takano, H. Tanaka, Y., 1987. New freeze-tolerant yeast for frozen dough preparations. Cereal Chemistry 64(4), 269-275.
Hoseney, C., 1994. Principles of cereal science and technology, second ed. AACC, St. Paul, MN. Huang, W., Kim, Y., Li, X., Rayas-Duarte, P., 2008. Rheofermentometer parameters and
bread specific volume of frozen sweet dough influenced by ingredients and dough mixing temperature. Journal of Cereal Science 48(3), 639-646.
Hsu, K. H., Hoseney, R. C., Seib, P. A., 1979. Frozen dough. 1. factors affecting stability of yeasted doughs. Cereal Chemistry 56(5), 419-424.
Ibrügger, S., Kristensen, M., Mikkelsen, M., Astrup, A., 2012. Flaxseed dietary fiber supplements for suppression of appetite and food intake. Appetite 58(2), 490–495.
Izydorczyk, M., Cui, S.W., Wang, Q., 2005. Polysaccharide gums: Structure, functional properties and applications In: Cui, S.W., Food carbohydrates: Chemistry, physical properties and applications. CRC Press, Boca Raton, FL, pp. 286-288.
Jenkins, D.J.A, Kendall, C.W.C, Vidgen, E., Agarwal, S., Rao, A.V, Rosenberg, R.S., Diamandis, E.P., Novokmet, R., Mehling, C.C., Perera, T., Griffing, L.C., Cunane, S.C., 1999. Health aspects of partially defatted flaxseed, including effects on serum lipids and oxidative measures, an ex vivo androgen and progestin activity: a controlled crossover trial. American Journal of Clinical Nutrition 69, 395-402.
Jensen, S., Oestdal, H., Skibsted, L. H., Larsen, E., Thybo, A. K., (2011). Chemical changes in wheat pan bread during storage and how it affects the sensory perception of aroma, flavour, and taste. Journal of Cereal Science 53(2), 259–268.
Khalloufi, S., Corredig, M., Goff, H., Alexander, M., 2009. Flaxseed gums and their adsorption on whey protein-stabilized oil-in-water emulsions. Food Hydrocolloids 23(3), 611-618.
Kiani, H. T., Sun, D. W., 2011. Water crystallization and its importance to freezing foods: A review. Trends in Food Science and Technology 22, 407-426.
Kristensen, M., Savorani, F., Christensen, S., Engelsen, S.B., Bugel, S.,Toubro, S., Tetens, I.,
55
Astrup, A., 2011. Flaxseed dietary fibers suppress postprandial lipemia and appetite sensation in young men. Nutrition, Metabolism and Cardiovascular Diseases doi:10.1016/j.numecd.2011.03.004.
Kuhn, K., Cavallieri, A.L.F., Lopes da Cunha, R., 2011. Cold-set whey protein–flaxseed gum gels induced by mono or divalent salt addition. Food Hydrocolloids 25(5), 1302-1310.
Lorenz K., Kulp, K., 1995. Freezing of dough’s for the production of breads and rolls in the United states In: Lorenz K., Kulp, K, Frozen & refrigerated doughs and batters. AACC St. Paul, MN, pp. 135-154.
Lawless, H. T., Heymann, H., 1998. Introduction and Acceptance testing In: Lawless, H.T., Heymann Sensory evaluation of food. Chapman and Hall, NewYork, New York, pp. 7, 351 354.
Leray, G., Oliete, B., Mezaize, S., Chevallier, S., Lamballerie, M., 2010. Effects of freezing and frozen storage conditions on the rheological properties of different formulations of non-yeasted wheat and gluten-free bread dough. Journal of food Engineering 100, 70-76.
Li, X., Panigrahi, S., Tabil, L.G., 2008. A Study on flax fiber-reinforced polyethylene biocomposites. Applied Engineering in Agriculture 25(4), 525-531.
Liu, Z., Scanlon, M. G., 2003. Predicting mechanical properties of bread crumb. Institution of Chemical Engineers 81(C), 224-238.
Lu, W., Grant, L. A., 1999. Effects of prolonged storage at freezing temperatures on starch and baking quality of frozen doughs. Cereal chemistry 76(5), 656-662.
Lyon, D. H., Francombe, M. A., Hasdell, T., Lawson, K., 1992. What is sensory analysis used for, who are the right people for sensory analysis. In: Carpenter, R.P., Lyon, D.H., Hasdell, T.A., Guidelines for sensory analysis in food product development and quality control. Chapman and Hall, New York, New York, pp. 9-10,89-91.
Makri, E., Tsimogiannis, D., Dermesonluoglu, E. K., Taoukisa, P. S. 2011. Modeling of greek coffee aroma loss during storage at different temperatures and water activities. Proceida Food Science 1, 1111–1117.
Mandala, I., Karabela, D., Kostaropoulos, A., 2007. Physical properties of breads containing hydrocolloids stored at low temperature. I. effect of chilling. Food Hydrocolloids 21(8), 1397–1406.
Matuda, T. G., Pessoa Filho, P. A., Tadini, C. C., 2011. Experimental data and modeling of the thermodynamic properties of bread dough at refrigeration and freezing temperatures. Journal of Cereal Science 53, 126-132.
Meilgaard, M., Civille, G. V., Carr, B. T., 2007. Selection and training of panel members: Panel performance and motivation. In: Meilgaard, M., Civille, G. V., Carr, B. T. (first ed), Sensory evaluation techniques. CRC Press, Boca Raton, FL, pp.155.
Meziani, S., Ioannou, I., Jasniewski, J., Belhaj, N., Muller, J., Ghoul, M., Desorby, S., 2012. Effects of freezing treatments on the fermentative activity and gluten network integrity of sweet dough. Food Science and Technology 48, 118-126.
Minervini, F., Pinto, D., Di Cagno, R., De Angelis, M., Gobbetti, M., 2011. Scouting the application of sourdough to frozen dough bread technology. Journal of Cereal Science 54(3), 296–304.
Mueller, K., Eisner, P., Yoshie-Stark, Y., Nakada, R., Kirchhoff, E. K., 2010. Functional properties and chemical composition of fractionated brown and yellow linseed meal
56
(linum usitatissimum l.). Journal of Food Engineering 98(4), 453–460. Muir, A.D., Westcott, N.D., 2003. Chemical studies on the constituents of linum spp., Flaxseed
constituents and human health. In: Muir, A.D., Westcott, N.D., Flax: the genus linum. Taylor and Francis, New York, NY pp. 55-74, 243-252.
Naqvi, S., Kahn, M., Shahid, M., Jaskani, M., Kahn, I., Zuber, M., Zia, K., 2011. Biochemical profiling of mucilage extracted from seeds of different citrus rootstocks. Carbohydrate Polymers 83(2), 623-628.
Nemeth, L.J., Paulley, F.G. Preston, K.R,. 1996. Effects of ingredients and processing conditions on the frozen dough bread quality of a canada western red spring wheat flour during prolonged storage. Food Research International 29(7), 609-616.
Oomah, B.D., 2003 Processing of flaxseed fiber, oil, protein and lignan. In: Thompson, L. Cunnane, S., Flaxseed in human nutrition. AOCS. pp. 363-387.
Oomah, B.D., Mazza, G., 1993. Flaxseed proteins – a review. Food Chemistry 48, 109-114. Oreofero, D., 2011, November 29. Poison as potassium bromate. The Nation. Retrieved from
http://www.thenationonlineng.net/2011/index.php/mobile/editorial/27888-poison as-potassium-bromate.html (Accessed February 29, 2012).
Pareyt, B., Finnie, S. M., Putseys, J. A., Delcour, J. A., 2011. Lipids in bread making: Sources, interactions, and impact on bread quality. Journal of Cereal Science 54(3), 266– 279.
Pohjanheimo, T. A., Hakala, M. A., Tahvonen, R. L., Salminen, S. J., Kallio, K. P., 2006. Flaxseed in breadmaking: Effects on sensory quality, aging, and composition of bakery products. Journal of Food Science 71(4), S343–S348.
Qin, L., Xu, S. Y., Zhang, W. B., 2005. Effect of enzymatic hydrolysis on the yield of cloudy carrot juice and the effects of hydrocolloids on color and cloud stability during ambient storage. Journal of the Science of Food and Agriculture 85(3), 505–512.
Ribotta, P. D., Leon, A. E., Anon, M. C., 2003. Effect of freezing and frozen storage on the gelatinization and retrogradation of amylopectin in dough baked in a differential scanning calorimeter. Food Research International 36, 357-363.
Ribotta P.D., Perez, G.T., Leon, A.E. Anon, M.C., 2004. Effect of DATEM and guar gum on micro structural rheological and baking performance of frozen bread dough. Food Hydrocolloids 18, 305-313.
Ribotta, P.D., Leon, A.E., Anon, M.C., 2006 In: Hui, Y. H. (first ed). Bakery products: science and technology. Blackwell publishing, Oxford Untied Kingdom, pp. 381-390. Rojas, J.A., Rosell, C.M., Benedito de Barber, C., 1999. Pasting properties of wheat flour-
hydrocolloid systems. Food Hydrocolloids 13, 27-33. Scanlon, M. G., Zghal, M. C., 2001. Bread properties and crumb structure. Food Research
International 34(10), 841–864. Schiraldi, A., and Fessas, D., 2003 The role of water in dough formation and bread quality. In:
Cauvin, S.P., Bread making. Woodhead publishing pp. 315-317. Selomulyo, V.O. Zhou, W., 2007. Frozen bread dough: Effects of freezing storage and
dough improvers. Journal of Cereal Science 45, 1-17. Sharardanant, R. Khan, K., 2003a. Effect of hydrophilic gums on frozen dough. I. dough
quality. Cereal Chemistry 80(6), 764-772. Sharardanant, R. Khan, K., 2003b. Effect of hydrophilic gums on frozen dough. II. bread
57
characteristics. Cereal Chemistry 80(6), 773-780. Sharardanant, R. Khan, K., 2006. Effect of hydrophilic gums on the quality of frozen dough:
electron microscopy, protein solubility, and electrophoresis studies. Cereal Chemistry 83(4), 411-417.
Silva, L., Ciocca, M., 2005. Total, insoluble and soluble dietary fiber values measured by enzymatic–gravimetric method in cereal grains. Journal of Food Composition and Analysis 18(1), 113-120.
Singer, F. A. W., Taha, F. S., Mohamed, S. S., Gibriel, A., El-Naway, M., 2011. Preparation of mucilage/protein products from flaxseed. American Journal of Food Technology 6(4), 260-278.
Sosulski, F. W., and Imafidon, G. I., 1990. Amino acid composition and nitrogen-to- Protein conversion factors for animal and plant foods. Journal of Agriculture and Food Chemistry 38, 1351-1356.
Stone, H., Sidel, J., 1993. Sensory evaluation practices. second ed. Redwood City, California. Tkachuk, R. J., 1969. Nitrogen to protein conversion factors for cereals and oilseed meal. Cereal
Chemistry 46, 419-424. United States Diary Export Council. 2011. Nutritional information. Retrieved from
http://www.usdec.org/Products/content.cfm?ItemNumber=82658 (Accessed March 1, 2012.
Unpublished data, 2007. North Dakota State University. Department of Cereal Science. Fargo, North Dakota. 58102.
Vaisey-Genser, M., Morris, D.H., 2003 Introduction. In: Muir, A.D., Westcott, N.D. Flax: the genus linum. Taylor and Francis, New York, NY, pp. 1-22.
Wang, J., Rosell, C.M., Benedition de Barber, C., 2002 Effect of the addition on different fibers on wheat dough performance and bread quality. Food Chemistry 79, 221-236.
Wang, Y., Li, D., Wang, L., Li., S., Adhikari, B., 2010a. Effects of drying methods on the functionality properties of flaxseed gum powders. Carbohydrate polymers 81, 128–133.
Wang, Y., Li, D., Wang, L., Adhikari, B. Shi, J., 2010b. Ability of flaxseed and soybean protein concentrates to stabilize oil-in-water emulsions. Journal of Food Engineering 100, 417-426.
Warrand, J., Michaud, P., Picton, L., Muller, G., Courtois, B., Ralainirina, R., Courtois, J., 2005. Structural investigations of the neutral polysaccharide of linum usitatissimum l. seeds mucilage. International Journal of Biological Macromolecules 35(3-4), 121-125.
Whistler, R.L., BeMiller, J.N., 1997. Carbohydrate chemistry for food scientists. St. Paul, MN: American Association of Cereal Chemists.
Wilkes, A. P., 2007, June 11. Flax heart health. Retrieved from http://www.preparedfoods.com/articles/flax-heart-health (Accessed on March 1, 2012).
Wu, M., Li, D., Wang, L., Zhou, Y., Mao, Z., 2010. Rheological property of extruded and enzyme treated flaxseed mucilage. Carbohydrate Polymers 80, 460-466.
Yi, J., Kerr, W. L., 2009. Combined effects of freezing rate, storage temperature and time on bread dough and baking properties. LWT-Food Science and Technology 42(9), 1474-1483.
Yi, J., Kerr, W. L., Johnson, J. W., 2009. Effects of waxy wheat flour and water on frozen dough and bread properties. Journal of Food Science 74(5), E278–E284.
58
Ziolkovska, A., 2011. Laws of flaxseed mucilage extraction. Food Hydrocolloid, doi:10.1016/ j.foodhyd.2011.04.022.
Zhang, W., Xu, S., Wang, Z., Yang, R., Lu, R., 2009. Demucilaging and dehulling flaxseed with a wet process. Food Science and Technology 43, 1193-1198.
Zhou, Y., Wang, D., Zhang, L., Du, X., Zhou, X., 2008. Effect of polysaccharides on gelatinization and retrogradation of wheat starch. Food Hydrocolloids 22(4), 505–512.