Page 1
I
UNIVERSITY OF PARMA
PhD. In Food Science and Technology
XVIII cycle
EFFECT OF FORMULATION ON PHYSICO-CHEMICAL
PROPERTIES, WATER STATUS AND STABILITY OF PASTA,
TOMATO SAUCE AND READY TO EAT PASTA MEALS
Coordinatore:
Chiar.mo Prof. Furio Brighenti
Tutor:
Chiar.mo Prof. Elena Vittadini
Dottorando: Agoura Diantom
Page 2
II
Dedicata a mio padre (Gerard),
mia sorella (Odette) e
mio fratello (M’Namte)
che sono scomparsi dalla mia vita
Page 3
III
Acknowledgements / ringraziamenti / remerciements
Un ringraziamento va innanzitutto alla mia carissima Prof. Elena Vittadini, che durante
questi anni mi ha sostenuto e soprattutto mi ha permesso di ampliare le mie conoscenze.
Vorrei espandere i ringraziamenti a tutto il gruppo delle 3ELE (Elena V., Eleonora C., Elena
C.), grazie di cuore per il vostro sostegno. Non ho parole per ringraziarvi ma sapete già
quello che ho nel mio cuore.
Ringrazio la mia famiglia di Campobasso (Vittoria, Luca e Aldo) per tutto il sostegno in
questi anni. Siete gli angeli della mia vita. Un ringraziamento va anche alle mie nonne, zie,
zii, cugine e cugini italiani
Je remercie ma famille au Togo pour tous le support qu’elle m’a apporté durant ces années.
J’imagine si mon papa était avec moi en ce moment si, comment serait sa joie ? Je me
rappelle parfois les coups que tu me donnais quand je faisais des erreurs quand bien même
tu savais que j’avais tellement peur des coups de bâton ou n’importe quel coup. Ton souhait
était que j’avance dans mes études, aujourd’hui me voilà à la fin d’un parcours que j’ai dû
affronter seul en ton absence. Dans tous les cas je te remercie infiniment pour tous ce que tu
as fait pour moi. Maman, toi tu m’a donné un cœur et ton courage a toujours été mon
repère. Tu es celle qui m’a appris la valeur d’une femme et je te serai reconnaissant jusqu’au
dernier jour de ma vie sur cette terre. J’espère qu’un jour je pourrai donner à ma femme cet
amour que tu m’as enseigné. Je t’aime maman. Et un dernier merci à mes frères et sœurs,
oncles, tantes, cousins et cousines pour le soutiens morale.
Je tiens à remercier le père Alain car ce que je suis aujourd’hui est sans doute son œuvre.
Que le seigneur puisse te protéger
Page 4
IV
Et sans doute, je ne peux oublier une autre famille qui m’a beaucoup soutenu et m’a aimé
dans tous les sens. Je remercie de tout cœur la famille Kantchoa (maman Gladis, Mireille,
Justine, Moniyiel et ma très aimée Brigitte (Bribri)) pour tout ce que vous avez fait pour
moi. La vie nous offre beaucoup de personnes qui marquent notre vie, et c’est votre cas. Un
sincère merci. Bribri, tu as été l’énergie de mon courage et le sucre de mes pensées, et ton
soutient est et sera toujours dans l’angle sacré de mon cœur. Je t’adore mon bébé.
Ringrazio tutti mi professori delle Università di Parma e del Molise per tutto quello che
hanno fatto per me. Quello che sono oggi è il vostro merito.
Ringrazio tutti miei colleghi e colleghe di laboratorio, di università e per il loro sostegno sia
morale che fisico.
Ringrazio tutta l’associazione dei togolesi di parma, voi siete stati la mia famiglia di Parma.
Grazie per il vostro sostegno morale colleghi e colleghe di laboratorio, di università e per il
loro sostegno sia morale che fisico
Un ringraziamento a tutti i miei amici di Campobasso, Parma, Togo, America, e così via,
siete stati il sorriso del mio vivere et lo sarete per sempre.
Per finire vorrei ringraziare Te, che sei il pilastro centrale della mia vita, Tu che hai messo
tutte queste persone sulla mia strada, e li hai insegnato ad amarmi come sono. Sei davvero
Speciale per me. Tu, Dio, sai che io ho ancora da imparare e sempre ci sarai per guidarmi
durante questo grande percorso, vita, che mi hai dato.
Page 5
V
Summary
Ready to eat pasta meals are an important segment of convenience food, but these products are
subjected to significant changes in physico-chemical properties during storage, which reduce their
acceptability at the time of consumption. A deep understanding of the properties of the single
phases, their dependence upon formulation, and the changes they undergo during storage is very
important to intelligently intervene on products properties to improve their quality at the time of
consumer’s consumption.
This work has focused on the effect of formulation on physico-chemical properties of pasta and
tomato sauce with a special focus on mechanical/rheological attributes and water status. Variable
considered in pasta formulation were gluten, glycerol and moisture content and their effect was
studied in both freshly cooked or shelf-stable cooked pasta. The effect of multiple hydrocolloids (at
different levels) was considered in the case of tomato sauce.
In the case of pasta, it was found that water content was indeed a very important variable in defying
pasta mechanical properties and water status. Higher moisture contents in pasta resulted in softer
samples and reduced the changes in physico-chemical parameters during storage. Glycerol was
found to favor water uptake and to soften the pasta matrix, acting as plasticizer and increasing
molecular mobility. The addition of gluten hardened pasta but did not affect the water status. The
combination of higher amount of gluten (15%, g gluten / 100 g product) with higher moisture
content (59-65%, g water / 100 g product) were found to minimize the physico-chemical changes
occurring in RTE pasta meals during storage, improving quality at longer storage times.
Hydrocolloids added into tomato sauce modulated its mechanical attributes and water status in very
different manner, depending on hydrocolloid type and concentration. This may allow to produce
Page 6
VI
tomato sauce for different applications and that are expected to have different performance if placed
in contact with pasta in a RTE meal.
Future work should include an investigation of how the interaction between the two phases (pasta
and sauce) can be modulated and controlled by controlling the properties of the single phases with
the goal of obtaining highly acceptable products also at longer storage times.
Page 7
VII
Table of contents
Introduction 1
References 4
Objectives 9
Section A: CHARACTERIZATION OF COOKED PASTA 11
Effect of Glycerol and Gluten on Mechanical Properties and 1H NMR Mobility of
Cooked Pasta 12
1- Abstract 12
2- Introduction 13
3- Material and Methods 14
4- Results and Discussion 16
5- Conclusions 23
6- References 24
7- List of Table 26
8- List of Figure 30
Mechanical properties and water status of fresh cooked pasta with different
formulations 31
1- Abstract 32
2- Introduction 33
3- Material and Methods 34
4- Results and Discussion 37
5- Conclusions 47
6- References 48
7- List of Table 51
8- List of Figure 60
Section B: CHARACTERIZATION OF READY TO EAT (RTE) PASTA 61
Effect of water and gluten on physico-chemical properties and stability of ready to eat
shelf-stable pasta 62
1- Abstract 63
2- Introduction 64
3- Material and Methods 65
4- Results and Discussion 68
5- Conclusions 73
6- References 74
Page 8
VIII
7- List of Table 77
8- List of Figure 81
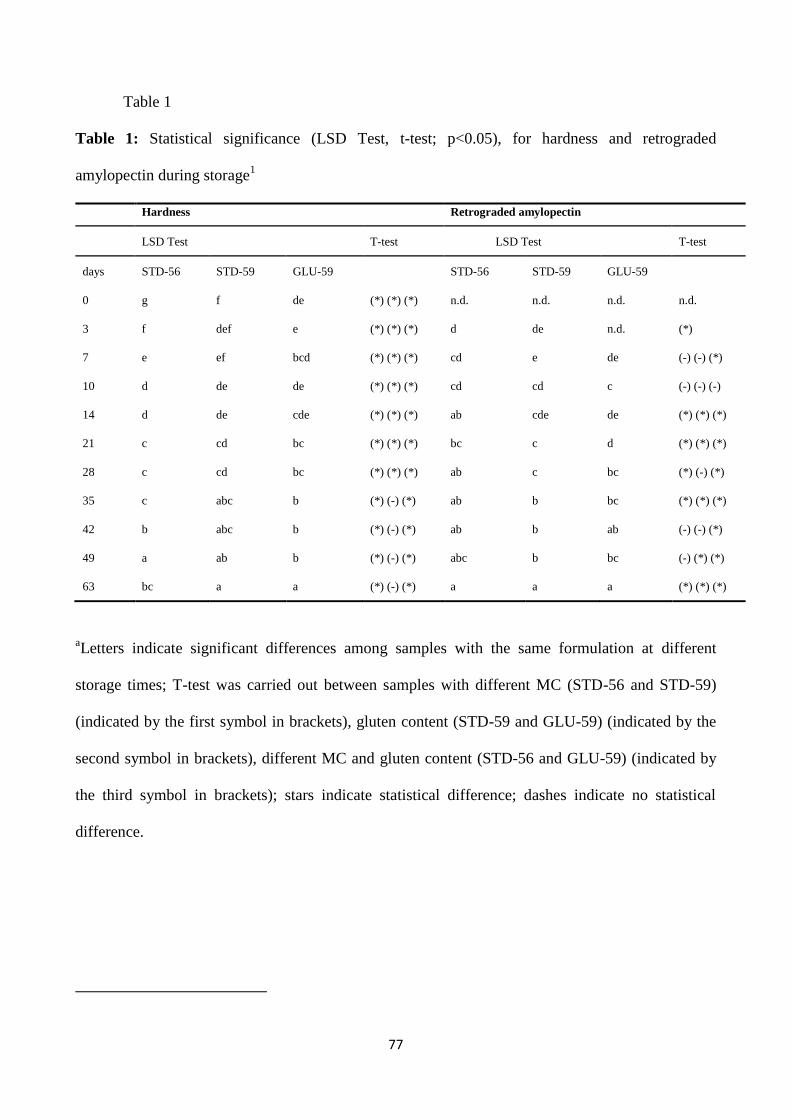
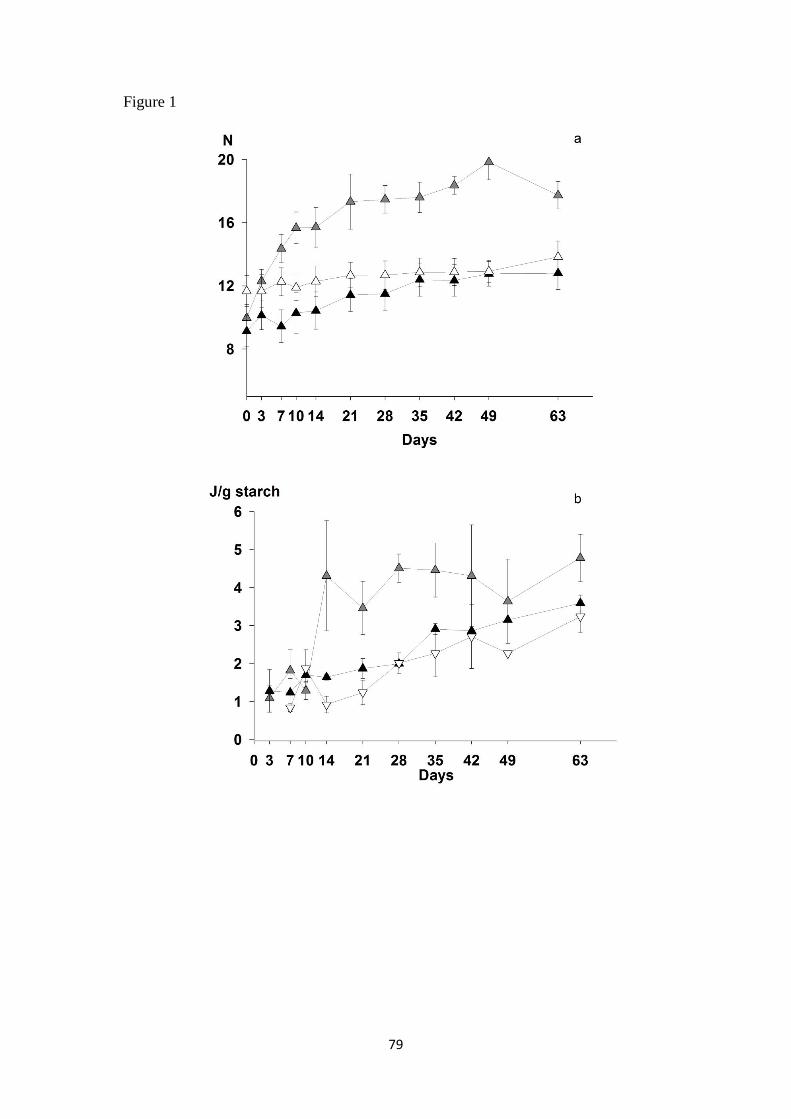
Effect of glycerol and gluten on physico-chemical properties of ready to eat pasta
during storage 82
1- Abstract 83
2- Introduction 84
3- Material and Methods 85
4- Results and Discussion 88
5- Conclusions 94
6- References 95
7- List of Table 98
8- List of Figure 101
Effect of water, glycerol and gluten on physico-chemical properties and water status
during storage. 102
1- Abstract 103
2- Introduction 104
3- Material and Methods 105
4- Results and Discussion 107
5- Conclusions 115
6- References 116
7- List of Table 119
8- List of Figure 124
Section C: CHARACTERIZATION OF TOMATO SAUCE 126
Effect of added hydrocolloids on physico-chemical properties of tomato sauce. 127
1- Abstract 127
2- Introduction 128
3- Material and Methods 129
4- Results and Discussion 132
5- Conclusions 139
6- References 140
7- List of Table 143
8- List of Figure 150
Page 9
1
INTRODUCTION
Traditional pasta is obtained from semolina and water, that are mixed and kneaded to obtain a
viscoelastic doughwhich is forced through die to get a desired geometry, and is then dried to obtain
the final product. Dry pasta is cooked in excess boiling water, where the two main pasta
components, starch and gluten, undergo very important phase changes that are strictly related to the
quality and acceptability of the cooked product. Upon heating and hydrating starch swells and
gelatinizes while gluten coagulates and traps gelatinized starch forming a strengthened network
(Resmini & Pagani, 1983).
Traditionally cooked pasta is eaten immediately after cooking, but the increased demand of
convenience food has led to the development of ready to eat (RTE) pasta-based products. Pasta
industry has been introducing in the market many frozen, refrigerated and shelf-stable products that
need only to be heated before consumption, as proven by the significant market-share increase
(~10%) in the recent 10 years. Among RTE meals, pasta meals are indeed the main category as they
represent a very large market segment, especially in Asia, Latin America, Middle and North Africa.
RTE pasta meals are subjected to changes in physico-chemical properties during storage, with
consequent quality loss. Many ready to eat pasta meals accessible on the market are made of pasta
and tomato sauce, that can be mixed together or lodged in different compartments (they will be
mixed only at time of consumption). Acceptability of RTE pasta meals are related to the properties
and the changes occurring into the single phase during storage and, in the case of mixed phases to
the interactions among them (e.g. water migration). A good understanding of how these changes
occur in pasta and tomato sauce (as function of formulation and processing) during storage both as
single phases or mixed would help improving the quality of the products and their shelf-life
stability.
Page 10
2
Only a few reports on the changes occurring in ready to eat pasta during storage are available in the
scientific literature. Frozen cooked tagliatelle were studied over a 12 months storage period (Olivera
& Salvadori, 2011) and they were reported to loose moisture and become harder in the first 4 and 2
months, respectively, and not to be subject to further changes during the rest of storage. McCarthy
et al. (2002) reported the presence of moisture gradient between the surface and the center of
lasagna pasta (without sauce) after cooking, but this gradient was equilibrated during the holding
time (80 minutes). Carini et al. (2014) focused their study on changes in shelf-stable RTE pasta
during two months and they observed an increase in pasta hardness and retrograded amylopectin.
They also reported an increased molecular rigidity measured by 1HNMR, correlated to an increase
of 1H FID steepness and decreased of
1H T2 relaxation times.
Other changes in product where both phases were mixed were explored in manner to understand
which phase is mostly affected. Olivera & Salvadori (2012) reported pasta hardness decrease and
moisture content increase in refrigerated lasagna (pasta with sauce) during 8 days storage. Whereas
Carini et al. (2013) investigated water status in shelf-stable pasta meals with a tomato based sauce
during 34 days of storage, and reported pasta softening and water migration between pasta and
sauce phases detected only at a molecular level (1H T1 and T2), while moisture content and water
activity did not reveal a macroscopic water migration between the pasta and sauce phases.
To overcome / reduce these changes it might be necessary to understand how these occurred in each
phase. Considering that the changes into pasta phase might be similar to those occurred in other
cereal based products, as bread, which were deeply investigated, it might be helpful to change pasta
formulation to investigate its effect on physico-chemical properties. It should be, therefore,
important to focus on the role of water, glycerol and gluten on pasta properties and stability, as
these components have been proven to have a very important role in bread stability (Baik &
Chinachoti, 2001; Lin & Lineback, 1990; Schiraldi & Fessas, 2001; Chen et al., 1997; Sereno et al.,
Page 11
3
2007; Vodovotz et al., 2002; Berkowitz & Oleksyk, 1991; Hallberg & Chinachoti, 1992; Taub et
al., 1994; Eliasson, 1983a, 1983b; Ottenhof & Farhat, 2004; Callejo et al., 1999; Curti et al., 2014).
The properties of the sauce should, also be carefully considered when used in a multiphasic meal
(e.g. pasta and sauce). A recent paper (Carini et al., 2014) has focused the attention on the sauce
phase evaluating the effect of different ingredients commonly used in industrial settings on the
status of water in the systems indicating that, for example, sauce thickening induced by flour or
gelatin addition corresponded to very different NMR molecular mobilities. Long chain polymers,
such as hydrocolloids (polysaccharides and proteins), are extensively used in the food industry, in
different food systems as soups, beverages, desserts, ketchups, sauces, salad dressings due to their
functional properties (Saha & Bhattacharya, 2010), as thickening (Philips et al., 1986; Philips &
Williams, 2000; Gibinski et al., 2006; Sikora et al., 2007; Kok et al. 1999; Wang et al., 2000;
Dunstan et al., 2001; Alexander, 1999 a, b; Casas et al., 2000; Kulicke et al., 1996; Murray, 2000;
Sahin & Ozdemir, 2004; Koocheki et al., 2009; Saha & Bhattacharya, 2010), gelling (Aguilera
1992; Oakenfull, 1987, Philips and Williams, 2000; Williams, 2006; Saha & Bhattacharya, 2010),
emulsifying and stabilizing (Milani & Maleki, 2012) agents. Thus studying the effect of
hydrocolloids in tomato sauce might be necessary for understanding how we can modulate the
properties of tomato sauce that may be then very important when such sauce is mixed with pasta in
an assembled pasta meal.
A deep understanding of the properties of the single phases, their dependence upon formulation, and
the changes they undergo during storage is very important to intelligently intervene on products
properties to improve its quality at the time of consumer’s consumption. Future work should
include an investigation of how the interaction between the two phases (pasta and sauce) can be
modulated and controlled by controlling the properties of the single phases with the goal of
obtaining highly acceptable products also at longer storage times.
Page 12
4
References
Aguilera, J. M. (1992) Generation of engineered structures in gels. In: Schwartzberg HG, Hartel
RW (eds) Physical chemistry of foods. Marcel Dekker, New York, pp 387–421
Alexander, R. J. (1999a) Hydrocolloid gums. Part I: Natural products. Cereal Foods World 44:684–
687
Alexander, R. J. (1999b) Hydrocolloid gums. Part II: Synthetic products. Cereal Foods World
44:722–725
Baik, M. Y., & Chinachoti, P. (2001). Effects of glycerol and moisture gradient on thermo-
mechanical properties of white bread. Journal of Agricultural and Food Chemistry, 49, 4031-4038.
Berkowitz, D.; Oleksyk, L. E. 1991. Leavened breads with extended shelf-life. U.S. Patent
5,059,432,.
Callejo, M. J., Gill, M. J., Rodriguez, G., & Ruiz, M. V. (1999). Effect of gluten addition and
storage time on white pan bread quality: instrumental evaluation. European Food Research and
Technology, 208, 27-32.
Carini, E., Curti, E., Cassotta, F., Najm, N. E. O., & Vittadini, E. (2014). Physico-chemical
properties of ready to eat, shelf-stable pasta during storage. Food chemistry, 144, 74-79.
Carini, E., Curti, E., Littardi, P., Luzzini, M., & Vittadini, E. (2013). Water dynamics of ready to eat
shelf stable pasta meals during storage. Innovative Food Science and
Carini, E., Curti, E., Mora, B., Luzzini, M., & Vittadini, E. (2014). Effect of Flour, Gelatin and Salt
on Water Status of Tomato Sauce. Food Biophysics, 10(2), 129-133.
Page 13
5
Casas, J. A., Mohedano, A. F., & García‐Ochoa, F. (2000). Viscosity of guar gum and xanthan/guar
gum mixture solutions. Journal of the Science of Food and Agriculture, 80(12), 1722-1727.
Chen, P. L., Long, Z., Ruan, R., & Labuza, T. P. (1997). Nuclear magnetic resonance studies of
water mobility in bread during storage. LWT e Food Science and Technology, 30, 178-183.
Curti, E., Carini, E., Tribuzio, G., & Vittadini, E. (2014). Bread staling: Effect of gluten on physico-
chemical properties and molecular mobility. LWT-Food Science and Technology, 59(1), 418-425.
Dunstan, D. E., Chen, Y., Liao, M. L., Salvatore, R., Boger, D. V., Prica, M. (2001) Structure and
rheology of κ-carrageenan/locust bean gum gels. Food Hydrocolloids 15:475–484
Eliasson, A. C. (1983a). Differential Scanning Calorimetry studies on wheat starch-gluten mixtures.
I. Effect of gluten on the gelatinization of wheat starch. Journal of Cereal Science, 1, 199-205.
Eliasson, A. C. (1983b). Differential scanning calorimetry studies on wheat starch-gluten mixtures.
II. Effect of gluten and sodium stearoyl lactylate on starchcrystallisation during ageing of wheat
starch gels. Journal of Cereal Science, 1,207-213.
Gibinski, M., Kowaski, S., Sady, M., Krawontka, J., Tonasik, P., Sikora, M. (2006) Thickening of
sweet and sour sauces with various polysaccharide combinations. J Food Eng 75:407–414
Hallberg, L. M., & Chinachoti, P. (2002). A fresh perspective on staling: the significance of starch
recrystallization on the firming of bread. Journal of Food Science, 67, 1092-1096 (This article
provides evidence that starch (amylopectin) recrystallization is not the only factor contributing to
bread firming; changes in the amorphous regions have been suggested to play a key role in the
process).
Page 14
6
Hallberg, L. M.; Chinachoti, P. 1992. Dynamic mechanical analysis for glass transitions in long
shelf-life bread. J. Food Sci., 57, 1201-1204.
Kok, M. S., Hill, S.E., Mitchell, J. R. (1999) Viscosity of galactomannans during high temperature
processing: influence of degradation and solubilization. Food Hydrocolloids 13:535–542
Koocheki, A., Ghandi, A., Razavi, S., Mortazavi, S. A., & Vasiljevic, T. (2009). The rheological
properties of ketchup as a function of different hydrocolloids and temperature. International journal
of food science & technology, 44(3), 596-602.
Kulicke, W. M., Kull, A. H., Kull, W., Thielking, H. (1996) Characterization of aqueous
carboxymethyl cellulose solutions in terms of their molecular structure and its influence on
rheological behaviour.
Lin, W., & Lineback, D. R. (1990). Change in carbohydrate fractions in enzyme-supplemented
bread and potential relationship to staling. Starch-Starke, 42, 385-394
McCarthy, K. L., Gonzalez, J. J., & McCarthy, M. J. (2002). Change in moisture distribution in
lasagna pasta post cooking. Journal of food science, 67(5), 1785-1789.
Milani J, Maleki G. (2012) Hydrocolloids in Food Industry. In: Valdez B. Food industrial
processes-methods and equipment. Tech, Rijeka, Croatia, pp 17-38
Murray, J. C. F. (2000) Cellulosics. In: Philips GO, Williams PA (eds) Handbook of hydrocolloids.
Woodhead Publ Ltd, New York, pp 219–229
Oakenfull, D. (1987) Gelling agents. CRC Crit Rev Food Sci Nutr 26:1–31
Olivera, D. F., & Salvadori, V. O. (2012). Kinetic modeling of quality changes of chilled ready to
serve lasagna. Journal of Food Engineering, 110(3), 487-492.
Page 15
7
Olivera, D.F., Salvadori, V.O., 2011. Instrumental and sensory evaluation of cooked pasta during
frozen storage. International Journal of Food Science and Technology 46, 1445–1454
Ottenhof, M. A., & Farhat, I. A. (2004). The effect of gluten on the retrogradation of wheat-starch.
Journal of Cereal Science, 40, 269-274.
Philips, G. O., Wedlock, D. J., Williams, P. A. (1986) Molecular origin of hydrocolloid
functionality. In: Philips GO, Williams PA, Wedlock DJ (eds) Gums and stabilizers for the food
industry, vol 3.
Philips, G. O., Williams, P. A. (eds) (2000). Introduction to food hydrocolloids. In: Handbook of
hydrocolloids, Woodhead Publ Ltd, New York, pp 1–19
Resmini, P., & Pagani, M. A. (1983). Ultrastructure Studies of Pasta. A Review. Journal of Food
Structure, 2(1), 2.
Saha, D., & Bhattacharya, S. (2010). Hydrocolloids as thickening and gelling agents in food: a
critical review. Journal of Food Science and Technology, 47(6), 587–597.
Sahin, H. & Ozdemir, F., (2004) Effect of some hydrocolloids on the rheological properties of
different formulated ketchups. Food Hydrocolloids 18:1015–1022
Schiraldi, A., & Fessas, D. (2001). Mechanism of staling: an overview. In P. Chinachoti, & Y.
Vodovotz (Eds.), Bread staling (pp. 1-17). New York: CRC Press.
Sereno, N. M., Hill, S. E., Mitchell, J. R., Scharf, U., & Farhat, I. A. (2007). Probing water
migration and mobility during the aging of bread. In I. A. Farhat, P. S. Belton, & G. A. Webb
(Eds.), Magnetic resona
Page 16
8
Sikora, M,. Kowalski, S., Tomasik, P., & Sady, M., (2007) Rheological and sensory properties of
dessert sauces thickened by starch-xanthan gum combination. J Food Eng 79:1144–1151
Taub, I. A.; Halliday, J. W.; Kim, Y.-K. 1994. Bread structure and stability: Rheological,
calorimetric, spectroscopic, and microscopic characterization, Army Sci. Conf. Proc., 6, 1391-1398.
Vodovotz, Y., Vittadini, E., & Sachleben, J. R. (2002). Use of 1H cross-relaxation nuclear magnetic
resonance spectroscopy to probe the changes in bread and its components during aging.
Carbohydrates Research, 337, 147-153.
Wang, Q., Ellis, PR, Ross-Murphy, S. B. (2000). The stability of guar gum in aqueous system under
acidic conditions. Food Hydrocolloids 14:129–134
Williams, P. A. (2006) An overview of the structure-function relationship of hydrocolloids. In:
Philips GO, Williams PA (eds) Gums and stabilizers for the food industry, vol 13. RSC Publ,
Oxford, pp 15–29
Page 17
9
OBJECTIVE
My PhD thesis focused on the characterization of the properties of cooked pasta, shelf-stable RTE
pasta and tomato sauce, their dependence upon formulation and storage time with a multi-analytical
and multi-dimensional approach. In particular the work can be divided into three sections.
Section A: Characterization of cooked pasta
- Effect of pasta formulation on physico-chemical properties of cooked pasta.
In particular, pasta formulation was modified by substitution of part of semolina with vital
gluten or glycerol. Local market pastas were also used to investigate their quality due to
their different formulation, as traditional, enriched and gluten free pastas. Cooked pasta was
characterized in terms of water status (macroscopic [moisture content], mesoscopic [frozen
water content] and molecular [proton NMR molecular mobility] indicators) and mechanical
(texture and viscoelastic properties) attributes.
Section B: Characterization of ready to eat (RTE) pasta.
- Effect of pasta formulation on physico-chemical properties of cooked pasta.
In particular, pasta formulation was modified by substitution of part of semolina with vital
gluten, glycerol or their mixture at different levels and it was cooked to different moisture
contents. Cooked pasta was then packed, sterilized and stored at room temperature up to 90
days, and its water status and mechanical properties were studied.
- B1 - Effect of water and gluten on physico-chemical properties and stability of ready to eat
shelf-stable pasta. The substitution level was 15% (g gluten / 100 g semolina) and the
moisture content 56 and 59% (g water / 100 g product)
- B2 - Effect of glycerol and gluten on physico-chemical properties, water status and stability
of ready to eat (RTE) pasta meals during storage. Seven or 14% (g of ingredient(s) / 100 g
Page 18
10
semolina) of semolina was substituted by glycerol and /or gluten and the moisture content
was 56 and 62% (g water / 100 g product)
- B3 - Effect of water, gluten and glycerol on physico-chemical properties, water status and
stability of ready to eat (RTE) pasta during storage. The substitution level was 15% (g
ingredients / 100 g semolina) for single ingredient (gluten or glycerol) or its mixture (gluten
and glycerol), and moisture content was 59, 62 and 65% (g water / 100 g product).
Section C: Characterization of tomato sauce
- Effect of added hydrocolloids on physico-chemical properties of tamato sauce.
In particular, tomato sauce was added with some hydrocolloids (Xanthan, Guar, Carboxy
Methyl Cellulose, Locust bean gum, soy proteins, potato proteins, milk proteins and potato
fiber) at different levels (0, 0.5, 1, and 1.5%) and cooked to obtain a pasta sauce. Pasta sauce
was then characterized for water status (moisture content, water activity, and 1H NMR
mobility), color and mechanical (Bostwick consistency, viscosity) attributes.
Page 19
11
SECTION A
CHARACTERIZATION OF COOKED PASTA
Page 20
12
Curti et al., Food Biophysics (2015) 10:474–480. DOI 10.1007/s11483-015-9414-3
Effect of Glycerol and Gluten on Mechanical Properties and 1H NMR
Mobility of Cooked Pasta
E. Curti, E. Carini, A. Diantom, F. Cassotta & N.E. O. Najm A. D’Alessandro E.
Vittadini
Abstract: The effect of gluten and glycerol (5 and 15 % of flour substitution) on physico-chemical
properties and 1H Nuclear Magnetic Resonance (NMR) mobility of cooked pasta was evaluated.
Pasta was cooked either for the same cooking time (10 min) or to reach 55 g water / 100 g sample.
Gluten addition in pasta formulation resulted in a reduced water ab- sorption during cooking, a
slower hydration process and harder products (as compared to the control). The presence of
glycerol in the formulation, on the contrary, favoured water uptake during cooking and resulted in
softer products. At a molecular level, gluten did not significantly alter 1H NMR dynamics, while
glycerol increased molecular mobility and proton exchange, suggesting different molecular
dynamics and pasta microstructure.
Keywords Pasta . Gluten . Glycerol . Physico-chemical properties . 1H NMR mobility
Page 21
13
1- Introduction
Pasta is a relatively simple food system, produced using only two ingredients, wheat semolina and
water, that are processed to obtain, in most cases, a dry product (Carini et al., 2013). Dry pasta is
cooked in an excess of water prior to consumption. In this process two main events take place: starch
gelatinization and denaturation of the gluten network that, if properly formed during the mixing
phase, will entrap the gelatinized starch resulting in a high quality product. Pasta is commonly
consumed immediately after cooking but products containing precooked pasta are also available in
the market. Ready-to-eat (RTE) meals are offered in different storage conditions, such as
refrigerated, frozen or shelf-stable. Quality and stability of these products are strictly related to the
properties of pasta, which undergoes textural modifications during storage, as reported in previous
works on shelf-stable pasta meals with tomato sauce (Carini et al., 2013), refrigerated lasagna
meals (Olivera & Salvadori, 2012), frozen lasagne (Redmond et al., 2005), tagliatelle [Olivera &
Salvadori, 2009; 2011) and pasta meals ( Kindt et al., 2006, 2008; Carini et al., 2014; Diantom et al.,
2015). Softening of the product is generally observed in pasta stored in close contact with the sauce
due to water migration from the sauce to the pasta, while pasta hardening was reported in shelf-stable
pasta stored without sauce.
The reduction of pasta textural modifications during storage is a key factor to improve the quality
and stability of shelf-stable RTE meals and it is expected to be strongly affected by product
formulation. Physico-chemical changes leading to reduced shelf-stable RTE pasta quality during
storage involve its three major components (starch, gluten and water), and resemble the
modifications observed in the staling process of bakery products (i.e., increased hardness and
retrograded amylopectin content, reduced 1H NMR mobility) (Carini et al., 2014; Diantomet al.,
2015). The development of a strong gluten network and the preservation of its plasticity and
flexibility during storage, is one way to better preserve the structure that characterizes RTE pasta
Page 22
14
(Diantom et al., 20015) and fresh bread (Gray & Bemiller, 2003). Further improvements in the
preservation of gluten network plasticity and flexibility can be achieved using a plasticizer, such as
glycerol, that has been positively used in bread (Baik & Chinachoti, 2001, 2002) and protein films
(Zhang et al., 2005, Gillgren et al., 2009). A previous work (Diantom et al., 20015) investigated
the effect of gluten on physico-chemical properties of RTE shelf-stable pasta during 63 days
storage, indicating that the presence of gluten (with high moisture level) contributed to control
hardness increase and reduced amylopectin retrogradation during storage.
Modification of pasta formulation may have an effect on the pasta cooking process. Higher levels
of gluten in pasta formulation, with optimized mixing and drying conditions, were reported to
increase cooked pasta hardness (Diantom et al., 20015; Cubadda et al., 2007; Grzybowski & Donnelly,
1979) and to lower the water absorption of pasta during cooking (Sozer & Kaya, 2008; Bernin et al., 2014). To
the authors’ best knowledge no reports on the addition of glycerol on pasta properties are available
in the scientific literature.
The objective of this work was to investigate the effect of the addition of gluten and glycerol into
dry pasta formulation on water uptake during cooking and mechanical properties of cooked pasta.
Macroscopic (e.g., moisture, mechanical properties) as well as molecular [e.g., 1H Nuclear Magnetic
Resonance (NMR) mobility] properties were analyzed in pasta samples as they are key indicators
in the characterization and the understanding of cooked pasta quality(Carini et al., 2014; Diantomet
al., 2015).
2- Materials and Methods
Pasta Production
Penne shaped dry pasta of different formulation was produced by a local pasta company. Semolina
(moisture: 14.5 %, g water / 100 g product; proteins: 12.5 %; ash: 0.85 %, from the same batch)
Page 23
15
was partially substituted by either glycerol or vital gluten (5 and 15 %) to obtain dry pasta. Names of
pasta containing gluten and glycerol are reported in Table 1. The ingredients were mixed for 20
min and the dough was extruded at 80 bar (40 °C) using a pilot pasta press (Braibanti, Milan, Italy).
The pasta was dried to 12 % moisture (g water / 100 g sample) in a pilot drier (Afrem International
S.A.S., Dardilly, France) for about 6 h at a maximum temperature of 85 °C, and then allowed to
equilibrate at room temperature for 1 week.
Dry pasta of different formulations was then cooked into boiling water (pasta:water ratio 1:10, no
salt) for either 10 min (optimal cooking time for the control sample, STD) or for the time required to
reach a final moisture content (MC) of 55.0 % in the cooked pasta. Pasta formulations and cooking
times are summarized in Table 1. Pasta were cooked to the selected cooking time, drained, stored
in sealed multi-layer (polypropylene-PP, polyethylene terephthalate-PET, and polyamide- PA)
pouches and kept at 25 °C for 2 h prior to being analysed. Two pasta batches were cooked for each
sample.
Moisture Content
Moisture content (MC) (%) of pasta was determined by weight loss by drying in a forced-air
oven (ISCO NSV 9035, ISCO, Milan, Italy) at 105 °C to constant weight. At least triplicate
samples of cooked pasta were analyzed.
Mechanical Properties
Pasta hardness was measured using a TA.TX2 Texture Analyzer (Stable Micro Systems,
Godalming, UK) equipped with a 25 kg load cell. A single ‘penna’ was cut at a speed of 2 mm/ s
with a trigger force of 0.1 N using a flat blade (HDP/BS, 3 mm thickness, Stable Micro Systems,
Godalming UK). The maximum height of the cutting peak was taken as sample’s hardness (N). At
least 15 penne were cut for each sample.
Proton Nuclear Magnetic Resonance (1H NMR) Mobility)
Page 24
16
A low resolution (20 MHz) 1H NMR spectrometer (the MiniSpec, Bruker Biospin, Milano,
Italy) operating at 25.0± 0.1 °C was used to measure the Free Induction Decay (FID) and the
transverse (T2) relaxation time of pasta. About 4 g of cooked pasta (10 mm high) were placed into
a 10 mm NMR tube that was then sealed with Parafilm® to prevent moisture loss during the NMR
experiment. Three replicates were measured for each sample.
FIDs were acquired using a single 90° pulse, followed by a dwell time of 7 μs, 32 scans and a recycle
delay of 5 s and a 10 ms acquisition window. 1H FIDs were analyzed in the time range 7–100 μs
where the homogeneity of magnetic field was assured. The curves were fitted with a two components
model (exponential and gaussian, Sigmaplot, v6, Systat Software Inc. USA) (Botlan & Helie-
fourel, 1995)
ƒ (t) = y0 + A*exp(-t/TA) + B*exp[-(t/TB)2]
where y0 is the FID decay offset, TA and TB the apparent relaxation times, A and B are the are
intensities of each relaxation component.
T2 relaxation times were measured with a CPMG pulse sequence with a recycle delay of 5 s (≥5 1H
T2), an interpulse spacing of 0.04 ms and 4000 data points. T2 curves were analyzed as quasi-
continuous distributions of relaxation times using a UPENWin software (Alma Mater Studiorum,
Bologna, Italy). Default values for all UPEN parameters were used with the exception of one
parameter (LoXtrap) that was set to 1 to avoid extrapolation of relaxation times shorter than the
first experimental point. 1H T2 CPMG relaxation decays were also fitted with a discrete exponential
model (Sigmaplot, v. 6, Systat Software Inc. USA).
Statistical Analysis
Significant differences (p ≤0.05) among different samples were verified with by one-way-
analysis of variance (ANOVA) followed by least significant difference test (LSD) at p≤0.05
Page 25
17
[SPSS statistical software (Version 16.0, SPSS Inc., Chicago, IL, USA)].
3- Results and Discussion
Moisture Content
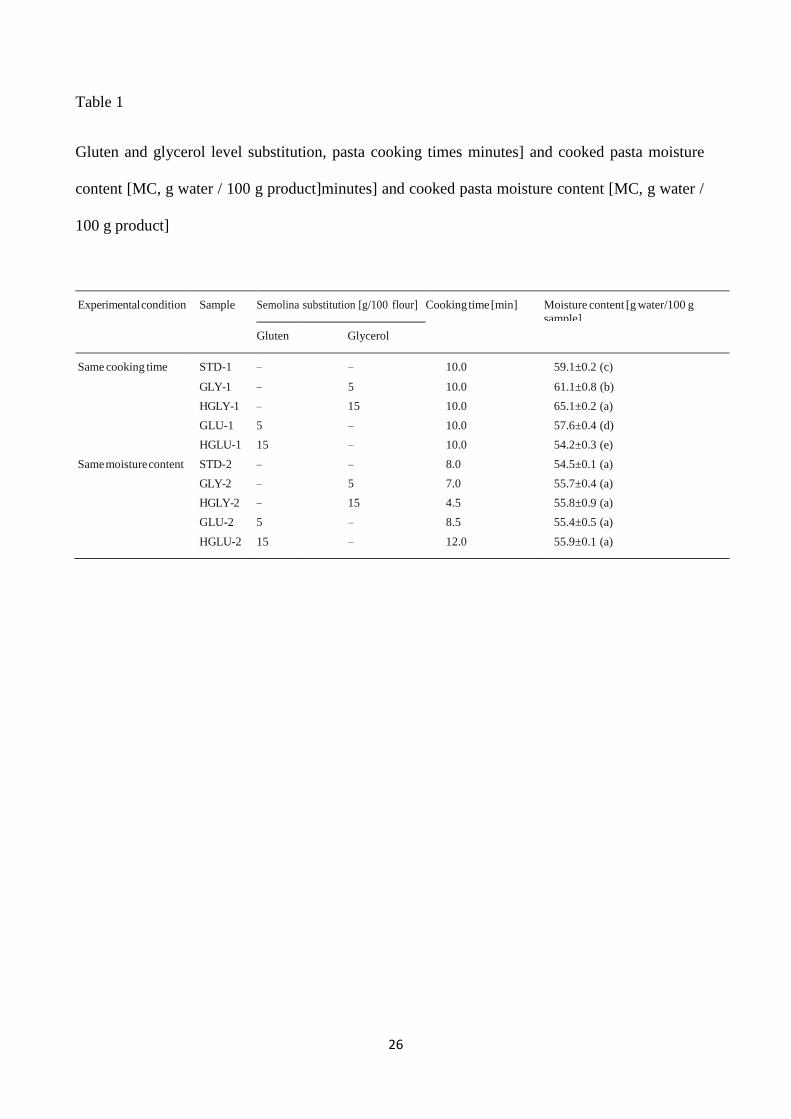
Moisture content (MC) of cooked pasta samples are shown in Table 1. When samples were cooked for
the same time, gluten pasta (GLU-1 and HGLU-1) had a significantly lower moisture content as
compared to STD-1, indicating that, when gluten was added in the formulation, less water was
absorbed by the pasta matrix during cooking. On the contrary, with addition of glycerol in pasta
formulation (GLY-1 and HGLY-1) a larger water uptake was observed and resulted in larger MC of
the cooked product (61.1 and 65.1 %, in GLY-1 and HGLY-1, respectively).
Different cooking times were required to obtain pasta with the same MC (55 %, Table 1), depending
on pastas’ formulation. Gluten lengthened the cooking process (8.5 and 12.0 min in GLU-2 and
HGLU-2, respectively) as compared to STD-2 (8.0 min). Glycerol, on the contrary, shortened the
cooking time, as compared to STD-2, to 4.5 and 7.0 min in GLY-2 and HGLY-2, respectively. It
is important to point out that some of the glycerol (30–40 % of the glycerol content in dry pasta)
was lost in the cooking water, due to its high solubility in water. The overall glycerol content in the
cooked pasta was, therefore, lower than the theoretical one.
The cooking process implies a competition for water between gluten, that requires water to
coagulate, and starch, that needs water to swell and gelatinize (De Noni & Pagani, 2010). Water
absorption kinetics and water absorption mechanisms have been previously explained in pasta
cooking (Del Nobile & Massera, 2002; Del Nobile et al., 2003; Del Nobile et al., 2005): water is
absorbed through holes and cracks on the pasta surface, diffuses towards the inner regions of pasta
through the macromolecular matrix, allowing for an increased mobility of the macromolecules,
resulting in glass transition of the glassy amorphous matrix and melting of the crystalline starch
domains. The cooked product is, therefore, characterized by a rubbery gluten network with
Page 26
18
embedded gelatinized starch (Tg<−20 °C, (Cuq et al., 2003; Cuq & Icard-Vernière, 2001). The
modification of pasta formulation with molecules (e.g., gluten and glycerol) that are able to
interact with water may affect macromolecules plasticization. Our results indicated a hindered water
absorption in the presence of gluten while glycerol favored water absorption during cooking.
Previous studies reported a lower water absorption in dry spaghetti produced with high protein
content semolina (15 % as compared to 13 %, dry basis (Sozer & Kaya, 2008), while no
dependence was reported in spaghetti with added gluten (12–44 %, dry basis (Bernin et al., 2014;
Del Nobile, 2005). GLU-1 and HGLU-1 had comparable gluten level (18 and 26 % of gluten, dry
basis, respectively) to spaghetti (Bernin et al., 2014; Del Nobile, 2005), but exhibited different
water absorption. The discrepancy between our results and these works might be related to the
different pasta shape (penne vs spaghetti), different drying processes, different cooking conditions
(in pot or test tube, without or with salt) that are expected to modify water absorption and kinetics.
The higher MC of glycerol added pasta (GLY-1 and HGLY-1) was attributed to glycerol high water
binding capacity that favored moisture uptake and decreased optimal cooking time (Table 1). Glycerol
might have also had a plasticizing effect on the gluten network, making it more flexible (Zhang et al.,
2005) and facilitating water absorption into the pasta matrix.
Mechanical Properties
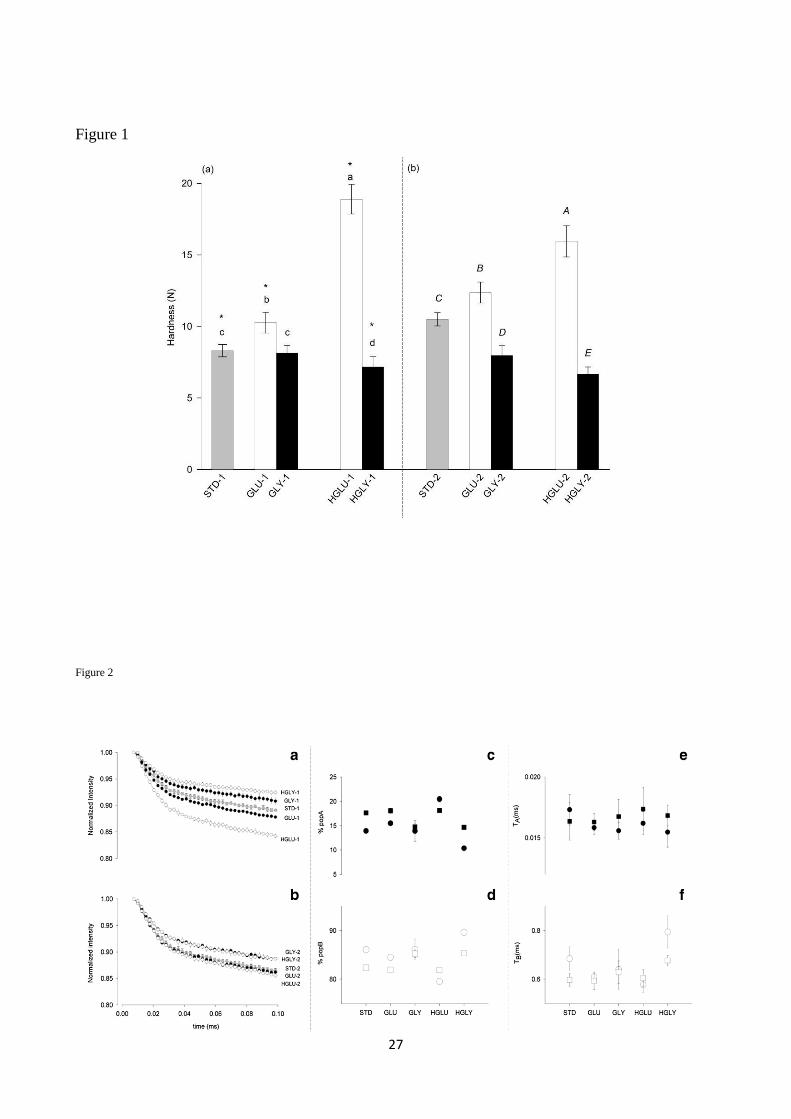
Hardness of pasta samples cooked for the same cooking time is shown in Fig. 1a. STD-1 had a
hardness of 8.3 N, and it was increased by inclusion of higher level of gluten in the formulation to
10.2 and 18.8 N in GLU-1 and HGLU-1, respectively. On the contrary, glycerol significantly
softened pasta texture, with GLY-1 and HGLY-1 having hardness of 8.1 and N, respectively.
To verify if MC was the major contributor to pasta texture, hardness of pasta samples cooked for
different times to the same MC (55.0±1.0 %) was measured (Fig. 1b). The presence of gluten in the
formulation significantly hardened the cooked product (12.3 and 15.9 N in GLU-2 and HGLU-2,
Page 27
19
respectively, versus 10.5 N in STD-2) while glycerol softened the cooked pasta, despite its actual
content was lower than the theoretical one (7.9 and 6.6 N in GLY-2 and HGLY-2, respectively,
versus 10.5 N in STD-2). These results are in agreement with previous works where stronger and
high gluten quality semolina resulted in harder cooked pasta (Cubadda et al., 2007; Grzybowski &
Donnelly, 1979; Day et al., 2006). An action of glycerol on product’s structure resulting in a
macroscopic softening of the matrix was previously hypothesized in bread (Baik & Chinachoti, 2001,
2002).
Statistical differences between pasta samples with the same formulation but different moisture content
were also checked (STD-1 vs STD-2, GLU-1 vs GLU-2, HGLU-1 vs HGLU-2). Hardness generally
reflected MC differences in gluten enriched pastas, while glycerol enriched samples showed slight
differences in hardness (although significant in HGLY, Fig. 1) with larger differences in MC. It might
be hypothesized that water, above a certain limit, does not contribute to pasta softness as all the
potential binding sites for water of the pasta polymers might have been saturated.
It was concluded that MC was not the sole factor contributing to the texture of pasta samples but
gluten and glycerol had an effect on product texture as they might have influenced water–solid
interactions, product’s microstructure and led to the development of a different consistency at a
macroscopic level.
1H NMR Mobility
1H NMR mobility was studied, at 20 MHz, for the fastest relaxing component with a FID
experiment, while the slower relaxing protons were characterized in terms of 1H T2 relaxation time
distributions.
1H FIDs of pasta products obtained in this study are reported in Fig. 2.
1H FIDs of GLU-1 and
HGLU-1 were faster than STD-1 (Fig. 2a), suggesting a reduced molecular mobility in the gluten
samples within this time frame. On the contrary, the FIDs of GLY-1 and HGLY-1 were slower (less
Page 28
20
sharp) than STD-1.
The 1H FIDs of pasta with the same moisture content (Fig. 2b) were not significantly modified
by the addition of gluten (GLU-2 and HGLU-2) while glycerol (GLY-2 and HGLY-2) resulted in
slower decays as compared to STD-2, indicating an increased 1H molecular mobility in this NMR
time-frame.
1H FIDs were fitted with a two components model (exponential and Gaussian functions; Fig. 2c and
d) to verify which proton fraction contributed more significantly to the different decays. In pastas
cooked for the same time (Fig. 2c and d, circles), the most rigid component (A, relaxing at TA
~0.015–0.017 ms) represented 14 % of the total protons in STD-1, while it was increased to 15 and
20 % in GLU-1 and HGLU-1, suggesting a reduced molecular mobility of the most rigid protons
in gluten enriched pasta. On the contrary, this component was less represented in GLY-1 and
HGLY-1 (10 and 13 %, respectively) than in STD-1, indicating that glycerol enhanced proton
molecular mobility in this NMR time frame. The more mobile component (B) relaxed slightly
faster in GLU-1 and HGLU-1 (TB ~0.611 and ~0.578 ms, respectively) while it relaxed more
slowly in HGLY-1 (~0.794 ms) than in STD-1 (~0.685 ms) and GLY-1 (~0.641 ms).
In samples with the same moisture content (Fig. 2c and d, squares), gluten (GLU-2 and HGLU-2)
did not alter the mobility of the FID protons in respect to STD-2, while, in the presence of glycerol
(GLY-2 and HGLY-2), the most rigid protons were less abundant (~15 %) than in STD-2 (~18 %).
Samples with the same formulation but different moisture content were found to have slightly
different populations percentages (i.e., lower percentage of population A protons with larger MCs)
but comparable relaxation times (TA and TB). Previous studies of 1H FID mobility in bread crumb
(Farhat et al., 2006; Sereno et al., 2007; Bosmans et al., 2012; Bosmans et al., 2013) reported a
decrease in FID mobility during storage as a consequence of moisture loss and amylopectin
retrogradation. Two proton FID populations (with relaxation times similar to those found in this
Page 29
21
work) were reported in model systems (dough) and bread (Bosmans et al., 2013): the fastest relaxing
protons were associated to the solid CH protons of crystalline and amorphous starch not in contact
with water and the more mobile protons to amorphous starch and gluten in little contact with water,
respectively (Bosmans et al., 2013). The differences observed in the 1H FID populations in our
samples, were attributed primarily to MC and, to a lesser extent, to crystalline starch domains.
1H T2 distributions of relaxation times of pasta with different formulations (STD, GLU, and GLY)
are reported in Fig. 3, and they were characterized by the presence of three 1H populations. It was
noticed that these populations were more clearly observable in STD and GLU, i n d i ca t i n g that
pro tons were more “compartmentalized” in different mobility domains with reduced proton
exchange under the experimental timeframe. Overlapped populations were instead observed
in GLY, suggesting a more pronounced protons’ exchange among the different domains of the
pasta matrix. Different solid–water interactions and microstructure are suggested in pasta samples
by these data, and similar conclusions were reported in enriched gluten pasta (20 and 40 %
substitution level) cooked inside a real time MRI coupled with a microscope (Bernin et al., 2014)
where a more heterogeneous water distribution and microstructure was observed at higher
gluten contents.
According to the distributions obtained by UPENWin (Fig. 3), a three exponentials model fitting
of the 1H T2 curves was performed. The three components model was considered appropriate also
for the GLY samples as the wide and low intensity peak in the 0.1–40 ms range indicates the
presence of at least two proton mobility domains. The relative abundances of the proton
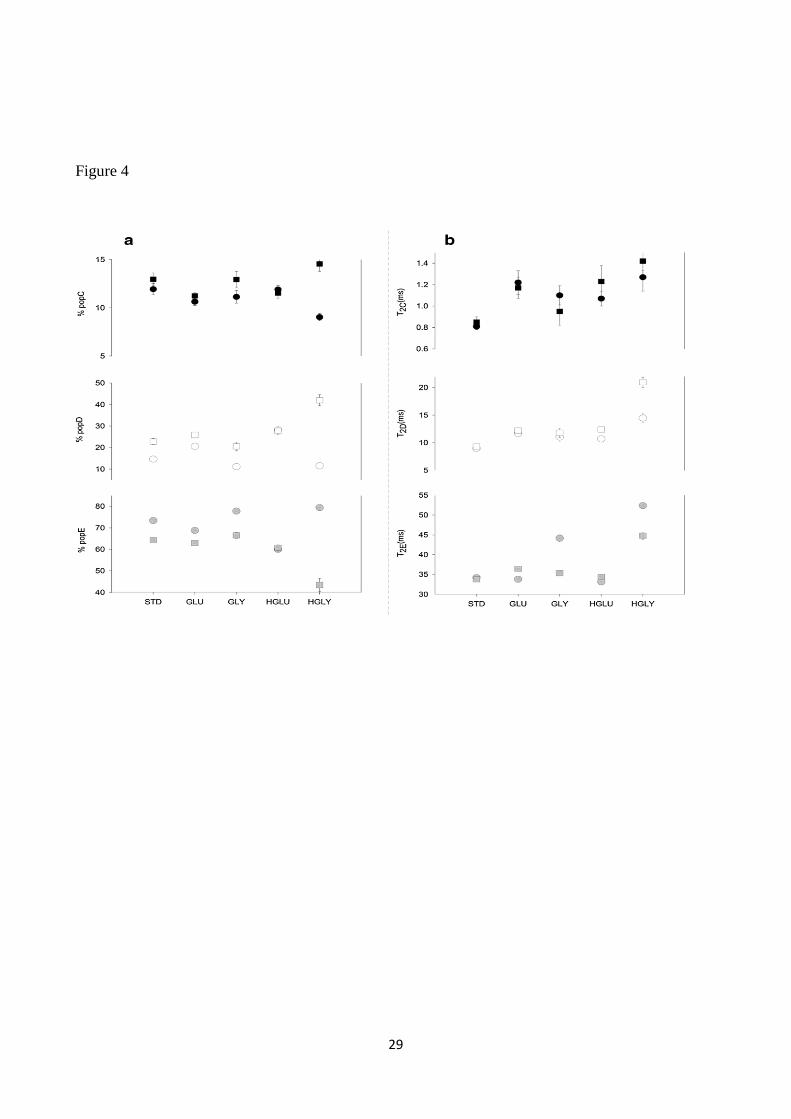
populations, named C, D and E from the more rigid to the more mobile protons, and their relative
relaxation times are reported in Fig. 4. In pastas cooked for the same cooking time (Fig. 4,
circles), gluten samples were similar to STD for relaxation times and abundance of the
most rigid protons (population C), while the more mobile protons (population E) were less
Page 30
22
abundant (HGLU-1). In the glycerol samples, increased relaxation times in the three proton
populations (T2C, T2D and T2E) were observed, as well as a much larger presence of the most
mobile protons (population E), more markedly in HGLY-1. In the samples with equal moisture
content (Fig. 4, squares), gluten enriched pastas were similar to STD for 1H T2 relaxation
times and abundance of the most rigid protons (population C), while the more mobile protons
(population E) were slightly less abundant. In the glycerol enriched pasta, slower relaxation
times were observed in all proton populations; population D was significantly larger, while
population E was less represented at higher levels of glycerol (HGLY-2).
Proton T2 relaxation analyses suggested a strong influence of pasta formulation on molecular
mobility: the relationship of NMR proton mobility indicators was, therefore, analyzed in
respect to pasta formulation. Gluten content was found to have a good relationship with the
percentage of population D (R2 ≥ 0.96, data not shown) and, it might be tentatively
hypothesised that protons of population D may represent protein domains. Moisture content of
pasta, on the contrary, was found to have a good relation with population E percentage (R2=
0.8804, data not shown) in the samples cooked for the same time, indicating that changes in MC
may be represented in the more mobile protons domains.
Page 31
23
4- Conclusions
The effect of gluten and glycerol on physico-chemical properties and 1H NMR mobility was
studied in pasta samples cooked for the same cooking time or to the same moisture content (55 %).
Gluten and glycerol enriched pastas resulted in different water absorption during cooking and in
modified mechanical properties. Hardness was greatly influenced by moisture content, but gluten
and glycerol also had an impact by hardening or softening, respectively, the products. An effect of
these ingredients was also observed at a molecular level. Gluten reduced proton molecular
mobility, while glycerol promoted protons exchangeability and enhanced their mobility, possibly
contributing to the different macroscopic pasta hardness. The effect of glycerol was particularly
important since its actual content in the cooked product was lower than the theoretical one, due to
its loss during the cooking process.
This work indicated that modification of pasta formulation may provide significant changes on pasta
mechanical properties. Cooked pasta properties have a great importance in the development of
ready-to-eat pasta meals where long shelf-life may compromise the quality of the product and may
negatively affect consumers’ acceptability. Proper and tailored interventions on pasta formulations
can be considered to control cooked pasta texture, lengthen storage stability and improve the
quality of these products through preservation of mechanical properties during shelf-life.
Acknowledgments
This work was partially supported by Emilia- Romagna Region (POR FSE 2007–2013). The
authors would like to thank Michele Avellino for carrying out part of the experiments.
Page 32
24
5- References
E. Carini, E. Curti, M. Minucciani, F. Antoniazzi, E. Vittadini, in Engineering Aspects of Cereal
and Cereal-Based Products, ed. By R.D.P.F. Guine, P.M. Dos Reis Correia (CRC Press, Florida,
2013), p. 211
E. Carini, E. Curti, P. Littardi, M. Luzzini, E. Vittadini, Innov. Food Sci. Emerg. Technol. 17, 163
(2013)
D.F. Olivera, V.O. Salvadori, J. Food Eng. 110, 487 (2012)
G.A. Redmond, T.R. Gormleya, F. Butlerb, Lebensm.-Wiss. Technol. 38, 81 (2005)
D.F. Olivera, V.O. Salvadori, J. Food Eng. 90, 271 (2009)
D.F. Olivera, V.O. Salvadori, Int. J. Food Sci. Technol. 46, 1445 (2011)
M. Kindt, G. Lercker, P. Mazzaracchio, G. Barbiroli, Food Control 17, 847 (2006)
E. Carini, E. Curti, F. Cassotta, N.E.O. Najm, E. Vittadini, Food Chem. 144, 74 (2014)
M. Kindt, P. Mazzaracchio, G. Barbiroli, Int. J. Food Sci. Technol. 43, 1645 (2008)
A. Diantom, E. Carini, E. Curti, F. Cassotta, A. D’Alessandro, E. Vittadini, Food Chem. (2015).
doi:10.1016/j.foodchem.2015.04. 026
J.A. Gray, J.N. Bemiller, Compr. Rev. Food Sci. Food Saf. 2, 1 (2003)
M.Y. Baik, P. Chinachoti, J. Agric. Food Chem. 49, 4031 (2001)
M.Y. Baik, P. Chinachoti, Cereal Chem. 79, 376 (2002)
X. Zhang, I. Burgar, M.D. Do, E. Lourbakos, Biomacromolecules 6, 1661 (2005)
T. Gillgren, S.A. Barker, P.S. Belton, D.M. Georget, M. Stading, Biomacromolecules 10, 1135
(2009)
R. Cubadda, M. Carcea, E. Marconi, M. Trivisonno, Cereal Chem. 84, 48 (2007)
R.A. Grzybowski, B.J. Donnelly, J. Agric. Food Chem. 27, 380 (1979)
Page 33
25
N. Sozer, A. Kaya, Int. J. Food Prop. 11, 351 (2008)
D. Bernin, T. Steglich, M. Röding, A. Moldin, D. Topgaard, M. Langton, Food Res. Int. 66, 132
(2014)
D. Botlan, I. Helie-Fourel, Anal. Chim. Acta 311, 217 (1995)
I. De Noni, M.A. Pagani, CRC Crit. Rev. Food Sci. Nutr. 50, 465 (2010)
M.A. Del Nobile, M.J. Massera, J. Food Eng. 55, 237 (2002)
M.A. Del Nobile, G.G. Buonocore, A. Panizza, G. Gambacorta, J. Food Sci. 68, 1316 (2003)
M.A. Del Nobile, A. Baiano, A. Conte, G.J. Mocci, J. Cereal Sci. 41, 347 (2005)
B. Cuq, J. Abecassis, S. Guilbert, Int. J. Food Sci. Technol. 38, 759– 766 (2003)
B. Cuq, C. Icard-Vernière, J. Cereal Sci. 33, 213–221 (2001)
L. Day, M.A. Augustin, I.L. Batey, C.W. Wrigley, Trends Food Sci. Technol. 17, 82 (2006)
I.A. Farhat, M.A. Ottenhof, V. Marie, E. De Bezenac, in Magnetic Resonance in Food Science:
Latest Developments, ed. by P.S. Belton, A.M. Gil, G.A. Webb, D. Rutledge (Royal Society of
Chemistry, London, 2003), p. 172
N.M. Sereno, S.E. Hill, J.R. Mitchell, U. Scharf, I.A. Farhat, in Magnetic Resonance in Food
Science: From Molecules to Man, ed. by I.A. Farhat, P.S. Belton, G.A. Webb (Royal Society of
Chemistry, London, 2007), p. 89
G.M. Bosmans, B. Lagrain, L.J. Deleu, E. Fierens, B.P. Hills, J. Delcour, J. Agric. Food Chem.
60, 5461 (2012)
G.M. Bosmans, B. Lagrain, N. Ooms, E. Fierens, J.A. Delcour, J. Agric. Food Chem. 61, 4646
(2013)
Page 34
26
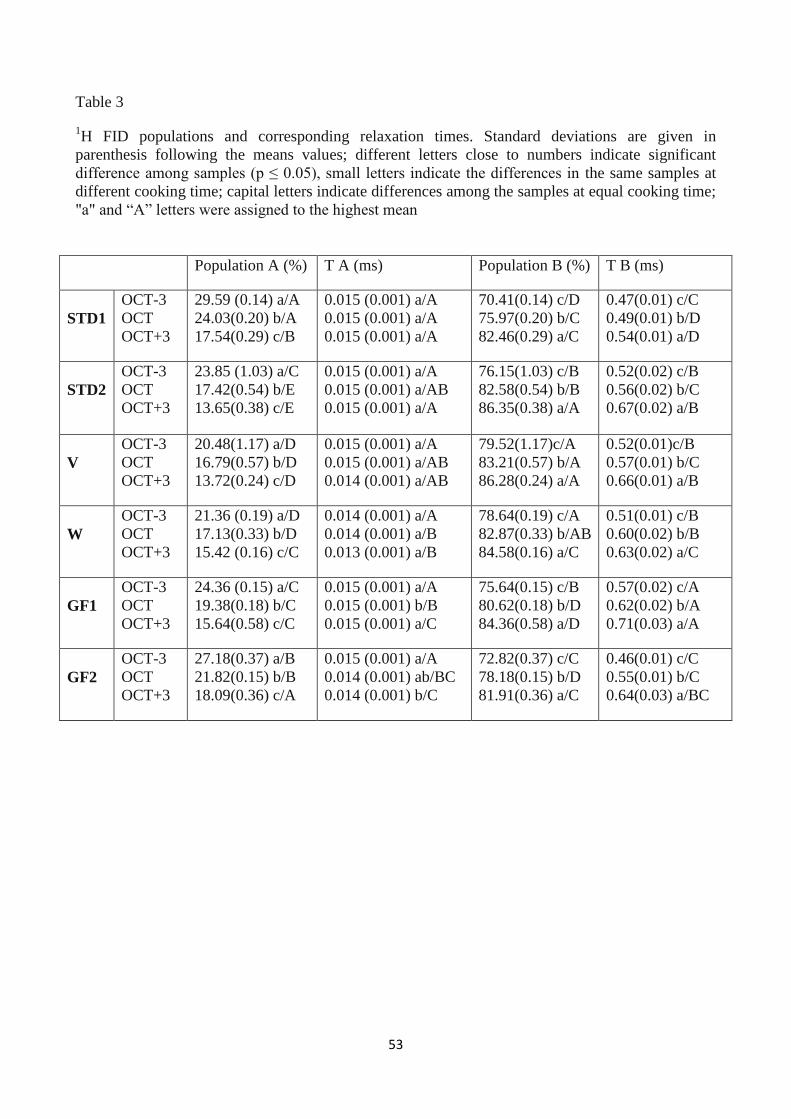
Table 1
Gluten and glycerol level substitution, pasta cooking times minutes] and cooked pasta moisture
content [MC, g water / 100 g product]minutes] and cooked pasta moisture content [MC, g water /
100 g product]
Experimental condition Sample Semolina substitution [g/100 flour] Cooking time [min] Moisture content [g water/100 g
sample]
Gluten Glycerol
Same cooking time STD-1 – – 10.0 59.1±0.2 (c)
GLY-1 – 5 10.0 61.1±0.8 (b)
HGLY-1 – 15 10.0 65.1±0.2 (a)
GLU-1 5 – 10.0 57.6±0.4 (d)
HGLU-1 15 – 10.0 54.2±0.3 (e)
Same moisture content STD-2 – – 8.0 54.5±0.1 (a)
GLY-2 – 5 7.0 55.7±0.4 (a)
HGLY-2 – 15 4.5 55.8±0.9 (a)
GLU-2 5 – 8.5 55.4±0.5 (a)
HGLU-2 15 – 12.0 55.9±0.1 (a)
Page 35
27
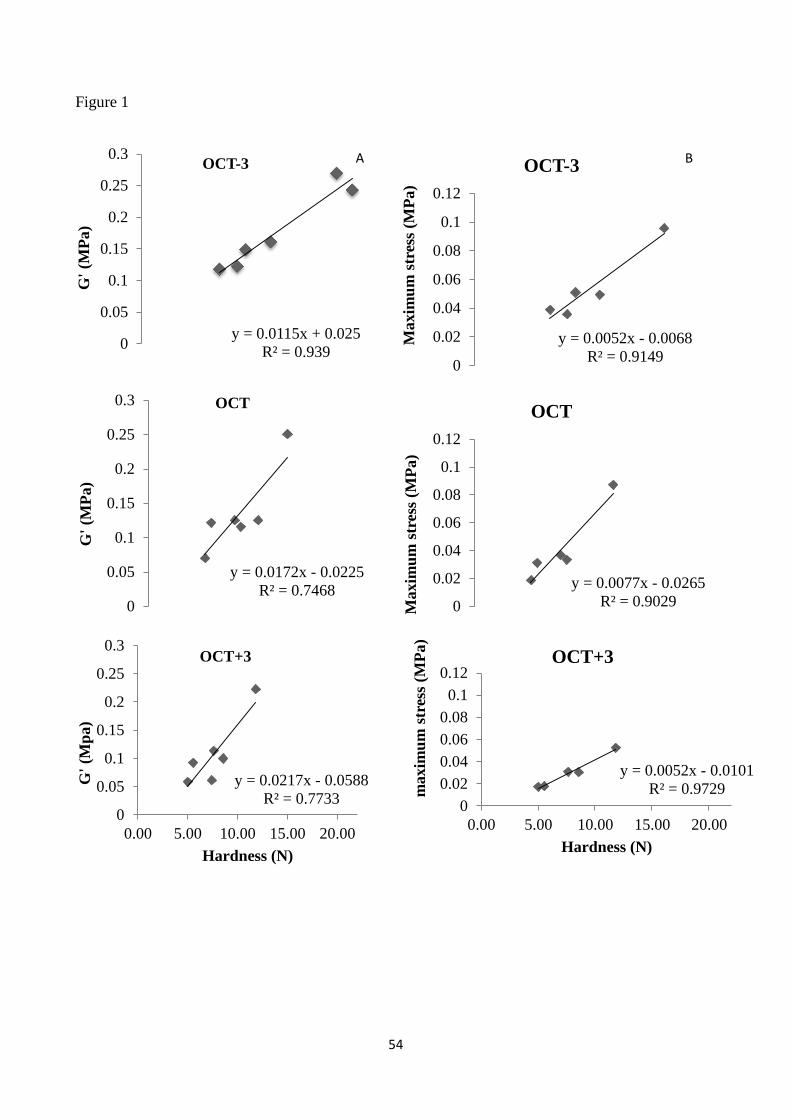
Figure 1
Figure 2
Page 38
30
Figure caption
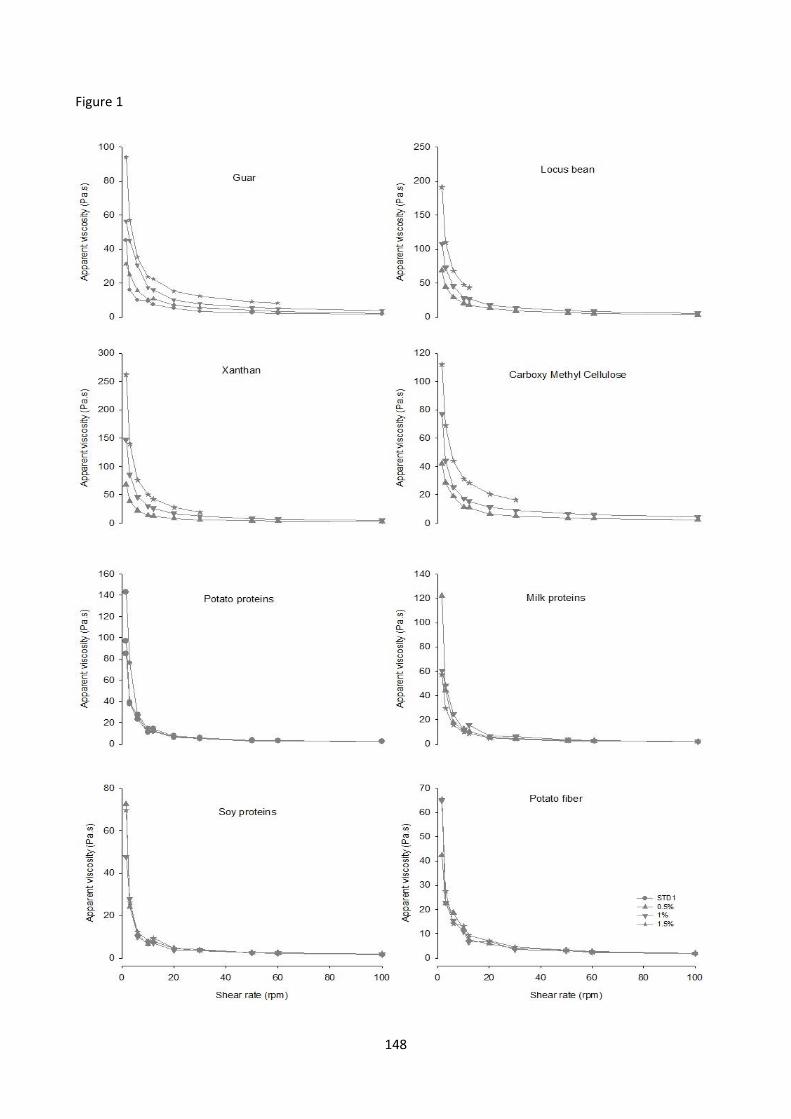
Figure 1
Hardness (N) of pasta products with same cooking time (a) and moisture content (b). Different
statistical letters indicate significant differences (p≤0.05) among samples with same cooking time
(small letters) and moisture content (capital letters). Stars above bars indicate differences between
samples with the same formulation (p≤0.05)
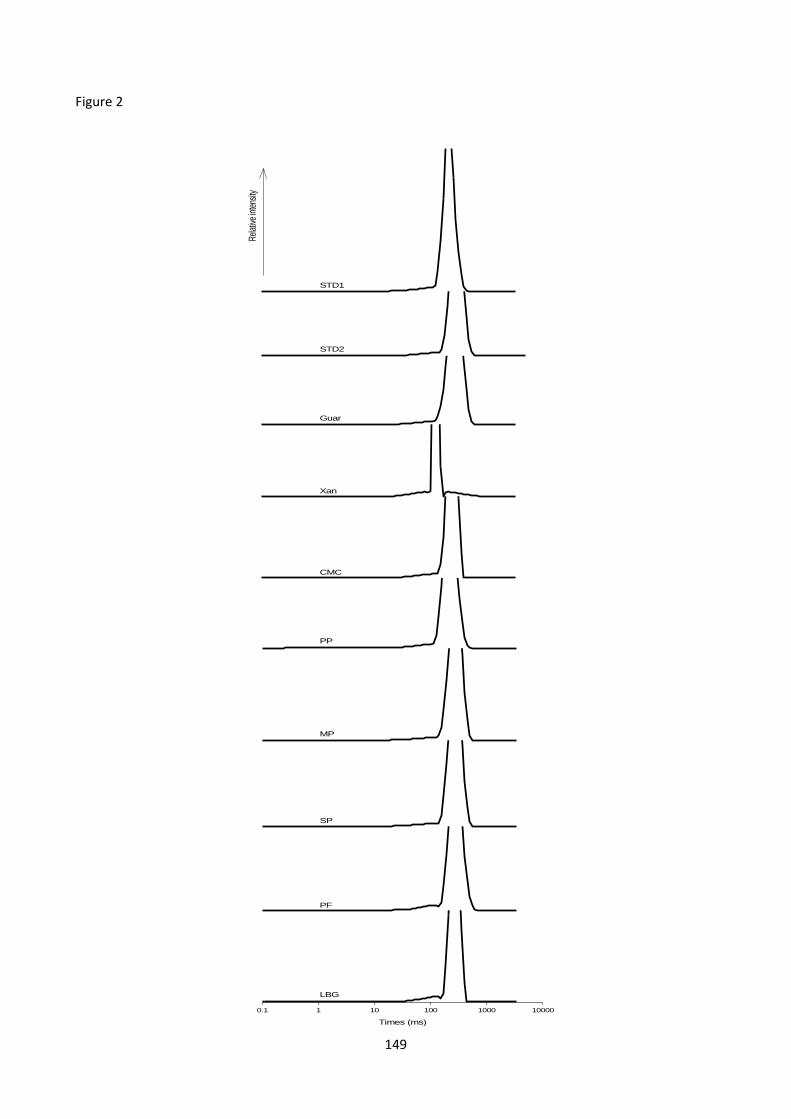
Figure 2
1H FID curves of samples at the same cooking time (a) and same moisture content (b),
1H relative
abundance of population A (%) (c) and population B (%) (d), 1H relaxation times TA (ms) (e) and
TB (ms) (f), obtained from the discrete fitting for samples with the same cooking time (circles)
and samples with the same moisture content (squares)
Figure 3
Representative 1H T2 distributions of relaxation times of samples with different formulation
Figure 4
Relative abundance (a) and relaxation times (b) of 1H T2 populations obtained from the discrete
fitting for samples with the same cooking time (circles) and samples with the same moisture
content (squares)
Page 39
31
Diantom et al., to be submitted
Mechanical properties and water status of fresh cooked pasta with different formulations
Page 40
32
Abstract
Cooked pasta with different formulations was characterized using macroscopic (moisture content,
frozen water and water evaporating profile) and molecular (low resolution NMR 1H FID,
1H T2)
water status indicators, as well as macroscopic (texture, hardness) and mesoscopic (DMA storage
modulo, loss modulo, tan delta and maximum stress at break) mechanical parameters.
Viscoelastic properties (G’, G’’) and hardness significantly decreased while moisture content,
frozen water and proton molecular mobility significantly increased with increasing cooking time.
The water absorbed during cooking was found to be free and tightly bounded water, but it was not
correlated to the cooking time and formulation. STD2 seemed to not be significantly different than
V and GF2, which exhibited higher texture than STD2. Strong relationship between the hardness
and mechanical properties was also observed at all cooking times.
Keywords: Pasta, Physico-chemical properties, Mechanical properties, 1H NMR mobility
Page 41
33
1-Introduction
Pasta is a very simple product obtained from durum wheat semolina and water, kneaded to obtain a
dough that is than shaped and, most commonly, dried. Pasta is a very common food, largely
consumed around the world because of its convenience. Pasta is easy to cook, simple to store, has a
long shelf-life. Traditionally, pasta has been produced with durum wheat semolina and water (and
sometimes eggs) as only ingredients (Troccoli et al., 1999) in Europe and North America, but
nowadays a large variety of pasta products are offered in the market. Pasta is now produced with
vegetable, legumes, whole grains, and can also be produced from non-wheat sources (rice, corn,
sorghum and pseudo-cereals such as amaranth, quinoa and buckwheat; Marti & Pagani, 2013) to
fulfil the requirements for celiac and gluten intolerant individuals.
Pasta eating quality has a strong cultural influence (Carini et al., 2013) and it is strongly dependent
on the content and quality of wheat proteins (Matweef, 1966; Matsuo & Ivrine, 1970; Walsh &
Gilles, 1971; Matsuo et al., 1972; Grzybowski & Donnelly, 1979), as well as on the length of the
cooking process.
During cooking in excess boiling water, pasta absorbs water and undergoes protein coagulation and
starch gelatinization that strongly affect eating quality of cooked pasta. Quality of cooked pasta can
be evaluated in terms of stickiness, firmness, cooking and overcooking tolerance, water absorption,
degree of swelling and loss of solids into the cooking water (Manser, 1981). Water absorption is
affected more by the cooking time than the protein content among semolina pasta with different
protein content (Edwards et al., 1993). The absorbed water during cooking exhibited different
diffusion behaviour among semolina pastas, which is correlated to the protein amount, and
decreased with increasing protein content (Del Nobile et al., 2005). Water in cooked pasta exhibited
a different behaviour, free and bonded water (Fessas & Schiraldi, 2001), according to its
evaporating temperatures (measured by thermogravimetric analysis), lower for free water and
Page 42
34
higher for bound water. Moisture content and water status may strongly influence the quality of
cooked pasta in terms of texture, viscoelastic properties and proton molecular mobility.
Thus understanding water status in the final product may help in the evaluation of the quality of
fresh cooked pasta, in relation to mechanical properties. This study aims to explore the effect of
formulation and cooking on physico-chemical, mechanical properties, water status of fresh cooked
pasta by means of Thermo-Gravimetric Analysis (to investigate the evaporation profile of water
absorbed during cooking) Differential Scanning Calorimiter, Texture Analysis, Nuclear Magnetic
Resonance and Dynamic Mechanical Analysis.
2- Materials and Methods
2-1 Materials
Six pastas with a ridged or “rigate” penne” shape with different formulations (Table 1) were used in
this study and were obtained from a local supermarket.
Two pasta controls (semolina and water; STD1 and STD2) were studied to represent, respectively,
“high” and “medium” quality pasta products. Two gluten free (GF1 and GF2) products were
considered and they were made of, respectively, corn flour, rice flour, mono- and di-glycerides of
fatty acids (GF1), and white rice, brown rice, corn and quinoa (GF2). Two enriched pasta were
studied, a whole grain product [W] made with whole grain semolina, and a veggie [V] product, that
included tomato and carrot in the formulation.
Pasta was cooked in boiling water (100 g pasta / 1 l of water ratio) for the optimal cooking time
(OCT, “al dente”, as indicated on the pasta box), OCT – 3 minutes (undercooked), and OCT + 3
minutes (overcooked) (Table 2). Cooked pasta was cooled to room temperature for 20 minutes prior
to analyses.
2-2- Methods
Page 43
35
2.2.1- Mechanical properties characterization
Texture
Pasta texture was measured using a TA.TX2 Texture Analyzer equipped with a 25 kg load cell
(Stable Micro systems, Goldalming, UK). Single pasta pieces were cut with a flat blade (speed of 2
mm/s; trigger force 0.1 N), and the maximum height of the cutting peak was taken as ‘‘hardness’’.
At least 10 pasta pieces for each sample were analyzed.
Dynamic Mechanical Analysis (DMA)
Viscoelastic properties of cooked pasta at 25 °C were measured using a Q800 Dynamic Mechanical
Analysis (TA Instruments, New Castle, USA) equipped with a 15mm diameter parallel plate
compression clamp (15mm diameter). A multi strain sweep test was preliminarily conducted to
identify the linear viscoelastic region for each sample and it was found to be 9-30 µm. A multi-
frequency test was then carried out at 15 µm strain over the 1-50 Hz frequency range, to obtain the
storage modulus, loss modulus and tan delta as function of frequency. Stress/strain test was carried
out in the 0.8 N / min up to 5N, to obtain the maximum stress at break. At least 15 replicates were
carried out.
2-2-2 Water status characterization
Thermo-Gravimetric Analysis (TGA)
About 10-15 mg of cooked pasta were placed into aluminium pan and heated from room
temperature (25 °C) to 150 °C at 5 °C/min. using a Thermo-Gravimetric Analyzer (TGA Q5000,
TA instruments, New Castle, DE, USA). The TGA trace obtained as mass loss (%) vs temperature
(°C) was used to calculate moisture content, while its first derivative (Derivative
Thermogravimetric [DTG, % / °C]) using Universal Analysis Software, version 3.9A (TA
Instruments, New Castle, DE), with subsequent peak deconvolution using PeakfitV4.12 (Systat
Page 44
36
Software, Framinghan, Ma, USA) were used to characterize the water evaporation profile. At least
three replicates were carried out for each sample.
Differential Scanning Calorimetry (DSC)
Frozen water content was measured using a Differential Scanning Calorimeter (DSC Q100, TA
Instruments, New Castle, DE, USA) calibrated with indium (T = 156.6°C; H = 28.71 J/g) and
mercury (T = -38.83°C, H = 11.40 J/g). About 10-15 mg of RTE pasta were placed into hermetic
stainless steel pans (Perkin Elmer, USA), quench cooled to -50°C and then heated to 100°C at 5
°C/min. DSC thermograms were analyzed using an Universal Analysis Software, version 3.9A (TA
Instruments, New Castle, DE).
“Frozen” water content (at the select experimental conditions; FW) was calculated from the
endothermic peak around 0 °C (ice melting) using the following equation:
FW = Enthalpy Ice Fusion * (1/Latent Heat Ice Fusion)* (1/MC)*100
Where FW is frozen water (%, g frozen water/g water), ice fusion enthalpy (J/g product), latent heat
of ice fusion is 334J/g ice, and MC is moisture content (g water/1 g product).
The obtained frozen water was normalized on the moisture content. At least three replicates were
carried out.
Proton Nuclear Magnetic Resonance (1H NMR)
A low resolution (20 MHz) 1H NMR spectrometer (the Minispec, Bruker Biospin, Milano, Italy)
operating at 25.0 ± 0.1°C was used to study proton molecular mobility by measuring the free
induction decay (FID) and transverse relaxation times (T2). About 2 g of RTE pasta were placed
into a 10 mm NMR tube that was then sealed with Parafilm to avoid moisture loss during the NMR
experiment. 1H FIDs were acquired using a single 90° pulse, followed by a dwell time of 7 µs, a
recycle delay of 3 s and a 10 ms acquisition window. 1H FIDs were analyzed in the time range 7–
100 µs where the homogeneity of magnetic field was assured. The curves were fitted with a two
Page 45
37
components model (exponential and gaussian; Le Grand, Cambert, & Mariette, 2007; Sigmaplot,
v6, Systat Software Inc., USA):
ƒ (t) = y0 + A*exp(-t/TA) + B*exp[-(t/TB)2]
where y0 is the FID decay offset, A and B are the intensities of each relaxation component, TA and
TB are the apparent relaxation times.
T2 relaxation time was measured with a CPMG pulse sequence with a recycle delay of 3 s (P5 1H
T1), an interpulse spacing of 0.04 ms and 4000 data points. T2 curves were analyzed as
quasicontinuous distributions of relaxation times using a UPENWin software (Alma Mater
Studiorum, Bologna, Italy). Default values for all UPEN parameters were used with the exception
of one parameter (LoXtrap) that was set to 1 to avoid extrapolation of relaxation times shorter than
the first experimental point. 1H T2 CPMG relaxation decays were also fitted with a discrete
exponential model (Sigmaplot, v.6, Systat Software Inc., USA).
2.2.3 Statistical analysis
Means and standard deviations (SD) were calculated with SPSS statistical software (Version 22.0,
SPSS Inc., Armonk, New York, USA). Significant differences (p ≤ 0,05) among different samples
were verified with by one-way-analysis of variance (ANOVA) with a Tukey-high and LSD
significant difference test.
3-Results and discussion
The different pasta used in this paper were cooked at different cooking time ( OCT-3, OCT and
OCT+3) considering the cooking time reported on the product packaging as the optimal cooking
time. Three group of pasta were used, standards, enriched and gluten free pasta according to their
formulation (Table 1). Samples with similar moisture content but different cooking time were used
to evaluate the effect of moisture content on mechanical properties and proton molecular mobility.
Page 46
38
3.1. Mechanical properties
3.1.1. Hardness
Hardness of cooked pasta was reported in Table 2. Hardness significantly dropped with increasing
cooking time in all samples, as expected. STD1 was significantly harder than STD2 at all cooking
times. Curti et al., (2015), reported that pasta cooked for 10 minutes exhibited 8.3 N as pasta
hardness. In this study STD2 exhibited similar hardness value (8.6 N) when it was cooked for 11
minutes (OCT). Firmness and stickiness are the main quality factor of cooked pasta, which must
resist surface disintegration and retain firm structure (Cubadda et al, 2007). Thus higher hardness
means higher quality of cooked pasta, therefore STD1 might be considered best quality than STD2.
The cooked pasta quality was strictly correlated to the amount and composition of durum proteins,
in particular gluten strength (Grant et al, 1993; D’Egidio et al., 1990, Cubadda et al., 2007) and it
also depend to the dried temperature (Manser 1980; Manthey & Schorno, 2002; De Stefanis &
Sgrulletta, 1993). Considering that STD1 and STD2 have the same amount of proteins, the highest
hardness in STD1 might be correlated to the quality of proteins and processing parameters, which
conferred to that pasta a good structure. Concerning the enriched pasta, V was generally harder than
W, possibly due to the presence of bran in W that might have altered the gluten network, which was
associated to the dilution effect of bran on gluten cohesiveness (Kordonowy & Youngs, 1985).
Manthey & Schorno, (2002), reported that the presence of bran interfered with the continuity of
gluten matrix, reducing hardness of whole wheat spaghetti. Whereas in GF pastas, GF1 was
significantly softer than GF2 at all cooking times. Considering the effect of formulation, all samples
showed lower texture quality as compared to STD1 at all cooking times, except in the case of GF2
which exhibited higher hardness than STD1 in undercooked pasta. While STD2 resulted to be softer
than V and harder than W at all cooking times, but as compared to GF pasta, it resulted to harder
than GF1 and softer than GF1 at all cooking times.
Hardness in gluten free pasta is likely to be related to the process of starch gelatinization during
cooking, which in GF1 hardness gradually decreased from OCT-3 to OCT+3 while in GF2 it
Page 47
39
showed the highest value at OCT-3 and then was halved at OCT, possibly indicating that in this
sample more water was required for gelatinization with starch being more resistance to
gelatinization. In fact GF2 contains brown rice, where starch behaves as pre-heated starch, that is
more resistant to gelatinization, reducing starch swelling (Resmini & Pagani, 1983; Riana et al.,
2005) and exhibiting a harder texture, as compared to samples with starch is not untreated.
Higher texture quality in V than STD2 might be due to the added fiber. The presence of fiber,
according to its type and amount, induces changes in protein- starch network affecting cooked pasta
quality. Tudorica et al., (2002), reported that the presence of pea fiber induced porosity into
protein-starch-fiber network, due to higher attitude of gelatinization, while the addition of Inulin
exhibited similar structure of protein-starch-fiber network as standard pasta. In fact they reported
that the gelatinized starch granules integrated the developed protein matrix to form a compact
structure, which determines the hardness in cooked pasta. Thus the presence of fiber in V, might
help to control starch gelatinization conferring to V pasta higher hardness.
At the same moisture content, STD1 exhibited the highest hardness as compared to all samples,
while STD2 had similar hardness as V, but it was significantly harder than GF2, W and GF1. GF2
was significantly harder than W which had higher hardness than GF2. Considering that hardness
was one of the main factor which defines the quality of cooked pasta, it might be possible to
classify the different pasta used in this study as following: STD1 > STD and V > GF2 > W > GF1.
3.1.2. Viscoelastic properties
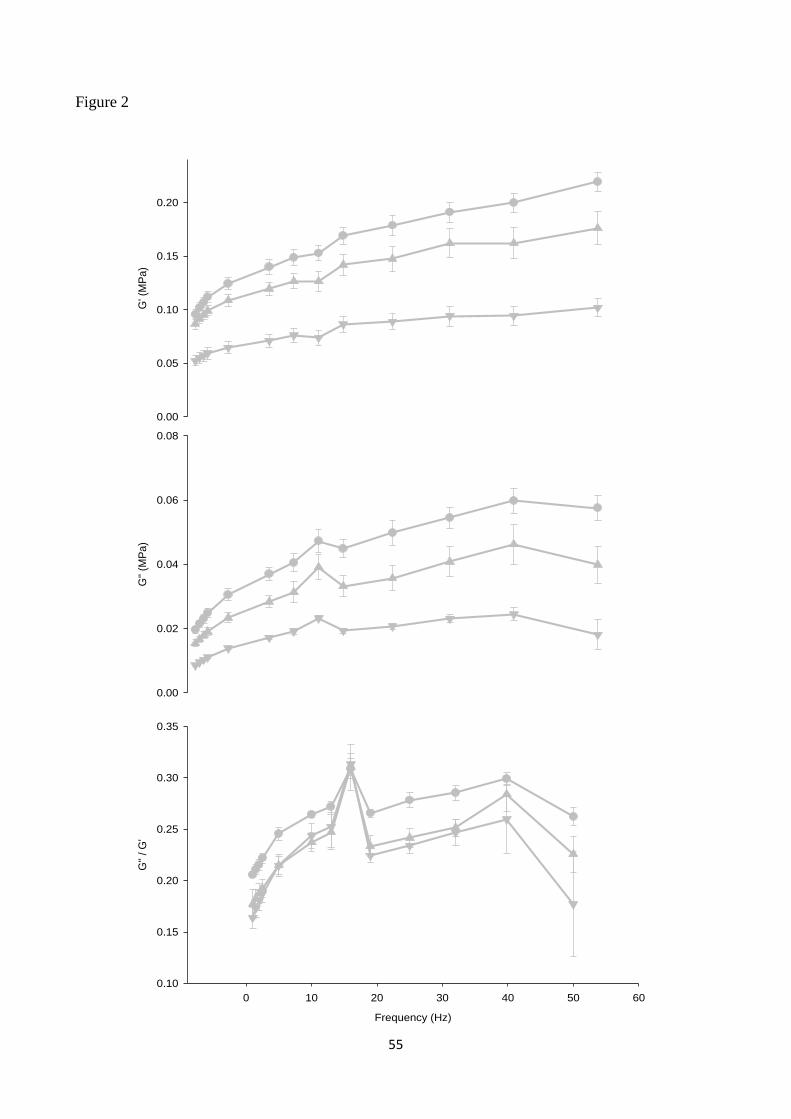
A representative graphs of storage and loss moduli and tan delta is shown in Figure 2. Storage and
loss moduli significantly decreased with increasing cooking times. Damping (tanδ) also exhibited
changes due to the cooking time, but not in relevant manner as it was observed in storage and loss
moduli. All viscoelastic properties significantly increased with increasing frequency in all samples.
Similar results were observed in noodles, analysed using a dynamic rheometer (Edwards et al.,
1993). Confronting both standards, STD1 exhibited higher ability to store energy (G’) than STD2 at
Page 48
40
all cooking times and at all frequency. About the enriched pasta, the storage modulus of V was
significantly higher than W at all cooking times and at all frequency, except in the case of lower
frequency (up to 13 Hz), where both enriched pastas exhibited similar ability to store energy at
OCT. Whereas, GF pasta showed similar ability to store energy at all cooking times and at all
frequency. Formulation also affected pasta capacity to store energy (Figure 3), with STD1 having a
G’ significantly higher than enriched and GF pastas, while STD2 exhibited higher storage modulus
than both GF pasta, but comparable to enriched pastas.
Maximum stress at break, measured with the stress/strain test, significantly decreased with
increasing cooking time in all pastas, as expected. The maximum stress at break was significantly
higher in STD1 than STD2 at all cooking times. Regarding the enriched pasta, V showed higher
maximum stress at break than W at OCT-3 and OCT+3, but comparable at OCT GF pastas required
the maximum stress to brake when overcooked, but GF2 was more difficult to brake when
undercooked and al dente. Formulation also played an important role in determining samples
capacity to deform under stress. STD1 was always more resistant at breakage than all other
samples, (STD1 and enriched and GF pastas) at all cooking conditions. STD2 was comparable to W
and higher than V in al dente and overcooked pastas, but it was lower than V and higher than W in
undercooked samples. The maximum stress required to brake STD2 was higher than GF1 at all
cooking times, but it was similar to GF2 at OCT, while STD2 exhibited higher and lower maximum
stress than GF2 in overcooked and undercooked pasta, respectively.
Viscoelastic properties of pasta were, therefore, significantly affected, as expected, by the cooking
time but formulation also played an important role. In fact the linear correlation between hardness
vs storage modulus and hardness vs maximum stress at break was investigated, excluding GF2
from the fitting, due to its incongruent changes in the structure during cooking, as it was illustrated
before in hardness paragraph. A strong correlation (r2 > 0.87 ) between hardness and maximum
stress was observed at all cooking times while the relationship between storage modulus and
Page 49
41
hardness values was r2 > 0.90 at all cooking times. A strong correlation was also observed between
the stress maximum at break and storage modulus, which resulted more relevant in al dente and
undercooked pasta, with r2 = 0.99 while r
2 was = 0.92 in overcooked pasta. It was reported a strong
correlation (r2 > 0.87) (Edwards et al., 1993) between the Instron and Rheometer measurements at
both optimal cooking time and in overcooked samples. It might be concluded that the small strain
rheological determination might allow to investigate changes that are related to macroscopic pasta
texture. Thus the ability to store energy was strictly correlated to the product structure, and the
evaluation of viscoelastic properties using DMA might be an alternative way to distinguish pasta
products quality after cooking.
3.1 Water status
Moisture content of pasta samples considered in this study were reported in Table 2. Moisture
content significantly increased with increasing cooking time in all samples, as expected, with the
exception of GF1 where OCT and overcooked pastas had comparable moisture content. STD2 and
W showed higher moisture content at all cooking time than STD1 and V, respectively, while GF
pastas showed similar moisture content at OCT-3 and OCT, but at OCT+3, GF1 moisture content
was higher than GF2. The formulation also affected pasta water absorption during cooking. At
optimal cooking time, STD1 exhibited lower moisture content than W and V, while the moisture
content of STD2 was significantly higher than V but similar as W. Comparing to the GF pastas,
STD2 moisture content was higher than GF2 but similar to as GF1, while STD1 exhibited lower
moisture content than GF1 but similar as GF2. Therefore to reach the same moisture content
samples must be cooked at different cooking time. In fact STD1, STD2, W, V, GF1 and GF2 was
cooked at 12, 11, 13, 9, 13 and 11minutes to reach similar moisture content (≈ 48%, g water / 100 g
product).
Thermo-gravimentric analysis allowed to investigate the water evaporation profile at increasing
temperature for all samples (Figure 4). Water was found to follow a bimodal evaporation pattern,
Page 50
42
with about 75% of water molecules evaporating at lower temperature (44.5 ±1.5 to 48.8 ± 2.6 °C
range), and the remaining 25% at higher temperatures (102.3 ± 5.0 to 11.8 ± 5.9 °C). A comparable
water evaporation profile was found in all samples, indicating that this water status indicator was
not affected by the formulation nor by the cooking time. The lower temperature evaporating water
population might be correlated to the free water into the pasta matrix, while the higher temperature
evaporating water population to the tightly bounded water. Previously Fessas & Schiraldi, (2001)
related the higher temperature evaporating water population to water tightly bound to the gluten
network, but considering that GF pasta had an evaporating profile comparable to the other samples
and that GF pasta did not contain gluten, this hypothesis may not be true in these samples. The
more tightly water in GF pasta might be correlated to proteins presented into the sample, which are
different than gluten but still bound (and release) water in a similar way and, therefore, confer the
product a similar macroscopic structure. Thus the more tightly water might be attributed to the
proteins undistinguishably.
Normalized frozen water was found to increase with increasing cooking time and, consequently,
moisture content in all samples (Table 2), as expected. STD2 and W exhibited higher frozen water
content at all cooking times than STD1 and V, respectively, while GF pastas showed different
frozen water content, GF1 lower than GF2, only at OCT-3 and OCT, but similar at OCT+3. For
standards and enriched pasta, the changes trend in frozen water content during cooking was similar
to that occurred in moisture content, while for GF pasta it was different. Formulation was also
influencing frozen water content: STD1 exhibited lower frozen water content than enriched pasta
(W and V), while STD2 showed lower frozen water than W, but similar as V. Concerning GF
pastas, STD1 exhibited higher frozen water than GF2 but lower than GF1, while frozen water of
STD2 was significantly higher than all GF pastas. Similar trend in frozen water was observed in
both undercook and overcook, except in the case of both standards, where changes were observed at
under and overcook. The changes in frozen water in gluten free pasta, which exhibited similar
moisture content, might be correlated to formulation.
Page 51
43
At the same moisture content, STD1 and STD2 exhibited similar frozen water, which resulted to be
significantly lower than those observed in enriched pasta (W and V), but similar to gluten free
pastas.
Proton Nuclear Magnetic Resonance mobility (1H NMR)
Two population of protons and the corresponding relaxation time were obtained with the fitting of
FIDs curves. The populations, named population A and B, and the corresponding relaxation times,
TA and TB, respectively, are showed in Table 3. With increasing cooking time an increase in the
molecular mobility was observed in the samples, with a significant decrease of the amount of the
more rigid protons (population A) and a consequent increased of population B. This might be
correlated to the alteration of the protein-starch network which increased with increasing cooking
time conferring to the sample less rigidity. STD1 and GF2 exhibited high percentage of more rigid
proton at all cooking times than STD2 and GF1, respectively, while enriched pasta showed
difference in more rigid proton only in overcooked pasta, where population A was significantly
higher in W than V. Proton mobility was also affected by the formulation of pasta at all cooking
times, as compared to the standards (Table 3). In effect, STD1 exhibited higher percentage of the
more rigid protons than enriched and GF pastas at all cooking time, except in the case of GF2
which exhibited higher value of more rigid protons than STD1 in overcooked pasta. STD2 showed
lower values of more rigid protons than that observed in enriched and GF pastas at all cooking time,
except in undercooked pasta, where STD1 showed higher value of more rigid protons than enriched
pasta, but similar value as GF1 and lower than GF2. At the same moisture content, both standards
had similar population A as W and GF2, which resulted to be significantly higher than V and GF1,
but GF1 was the lowest.
The more rigid protons was reported to be about 14% in pasta cooked for 10 minutes (Curti et al.,
2015), while for STD2, cooked for 11 minutes, the more rigid protons value was about 17%. This
difference might be correlated not to the product quality but to the fact that different semolina at
Page 52
44
different period of analysis. Thus the highest value, 24%, of more rigid proton in STD1, might be
associated to less disintegration into proteins-starch network, which might reduce proton mobility.
Concerning the relaxation time, TA was about 0.015 ms in all samples and it was not affected
neither by the cooking time nor by the formulation. In contrary, TB significantly increased with
increasing cooking time in all samples. STD2 and GF1 exhibited higher TB at all cooking times
than STD1 and GF2, respectively, while the changes in enriched pasta were not clear. TB was also
affected by the formulation at all cooking time. In fact, STD1 exhibited lower TB than enriched and
GF pastas at all cooking times, while STD2 had similar TB as enriched pastas at all cooking time,
but comparing to the GF pasta, TB of STD2 was lower than GF1 and similar as GF2 in all cooked
pasta. At the similar moisture content, TA was not affected by the formulation, while TB of both
STD was the lower than the rest of samples. GF1 exhibited the highest TB followed by GF2 and V
then by W.
1HT2 distributions of cooked pasta with different formulation were carried out using UpenWin
software. Three unsolved 1H populations were observed, except in the case of GF2 where the
populations were well solved (Figure 6). Proton distribution was strongly affected by the
formulation. In effect proton distribution was more evidently defined in STD2 than STD1, where an
overlapped population was observed, indicating an eventual proton exchange among the different
domains. V and GF1 proton distribution was similar as STD2, but GF2 showed the more
distinguished populations, defining its appertaining to a specific domain, and reducing that proton
exchange. W and GF1 exhibited similar proton distribution as STD1.
To define the quantity and the relaxation times of proton appertaining to the specific domain, three
exponentials model (Curti et al., 2015) was used to fit the 1H T2 curves. The proton populations
were named population C, D and E, while their corresponding relaxation times were named T2C,
T2D and T2E, respectively. The proton intensity of the more abundant and more mobile proton,
population E, of all samples was showed in Figure 7A. Cooking time induced changes in the more
abundant and more mobile population, which significantly increased with increasing cooking time
Page 53
45
in all samples, except in the case of V where changes in population E were observed in overcooked
pasta.
Considering different groups of pasta, STD2 showed the more represented population E than STD1
at all cooking times, confirming the less disintegration of gluten structure during cooking. GF pasta
exhibited similar value of population E in all cooked pasta, suggesting that disintegration in these
pastas structure, meanly starch network, occurred in the same manner in both pasta. Whereas in
reached pasta, population E value was higher in V than W in undercooked pasta, but W showed
higher value at OCT and OCT+3, suggesting a strong disintegration of gluten network in W.
The more abundant and more mobile population was affected by the formulation. In effect the
more mobile and more abundant population of STD1 resulted to be significantly lower than
enriched and GF pastas at all cooking times. STD2 exhibited lower and higher population E than W
and V, respectively, at OCT and OCT+3, but it was lower than V and similar as W in undercooked
pasta; while it resulted to be lower than both Gf pastas in undercooked pasta and similar as both GF
pasta in OCT and overcooked pasta. The other populations (data not shown) exhibited changes due
to pasta formulation and cooking times. At the same moisture content, both standards and GF2 had
the same percentage of the more abundant and more mobile proton, which was higher than V but
lower than GF1 and W.
The corresponding relaxation times were affected by the formulation and cooking time. The
relaxation time of population E, T2E, increased with increasing cooking time in all samples (Figure
7B). STD1 and GF2 exhibited lower relaxation time than STD2 and GF1, respectively, while T2E
of W was higher and lower than V, at OCT-3 and OCT+3, respectively, but similar to V at optimal
cooking time. Concerning the formulation effect, STD1 exhibited lower relaxation time than
enriched pastas at OCT and OCT+3, but similar to W and higher then V in undercooked pasta
while it resulted to be higher than GF pastas relaxation time at all cooking times. In other hands,
STD2 relaxation time was significantly higher than enriched and GF pastas at all cooking times.
Page 54
46
The changes in proton mobility induced by cooking might correlated to the changes into gluten
network, which slowly loses it rigidity becoming more elastic, conferring to the proton high
mobility. The difference observed into T2E of standards pasta might be in part correlated to the
different moisture content, which resulted to be lower in STD1 conferring it the more rigid
structure, and this might affect the proton mobility. In effect changes population E were strongly
correlated (R2 = 0.94) to the sample moisture content only at optimal cooking time, suggesting that
a perfect starch gelatinization and proteins coagulation was reached. However changes into pasta
structure was not related only to the absorbed water during cooking but also to the quality of gluten
network, which disintegration rate affects the proton mobility. The more changes in enriched pasta
compared to STDs might be correlated to the presence of fiber and bran, in V and W, respectively
which alter the pasta structure. The strong difference W compared to V, might be correlated to the
presence of bran which boosted the disintegration of the protein network. Tudorica et al., (2002),
observed Scanning Electron Microscopy micrograph of cooked pasta and they reported that the
addition of pea fiber into pasta formulation disrupted the starch-protein-fiber network altering pasta
structure. The strong changes in proton mobility of GF pasta compared to STDs might be correlated
to the fact that only starch network was formed in these pastas. Thus the swelling of starch network,
due to the gelatinization, significantly increases the rigidity losing in these samples.
Page 55
47
4-Conclusions
The effect of formulation and three different cooking time on cooked pasta was explored using
sophisticated methods. The increasing of cooking time affected all parameters: moisture content,
frozen water content and protons molecular mobility indicators increased with increasing cooking
time, while hardness sand mechanical properties significantly decreased with increasing cooking
time. Only the evaporated water profile, amount and temperature, was not affected by cooking time
nor by formulation. Pasta formulation significantly affected the investigated parameters. STD1
exhibited the highest quality compared to STD2 and all the samples. STD2 exhibited lower texture
quality at all cooking time compared to V and GF2. However changes in GF2 were stronger than
STD2. GF1 and W resulted to be the worst pasta. In this study a strong correlation between the
Texture Analyzer and Dynamic Mechanical Analyzer measurements was also observed, suggesting
that small deformation analysis might be used to explore the changes into the cooked pasta quality.
These results confirmed that the quality of cooked pasta strongly depends to the quality of dry
pasta and cooking time. Suggesting that to obtain the best quality cooked pasta, as fresh and RTE
pasta, it might be necessary to investigate the effect of formulation on the quality of that pasta, as
changes in physico-chemical, mechanical properties and water status. They also suggested that
sophisticated methods might be used to explore the quality of cooked pasta.
Page 56
48
5- References
Carini, E., Curti, E., Minucciani, M., Antoniazzi, F., & Vittadini, E. (2013). Pasta. In Guine, R. D.
P. F., & dos Reis Correia, P. M. (Eds.). Engineering Aspects of Cereal and Cereal-based Products.
CRC Press. Chapter 10: "Pasta", pp: 211-238.
Chillo, S., Iannetti, M., Civica, V., Suriano, N., Mastromatteo, M., & Del Nobile, M. A. (2009). A
study of the relationship between the mechanical properties and the sensorial optimal cooking time
of spaghetti. Journal of food engineering, 94(3), 222-226.
Cubadda, R. E., Carcea, M., Marconi, E., & Trivisonno, M. C. (2007). Influence of gluten proteins
and drying temperature on the cooking quality of durum wheat pasta. Cereal Chemistry, 84(1), 48-
55.
Curti, E., Carini, E., Diantom, A., Cassotta, F., Najm, N. E. O., D’Alessandro, A., & Vittadini, E.
(2015). Effect of Glycerol and Gluten on Mechanical Properties and 1H NMR Mobility of Cooked
Pasta. Food Biophysics, 10(4), 474-480.
D'Egidio, M. G., Mariani, B. M., Nardi, S., Novaro, P., & Cubadda, R. (1990). Chemical and
technological variables and their relationships: a predictive equation for pasta cooking quality.
Cereal Chemistry, 67(3), 275-281.
Del Nobile, M.A., Baiano, A. Contea, A., & Moccic, G. (2005). Influence of protein content on
spaghetti cooking quality. Journal of Cereal Science 41, 347–356
Edwards, N. M., Izydorczyk, M. S., Dexter, J. E., & Biliaderis, C. G. (1993). Cooked pasta texture:
comparison of dynamic viscoelastic properties to instrumental assessment of firmness. Cereal
Chemistry, 70, 122-122.
Fessas, D., & Schiraldi, A. (2001). Water properties in wheat flour dough I: classical
thermogravimetry approach. Food Chemistry, 72(2), 237-244.
Grant, L. A., Dick, J. W., & Shelton, D. R. (1993). Effects of drying temperature, starch damage,
sprouting, and additives on spaghetti quality characteristics. Cereal Chemistry, 70(6), 676-684.
Page 57
49
Grzybowski, R. A., & Donnelly, B. J. (1979). Cooking properties of spaghetti: factors affecting
cooking quality. Journal of Agricultural and Food Chemistry, 27(2), 380-384.
Kordonowy, R. K., & Youngs, V. L. (1985). Utilization of durum bran and its effect on spaghetti.
Cereal Chemistry, 62(4), 301-308.
Le Grand, F., Cambert, M., & Mariette, F. (2007). NMR signal analysis to characterize solid,
aqueous, and lipid phases in baked cakes. Journal of Agriculture and Food Chemistry, 55, 10947–
10952.
Manser, J. (1981). Optimale parameter fu¨ r die teigwarenherstellung am beispiel von langwaren.
Getreide Mehl Brot, 35(3), 75–83.
Marti, A., & Pagani, M. A. (2013). What can play the role of gluten in gluten free pasta? Trends in
Food Science & Technology, 31(1), 63–71.
Matsuo, R. R., & Irvine, G. N. (1970). Effect of gluten on the cooking quality of spaghetti. Cereal
chemistry.
Matsuo, R. R., Bradley, J. W., & Irvine, G. N. (1972). Effect of protein content on the cooking
quality of spaghetti. Cereal Chemistry, 49, 707-711
Matveef, M. (1966). Influence du gluten des bles durs sur la valeur des pâtes alimentaires. Bull.
ENSMIC, 213, 133-138.
Menard, K. P. (2008). Dynamic mechanical analysis: a practical introduction. CRC press.
Raina, C. S., Singh, S., Bawa, A. S., & Saxena, D. C. (2005). Textural characteristics of pasta made
from rice flour supplemented with proteins and hydrocolloids. Journal of texture studies, 36(4),
402-420.
Resmini, P., & Pagani, M. A. (1983). Ultrastructure Studies of Pasta. A Review. Journal of Food
Structure, 2(1), 2.
Takhar, P. S., Kulkarni, M. V., & Huber, K. (2006). dynamic viscoelastic properties of pasta as a
function of temperature and water content*. Journal of texture studies, 37(6), 696-710.
Page 58
50
Tudorica, C. M., Kuri, V., & Brennan, C. S. (2002). Nutritional and physicochemical characteristics
of dietary fiber enriched pasta. Journal of Agricultural and Food Chemistry, 50(2), 347-356.
Walsh, D. E., & Gilles, K. A. (1971). Influence of protein composition on spaghetti quality. Cereal
chemistry, 48, 544-554.
Manthey, F. A. & Schorono, L. A. (2002). Physical and Cooking Quality of Spaghetti Made from
Whole Wheat Durum, Cereal Chemistry, 79(4), 504-510.
De Stefanis, E., and Sgrulletta, D. 1993. Effects of high temperature drying on technological
properties of pasta. J. Cereal Sci. 12:97-104.
Manser, J. 1980. High temperature drying of pasta products. Buhler Diagram. 69:11-12.
Dexter, J. E., Matsuo, R. R., and Morgan, B. C. 1981. High temperature drying: Effects on spaghetti
properties. J. Food Sci. 46:1741-1746.
Page 59
51
Table 1
Chemical composition of different pasta used in this study. The composition is based on 56 g of
pasta as reported on product packaging.
Fat (g) Carbohydrate (g) Protein (g)
STD1 1 41 (2) 7
STD2 1 42 ( 2) 7
V 1 41 (2) 8
W 1.5 39 (6) 8
GF1 1 44 (1) 4
GF2 1.5 44 (2) 4
Page 60
52
Table 2
Physico-chemical properties of cooked pasta with different formulations at different cooking time:
MC (Moisture Content), FW (Frozen Water), Hardness, and stress maximum at break. Standard
deviations are given in parenthesis following the means values; small letters indicate the differences
in the same samples at different cooking time; capital letters indicate differences among the samples
at equal cooking time; "a" and “A” letters were assigned to the highest mean.
Cooking
times
(minute)
Moisture content
(%, g H20/100 g
sample)
Frozen water
(%, g H2O / g
H2O)
Hardness
(N)
Maximum
stress at break
(MPa)
STD1
OCT-3
OCT
OCT+3
6
9
12
39.35 (0.64) c/B
42.72(0.10) b/D
48.63(0.89) a/DE
33.79 (0.44) c/C
37.37 (0.08) b/D
43.24 (0.59) a/C
18.99 (0.59) a/B
13.89 (0.44)
b/A
11.83(0.44) c/A
0.27(0.01) a/A
0.25(0.01) b/A
0.22(0.01) c/A
STD2
OCT-3
OCT
OCT+3
8
11
14
42.97(0.53) c/A
48.97(0.90) b/AB
52.31(0.80) a/B
35.18 (0.04) c/B
42.19 (0.36) b/B
48.32(0.25) a/B
10.13(0.22) a/D
8.66(0.33) b/D
7.62(0.30) c/C
0.15(0.01) a/D
0.12(0.01) b/B
0.11(0.01) c/B
V
OCT-3
OCT
OCT+3
7
10
13
39.38(0.53) c/B
46.29(0.66) b/C
50.09(0.64) a/CD
33.92 (0.13) c/C
41.48 (0.66) b/B
47.04 (0.33) a/B
12.56(0.57)a/C
9.27(0.24) b/C
8.56(0.29) c/B
0.16(0.01)a/C
0.12(0.01) b/C
0.10(0.01) c/C
W
OCT-3
OCT
OCT+3
6
9
12
42.41 (0.98) c/A
50.14 (0.59) b/A
56.71 (0.94) a/A
39.36 (0.15) c/A
47.89 (0.44) b/A
51.51 (0.11) a/A
7.57(0.30) a/E
6.30(0.29) b/E
5.54(0.26) c/D
0.12(0.01) a/E
0.12(0.01)
b/BC
0.09(0.01) c/D
GF1
OCT-3
OCT
OCT+3
7
10
13
37.12(0.49) b/C
46.90(0.91) a/BC
47.18(0.89) a/E
25.68 (0.57) c/E
35.87 (0.21) b/E
43.47 (0.68) a/C
9.30(0.47) a/F
5.38(0.18) b/F
5.02(0.27) c/E
0.12(0.01) a/E
0.07(0.01) b/D
0.06(0.01) c/E
GF2
OCT-3
OCT
OCT+3
5
8
11
36.58(1.03) c/C
44.66(0.52) b/CD
50.81(0.27) a/BC
28.77 (0.34) c/D
39.66 (0.53) b/C
44.57 (0.40) a/C
20.51(0.74) a/A
10.99(0.36) b/B
7.41(0.38) c/C
0.24(0.01) a/B
0.12(0.01) b/B
0.06(0.01) c/E
Page 61
53
Table 3
1H FID populations and corresponding relaxation times. Standard deviations are given in
parenthesis following the means values; different letters close to numbers indicate significant
difference among samples (p ≤ 0.05), small letters indicate the differences in the same samples at
different cooking time; capital letters indicate differences among the samples at equal cooking time;
"a" and “A” letters were assigned to the highest mean
Population A (%) T A (ms) Population B (%) T B (ms)
STD1
OCT-3
OCT
OCT+3
29.59 (0.14) a/A
24.03(0.20) b/A
17.54(0.29) c/B
0.015 (0.001) a/A
0.015 (0.001) a/A
0.015 (0.001) a/A
70.41(0.14) c/D
75.97(0.20) b/C
82.46(0.29) a/C
0.47(0.01) c/C
0.49(0.01) b/D
0.54(0.01) a/D
STD2
OCT-3
OCT
OCT+3
23.85 (1.03) a/C
17.42(0.54) b/E
13.65(0.38) c/E
0.015 (0.001) a/A
0.015 (0.001) a/AB
0.015 (0.001) a/A
76.15(1.03) c/B
82.58(0.54) b/B
86.35(0.38) a/A
0.52(0.02) c/B
0.56(0.02) b/C
0.67(0.02) a/B
V
OCT-3
OCT
OCT+3
20.48(1.17) a/D
16.79(0.57) b/D
13.72(0.24) c/D
0.015 (0.001) a/A
0.015 (0.001) a/AB
0.014 (0.001) a/AB
79.52(1.17)c/A
83.21(0.57) b/A
86.28(0.24) a/A
0.52(0.01)c/B
0.57(0.01) b/C
0.66(0.01) a/B
W
OCT-3
OCT
OCT+3
21.36 (0.19) a/D
17.13(0.33) b/D
15.42 (0.16) c/C
0.014 (0.001) a/A
0.014 (0.001) a/B
0.013 (0.001) a/B
78.64(0.19) c/A
82.87(0.33) b/AB
84.58(0.16) a/C
0.51(0.01) c/B
0.60(0.02) b/B
0.63(0.02) a/C
GF1
OCT-3
OCT
OCT+3
24.36 (0.15) a/C
19.38(0.18) b/C
15.64(0.58) c/C
0.015 (0.001) a/A
0.015 (0.001) b/B
0.015 (0.001) a/C
75.64(0.15) c/B
80.62(0.18) b/D
84.36(0.58) a/D
0.57(0.02) c/A
0.62(0.02) b/A
0.71(0.03) a/A
GF2
OCT-3
OCT
OCT+3
27.18(0.37) a/B
21.82(0.15) b/B
18.09(0.36) c/A
0.015 (0.001) a/A
0.014 (0.001) ab/BC
0.014 (0.001) b/C
72.82(0.37) c/C
78.18(0.15) b/D
81.91(0.36) a/C
0.46(0.01) c/C
0.55(0.01) b/C
0.64(0.03) a/BC
Page 62
54
Figure 1
y = 0.0115x + 0.025
R² = 0.939 0
0.05
0.1
0.15
0.2
0.25
0.3
G'
(MP
a)
OCT-3 A
y = 0.0172x - 0.0225
R² = 0.7468 0
0.05
0.1
0.15
0.2
0.25
0.3
G'
(MP
a)
OCT
y = 0.0217x - 0.0588
R² = 0.7733 0
0.05
0.1
0.15
0.2
0.25
0.3
0.00 5.00 10.00 15.00 20.00
G'
(Mp
a)
Hardness (N)
OCT+3
y = 0.0052x - 0.0068
R² = 0.9149 0
0.02
0.04
0.06
0.08
0.1
0.12
Ma
xim
um
str
ess
(MP
a)
OCT-3 B
y = 0.0077x - 0.0265
R² = 0.9029 0
0.02
0.04
0.06
0.08
0.1
0.12
Maxim
um
str
ess
(MP
a)
OCT
y = 0.0052x - 0.0101
R² = 0.9729 0
0.02
0.04
0.06
0.08
0.1
0.12
0.00 5.00 10.00 15.00 20.00
maxim
um
str
ess
(MP
a)
Hardness (N)
OCT+3
Page 63
55
Figure 2
G' (
MP
a)
0.00
0.05
0.10
0.15
0.20
G''
(MP
a)
0.00
0.02
0.04
0.06
0.08
Frequency (Hz)
0 10 20 30 40 50 60
G''
/ G
'
0.10
0.15
0.20
0.25
0.30
0.35
Page 64
56
Figure 3
A
C
B
G' (
MP
a)
0.00
0.05
0.10
0.15
0.20G
'' (M
Pa
)
0.00
0.01
0.02
0.03
0.04
0.05
0.06
Frequency (Hz)
0 10 20 30 40 50
G''
/ G
'
0.0
0.2
0.4
0.6
0.8
1.0
1.2
1.4
Page 65
57
Figure 4
Temperature (°C)
20 40 60 80 100 120 140
% / °
C
0.0
0.1
0.2
0.3
0.4
0.5
0.6
0.7
Page 66
58
Figure 5
Times (ms)
0.01 0.1 1 10 100
GF2
GF1
W
V
STD2
STD1
Page 67
59
Figure 6
Pro
ton inte
nsity
0
20
40
60
80
c/D
a/B
a/C
b/D
c/C
b/A
a/A
c/Ab/B
a/B
c/AB
b/BC
a/BCb/B
c/C
c/C
a/A
b/D
A
Samples
STD1 STD2 V W GF1 GF2
Tim
e (
ms)
0
10
20
30
40
50
OCT-3OCTOCT+3
b/B
c/C
a/A
b/B
c/B
b/B
a/B
c/D
b/D
a/C
c/E
b/E
a/D
b/A
c/A
a/C
a/A
c/C
B
Page 68
60
Figure captions
Figure 1
Relationship between hardness vs storage modulus (A) and hardness vs stress maximum at break
(B) of cooked pasta at different cooking time
Figure 2
Storage modulus (A), loss modulus (B) and tan delta (C) of cooked pasta (STD1) at different
cooking time, OCT-3 (circle), OCT (triangle up) and OCT+3 (triangle up).
Figure 3
Storage modulus (A), loss modulus (B) and tan delta (C) of cooked pasta with different formulation
at optimal cooking time: STD1 (circle), STD2 (square), V (star), W (triangle up), GF1 (triangle
down) and GF2 (cross).
Figure 4
Characteristic 1H T2 relaxation time distribution for cooked pasta
Figure 5
Characteristic 1H T2 relaxation time distribution for cooked pasta with different formulation at
optimal cooking time
Figure 6
1H T2 of the abundant and the more mobile population (A) and corresponding relaxation (B) of
cooked pasta with different formulation at different cooking time; different letters in the figure
indicate significant difference among samples (p ≤ 0.05), where the small letter referred the
difference due to the cooking time and the big one to the formulation; the "a" and “A” letters were
assigned to the highest value
Page 69
61
SECTION B
CHARACTERIZATION OF READY TO EAT (RTE) PASTA
Page 70
62
Diantom et al., Food Chemistry, (2016) 195:91-96 Doi:10.1016/j.foodchem.2015.04.026
Effect of water and gluten on physico-chemical properties and stability of ready to eat shelf-
stable pasta
Agoura Diantom1, Eleonora Carini
1*, Elena Curti
1,2, Fabrizio Cassotta
3, Alessandro D’Alessandro
3,
Elena Vittadini1
1 Department of Food Science, University of Parma, Parco Area Delle Scienze 47/a, 43124 Parma,
Italy
2 SITEIA.PARMA Interdepartmental Centre, University of Parma, Parco Area Delle Scienze 181/a,
43124, Parma, Italy
3 Barilla G & R F.lli S.p.A, Research Department, Via Mantova 166,43123 Parma, Italy
* Corresponding author: Eleonora Carini, Department of Food Science, University of Parma, Parco
Area delle Scienze 47/A 43124 Parma, Italy [email protected] ; Tel. +39 – 0521 – 906520,
Fax +39 – 0521 - 906028
Page 71
63
Abstract
A multi-analytical and multi-dimensional approach was used to investigate the effect of moisture
and gluten on physico-chemical properties of shelf-stable ready to eat (RTE) pasta.
Moisture and frozen water contents were not affected by formulation nor storage time. Hardness
and retrograded amylopectin significantly increased during storage in all samples, more markedly in
pasta with the lowest moisture content. Higher amounts of water and gluten reduced pasta
hardening and contributed to control RTE pasta quality. 1H FID became steeper in samples during
storage, more evidently in the sample with the lowest moisture content. Three proton T2 populations
were observed (population C, population D and population E). Population C and D were not
resolved during all storage. 1H T2 relaxation time of the most abundant population (population E)
shifted to shorter times and the amount of protons increased during storage, more importantly in the
samples with lower moisture and gluten content.
Keywords: shelf-stable pasta; gluten; physico-chemical properties; 1H NMR mobility
Page 72
64
1- Introduction
Ready to eat (RTE) meals are becoming popular among consumers due to their convenience and the
changes of eating habits. This trend is reflected by their significant market share (~10%) in recent
years. Among RTE meals, pasta meals are indeed the main category as they represent a very large
market segment, especially in Asia, Latin America, Middle and North Africa.
Pasta industry is introducing RTE pasta meals in the retail market in different storage conditions,
primarily frozen, refrigerated or shelf-stable products. RTE pasta meals are generally constituted by
a pasta phase and a sauce phase that may be in contact during storage or mixed only at time of
consumption. The physical contact (or lack of it) between pasta and sauce are expected to have a
key role on the dynamic interaction among meal components and the evolution of product’s quality
during storage.
To the authors’ best knowledge, only few scientific reports have focused on the characterization of
RTE pasta meals. Some works focused the attention on the changes occurring in the pasta phase
during storage. Olivera and Salvadori (2009, 2011) studied quality parameters of cooked tagliatelle
during frozen storage (up to 12 months) and the effect of freezing on tagliatelle properties. They
reported a decrease of moisture content during the first 4 months and of hardness (first 2 months),
that then remained almost constant during the rest of storage, and concluded that freezing had a
negative effect on pasta structure. Carini, Curti, Cassotta, Najm and Vittadini (2014) focused their
work on shelf-stable RTE pasta during 2 months of storage and reported an increase in pasta
hardness and retrograded amylopectin as well as an increased molecular rigidity as measured by 1H
NMR (increased 1H FID steepness and decreased
1H T2 relaxation times).
Other works investigated physico-chemical changes on RTE pasta meals in presence of sauce.
Olivera and Salvadori (2012) observed decreased pasta hardness and increased moisture content in
refrigerated lasagna (pasta with sauce) over 8 days storage. Carini, Curti, Littardi, Luzzini and
Vittadini (2013) investigated water status in shelf-stable pasta meals with a tomato based sauce
during 34 days of storage, and reported pasta softening and water migration between pasta and
Page 73
65
sauce phases detected only at a molecular level (1H T1 and T2), while moisture content and water
activity did not reveal a macroscopic water migration between the pasta and sauce phases. The
properties of the sauce should, also be carefully considered when used in a multiphasic meal (e.g.
pasta and sauce).
A recent paper (Carini, Mora, Curti, Luzzini, & Vittadini, in press) has focused the attention on the
sauce phase evaluating the effect of different ingredients commonly used in industrial settings on
the status of water in the systems indicating that, for example, sauce thickening induced by flour or
gelatin addition corresponded to very different NMR molecular mobilities.
Water and water dynamics are indeed a key factor in defining RTE meals quality and stability and a
good understanding of the relation of water status indicators with product’s composition, quality
and stability is still a big challenge for food technologists.
In this work the effect of moisture content and gluten addition into RTE shelf-stable pasta was
evaluated, during storage, in terms of physico-chemical properties and water status.
2- Materials and methods
2.1. Ready to eat shelf stable pasta production
Dry pasta (penne shaped) was produced by a local pasta maker using a standard formulation
(semolina and water, STD) and was cooked into boiling water (pasta/water ratio 1:10) to reach 56%
moisture (g H2O / 100 g product, control sample, STD-56). Pilot plant trials were carried out to
optimize the moisture content and gluten level to have a high quality product and the optimal
conditions were defined as 59% moisture and 15%, semolina substitution, dry mass. Dry gluten
enriched (15%) pasta was produced and cooked into boiling water to 59% moisture (g H2O / 100 g
product, GLU-59). A standard formulation pasta sample was also cooked to 59% moisture (STD-
59). About 60 g of cooked pastas were packed into multi-layer (polypropylene-PP, polyethylene
terephthalate-PET, and polyamide-PA) pouches and sterilized in autoclave (F0 ≥7) to obtain ready
to eat shelf-stable pasta (RTE pasta). RTE pasta pouches were then kept at 22.5°C for 63 days, and
Page 74
66
analyzed within 24 hours from production (day 0) and after 3, 7, 10, 21, 28, 35, 42, 49 and 63 days
of storage.
STD-56 sample was beforehand characterized and the results are included in previous study (Carini,
Curti, Cassotta, Najm, & Vittadini, 2014) but they were also presented in this paper to better study
the effect of water and gluten contents on physico-chemical properties of RTE pasta during storage.
2.2. Moisture content
Moisture content (MC, % g water /100 g product) of RTE pasta was determined by weight loss by
drying in a forced-air oven (ISCO NSV 9035, ISCO, Milan, Italy) at 105 °C to constant weight. At
least ten pasta pieces of each RTE pasta sample at each storage time were analyzed.
2.3. Texture
Pasta texture was measured using a TA.TX2 Texture Analyzer equipped with a 25 kg load cell
(Stable Micro systems, Goldalming, UK). Single pasta pieces were cut with a flat blade (speed of 2
mm/s; trigger force 0.1 N). The maximum height of the cutting peak was taken as “hardness”. A
small peak before the major peak was also observed in some samples, indicating a significant
breakage of the pasta piece along its main axes when touched by the cutting blade. This peak was
taken as evidence of pasta “fracturability ”. 15 pasta pieces for each sample at each storage time
were analyzed.
2.4. Thermal properties
Frozen water content and amylopectin melting were measured using a Differential Scanning
Calorimeter (DSC Q100, TA Instruments, New Castle, DE, USA) calibrated with indium (T =
156.6°C; H = 28.71 J/g) and mercury (T = -38.83°C, H = 11.40 J/g). About 5-10 mg of RTE pasta
were placed into hermetic stainless steel pans (Perkin Elmer, USA). Samples were heated from -
80°C to 100°C at 5 °C/min. DSC thermograms were analyzed using an Universal Analysis
Software, version 3.9A (TA Instruments, New Castle, DE).
“Frozen” water content (at the select experimental conditions; FW) was calculated from the
endothermic peak around 0 °C (ice melting) using the following equation:
Page 75
67
100*)1
(*)1
(*MCIceFusionLatentHeat
eFusionEnthalpyIcFW
Where FW is frozen water (%, g frozen water/g water), ice fusion enthalpy (J/g product), latent heat
of ice fusion is 334J/g ice, and MC is moisture content (g water/1 g product).
The occurrence of an endothermic peak in the 50-80 °C range was taken as recrystallized
amylopectin melting. Enthalpy of this peak was measured (J/g product) and normalized to the
grams of starch of the sample (J/g starch). At least triplicated samples of each product were
analyzed at each storage time.
2.5. Proton Nuclear Magnetic Resonance mobility (1H NMR)
A low resolution (20MHz) 1H NMR spectrometer (the Minispec, Bruker Biospin, Milano, Italy)
operating at 25.0 ± 0.1°C was used to study proton molecular mobility by measuring the free
induction decay (FID) and transverse relaxation times (T2). About 2 g of RTE pasta were placed
into a 10 mm NMR tube that was then sealed with Parafilm®
to avoid moisture loss during the
NMR experiment. 1
H FIDs were acquired using a single 90° pulse, followed by a dwell time of 7
µs, a recycle delay of 3 s and a 10 ms acquisition window. 1H FIDs were analyzed in the time range
7 µs -100 µs where the homogeneity of magnetic field was assured. The curves were fitted with a
two components model (exponential and gaussian; Le Grand, Cambert, and Mariette, 2007;
Sigmaplot, v6, Systat Software Inc. USA):
])/(exp[*)/exp(*0)( 2
BA TtBTtAytf
where y0 is the FID decay offset, A and B are the intensities of each relaxation component, TA and
TB are the apparent relaxation times.
T2 relaxation time was measured with a CPMG pulse sequence with a recycle delay of 3 s (≥ 5
1H
T1), an interpulse spacing of 0.04 ms and 4000 data points. T2 curves were analyzed as quasi-
continuous distributions of relaxation times using a UPENWin software (Alma Mater Studiorum,
Bologna, Italy). Default values for all UPEN parameters were used with the exception of one
parameter (LoXtrap) that was set to 1 to avoid extrapolation of relaxation times shorter than the first
Page 76
68
experimental point. 1H T2 CPMG relaxation decays were also fitted with a discrete exponential
model (Sigmaplot, v.6, Systat Software Inc. USA).
2.5. Statistical analysis
Means and standard deviations (SD) were calculated with SPSS statistical software (Version 20,
IBM SPSS Inc., Chicago, IL, USA). Significant differences (p ≤ 0.05) among different samples
were verified with by one-way-analysis of variance (ANOVA) followed by least significant
difference test (LSD) at p ≤ 0.05.
3- Results and discussion
3.1 Moisture content and frozen water content
Moisture content (MC) of RTE pasta samples was found to be 56.5 ± 0.7% (g H2O / 100 g product)
in STD-56, 58.6 ± 0.9% in STD-59, and 59.0 ± 0.9% in GLU-59, confirming the achievement of the
desired moisture contents. About 77% (g frozen water/100 g water) of the total water present in
RTE pasta samples was measured to be frozen (FW) under the selected experimental conditions and
no significant changes were ascribable to the different composition of the products. Both MC and
FW did not significantly change during storage in all samples.
3.2. Texture
Hardness of RTE pasta during storage is shown in Figure 1a. Statistical significances are reported in
Table 1.
At day 0, STD-59 was softer than STD-56 and GLU-59 was harder than STD-59. All samples
became significantly harder with increasing storage time, as expected (Carini et al., 2014).
Nevertheless, the hardness increase during storage was formulation dependent. STD-56 hardness
increased very fast (from 9.9 to 17.3 N) up to 21 days of storage and then more gradually to the end
of storage (17.7 N at 63 days; Carini et al., 2014). On the contrary, hardness increase in STD-59
was steady throughout the entire storage time (from 9.1 N at day 0, to 12.8 N at days 63), and less
important than in STD-56. GLU-59 exhibited the lowest hardness increase (from 11.7 N, day 0, to
Page 77
69
13.8 N, days 63) among all samples and it could, therefore, be considered the sample with the best
texture retention during storage.
STD-56 was generally harder than STD-59 over storage, indicating that the higher moisture content
contributed to material plasticization/softening, and might have helped to control hardness increase
during storage. GLU-59 was significantly harder than STD-59 up to days 28, then no significant
differences were observed for the remaining of the storage. Large amounts of gluten in pasta
formulation (high gluten semolina) are known to harden cooked pasta texture (Cubadda, Carcea,
Marconi, & Trivisonno, 2007; Day, Augustin, Batey, & Wrigley, 2006). GLU-59 generally
exhibited hardness intermediate between STD-56 and STD-59 during storage, indicating that the
increased moisture content may have allowed for a better plasticization of the gluten network and
partially counteracted the hardening contribution of gluten to pasta texture. The higher softness of
GLU-59 than STD-56 suggested that the softening effect of moisture content was probably more
important than the hardening effect of gluten in determining hardness.
STD-56 exhibited fracturability (presence of a small peak in cut test trace) after 28 days of storage,
that was not observable in STD-59 and GLU-59 until the end of storage. These samples, therefore,
remained flexible and plastic during storage, probably due to their larger moisture (and gluten)
content that might have contributed to the maintenance of pasta texture over storage.
3.3. Retrograded amylopectin
At days 0, no amylopectin retrogradation (J/g sample) was found in all pasta samples, as expected,
due to the cooking and sterilization processes that allowed for a complete starch gelatinization in
the products. Retrograded amylopectin was detected in STD-56 and STD-59 after 3 days of storage
and, in GLU-59 only at 7 days of storage (Figure 1b). Retrograded amylopectin increased in all
samples during storage, more significantly in STD-56 than in the 59% moisture content samples.
STD-56 had significantly more retrograded amylopectin than STD-59 after 10 days, and also at day
63, probably due to its lower MC (Piazza & Masi, 1995). GLU-59 was, generally, less retrograded
than STD-59 (with the exception of day 28 and 42). GLU-59 also had significantly lower
Page 78
70
retrograded amylopectin than STD-56 after 10 days up to the end of storage. Chemical interactions
of gluten with starch may have prevented formations of crystals as previously reported (Kim &
D’Appolonia,1977; Martin, Zeleznak, & Hoseney, 1991). However the effect of gluten on
amylopectin retrogradation has not yet been clearly elucidated, as some studies, in model systems
and bread, reported that gluten enrichment have promoted (Curti et al., 2014) and had no effect
(Wang, 2004; Ottenhof and Farhat, 2004).
Higher moisture, more importantly, and gluten levels had, therefore, a reducing effect on
amylopectin retrogradation in RTE pasta during storage.
Amylopectin retrogradation enthalpy was plotted against hardness during storage, but only a weak
relationship was found (R2 of linear regression = 0.71 for STD-56, 0.91 for STD-59 and 0.70 for
GLU-59, data not showed) indicating that other factors in addition to amylopectin retrogradation
concurred to hardness increase.
3.4. Protons Nuclear Magnetic Resonance mobility (1H NMR)
Proton molecular mobility was studied using a low resolution 1H NMR spectrometer to investigate
the effect of formulation on pasta products at a molecular level. 1H FIDs (data not shown) had
comparable decay at day 0 and became progressively steeper during storage, indicating rigidity
increase in pasta samples. 1H FIDs were fit with a two components model (exponential and
Gaussian functions) to quantify the mobility of protons detected in this time-frame window. The
two proton populations were named population A and population B. In STD-56, the most rigid
population A relaxed at about 0.017 ms while population B at about 0.670 ms. In STD-59 and
GLU-59, relaxation times of population A and B were comparable to those found in STD-56 and
they were, respectively, 0.016 and 0.640 ms. Relaxation times did not significantly change during
storage in all samples. At day 0, population A was found to be ~16-17% of all detectable protons in
all samples. Population A increased in all samples during storage, up to 20-22%, with a consequent
decrease of population B, indicating an increase of system rigidity, mainly due to amylopectin
retrogradation (Fahrat, Ottenhof, Marie, & De Bezenac, 2003; Sereno, Hill, Mitchell, Scharf, &
Page 79
71
Farhat, 2007). The presence of higher moisture and gluten content in pasta product did not change
the mobility of the protons observed in this NMR time-frame window.
A representative 1H T2 distribution of pasta during storage, obtained with UpenWin, is showed in
Figure 2a for a fresh sample (STD-56) and indicated the presence of three proton populations. The
observed proton populations were not always resolved in all samples during storage, indicating an
important molecular exchange among the protons with relaxation times in the 0.1 to 10 ms range
(Figure 2b). A three exponential model was used to quantify proton populations’ mobilities. The
three 1H populations were named population C, population D and population E, from the more rigid
(shorter relaxation times) to the more mobile (longer relaxation times) protons, respectively (Table
2). Population C and population D relaxed at shorter times and represented the most rigid protons
detected in this NMR time-frame.
In fresh samples, population C, represented about 10-11% (comparable among samples) of the total
detectable protons and relaxed at 1.5 ms (T2C) in STD-56, and 0.7-0.8 ms in STD-59 and GLU-59.
Population D, represented about 11-12% (comparable among samples) and relaxed (T2D) at 13.5 ms
in STD-56 and 6-8 ms in STD-59 and GLU-59. Population E was the most abundant population in
all samples, and represented, at day 0, about 74, 76 and 78% of total protons for STD-56, STD-59
and GLU-59, respectively. 1H T2E relaxation times were ~39.6 ms, ~33.2 ms, and ~34.8 ms in STD-
56, STD-59, GLU-59, respectively. Generally, the three protons populations relaxed at slightly
higher relaxation times in STD-56 than in the 59% moisture samples. Population D (intermediate
mobility protons), was slightly more abundant, and population E (more mobile protons) slightly less
abundant in STD-56 than in the 59% moisture samples. No remarkable different molecular
mobilities were found among fresh RTE pasta samples that were, therefore, considered comparable.
1H T2 mobilities, on the contrary, evolved differently in the samples with different formulation
during storage. Population percentages and relaxation times of protons belonging to population C
and population D decreased during storage, more importantly in STD-56 than in STD-59 and GLU-
59 (Table 2). STD-56 showed a larger decrease than the 59% samples for protons abundance of
Page 80
72
population C (4% in STD-56 vs 2% in STD-59 and GLU-59) and D (8% in STD-56 vs 4% in STD-
59 and GLU-59). Similarly, T2D of STD-56 decreased of 7 ms vs 2-3 ms in STD-59 and GLU-59
during the 63 days of storage. Pop E, on the contrary, increased in the percentage of protons and
decreased in relaxation time in all samples during storage. STD-56 showed a larger increase in
population E (12% vs 5 and 8% in STD-59 and GLU-59, respectively) and a larger decrease of T2E
(10 ms vs 3 and 6 ms in STD-59 and GLU-59, respectively) among the samples considered. The
shortest relaxing 1H population (C) was tentatively related to rigid CH protons of amorphous starch
and gluten; the population D to some CH protons of gluten and exchanging protons to confined
water, starch, and gluten. Lastly, the predominant 1H T2 population (E) was tentatively related to
mobile exchanging protons of water, starch, and gluten present in the formed gel network
(Bosmans, Lagrain, Ooms, Fierens, & Delcour, 2013; Carini et al., 2014).
The decrease of T2E and the corresponding increase of protons abundance (population E) during
storage indicated changes in mobility within the amorphous gel network during storage. However, a
good linear relationship did not subsist between 1H T2E (and % population E) and hardness (data not
shown). On the contrary, Bosmans and colleagues (2013) correlated T2E with hardness in bread, but
the relationship was established with a limited number of data points (4) due to the short storage
time considered (7 days).
Overall the results of this study indicated that the 1H T2 molecular changes during storage were
more pronounced in STD-56 than in the 59% moisture samples. STD-56 retrograded and hardened
to a greater extent during storage. Both amylopectin retrogradation and water molecular
redistribution concurred to the hardening of RTE pasta during storage but the complexity of the
system did not allow for a complete comprehension of the mechanisms. Proper hydration/plasticity
of gluten could also be a key factor in preserving product’s structure. The presence of higher
moisture and/or gluten levels may have had a role in the softening of the macroscopic structure and
have mitigated the protons/water redistribution among starch and gluten domains at a molecular
level.
Page 81
73
4. Conclusions
The effect of moisture content and gluten addition into RTE shelf-stable pasta was studied during
63 days storage.
A higher moisture content of pasta resulted in softer samples and reduced amylopectin
retrogradation. Conversely, the presence of gluten in the sample with higher moisture level, resulted
in increased hardness and decreased amylopectin retrogradation. Molecular mobility measurements
showed that the most rigid protons (observed with 1H FID) were not affected neither by moisture
content nor gluten. Changes in molecular mobility were more clearly observed in the more mobile
domains (1H T2), where a more pronounced increase in rigidity was observed in the sample with
lower moisture and gluten content during storage.
It was concluded that, under the selected experimental conditions, properties of RTE pasta may be
positively modulated by changes in formulation. An increase of moisture level improved quality
and shelf-stability of RTE pasta and has to be taken in consideration when formulation of these
products are conceived. Moreover, high levels of gluten also showed a positive effect on the
physico-chemical properties evaluated and, for this reason, it should be considered, a key ingredient
in the formulation of these products.
5. Acknowledgements
This work was (partially) supported by Emilia-Romagna Region (POR FSE 2007-2013).
Page 82
74
6. References
Bosmans, G. M., Lagrain, B., Ooms, N., Fierens, E., & Delcour, J. A. (2013). Biopolymer
interactions, water dynamics, and bread crumb firming. Journal of agricultural and food
chemistry, 61(19), 4646-4654.
Callejo, M.J., Gill, M.J., Rodriguez, G., Ruiz, M.V (1999). Effect of gluten addition and storage
time on white pan bread quality, instrumental evaluation. European Food Research and
Technology, 208, 27–32.
Carini, E., Curti, E., Cassotta, F., Najm, N. E. O., & Vittadini, E. (2014). Physico-chemical
properties of ready to eat, shelf-stable pasta during storage. Food Chemistry, 144, 74-79.
Carini, E., Curti, E., Littardi, P., Luzzini, M., Vittadini, E. (2013). Water dynamics of ready to
eat shelf stable pasta meals during storage, Innovative Food and Emerging Technologies, 17,
163-168.
Carini E., Mora B., Curti E., Luzzini M., Vittadini E. (2014). Tomato sauce: effect of different
ingredients on 1H NMR mobility and physico-chemical properties, LWT-Food Science and
Technology, in press.
Cubadda, R., Carcea, M., Marconi, E., & Trivisonno, M. (2007). Influence of Gluten Proteins
and Drying Temperature on the Cooking Quality of Durum Wheat Pasta. Cereal Chemistry,
84(1), 48-55.
Curti, E., Carini, E., Tribuzio, G., & Vittadini, E. (2014). Bread staling: Effect of gluten on
physico-chemical properties and molecular mobility. LWT-Food Science and Technology, 59,
418–425.
Day, L., Augustin, M. A., Batey, I. L., & Wrigley, C. W. (2006) Wheat-gluten uses and industry
needs. Trends in Food Science and Technology, 17(2), 82-90.
Eliasson, A. C. (1983a). Differential Scanning Calorimetry studies on wheat starch gluten
mixtures. I. Effect of gluten on the gelatinization of wheat starch. Journal of Cereal Science, 1,
199-205.
Page 83
75
Eliasson, A.C. (1983b). Differential scanning calorimetry studies on wheat starch–gluten
mixtures. II. Effect of gluten and sodium stearoyl lactylate on starch crystallisation during
ageing of wheat starch gels. Journal of Cereal Science, 1, 207–213.
Every D., Gerrard J.A., Gilpin M.J., Ross M., Newberry M.P. (1998). Staling in starch bread,
the effect of gluten additions on specific loaf volume and firming rate. Starch-Stärke, 50, 443-
446.
Farhat, I.A., Ottenhof, M.A., Marie, V., & De Bezenac, E. (2003).
1H NMR relaxation study of
amylopectin retrogradation. In P.S. Belton, A.M. Gil, G.A. Webb, D. Rutledge (Eds), Magnetic
Resonance in food science: latest developments (pp. 172-179). UK: RSC Publishing.
Kim, S. K., & D'Appolonia, B. L. (1977). Bread Staling Studies. I. Effect of Protein Content on
Staling Rate and Bread Crumb Pasting Properties. Cereal Chemistry, 54, 207 – 215.
Le Grand, F. Cambert, M., Mariette, F. (2007) NMR signal analysis to characterize solid,
aqueous, and lipid phases in baked cakes. Journal of Agriculture and Food Chemistry, 55,
10947-10952.
Martin, M.L., Zeleznak K.J., & Hoseney R.C. (1991). A mechanism of bread firming. I. Role of
starch swelling. Cereal Chemistry, 68, 498-503.
Le Botlan, D., & Helie-Fourel, I. (1995). Assessment of the intermediate phase in milk fat by
low-resolution nuclear magnetic resonance. Analytica Chimica Acta, 311, 217-223.
McCarthy, K. L., Gonzalez, J. J., McCarthy, M. J. (2002). Change in Moisture distribution in
lasagna pasta post cooking, Journal of Food Science, 67, 1785-1789
Olivera, D.F., & Salvadori, V.O. (2009). Effect of freezing rate in textural and rheological
characteristics of frozen cooked organic pasta. Journal of Food Engineering, 90, 271-276.
Olivera, D.F., & Salvadori, V.O. (2011). Instrumental and sensory evaluation of cooked pasta
during frozen storage. International Journal of Food Science and Technology, 46, 1445–1454.
Olivera D.F., & Salvadori, V.O. (2012). Kinectic modeling of quality changes of chilled ready
to eat serve lasagna, Journal of Food Engineering, 110, 487-492.
Page 84
76
Piazza, L., & Masi, P. (1995). Moisture redistribution throughout the bread loaf during staling
and its effect on mechanical properties. Cereal Chemistry, 72, 320-325.
Sereno, N.M.,Hill, S.E., Mitchell, J.R., Scharf, U., & Farhat, I.A. (2007). Probing water
migration and mobility during the aging of bread. In: I.A. Farhat, P.S. Belton, G.A. Webb (Eds),
Magnetic Resonance in Food Science: From Molecules to Man (pp. 89-95). UK: RSC
Publishing.
Page 85
77
Table 1
Table 1: Statistical significance (LSD Test, t-test; p<0.05), for hardness and retrograded
amylopectin during storage1
Hardness Retrograded amylopectin
LSD Test T-test LSD Test T-test
days STD-56 STD-59 GLU-59 STD-56 STD-59 GLU-59
0 g f de (*) (*) (*) n.d. n.d. n.d. n.d.
3 f def e (*) (*) (*) d de n.d. (*)
7 e ef bcd (*) (*) (*) cd e de (-) (-) (*)
10 d de de (*) (*) (*) cd cd c (-) (-) (-)
14 d de cde (*) (*) (*) ab cde de (*) (*) (*)
21 c cd bc (*) (*) (*) bc c d (*) (*) (*)
28 c cd bc (*) (*) (*) ab c bc (*) (-) (*)
35 c abc b (*) (-) (*) ab b bc (*) (*) (*)
42 b abc b (*) (-) (*) ab b ab (-) (-) (*)
49 a ab b (*) (-) (*) abc b bc (-) (*) (*)
63 bc a a (*) (-) (*) a a a (*) (*) (*)
aLetters indicate significant differences among samples with the same formulation at different
storage times; T-test was carried out between samples with different MC (STD-56 and STD-59)
(indicated by the first symbol in brackets), gluten content (STD-59 and GLU-59) (indicated by the
second symbol in brackets), different MC and gluten content (STD-56 and GLU-59) (indicated by
the third symbol in brackets); stars indicate statistical difference; dashes indicate no statistical
difference.
Page 86
78
Table 2: Protons abundance (%) and relaxation times (ms) of T2 experiments at selected storage
times2
STD-56 STD-59 GLU-59
T2 T2 T2
days pop C pop D pop E pop C pop D pop E pop C pop D pop E
0 10.6
(0.5)
15.3
(1.2)
74.1
(0.8)
11.8
(0.8)
12.1
(0.5)
76.1
(0.7)
11.2
(0.8)
11.0
(0.3)
77.7
(0.7)
7 8.5
(0.8)
9.4
(0.5)
82.1
(0.5)
9.3
(0.7)
9.1
(0.3)
81.6
(0.7)
9.9
(0.6)
9.2
(0.6)
80.9
(0.3)
14 7.9
(0.5)
7.7
(0.3)
84.4
(0.5)
10.4
(0.9)
8.9
(0.4)
80.7
(1.2)
10.4
(0.8)
9.1
(0.2)
80.5
(0.8)
21 7.6
(0.7)
7.4
(0.6)
84.9
(0.5)
9.4
(0.5)
8.3
(0.3)
82.3
(0.5)
9.4
(0.4)
9.1
(0.2)
81.5
(0.4)
35 7.5
(0.8)
6.9
(0.5)
85.6
(0.6)
9.8
(0.6)
7.9
(0.5)
82.2
(0.9)
9.7
(0.6)
8.4
(0.2)
82.0
(0.5)
63 7.1
(0.4)
7.0
(0.5)
85.9
(0.5)
8.7
(0.5)
7.3
(0.5)
84.0
(0.9)
9.4
(0.6)
7.7
(0.4)
82.8
(0.8)
days T2C T2D T2E T2C T2D T2E T2C T2D
T2E
0 1.50
(0.15)
13.54
(0.15)
39.59
(1.39)
0.81
(0.07)
7.79
(0.49)
33.22
(0.17)
0.67
(0.07)
6.48
(0.58)
34.79
(0.35)
7 0.93
(0.12)
7.65
(0.15)
30.63
(0.45)
0.48
(0.08)
5.04
(0.38)
35.56
(0.13)
0.56
(0.10)
5.30
(0.08)
33.29
(0.59)
14 0.76
(0.09)
6.14
(0.15)
28.63
(0.48)
0.41
(0.07)
4.08
(0.32)
29.02
(0.29)
0.51
(0.09)
5.10
(0.44)
31.73
(0.11)
21 0.38
(0.10)
4.15
(0.15)
27.84
(0.54)
0.42
(0.05)
4.34
(0.35)
31.02
(0.32)
0.52
(0.08)
5.30
(0.41)
32.31
(0.15)
35 0.34
(0.13)
3.60
(0.57)
28.50
(1.00)
0.43
(0.07)
3.96
(0.32)
27.86
(0.41)
0.54
(0.06)
5.78
(0.23)
32.62
(0.27)
63 0.70
(0.13)
7.05
(2.01)
29.87
(1.21)
0.48
(0.10)
4.37
(0.34)
30.10
(0.55)
0.43
(0.07)
4.27
(0.29)
29.12
(0.37)
Page 89
81
Figure captions
Figure 1: (a) Hardness of STD-56 (gray triangle), STD-59 (black triangle) and GLU-59 (white
triangle) during storage; (b) Retrograded amylopectin of RTE pasta samples during storage.
Figure 2: (a) Characteristic 1H T2 relaxation time distribution for ready-to-eat shelf-stable pasta; (b)
Characteristic 1H T2 relaxation time distributions during storage.
Page 90
82
Diantom et al , to be submitted
Effect of glycerol and gluten on physico-chemical properties of ready to eat pasta during
storage
Page 91
83
Abstract
This work aims to investigate the effect of glycerol and gluten on physico-chemical properties of
ready to eat pasta at two levels of water (56% and 62%, g water /100 g product). Macroscopic
(moisture content, frozen water) and molecular (1H FID,
1H T2) water status indicators, rheological
properties and retrograded amylopectin content were measured to characterize the product with a
multi-analytical and multi-dimensional approach.
Neither glycerol nor gluten affected macroscopic waters status. Glycerol did not affect rheological
properties at both moisture contents, but it induced important modifications at a molecular level
(increased proton mobility at lower moisture content and, at higher moisture content, reduced
amount of the more abundant proton population that relaxed faster). Gluten hardened samples but it
did not affect the proton molecular mobility. The combination of both ingredients at a lower
moisture content resulted in harder samples (“gluten-effect”) with a higher proton molecular
mobility (“glycerol-effect”). At higher moisture content the combination of both ingredients
delayed amylopectin retrogradation, which was almost constant over the storage.
Keywords Pasta . Gluten . Glycerol . Physico-chemical properties . 1H NMR mobility
Page 92
84
1- Introduction
Traub and Odland (1979), defined convenience foods as “any fully or partially prepared food in
which significant preparation time, culinary skills, or energy inputs have been transferred from the
home kitchen to the food industry or distributor. The increasing demand for convenience foods has
been correlated to the different human socio-economic habits, such as female participation in the
workforce, increased time pressure, growing number of single-person households, and a lack of
abilities and experience with preparing meals at home (Costa et al., 2007; Geeroms et al., 2008). In
the recent years, pasta industry has introduced different typologies of ready to eat (RTE) pasta that
can be included in the category of convenience food meals. RTE pasta meals are found in the
market in different typologies, based on their storage conditions: frozen, refrigerated and shelf-
stable products. Olsen et al. (2012) reported that the consumers’ probability to buy convenience
food is strongly correlated to the product properties, such as flavor, appearance, texture and odor.
RTE pasta meals are subjected to enormous changes during storage, with important effects on
consumers acceptability: water migration from surface to center of lasagna piece was observed
during storage/cooling time (McCarthy et al., 2002) while increase of moisture content at the
beginning of storage, firmness increase and surface color changes were observed in refrigerated and
frozen lasagna (Olivera & Salvadori, 2011, 2012). Changes in ready to eat shelf-stable pasta meals
were associated to an overall quality loss, resulting from physico-chemical changes: Carini et al.
(2013) reported an increase of hardness and recrystallized amylopectin in cooked and sterilized
pasta products, and changes in the water status molecular mobility indicators. Another study (Carini
et al., 2014) investigated changes in RTE pasta meal, where pasta and a tomato sauce phase were
mixed together. They highlighted pasta softening during storage, possibly related to a molecular
water migration from the sauce to pasta. The investigation of the water role might, therefore, help in
understanding these phenomena. Changes occurring in pasta during storage are similar to those
observed in bread staling, which were deeply investigated (Hallberg & Chinachoti, 2002; Lin &
Lineback, 1990; Imberty & Perez, 1988; Slade & Levine, 1991; Vittadini & Vodovotz, 2003,
Page 93
85
Sereno et al., 2007). The main goal to improve RTE pasta quality is to prevent physico-chemical
changes during storage and, for example, a proper pasta formulation might contribute to modulate
these changes. Glycerol was used to extend the shelf-life of bread (Berkowitz & Oleksyk, 1991) and
it was used in bread where they observed that the presence of glycerol decreased the retrograded
amylopectin (Baik & Chinachoti, 2002). Curti et al. (2015) investigated the effect of gluten and
glycerol on fresh cooked pasta quality. They observed limited water absorption during cooking and
an increased pasta hardness in the presence of a high level of gluten, while the addition of glycerol
enhanced water absorption and softened pasta. Diantom et al. (2015) investigated the influence of
moisture content and gluten on physico-chemical properties of ‘fresh’ cooked pasta. They reported
a softening action at higher moisture content (59% g water / 100 g product as compared to 56%,
also in combination with higher level of gluten (15%, g gluten / 100 g product), associated to a
water plasticizing effect on pasta structure.
This paper aims, therefore, to explore the effect of glycerol and gluten, also mixed together, on
physico-chemical properties (water status, texture) and proton molecular mobility of RTE pasta
meals during storage.
2- Materials and methods
2.1- Ready to eat shelf stable pasta production
Dry pasta (penne shaped) was produced by a local pasta maker using a standard formulation
(semolina and water, STD) and was cooked into boiling water (pasta/water ratio 1:10) to reach 56%
and 62% moisture (g H2O /100 g product, control sample, STD-56 and STD-62, respectively). Dry
pastas with added glycerol, gluten and their mixture in equal amounts were also produced. Dry
pasta with 7% (g added ingredient /100 product) of gluten and glycerol, and pasta with both
glycerol (7%) and gluten (7%) and cooked into boiling water to reach 56% (GLU7-56, GLY7-56
and GLU7GLY7-56, respectively) and 62% (GLU7-62, GLY7-62 and GLU7GLY7-62,
respectively) moisture. About 60 g of cooked pastas were packed into multi-layer (polypropylene-
PP, polyethylene terephthalate-PET, and polyamide-PA) pouches and sterilized in autoclave (F0 ≥
Page 94
86
7) to obtain ready to eat shelf-stable pasta (RTE pasta). RTE pasta pouches were then kept at 22.5
°C for 70 days, and analyzed within 24 h from production (day 0) and after 7, 14, 21, 28, 42, and 70
days of storage.
2.2- Methods
2.2.1- Water status
Moisture content (MC, % g water/100 g product) of RTE pasta was determined by weight loss by
drying in a forced-air oven (ISCO NSV 9035, ISCO, Milan, Italy) at 105 °C to constant weight. At
least ten pasta pieces of each RTE pasta sample at each storage time were analyzed.
2.2.2- Texture
Pasta texture was measured using a TA.TX2 Texture Analyzer equipped with a 25 kg load cell
(Stable Micro systems, Goldalming, UK). Single pasta pieces were cut with a flat blade (speed of 2
mm/s; trigger force 0.1 N). The maximum height of the cutting peak was taken as ‘‘Hardness’’. 15
pasta pieces for each sample at each storage time were analyzed.
2.2.3- Thermal properties
Frozen water content and amylopectin melting were measured using a Differential Scanning
Calorimeter (DSC Q100, TA Instruments, New Castle, DE, USA) calibrated with indium (T =
156.6 °C; H = 28.71 J/g) and mercury (T = -38.83 °C, H = 11.40 J/g). About 5–10 mg of RTE pasta
were placed into hermetic stainless steel pans (Perkin Elmer, USA). Samples were heated from -80
°C to 100 °C at 5 -C/min. DSC thermograms were analyzed using an Universal Analysis Software,
version 3.9A (TA Instruments, New Castle, DE). Frozen water content (at the select experimental
conditions; FW) was calculated from the endothermic peak around 0 °C (ice melting) using the
following equation:
FW = Enthalpy Ice Fusion * (1/Latent Heat Ice Fusion)* (1/MC)*100
where FW is frozen water (%, g frozen water/g water), ice fusion enthalpy (J/g product), latent heat
of ice fusion is 334 J/g ice, and MC is moisture content (g water/1 g product).
Page 95
87
The occurrence of an endothermic peak in the 50–80 °C range was taken as recrystallized
amylopectin melting. Enthalpy of this peak was measured (J/g product) and normalized to the grams
of starch in the sample (J/g starch). At least triplicated samples of each product were analyzed at
each storage time.
2.2.4- Proton molecular mobility
A low resolution (20 MHz) 1H NMR spectrometer (the Minispec, Bruker Biospin, Milano, Italy)
operating at 25.0 ± 0.1°C was used to study proton molecular mobility by measuring the free
induction decay (FID) and transverse relaxation times (T2). About 2 g of RTE pasta were placed
into a 10 mm NMR tube that was then sealed with Parafilm to avoid moisture loss during the NMR
experiment. 1H FIDs were acquired using a single 90° pulse, followed by a dwell time of 7 µs, a
recycle delay of 3 s and a 10 ms acquisition window. 1H FIDs were analyzed in the time range 7–
100 µs where the homogeneity of magnetic field was assured. The curves were fitted with a two
components model (exponential and gaussian; Le Grand, Cambert, & Mariette, 2007; Sigmaplot,
v6, Systat Software Inc., USA):
ƒ (t) = y0 + A*exp(-t/TA) + B*exp[-(t/TB)2]
where y0 is the FID decay offset, A and B are the intensities of each relaxation component, TA and
TB are the apparent relaxation times.
T2 relaxation curves were acquired with a CPMG pulse sequence with a recycle delay of 3 s (≥ 5 1H
T1), an interpulse spacing of 0.04 ms and 4000 data points. T2 curves were analyzed as quasi-
continuous distributions of relaxation times using a UPENWin software (Alma Mater Studiorum,
Bologna, Italy). Default values for all UPEN parameters were used with the exception of one
parameter (LoXtrap) that was set to 1 to avoid extrapolation of relaxation times shorter than the first
experimental point. 1H T2 CPMG relaxation decays were also fitted with a discrete exponential
model (Sigmaplot, v.6, Systat Software Inc., USA).
2.2.5- Statistical analysis
Page 96
88
Means and standard deviations (SD) were calculated with SPSS statistical software (Version 22.0,
SPSS Inc., Armonk, New York, USA). Significant differences (p ≤ 0,05) among different samples
at equal moisture content were verified with by one-way-analysis of variance (ANOVA) with a
Tukey-high and LSD significant difference test
3- Results and Discussions
Moisture content of STD-56 and STD-62 was found to be 55.7 ± 0.5 and 61.6 ± 0.4% (g H2O / 100
g product), respectively, confirming that the desired moisture content was reached during cooking.
Also samples with glycerol and gluten also exhibited the desired moisture content (data not shown)
and were comparable to the controls (STD-56 and STD-62). Moisture content of all samples did not
significantly change during storage, as previously reported (Diantom et al., 2015; Carini et al.,
2014).
Frozen water content of STD-56 and STD-62 was 68.0 ± 3.2 and 71.7 ± 6.0% (g frozen water / 100
g water), respectively, showing that frozen water was not related to the sample’s moisture content.
Glycerol and gluten added samples exhibited similar frozen water content (data not shown),
indicating that frozen water content was not dependent on formulation, in these samples. Moreover,
frozen water content did not change in all samples during storage, suggesting that this water status
indicator was not able to discriminate among samples.
Hardness
Hardness of RTE pasta with different formulation during storage is showed in Table 1. At day 0,
GLU7-56 and GLU7GLY7-56 showed similar hardness but resulted to be significantly harder than
STD-56 as previously reported (Curti et al, 2015), while GLY7-56 exhibited similar harness as
STD-56. At 62% moisture content, GLU7-62 showed similar hardness to STD-62 while GLY7-62
was softer than STD-62, but GLU7GLY7-62 had similar hardness to STD-62. Hardness
significantly increased during storage (70 days) in all samples, as expected (Carini et al., 2014;
Diantom et al., 2015) but it reached a plateau after days 28 of storage at both moisture contents and
then it remained almost constant over storage in all samples, except for GLU7-62. The presence of
Page 97
89
gluten hardened pasta during storage, as previously reported (Diantom et al., 2015). This might be
associated to a strengthening of the gluten network, since it is known that higher quantity and better
quality of gluten in semolina has an effect on pasta hardness of final product (Cubadda et al., 2007).
On the contrary, at 62% moisture, gluten did not significantly affect pasta hardness, and this might
be associated to the predominant plasticizing effect of water, which softened pasta structure.
The presence of glycerol significantly softened pasta, at 56% and 62% moisture, as previously
reported (Curti et al, 2015), and the softening effect was more evident only at day 28. Hallberg &
Chinachoti, (1992) and Taub et al., (1994) reported that added glycerol to white bread softened.
The simultaneous presence of two ingredients (GLU7GLY7-56 and 62), that were expected to have
very different effect on pasta texture (hardening and softening), resulted to be similar to glu7-56 and
62. This result suggested a predominant effect of gluten on glycerol at a macroscopic level.
Retrograded amylopectin
The retrograded amylopectin content of RTE pasta with different formulation during storage was
showed in Table 2. At day 0, there was no amylopectin melting peak in all samples, as expected,
indicating a complete starch gelatinization after cooking and sterilization. Amylopectin
retrogradation was observed at day 7 in all samples at 56% moisture, but no significant difference
was found among samples.
At 62% moisture, only GLY7-62 exhibited amylopectin retrogradation at day 7, but in STD-62 and
GLU7-62 the retrograded amylopectin was observed at day 14, while it was detected after 21 days
of storage in GLU7GLY7-62. Retrograded amylopectin content increased significantly during
storage in all samples, except in the case of GLU7GLY7-62, where no differences were observed
over storage. The presence of gluten did not significantly affect amylopectin retrogradation,
however Diantom et al. (2015) reported that the addition of higher level of gluten and moisture
contents reduced amylopectin retrogradation over storage. In this case the no effect of added gluten
neither at lower nor at higher moisture content, might be associated to its lower quantity (7% g
gluten / 100 g semolina). Thus, the changes in samples with higher gluten content might be also
Page 98
90
correlated to the reduced starch content, and it could be useful to investigate if changes in
amylopectin retrogradation in samples with similar value of starch content are related to starch
content or added gluten. On the contrary, the presence of glycerol in combination with higher
moisture content seemed to accelerate amylopectin retrogradation. Although it was previously
reported (Baik & Chinachoti, 2001) added glycerol in bread delays amylopectin retrogradation, due
to its penetration into the amorphous regions of amylopectin which may lower the local mobility of
the amylopectin chain, and preventing the reorienting into crystalline structure. Finally, it could be
observed that the combination of gluten, glycerol and higher moisture content could delay
amylopectin retrogradation and seemed to be important key to control amylopectin retrogradation
over storage. In fact GLU7GLY7-62 showed the lowest retrograded amylopectin content after 21
days with no further changes over storage.
Proton molecular mobility
1H NMR investigation was used to explore the effect of formulation on proton molecular mobility.
In particular, 1H FID was used to evaluate the effect of formulation on the more rigid protons while
1H T2 on the more mobile protons.
1H FIDs were fit with a two components model (data not
shown). Populations were named population A and B, and the corresponding relaxation times, TA
and TB. At day 0 and 56% moisture content, population A of all samples was similar to STD-56,
while at higher moisture content, GLU7-62 had a larger population A (more rigid protons) than
STD-62, and GLY7-62 and GLU7GLY7-62 comparable to STD-62. The more rigid population
significantly increased during storage in all samples at 56% and 62%, except for GLU7-62, where
population A remained approximately constant (about 15.4%) up to days 42 then it significantly
increased to 17.2% at days 70. The increase of more rigid protons (population A) indicates that
changes occurred in the product structure over storage, which conferred to the sample higher
rigidity.
Page 99
91
The corresponding relaxation times, TA and TB, were found to be about 0.016 ms and 0.620 ms,
respectively, in all samples. Both relaxation times did not depend on storage time and were not
significantly affected by the presence of glycerol and gluten over storage.
Representative 1H T2 distributions of pasta with different formulation at 56% and 62% obtained
with UpenWin indicated the presence of four protons populations (Figure 1). According to these
distributions, 1H T2 curves were fitted with a four exponential model and the population were
named population C, D, E for all samples (Figure 1A), except in the case of GLY15-56 and
GLU7GLY7-56, where population C and D were merged in one broad population, population E was
no more observable and a resolved population G was observed at higher relaxation times (Figure
1B).
At day 0 and 56% moisture content, GLU7-56 had a lower percentage of population F than STD-56,
while GLY7-56 and GLU7GLY7-56 were comparable to STD-56. At 62% moisture, the presence
of added gluten and/or glycerol significantly decreased the population F as compared to STD-62,
with GLU7-62 and GLU7GLY7-62 comparable between each other and significantly higher than
GLY7-62.
At lower moisture content (56%), population F significantly increased in GLY-56 and GLU7GLY7-
56 during the first 14 days and then it remained constant up to the end of storage, while it seemed to
decrease during storage in GLU7-56 and remained almost constant in STD-56. At higher moisture
content, population F seemed to increase in STD-62 and GLU7-62 while it seemed to decrease in
GLY7-62 and GLU7GLY7-62.
The presence of glycerol significantly increased the more abundant population at lower moisture
content while it significantly reduced population F at higher moisture content during storage. The
presence of gluten did not affect the proton mobility neither at lower nor at higher moisture content.
Changes in samples with the mixture of gluten and glycerol were similar to those observed in
sample with glycerol, suggesting that glycerol effect was more relevant than that of gluten, even if
these samples exhibited similar hardness to gluten samples. Thus, samples with the mixture of
Page 100
92
gluten and glycerol behaved as gluten samples at macroscopic level, while glycerol promoted the
proton mobility at a molecular level.
The other proton populations (data not shown) indicated major changes in the presence of glycerol.
In fact populations C, D and E were differently distributed at lower moisture content, where
population E was not observed and the additional population G with a higher mobility was present
(≈10% at day 0 and then it significantly decreased during storage). At higher moisture content
population E was observed, being significantly higher (≈ 21%) in GLY7-62 and GLU-GLY62 than
in STD-62 and GLU7-62, where was about 12% and 14%, respectively.
The relaxation time of the more abundant proton population (T2F) is reported in Table 1. At day 0,
T2F of GLY7-56 was higher than STD-56, while GLU7-56 and GLU7GLY7-56 exhibited lower
relaxation time than STD-56, with GLU7GLY7-56 having the lowest relaxation time. At 62%
moisture, GLU7-62 had similar relaxation time to STD-62, while the T2F of GLY7-62 and
GLU7GLY7-62 was significantly higher than STD-62 but GLU7GLY7-62 exhibited the highest
relaxation time. The relaxation time of the more abundant proton shifted towards shorter times
during storage in all samples, except in STD-56 were it remained almost constant.
The presence of glycerol significantly decreased T2F at lower moisture content, as previously
reported (Curti el al., 2015). An increased in proton mobility was however observed and possibly
associated to a plasticizing effect, as indicated by the additional more mobile proton population
observed at higher relaxation time (population G). At a higher moisture content, the presence of
glycerol increased the relaxation time of the more abundant and more mobile proton population
during storage. These changes might suggest that the presence of glycerol at higher moisture
content seemed to increase sample rigidity, as indicated by the increase of pop C. This might be
explained by a possible anti-plasticizing effect of glycerol at higher moisture content. Lourdin et al.
(1997) reported that in water-glycerol-starch systems, the roles the two competing plasticizers are
related to their respective concentration. Thus at higher moisture content, water plays in this case
Page 101
93
the most relevant plasticizing effect, increasing the proton mobility, while glycerol induced an
increase of rigidity.
On the contrary, the presence of added gluten increased and decreased T2F at lower and higher
moisture content, respectively. However the presence of gluten did not significantly affect the
proton redistribution neither at lower and higher moisture content.
GLU7GLY7-56 exhibited similar T2F as GLY7-56, while GLU7GLY7-62 showed the highest T2F at
higher moisture content, suggesting an eventual interaction between the glycerol and gluten at
higher moisture content.
Page 102
94
4- Conclusions
The effect of added glycerol and gluten on physico-chemical properties of ready to eat pasta with
two levels of water was explored during storage. Both moisture content and frozen water content
were not affected neither by storage time nor by formulation. The presence of gluten hardened
samples, more markedly at lower moisture content, but it did not affect the proton molecular
mobility and amylopectin retrogradation. In fact the effect of gluten was more highlighted at
macroscopic level than at molecular level. In contrast, the presence of glycerol softened pasta and
induced strong changes at molecular level, affecting the proton molecular mobility. Glycerol effect
seemed to be related to the moisture content into the samples, exhibiting the higher plasticizing
effect at lower moisture content while at higher moisture content it seemed to play a little anti-
plasticizing effect, reducing the more abundant population. The combination of both ingredients, in
particular at higher moisture content, seemed to limit the changes into physico-chemical properties
of ready to eat pasta. But these samples exhibited similar rheological properties as samples with
added gluten while they showed similar proton mobility as samples with added glycerol. Changes in
retrograded amylopectin content were not well defined, thus it resulted very difficult to attribute it
to a specific ingredient or even to reduced starch. Thus it will be necessary to explore the changes in
retrograded amylopectin content in samples with similar starch content.
Page 103
95
5- References
Baik, M. Y., & Chinachoti, P. (2001). Effects of Glycerol and Moisture Gradient on
Thermomechanical Properties of White Bread. Journal of Agricultural and Food Chemistry, 49(8),
4031-4038.
Baik, M. Y., & Chinachoti, P. (2002). Effects of Glycerol and Moisture Redistribution on
Mechanical Properties of White Bread. Cereal Chemistry, 79(3), 376-382.
Berkowitz, D., and Oleksyk, L. E. 1991. Leavened breads with extended shelf-life. U.S. patent
5,059,432.
Carini, E., Curti, E., Cassotta, F., Najm, N. E. O., & Vittadini, E. (2014). Physico-chemical
properties of ready to eat, shelf-stable pasta during storage. Food chemistry, 144, 74-79.
Carini, E., Curti, E., Littardi, P., Luzzini, M., & Vittadini, E. (2013). Water dynamics of ready to eat
shelf stable pasta meals during storage. Innovative Food Science & Emerging Technologies, 17,
163-168.
Costa, A. I. A., Schoolmeester, D., Dekker, M., & Jongen, W. M. F. (2007). To cook or not to cook:
A means-end study of motives for choice of meal solutions. Food Quality and Preference, 18(1),
77–88.
Cubadda, R. E., Carcea, M., Marconi, E., & Trivisonno, M. C. (2007). Influence of gluten proteins
and drying temperature on the cooking quality of durum wheat pasta. Cereal Chemistry, 84(1), 48-
55.
Curti, E., Carini, E., Diantom, A., Cassotta, F., Najm, N. E. O., D’Alessandro, A., & Vittadini, E.
(2015). Effect of Glycerol and Gluten on Mechanical Properties and 1H NMR Mobility of Cooked
Pasta. Food Biophysics, 10(4), 474-480.
Diantom, A., Carini, E., Curti, E., Cassotta, F., D’Alessandro, A., & Vittadini, E. (2015). Effect of
water and gluten on physico-chemical properties and stability of ready to eat shelf-stable pasta.
Food Chemistry.
Page 104
96
Geeroms, N., Verbeke, W., & Van Kenhove, P. (2008). Consumers’ health-related motive
orientations and ready meal consumption behaviour. Appetite, 51(3), 704-712.
Hallberg, L. M., & Chinachoti, P. (2002). A fresh perspective on staling: The significance of starch
recrystallization on the firming of bread. Journal of Food Science, 67(3), 1092–1096.
Imberty, A., & Perez, S. (1988). A revisit to the three-dimensional structure of B-type starch.
Biopolymers, 27(8), 1205–1221.
Le Grand, F., Cambert, M., & Mariette, F. (2007). NMR signal analysis to characterize solid,
aqueous, and lipid phases in baked cakes. Journal of Agriculture and Food Chemistry, 55, 10947–
10952.
Lin, W., & Lineback, D. R. (1990). Changes in carbohydrate fractions in enzyme-supplemented
Lourdin, D., Bizot, H., & Colonna, P. (1997). “Antiplasticization” in starch‐glycerol films?. Journal
of Applied Polymer Science, 63(8), 1047-1053.
McCarthy, K. L., Gonzalez, J. J., McCarthy, M. J. 2002; Change in Moisture distribution in lasagna
pasta post cooking, Journal of Food Science – 67 (5), 1785-1789
Olivera F. D., Salvador O. V. 2012. Kinectic modeling of quality changes of chilled ready to eat
serve lasagna, Journal of Food Engineering, 110, 487-492
Olivera, D.F., Salvadori, V.O. 2011. Instrumental and sensory evaluation of cooked pasta during
frozen storage. International Journal of Food Science and Technology, 46, 1445–1454
Olsen, N. V., Menichelli, E., Sørheim, O., & Næs, T. (2012). Likelihood of buying healthy
convenience food: An at-home testing procedure for ready-to-heat meals. Food quality and
preference, 24(1), 171-178.
Sereno, N. M., Hill, S. E., Mitchell, J. R., Scharf, U., & Farhat, I. A. (2007). Probing water
migration and mobility during the aging of bread. In I. A. Farhat, P. S. Belton, & G. A. Webb
(Eds.), Magnetic resonance in food science: From molecules to man (pp. 89–95). UK: RSC
Publishing.
Page 105
97
Slade, L., & Levine, H. (1991). Beyond water activity: Recent advances based on an alternative
approach to assessment of food quality and safety. Critical Reviews in Food Science and Nutrition,
30(2), 115–360
Traud, L. G., & Odland, D. D. (1979). Convenience foods and home prepared food – USA
Agricultural Economic Report N° 429, Washington DC: United States Department of Agriculture
Vittadini, E., & Vodovotz, Y. (2003). Changes in the physicochemical properties of wheat- and soy-
containing breads during storage as studied by thermal analyses. Journal of Food Science, 68(6),
2022–2027.
Hallberg, L. M.; Chinachoti, P. Dynamic mechanical analysis for glass transitions in long shelf-life
bread. J. Food Sci. 1992, 57, 1201-1204.
Taub, I. A.; Halliday, J. W.; Kim, Y.-K. Bread structure and stability: Rheological, calorimetric,
spectroscopic, and microscopic characterization, Army Sci. Conf. Proc. 1994, 6, 1391-1398.
Page 106
98
Table 1
Hardness, retrograded amylopectin, population F (popF) and relaxation time (T2F) of pasta with 56% of moisture during storage. Standard deviations
are given in parenthesis following the means values; different letters close to numbers indicate significant difference among samples (p ≤ 0.05), where
the small letters referred the difference due to storage and capital letters to formulation.
Hardness
(N)
Days 0 7 14 21 28 42 70
STD-56 11.1(0.9)d/B 11.9(1.4)cd/C 13.4(0.9)bc/B 14.8(0.4)ab/B 16.5(1.4)a/A 16.0(1.0)a/AB 16.6(1.1)a/A
GLY7-56 11.7(0.9)d/B 12.5(0.7)cd/BC 13.6(0.7)bc/B 13.9(0.9)b/B 14.6(0.9)ab/B 15.3(0.4)a/B 15.4(0.3)a/B
GLU7-56 13.4(0.6)c/A 13.7(0.7)c/AB 15.1(1.0)b/A 16.7(0.5)a/A 16.6(0.6)a/A 16.6(1.1)a/AB 16.5(0.4)a/A
GLU7GLY7-56 13.5(1.0)d/A 14.8(0.6)c/A 15.3(0.8)bc/A 16.4(0.8)ab/A 16.4(0.6)ab/A 17.0(0.8)a/A 17.2(0.5)a/A
Amylopectin
(J/ g starch)
STD-56 - 1.8(0.4)c/A 2.2(0.5)bc/A 1.9(0.6)bc/A 3.0(0.4)ab/A 3.5(0.1)a/A 3.4(0.4)a/AB
GLY7-56 - 1.9(0.1)bc/A 2.4(0.7)abc/A 2.7(0.4)abc/A 1.6(0.2)c/B 3.5(0.7)ab/A 3.8(0.4)a/A
GLU7-56 - 1.7(0.2)abc/A 1.3(0.1)c/A 2.1(0.3)abc/A 1.6(0.3)bc/B 2.9(1.0)a/A 2.6(0.2)ab/B
GLU7GLY7-56 - 1.4(0.4)c/A 1.9(0.4)bc/A 2.9(0.3)abc/A 2.4(0.3)abc/AB 3.0(0.9)ab/A 3.7(0.6)a/AB
popF (%)
STD-56 71.9(1.0)a/A 62.5(1.9)b/C 71.1(0.9)a/B 71.6(2.1)a/B 71.1(1.9)a/B 71.2(1.9)a/C 69.2(1.9)a/C
GLY7-56 72.3(1.9)c/A 76.6(0.6)b/A 80.9(0.3)a/A 80.9(0.4)a/A 80.2(0.5)a/A 80.9(0.5)a/A 79.4(0.7)a/A
GLU7-56 68.4(0.7)c/B 73.8(1.2)ab/B 63.8(2.4)d/C 71.4(1.4)b/B 72.1(1.0)b/B 75.3(0.9)a/B 72.1(1.1)b/B
GLU7GLY7-56 70.8(1.2)c/A 76.9(1.1)b/A 78.8(0.8)a/A 78.8(0.7)a/A 78.5(1.0)ab/A 79.0(0.6)a/A 78.9(0.5)a/A
T2F (ms)
STD-56 28.8(0.2)a/B 29.6(0.3)a/B 26.5(0.1)a/B 26.9(0.2)a/B 26.9(0.2)a/B 26.3(0.2)a/B 25.8(0.2)a/B
GLY7-56 27.7(0.4)a/C 25.0(0.2)cd/D 26.3(0.1)b/B 25.4(0.1)c/C 24.6(0.3)d/D 25.4(0.1)c/C 24.7(0.2)d/D
GLU7-56 34.3(0.3)a/A 30.6(0.2)c/A 31.9(0.4)b/A 29.0(0.9)d/A 28.9(0.1)d/A 28.1(1.2)e/A 28.7(0.2)d/A
GLU7GLY7-56 26.1(0.3)b/D 26.8(0.3)a/C 25.3(0.2)c/C 25.3(0.3)c/C 25.6(0.3)bc/C 24.1(0.3)d/C 25.1(0.1)c/C
Page 107
99
Table 2
Hardness, retrograded amylopectin, population F (popF) and relaxation time (T2F) of pasta with 62% of moisture during storage. Standard deviations
are given in parenthesis following the means values; different letters close to numbers indicate significant difference among samples (p ≤ 0.05), where
the small letters referred the difference due to storage and capital letters to formulation.
Hardness
(N)
Days 0 7 14 21 28 42 70
STD-62 8.7(0.5)d/AB 9.0(0.8)cd/A 10.5(0.6)ab/A 10.2(0.4)bc/A 11.6(0.8)a/A 11.6(0.3)a/A 11.8(0.1)a/AB
GLY7-62 7.3(0.5)c/C 8.7(0.2)b/A 9.0(0.4)b/B 8.9(0.1)b/B 10.4(0.9)a/B 10.6(0.8)a/B 10.9(0.4)a/B
GLU7-62 9.3(0.4)e/A 9.9(0.8)de/A 10.8(0.8)bcd/A 10.4(0.5)cd/A 11.1(0.5)bc/AB 11.7(0.7)b/A 13.0(0.5)a/A
GLU7GLY7-62 8.3(0.8)c/B 10.0(1.0)b/A 10.5(0.8)ab/A 10.5(0.8)ab/A 11.6(0.8)a/A 11.6(0.7)a/A 11.8(0.2)a/B
Amylopectin
(J/ g starch)
STD-62 - - 1.0(0.7)c/A 1.1(0.1)c/B 3.0(0.6)ab/A 1.7(0.2)bc/A 3.8(1.1)a/A
GLY7-62 - 0.8(0.5)b 1.3(0.2)b/A 1.0(0.1)b/B 1.9(0.3)ab/B 2.0(0.7)ab/A 2.6(0.4)a/A
GLU7-62 - - 0.9(0.2)b/A 1.0(0.1)b/B 1.9(0.3)ab/B 2.0(0.3)ab/A 2.6(0.7)a/A
GLU7GLY7-62 - - - 1.6(0.2)a/A 1.8(0.2)a/B 1.9(0.1)a/A 2.2(0.6)a/A
popF (%)
STD-62 76.8(0.4)d/A 80.7(0.5)b/A 78.4(0.4)c/A 78.8(0.5)c/A 80.4(0.3)b/A 81.8(0.4)a/A 80.7(0.4)a/A
GLY7-62 64.9(1.1)a/C 62.7(1.6)a/B 47.9(1.3)c/C 54.6(2.2)b/C 46.6(4.0)c/C 61.5(3.6)a/B 36.7(2.6)b/C
GLU7-62 74.1(0.4)e/B 76.8(1.5)d/A 76.9(0.3)cd/A 79.3(0.6)ab/A 78.6(1.0)ab/AB 78.4(0.9)bc/A 80.1(0.6)a/A
GLU7GLY7-62 73.4(1.1)a/B 66.1(5.7)bc/B 58.8(2.2)d/B 69.7(2.8)ab/B 60.9(2.2)cd/B 60.5(2.6)cd/B 67.0(0.2)abc/B
T2F (ms)
STD-62 43.7(0.4)a/C 43.5(0.2)a/A 40.2(0.2)b/C 38.5(0.2)d/C 39.2(0.1)c/C 38.0(0.1)e/C 38.1(0.2)e/C
GLY7-62 45.7(0.2)a/B 40.6(0.2)b/B 41.1(0.2)b/B 39.4(0.3)c/B 40.33(0.6)bc/B 38.9(0.6)c/B 41.0(0.8)b/A
GLU7-62 43.9(0.1)a/C 40.4(0.2)b/B 36.8(0.1)e/D 37.6(0.5)c/D 37.6(0.2)d/D 34.5(0.2)f/D 36.9(0.1)e/D
GLU7GLY7-62 46.3(0.4)a/A 44.0(1.0)b/A 42.9(0.3)bc/A 41.9(0.5)c/A 42.3(0.4)cd/A 40.9(0.4)d/A 39.1(0.2)e/B
Page 108
100
Figure 1
0.1 1 10 100 1000 10000
rela
tive in
tensity
0
10
20
30
40
50
60A
pop C
pop F
pop Epop D
Times (ms)
0.1 1 10 100 1000 10000
rela
tive in
tensity
0
10
20
30
40
50
60
B
pop C pop Dpop G
pop F
Page 109
101
Figure captions
Figure 1
Characteristic 1H T2 relaxation time distribution for cooked pasta with different formulation
Page 110
102
Diantom et al., to be submitted
Effect of water, glycerol and gluten on physico-chemical properties and water status during
storage.
Page 111
103
Abstract
This work aims to investigate the effect of water, glycerol and gluten on physico-chemical
properties of ready to eat pasta with two levels of water (56%, 62%, 65% g water /100 g product).
The macroscopic water status (moisture content, frozen water), proton molecular mobility
indicators (1H FID,
1H T2), rheological properties and retrograded amylopectin content were
measured to characterize the product.
Neither glycerol nor gluten affected macroscopic waters status. The increase of moisture and
glycerol content softened samples and increased proton molecular mobility. Gluten hardened
samples but it did not affect the proton molecular mobility. The combination of both ingredients
resulted in harder samples (“gluten-effect”) with high proton molecular mobility (“glycerol-effect”).
Retrograded amylopectin content increased during storage, but its increase was not related to
presence of different ingredients. However changes into amylopectin retrogradation might be
related to the starch amount and not the effect of added ingredients
Keywords Pasta . Water, Gluten . Glycerol . Physico-chemical properties . 1H NMR mobility
Page 112
104
1- Introduction
Ready to eat pasta meals have been recently introduced by the pasta industry in the retail market to
respond to an increasing demand of the consumers for convenience food. They are subjected to a
decrease in quality and consumers’ acceptability during storage (Olivera & Salvadori, 2011). A
deep understanding of the causes leading to quality loss will help pasta industry to introduce the
necessary modifications in product formulation, processing and/or packaging to extend its shelf-
stability and to produce a food item with the best sensory attributes at the time of consumption.
Ready to eat pasta meals may be sold with pasta and sauce (mostly tomato based) assembled or
packed in separated containers. The dynamics at the base of storage driven modifications are
different in these two types of products. In the case of pasta and sauce assembled, pasta softening
was reported and related to water migration between pasta and sauce phases detectable only at a
molecular level (1H T1 and T2) as water activity was at equilibrium between the two phases very
shortly after production (Carini et al., 2013). When, on the contrary, pasta and sauce are kept
separated during storage an increase in pasta hardness and retrograded amylopectin content as well
as an increased molecular rigidity as measured by 1H NMR (increased
1H FID steepness and
decreased 1H T2 relaxation times) were reported in pasta (Carini et al., 2014), strongly resembling
the dynamics at the bases of bread staling (Hallberg & Chinachoti, 2002; Lin & Lineback, 1990;
Imberty & Perez, 1988; Slade & Levine 1991; Vittadini & Vodovotz, 2003; Sereno et al., 2007).
Pasta textural quality decrease may be reduced and controlled increasing moisture and/or gluten
content in the pasta (Diantom et al, 2015), suggesting that formulation may have an important role
in controlling and modulating cooked and stabilized pasta shelf-stability. Glycerol and gluten are
known to have an important role in bread staling (Berkowitz & Oleksyk, 1991; Hallberg &
Chinachoti, 1992; Taub et al., 1994; Eliasson, 1983a, 1983b; Ottenhof & Farhat, 2004; Callejo et
al., 1999; Curti et al., 2014) and their effect on cooked pasta properties was recently explored (Curti
et al., 2015). Glycerol in the formulation was reported to soften pasta texture and enhance proton
Page 113
105
molecular mobility, while gluten hardened pasta but did not influenced the proton molecular
mobility.
The aim of this work was, therefore, to verify the effect of moisture content, glycerol, and gluten
alone or in combination, on physico-chemical properties (water status, rheological properties,
retrograded amylopectin) of ready to eat pasta during storage. A pasta sample was also produced
using an inert filler (titanium dioxide) in substitution of gluten and glycerol amounts to verify the
effect of “starch dilution” and/or ingredient action in the pasta matrix on starch retrogradation and
physico-chemical properties.
2- Materials and Methods
2.1- Materials
2.1- Ready to eat shelf stable pasta production
Dry pasta (penne shaped) was produced by a local pasta maker using a standard formulation
(semolina and water, STD) and was cooked into boiling water (pasta/water ratio 1:10) to reach
59%, 62% and 65% moisture (g H2O /100 g product, STD-56, STD-62 and STD-65, respectively).
Dry pastas was also produced with a formulation modified by the addition of glycerol, gluten and
their mixture, and titanium dioxide at a 15% level (g added ingredient /100 product) (Table 1).
These pastas were cooked into boiling water to reach moisture contents of 59% (GLU15-59,
GLY715-59 and GLU3GLY12-59, respectively), 62% (GLY15-62, TiO2-62), and 65% (GLU15-
65, GLY15-65 and GLU12GLY3-65, respectively). About 60 g of cooked pastas were packed into
multi-layer (polypropylene-PP, polyethylene terephthalate-PET, and polyamide-PA) pouches and
sterilized in autoclave (F0 ≥ 7) to obtain ready to eat shelf-stable pasta (RTE pasta). RTE pasta
pouches were then kept at 22.5 °C for 90 days, and analyzed within 24 h from production (day 0)
and after 7, 14, 28, 42, 63 and 90 days of storage.
2.2- Methods
2.2.1- Moisture content
Page 114
106
Moisture content (MC, % g water/100 g product) of RTE pasta was determined by weight loss by
drying in a forced-air oven (ISCO NSV 9035, ISCO, Milan, Italy) at 105 °C to constant weight. At
least ten pasta pieces of each RTE pasta sample at each storage time were analyzed.
2.2.2- Texture
Pasta texture was measured using a TA.TX2 Texture Analyzer equipped with a 25 kg load cell
(Stable Micro systems, Goldalming, UK). Single pasta pieces were cut with a flat blade (speed of 2
mm/s; trigger force 0.1 N). The maximum height of the cutting peak was taken as ‘‘Hardness’’. 15
pasta pieces for each sample at each storage time were analyzed.
2.2.3- Thermal properties
Frozen water content and amylopectin melting were measured using a Differential Scanning
Calorimeter (DSC Q100, TA Instruments, New Castle, DE, USA) calibrated with indium (T =
156.6 °C; H = 28.71 J/g) and mercury (T = -38.83 °C, H = 11.40 J/g). About 5–10 mg of RTE pasta
were placed into hermetic stainless steel pans (Perkin Elmer, USA). Samples were heated from -80
°C to 100 °C at 5 -C/min. DSC thermograms were analyzed using an Universal Analysis Software,
version 3.9A (TA Instruments, New Castle, DE). Frozen water content (at the select experimental
conditions; FW) was calculated from the endothermic peak around 0 °C (ice melting) using the
following equation:
FW = Enthalpy Ice Fusion * (1/Latent Heat Ice Fusion)* (1/MC)*100
where FW is frozen water (%, g frozen water/g water), ice fusion enthalpy (J/g product), latent heat
of ice fusion is 334 J/g ice, and MC is moisture content (g water/1 g product).
The occurrence of an endothermic peak in the 50–80 °C range was taken as recrystallized
amylopectin melting. Enthalpy of this peak was measured (J/g product) and normalized to the grams
of starch in the sample (J/g starch). At least triplicated samples of each product were analyzed at
each storage time.
2.2.4- Proton molecular mobility
Page 115
107
A low resolution (20 MHz) 1H NMR spectrometer (the Minispec, Bruker Biospin, Milano, Italy)
operating at 25.0 ± 0.1°C was used to study proton molecular mobility by measuring the free
induction decay (FID) and transverse relaxation times (T2). About 2 g of RTE pasta were placed
into a 10 mm NMR tube that was then sealed with Parafilm to avoid moisture loss during the NMR
experiment. 1H FIDs were acquired using a single 90° pulse, followed by a dwell time of 7 µs, a
recycle delay of 3 s and a 10 ms acquisition window. 1H FIDs were analyzed in the time range 7–
100 µs where the homogeneity of magnetic field was assured. The curves were fitted with a two
components model (exponential and gaussian; Le Grand, Cambert, & Mariette, 2007; Sigmaplot,
v6, Systat Software Inc., USA):
ƒ (t) = y0 + A*exp(-t/TA) + B*exp[-(t/TB)2]
where y0 is the FID decay offset, A and B are the intensities of each relaxation component, TA and
TB are the apparent relaxation times.
T2 relaxation curves were acquired with a CPMG pulse sequence with a recycle delay of 3 s (≥ 5 1H
T1), an interpulse spacing of 0.04 ms and 4000 data points. T2 curves were analyzed as quasi-
continuous distributions of relaxation times using a UPENWin software (Alma Mater Studiorum,
Bologna, Italy). Default values for all UPEN parameters were used with the exception of one
parameter (LoXtrap) that was set to 1 to avoid extrapolation of relaxation times shorter than the first
experimental point. 1H T2 CPMG relaxation decays were also fitted with a discrete exponential
model (Sigmaplot, v.6, Systat Software Inc., USA).
2.2.5- Statistical analysis
Statistical analysis was carried out with SPSS software (Version 22.0, SPSS Inc., Armonk, New
York, USA). Significant differences (p ≤ 0,05) among different samples were verified with by one-
way-analysis of variance (ANOVA) with a Tukey-high and LSD significant difference test.
3- Results and Discussions
3.1 Moisture and Frozen water contents
Page 116
108
Moisture content was found to be 59.1 ± 0.5; 61.8 ± 0.2 and 65.0 ± 0.3% (g H2O / 100 g product)
in STD-59, STD-62 and STD-65, respectively, confirming that the desired moisture content was
reached during cooking. All the other samples with glycerol and gluten also exhibited the desired
moisture content, 58.4 ± 0.5; 57.6 ± 0.3 and 59.6 ± 0.5 % for GLU15-59, GLY15-59 and
GLU3GLY12-59, respectively; 61.3 ± 0.2 and 61.4 ± 0.4% for GLY15-62 and TiO2-62,
respectively, then 64.7 ± 0.2, 64.9 ± 0.3 and 64.8 ± 0.3 for GLU15-65, GLY15-65 and
GLU12GLY3-65, respectively, and were statistically comparable to the controls (STD-56, STD-62
and STD-65). Neither formulation nor storage significantly affected moisture content in all samples.
This was in agreement with previously reported data (Diantom et al., 2015; Carini et al., 2014).
The frozen water content (data not shown) of STD-56, STD-62 and STD-65 was found to be about
69.7 ± 2.3; 70.2 ± 6.0 and 72.4 ± 8.8% (g frozen water / 100 g water), respectively, showing that
frozen water was not related to the sample’s moisture content. The rest of samples exhibited similar
frozen water content during storage. Frozen content was not significantly affected by formulation
and storage.
3.2- Texture and retrograded amylopectin
Hardness of pasta with different composition is reported in Table 2. At day 0, STD pasta exhibited
different hardness, that increased with increasing moisture content. STD-59 exhibited the highest
hardness while STD-65 was the softest sample. At 59% of moisture, GLU15-59 was significantly
harder than STD-59 while GLY15-59 and GLU3GLY12-59 were softer than STD-59. However
GLU3GLY12-59 exhibited lower hardness than GLU15-59 and GLY15-59. At 62% moisture,
GLY15-62 exhibited similar hardness to STD-62 but both samples were harder than TiO2-62. At
65% moisture, GLU15-65 and GLU12GLY3-65 were harder than STD-65 while GLY15-65 had
hardness comparable to STD-65.
Hardness significantly increased during storage in all samples, as expected (Carini et al, 2014;
Diantom et al, 2015), except in the case of TiO2-62 and GLU15-65 where the plateau was reached
at day 28 and hardness remained almost constant over the storage. Increased moisture content
Page 117
109
helped retaining softness in the samples during storage, as expected (Diantom et al, 2015),
confirming that water played a plasticizing effect correlated to its amount. On the contrary, the
presence of added gluten significantly increased samples’ hardness, independently on the level of
moisture content (Diantom et al., 2015). The combination of higher added gluten and higher
moisture content (65%, g water / 100 product) resulted to strongly reduce the changes of pasta
texture during storage. The hardness increased in the presence of gluten, might be related to a
strengthening of the gluten network (Malcolmson et al., 1993, Feillet 1984). On the contrary, the
presence of glycerol significantly softened pasta (similarly to what observed in cooked pasta, Curti
et al., 2015) as compared to the control at all moisture levels, even if at higher moisture content
(65%, g water / 100 g product) the glycerol exhibited a significant effect only after 28 days. It might
be speculated this to be due to the plasticizing effect of glycerol that became evident only when
some of the water had lost some of its mobility and was, therefore, replaced by the glycerol.
Hallberg & Chinachoti, (1992) and Taub et al., (1994) reported that added glycerol to white bread
softened during storage. The combination of glycerol and gluten affected pasta hardness, depending
on moisture content and ingredient substitution. In fact at 59% moisture, GLU3GLY12-59 was
softer than GLU15-59 and GLY15-59, confirming the plasticizing effect of glycerol. While at 65%
moisture, GLU12GLY3-65 showed higher hardness as compared to samples with only the single
ingredient. This suggests that the interactions between gluten and glycerol are influenced by
moisture content, where the three ingredients interact together resulting in a particular texture of the
sample.
The presence of titanium dioxide significantly softened pasta as compared to the control
formulation. This might be associated to an eventual alteration of gluten network, which induced an
impoverishment of the structure generating a disintegration of the system. The softness observed
in the presence of TiO2 might be correlated to the reduced amount of starch. In fact it’s known that
gelatinized starch was trapped by coagulated gluten to form a strengthened network (Resmini &
Page 118
110
Pagani, 1983). Thus in this case starch was replaced by an inert material, which did not increase the
viscosity and induced the formation a weak gluten network.
Retrograded amylopectin content of all samples is reported in Table 3. At day 0, no amylopectin
was observed in all samples as expected, and confirming the complete starch gelatinization
achieved during cooking and sterilization. All control samples, unregarding their moisture content,
started to show retrograded amylopectin at day 7. Similarly, at 59% moisture, GLU15-59 and
GLU3GLY12-59 showed retrograded amylopectin at day 7, while in the glycerol containing sample
it was detected only after 14 days in GLY15-59. At 62% moisture content GLY15-62 showed
retrograded amylopectin at day 14 and TiO2 after 28 days. At 65% moisture, GLU15-65 and
GLY15-65 showed retrograded amylopectin at day 28 but in the GLU12GLY3-65 amylopectin
retrogradation was recorded at day 7. The retrograded amylopectin content increased during storage
in all samples as expected (Diantom et al., 2015), except in GLU15-65 where it resulted to be
almost constant during storage. The moisture content alone did not show an evident effect on
amylopectin retrogradation, and gluten or glycerol added alone did not exhibit a relevant effect on
retrograded amylopectin content. But the combination of higher moisture content (65%, g water /
100 g product) with higher amount of gluten or glycerol (15%, g added ingredient / 100 g product)
seemed to delay the amylopectin retrogradation (Diantom et al., 2015). The presence of TiO2
significantly amylopectin retrogradation, retarding its beginning and resulting in a drastically
reduced amount of crystals at the end of storage. Glycerol and gluten generally did not show any
effect on amylopectin retrogradation, as did not significantly affect the, but the changes into
retrograded amylopectin might be related to reduced amount of starch in samples with added
ingredients.
3.2- Proton molecular mobility
1H NMR investigation was used to explore the effect of formulation on proton molecular mobility.
1H FID was used to evaluate the more rigid protons while
1H T2 to analyze the effect of formulation
on the more mobile protons. 1H FIDs were fit with a two components model (data not shown).
Page 119
111
Populations were named population A and B, and the corresponding relaxation times, TA and TB. At
day 0, the more rigid protons population A was represented according to the moisture content, with
increasing moisture content, 34.1%, 31.8% and 28.4% for STD-59, STD-62 and STD-65,
respectively. At 59% moisture, GLU15-59 showed higher value of population A (35.5%) than STD-
59 (34.1%), while GLY15-59 was comparable to STD-59, with the lowest percentage in but the
GLU3GLY12-59 (29.2%). At 62% moisture, both GLY15-59 (29.8%) and TiO2 (28.0%) exhibited
lower population A than STD-62. Whereas at 65% moisture, population A of GLU15-65 was
significantly higher (31.6%) than STD-65 while GLY15-65 exhibited a lower percentage (27.6%) ,
with GLU12GLY3-65 showing the highest rigid protons (36.0%). The more rigid proton percentage
increased during storage in all samples, suggesting an increase of rigidity during storage (Diantom
et al., 2015).
The increase of moisture content resulted in a reduction of population A, that was in accordance to
the pasta softening (Diantom et al., 2015). The presence of gluten increased molecular rigidity at all
moisture contents, that also resulted in a higher hardness of the gluten samples. The presence of
glycerol enhanced molecular mobility (decrease in population A), in accordance to the softening
effect of glycerol (lower hardness). Samples with the mixture of gluten and glycerol showed
changes that were related to the ingredient that was present in a greater amount.
The corresponding relaxation times, TA and TB, of both STDs were found to be about 0.016 ms and
0.620 ms, respectively, indicating that the more rigid relaxation time did not depend on moisture
content. Similar relaxation times were observed for the rest of samples, indicating that neither
glycerol nor gluten affected the mobility of the more rigid protons. Both relaxation times did not
depend on storage time.
Representative 1H T2 distributions of pasta with different formulation were analyzed with UpenWin
and indicated the presence of four protons populations that were named population C, D, E and F
from the fastest to the slowest relaxing one (Figure 1). These populations were unresolved in all
samples, and 1H T2 curves were therefore fit to quantify the percentage of protons belonging to each
Page 120
112
population and their relaxation times. Population E was the more represented in all samples while
population F resulted to be the more mobile in all samples. Even if the population were four, in this
study, the discussion was focused on the more abundant population E and the more mobile
population F.
At day 0, the population E percentage in STD-59 was the highest followed by STD-62 and then
STD-65 which resulted to be the lowest percentage (Table 4), while the more mobile population,
population F, resulted to be higher in STD-65, followed by STD-62 and then STD-59. Both
populations were affected by the presence of added ingredient at day 0. GLU15-59 exhibited a
lower percentage of population E than STD-59 while GLY15-59 had similar value to STD-59, but
GLU3GLY12-59 exhibited the highest percentage of population E as compared to STD-59,
GLU15-59 and GLY15-59. At 62% moisture, GLY15-62 had the highest representation of
population E, followed by STD-62 and TiO2-62 with the lowest value. At 65% moisture, GLY15-
65 had the highest value of population E, followed by GLU12GLY3-65, GLU15-65 and STD-65
with the lowest value. Concerning population F (Table 5), GLU15-59 showed the higher
percentage, followed by STD-59, GLU3GLY12-59 and GLY15-59 with the lowest value. At 62%
moisture, GLY15-62 had lower amount of population F than STD-62 while TiO2-62 exhibited the
highest amount. Whereas at 65% moisture, GLU15-65 and GLY15-65 had lower amount of
population F than STD-65, but the GLU15-65 had higher amount than GLY15-65 and similar as
GLU12GLY3-65.
Changes in population E did not showed any clear trend relatable to storage and/or moisture
content, as a strong fluctuation of values was detected in all samples over storage. Conversely, it
was possible to observe a significant increase of population F relatable to storage (more
pronouncedly higher moisture content 65%). The presence of glycerol alone in pasta formulation
induced an increase of the more abundant population E, more evident at higher moisture content
(65%), while it significantly reduced the more mobile population F.
Page 121
113
The presence of gluten alone did not significantly affect neither population E nor population F. The
simultaneous presence of gluten and glycerol affected proton distribution in a different manner
according to the amount of each ingredients. Population E was higher in GLU3GLY12-59 than
GLU15-59 and GLY15-59, suggesting an eventual interaction between gluten and glycerol, which
conferred a lower molecular rigidity to pasta. At higher moisture content, Population E was lower in
GLU12GLY3-65 than GLY15-65 and GLU15-65 over storage, but it seemed to be similar to
GLU15-65 however fluctuations were observed. This might be correlated to the higher amount of
gluten in this case, which generated the increase of matrix rigidity, reducing the proton mobility.
The addition of TiO2 did not induce strong changes in proton distribution during storage, however
significant difference was observed at day 0.
The corresponding relaxation time of the observed populations were named T2C, T2D, T2E and T2F
for population C, D, E and F, respectively. At day 0, the relaxation times of the more abundant
population (T2E) (Table 4) and the more mobile population (T2F) (Table 5) resulted to be the same
in all STDs. At 59% moisture, GLY15-59 had higher T2E and T2F than STD-59 while GLU15-59
showed lower T2E and T2F than STD-59, but GLU3GLY12-59 exhibited higher T2E and T2F. At 62%
moisture, GLY15-62 showed higher T2E and T2F than STD-62, while TiO2-62 had similar values as
STD-62. At 65% moisture, GLU15-65, GLY15-65 and GLU12GLY3-65 showed higher T2E and
T2F than STD-62. The relaxation times of more abundant and more mobile populations significantly
decreased in all samples during storage. T2E significantly increased with increasing moisture
content, confirming that pasta structure become less rigid, inducing higher mobility, and this was in
agreement with the softening observed at macroscopic level, while T2F did not depend to the
moisture content. The presence of glycerol significantly increased both proton relaxation time (T2E
and T2F), while added gluten did not significantly affect both relaxation times.
The combination of 12% of glycerol and 3% of gluten significantly increased the relaxation time of
the more abundant population, while T2F was higher than STDs and gluten samples but lower than
glycerol samples.
Page 122
114
Proton molecular mobility was influenced by the presence of moisture content, as expected, with
proton molecular mobility increasing with increasing moisture content. This might be associated to
the plasticizing effect of water, which softens samples and increasing the proton mobility (Diantom
et al. 2015). The presence of added gluten did not significantly affect proton molecular mobility,
even if it significantly induced hardness increase. This might suggest that the changes at
macroscopic level, is not correlated to those occurred at molecular level. In fact there was no
correlation between the more abundant proton and the hardness (data not shown). The presence of
glycerol significantly increased the proton molecular mobility (Curti et al. 2015), and softened pasta
structure while acting as plasticizer, and allowing proton to move easily. However it was observed
that the relaxation time of the more mobile proton of glycerol samples significantly decreased with
increasing moisture content. This might suggest that there was an interaction between water and
glycerol inducing an increase of the rigidity into pasta, anti-plasticizing effect, which reduces
proton mobility. Lourdin et al. (1997) reported that the effective role of glycerol and water, which
coexisting in a water-glycerol-starch system, was related to their respective concentration.
Page 123
115
4- Conclusions
The effect of water, glycerol and gluten on physico-chemical properties of ready to eat pasta with
was explored during storage. Both moisture content and frozen water content were not affected
neither by storage time nor by formulation. Water softened pasta structure and increased the proton
molecular mobility, but it did not affect amylopectin retrogradation. The presence of gluten
hardened samples, at all level of moisture content, but it did not affect the proton molecular
mobility and amylopectin retrogradation. In fact the effect of gluten was more highlighted at
macroscopic level than at molecular level. In contrast, the presence of glycerol softened pasta and
induced strong changes at molecular level, affecting the proton molecular mobility. Glycerol effect
seemed to be related to the moisture content into the samples, exhibiting the higher plasticizing
effect at lower moisture content while at higher moisture content it seemed to play a little anti-
plasticizing effect. Samples with both ingredients (gluten and glycerol) exhibited similar rheological
properties as samples with added gluten while they showed similar proton mobility as samples with
added glycerol. The presence of Titanium dioxide significantly affect the rheological properties
(softening), but it did not significantly induce changes in other parameters.
Changes in retrograded amylopectin content were not well defined, but according to these results
we might conclude that changes in amylopectin retrogradation were related to amount of starch into
the formulation.
Page 124
116
5- References
Baik, M. Y., & Chinachoti, P. (2002). Effects of glycerol and moisture redistribution on mechanical
properties of white bread. Cereal chemistry, 79(3), 376-382.
Berkowitz, D.; Oleksyk, L. E. 1991. Leavened breads with extended shelf-life. U.S. Patent
5,059,432,.
Callejo, M. J., Gill, M. J., Rodriguez, G., & Ruiz, M. V. (1999). Effect of gluten addition and
storage time on white pan bread quality: instrumental evaluation. European Food Research and
Technology, 208, 27-32.
Carini, E., Curti, E., Cassotta, F., Najm, N. E. O., & Vittadini, E. (2014). Physico-chemical
properties of ready to eat, shelf-stable pasta during storage. Food chemistry, 144, 74-79.
Carini, E., Curti, E., Littardi, P., Luzzini, M., & Vittadini, E. (2013). Water dynamics of ready to eat
shelf stable pasta meals during storage. Innovative Food Science & Emerging Technologies, 17,
163-168.
Curti, E., Carini, E., Diantom, A., Cassotta, F., Najm, N. E. O., D’Alessandro, A., & Vittadini, E.
(2015). Effect of Glycerol and Gluten on Mechanical Properties and 1H NMR Mobility of Cooked
Pasta. Food Biophysics, 10(4), 474-480.
Diantom, A., Carini, E., Curti, E., Cassotta, F., D’Alessandro, A., & Vittadini, E. (2015). Effect of
water and gluten on physico-chemical properties and stability of ready to eat shelf-stable pasta.
Food Chemistry.
Eliasson, A. C. (1983a). Differential Scanning Calorimetry studies on wheat starch-gluten mixtures.
I. Effect of gluten on the gelatinization of wheat starch. Journal of Cereal Science, 1, 199-205.
Page 125
117
Eliasson, A. C. (1983b). Differential scanning calorimetry studies on wheat starch-gluten mixtures.
II. Effect of gluten and sodium stearoyl lactylate on starchcrystallisation during ageing of wheat
starch gels. Journal of Cereal Science, 1,207-213.
Feillet, P. (1984). The biochemical basis of pasta cooking quality-its consequences for durum-wheat
breeders. Sciences des aliments, 4(4), 551-566.
Hallberg, L. M., & Chinachoti, P. (2002). A fresh perspective on staling: The significance of starch
recrystallization on the firming of bread. Journal of Food Science, 67(3), 1092–1096.
Hallberg, L. M.; Chinachoti, P. 1992. Dynamic mechanical analysis for glass transitions in long
shelf-life bread. J. Food Sci., 57, 1201-1204.
Imberty, A., & Perez, S. (1988). A revisit to the three-dimensional structure of B-type starch.
Biopolymers, 27(8), 1205–1221.
Le Grand, F., Cambert, M., & Mariette, F. (2007). NMR signal analysis to characterize solid,
aqueous, and lipid phases in baked cakes. Journal of Agriculture and Food Chemistry, 55, 10947–
10952.
Lin, W., & Lineback, D. R. (1990). Changes in carbohydrate fractions in enzyme-supplemented
Lourdin, D., Bizot, H., & Colonna, P. (1997). “Antiplasticization” in starch‐glycerol films?. Journal
of Applied Polymer Science, 63(8), 1047-1053.
Malcolmson, L. J., Matsuo, R. R., & Balshaw, R. (1993). Textural optimization of spaghetti using
response surface methodology: effects of drying temperature and durum protein level. Cereal
chemistry (USA).
Ottenhof, M. A., & Farhat, I. A. (2004). The effect of gluten on the retrogradation of wheat-starch.
Journal of Cereal Science, 40, 269-274.
Resmini, P., & Pagani, M. A. (1983). Ultrastructure Studies of Pasta. A Review. Journal of Food
Structure, 2(1), 2.
Sereno, N. M., Hill, S. E., Mitchell, J. R., Scharf, U., & Farhat, I. A. (2007). Probing water
migration and mobility during the aging of bread. In I. A. Farhat, P. S. Belton, & G. A. Webb
Page 126
118
(Eds.), Magnetic resonance in food science: From molecules to man (pp. 89–95). UK: RSC
Publishing.
Slade, L., & Levine, H. (1991). Beyond water activity: Recent advances based on an alternative
approach to assessment of food quality and safety. Critical Reviews in Food Science and Nutrition,
30(2), 115–360
Taub, I. A.; Halliday, J. W.; Kim, Y.-K. 1994. Bread structure and stability: Rheological,
calorimetric, spectroscopic, and microscopic characterization, Army Sci. Conf. Proc., 6, 1391-1398.
Traud, L. G., & Odland, D. D. (1979). Convenience foods and home prepared food – USA
Agricultural Economic Report N° 429, Washington DC: United States Department of Agriculture
Vittadini, E., & Vodovotz, Y. (2003). Changes in the physicochemical properties of wheat- and soy-
containing breads during storage as studied by thermal analyses. Journal of Food Science, 68(6),
2022–2027.
Page 127
119
Table 1
Formulation of different pasta used in this study (g)
Semolina Gluten Glycerol Titanium
dioxide
STDs 100 - - -
GLU15 85 15 - -
GLY15 85 - 15 -
GLU3GLY12 85 3 12 -
GLU12GLY3 85 12 3 -
TiO215 85 - - 15
Table 2
Hardness (N) of RTE pasta meals over storage. Standard deviations are given in parenthesis
following the means values; different letters indicate significant difference among samples (p ≤
0.05); small letters indicate differences during storage; capital letters indicate differences among the
samples.
Days 0 7 14 28 42 63 90
STD-59 10.1(0.7)c/B 10.4(0.5)c/A 12.0(0.8)b/A 12.5(0.9)b/B 14.3(0.7)a/B 14.4(0.6)a/B 14.5(0.5)a/B
GLU15-59 11.5(0.9)d/A 14.4(0.8)c/A 15.2(0.3)c/A 15.2(0.3)bc/A 16.1(0.6)ab/A 16.1(0.4)a/A 17.0(0.6)a/A
GLY15-59 8.7(0.7)d/C 10.0(0.6)c/B 11.7(0.6)b/B 11.7(0.6)b/B 12.1(0.8)ab/C 12.5(0.8)ab/C 12.8(0.7)a/C
GLU3GLY12-59 6.8(0.6)d/D 7.3(0.6)c/C 8.0(0.4)bc/C 8.2(0.5)bc/C 8.4(0.6)bc/D 8.4(0.5)ab/D 8.9(0.7)a/D
STD-62 8.0(0.9)e/A 8.8(0.6)d/A 10.5(0.7)c/A 10.5(0.4)bc/A 11.2(0.6)b/A 12.0(0.8)a/A 10.1(0.7)a/A
GLY15-62 7.4(0.7)e/A 7.6(0.6)e/B 8.9(0.4)d/B 9.4(0.6)cd/B 9.7(0.8) bc/B 10.1(0.6)ab/B 10.5(0.6)a/B
TiO2-62 6.7(0.8)c/B 7.5(0.5)b/B 8.4(0.6)a/B 8.6(0.6)a/C 9.0(0.6)a/C 9.0(0.6)a/C 9.1(0.9)a/C
STD-65 6.9(0.6)c/C 7.2(0.5)c/C 8.3(0.7)b/C 8.5(0.7)b/C 8.7(0.6)b/C 8.8(0.5)a/C 10.0(0.8)a/C
GLU15-65 8.5(0.8)c/B 9.9(0.6)b/B 11.1(0.4)a/B 11.1(0.1)a/B 11.1(0.3)a/B 11.2(0.6)a/B 11.8(0.8)a/B
GLY15-65 6.3(0.6)c/C 6.8(0.5)c/C 7.7(0.6)b/C 7.5(0.6)b/D 7.8(0.6)b/D 8.0(0.6)ab/D 8.5(0.6)a/D
GLU12GLY3-65 12.5(0.8)d/A 13.7(0.9)c/A 14.4(0.8)bc/A 14.7(0.9)bc/A 14.8(0.5)bc/A 14.9(0.8)ab/A 15.9(0.7)a/A
Page 128
120
Table 3:
Retrograded amylopectin (J/g of starch) of RTE pasta meals over storage. Standard deviations are
given in parenthesis following the means values; different letters indicate significant difference
among samples (p ≤ 0.05); small letters indicate differences during storage; capital letters indicate
differences among the samples.
Days 0 7 14 28 42 63 90
STD-59 - 0.9(0.3)c/A 0.9(0.1)c/A 1.3(0.1)bc/B 1.7(0.4)b/B 1.7(0.2)b/BC 3.1(0.2)a/AB
GLU15-59 - 0.8(0.1)c/A 1.2(0.2)c/A 1.5(0.4)bc/B 2.0(0.4)bc/B 4.4(0.5)a/A 3.2(0.1)ab/AB
GLY15-59 - - 1.3(0.1)b/A 2.4(0.7)ab/AB 3.7(0.6)a/A 3.1(0.5)ab/B 3.9(0.1)a/A
GLU3GLY12-59 - 0.3(0.1)b/A 1.4(0.5)b/A 3.5(0.6)a/A 1.0(0.1)b/B 1.3(0.5)b/C 3.2(0.3)a/B
STD-62 - 1.4(0.1)abc 0.6(0.1)c 1.2(0.3)bc/AB 2.0(0.2)ab/B 2.6(0.9)a/A 2.6(0.2)ab/B
GLY15-62 - - 1.3(0.3)b 1.3(0.2)b/A 1.4(0.3) b/A 1.8(0.2)ab/A 3.1(1.0)a/A
TiO2-62 - - - 0.5(0.1)b/B 1.1(0.4)ab/C 2.2(0.8)a/A 1.5(0.3)ab/C
STD-65 - 0.5(0.2)b 0.9(0.2)b 1.2(0.2)A 0.7(0.1)b/B 1.3(0.3)b/BC 2.6(0.6)a/A
GLU15-65 - - - 1.0(0.3)a/A 1.0(0.4)a/B 1.1(0.3)a/C 1.7(0.9)a/A
GLY15-65 - - - 0.9(0.2)b/A 0.9(0.2)b/B 3.8(0.4)a/A 2.8(0.5)a/A
GLU12GLY3-65 - 0.5(0.1)c 0.8(0.1)c 0.8(0.1)c/A 2.1(0.1)b/A 2.6(0.8)ab/A 3.1(0.2)a/A
Page 129
121
Table 4
Population and relaxation time of the more abundant protons of RTE pasta meals over storage.
Standard deviations are given in parenthesis following the means values; different letters indicate
significant difference among samples (p ≤ 0.05); small letters indicate differences during storage;
capital letters indicate differences among the samples.
Days 0 7 14 28 42 63 90
STD-59 75.5(0.5)a/B 77.4(0.3)a/B 79.7(0.8)a/B 80.1(1.8)a/AB 63.4(3.1)b/B 60.5(4.8)b/C 59.4(2.1)b/B
GLU15-59 66.2(1.6)c/C 72.9(1.9)b/A 77.7(1.6)a/C 78.1(1.4)a/BC 77.4(1.8)a/A 76.2(1.5)a/B 47.1(2.5)d/C
GLY15-59 76.1(0.4)c/B 74.5(2.4)bc/BC 78.3(1.0)ab/B 76.9(2.6)bc/C 74.6(2.1)c/A 80.2(1.0)a/A 80.6(1.0)a/A
GLU3GLY12-59 80.3(1.1)ab/A 82.1(1.3)a/A 82.1(1.6)a/A 82.7(1.1)a/A 73.2(3.6)c/A 77.2(0.9)b/AB 80.7(2.7)a/A
STD-62 61.8(3.6)b/B 78.4(1.6)a/A 77.5(0.9)a/B 81.3(0.8)a/A 80.7(0.9)a/A 56.1(2.6)c/C 56.9(3.5)c/C
GLY15-62 80.3(0.6)bc/A 74.9(2.8)d/B 79.8(0.8)c/A 82.1(1.4)ab/A 82.0(1.1)abc/A 82.1(1.3)ab/A 83.6(0.7)a/A
TiO2-62 36.8(6.0)c/C 72.3(1.6)b/B 80.0(1.4)a/A 80.3(2.1)a/A 78.3(0.7)a/B 70.4(1.6)b/B 68.3(2.7)b/B
STD-65 53.4(1.1)e/D 69.5(3.9)d/B 77.3(0.9)bc/C 76.3(3.1)bc/B 81.8(1.0)a/A 73.3(3.7)cd/A 79.9(1.3)ab/B
GLU15-65 69.4(0.4)c/C 72.5(2.0)abc/B 69.8(3.6)bc/B 69.7(3.2)bc/C 78.2(2.8)a/B 75.8(3.3)ab/A 77.0(0.7)a/C
GLY15-65 80.3(0.7)b/A 80.5(1.2)b/A 82.5(0.9)a/A 81.8(1.2)ab/A 82.6(1.4)a/A 76.0(0.7)c/A 83.1(0.9)a/A
GLU12GLY3-65 75.8(0.8)b/B 77.3(1.5)ab/A 79.6(1.1)a/B 78.5(2.2)ab/AB 78.3(1.7)ab/B 71.9(1.6)c/A 57.7(2.4)d/D
T2E
Days 0 7 14 28 42 63 90
STD-59 32.8(0.3)a/C 32.4(0.3)a/C 32.3(0.1)a/C 31.2(0.3)a/B 27.8(0.9)b/C 23.1(1.7)d/D 25.0(0.9)c/C
GLU15-59 20.0(0.8)f/D 31.5(0.4)b/D 33.2(2.1)a/B 29.4(0.1)c/C 30.5(0.2)bc/B 26.2(0.5)d/C 22.0(1.5)e/D
GLY15-59 37.7(0.3)a/B 36.3(0.7)b/B 33.7(0.5)c/B 32.3(0.8)d/B 30.9(0.5)e/B 31.4(0.3)ef/B 30.3(0.5)f/B
GLU3GLY12-59 48.9(0.5)a/A 45.8(0.1)b/A 45.6(0.3)b/A 43.1(0.4)c/A 40.1(1.1)d/A 38.7(0.2)de/A 39.5(0.4)e/A
STD-62 30.1(5.7)b/B 37.6(1.6)a/B 33.0(0.4)ab/C 32.1(0.2)b/C 31.0(0.5)b/B 21.2(1.0)c/B 24.8(1.2)c/B
GLY15-62 43.2(0.2)a/A 39.4(0.4)b/A 39.2(0.1)b/A 37.9(0.5)c/A 35.7(0.5)e/A 36.6(0.2)d/A 34.7(0.2)f/A
TiO2-62 29.7(3.9)d/B 38.1(0.1)a/B 36.0(0.3)ab/B 33.7(0.6)bc/B 31.2(0.4)cd/B 15.0(1.1)e/C 16.5(0.8)e/C
STD-65 35.9(0.3)ab/C 22.1(2.0)d/D 37.2(0.4)a/B 33.2(0.6)c/B 34.0(0.3)bc/AB 21.9(1.3)d/C 13.3(0.6)e/D
GLU15-65 47.3(0.1)a/A 37.6(2.0)b/B 33.7(0.1)bc/D 27.0(3.2)c/C 27.7(6.3)c/C 18.0(2.3)d/D 19.1(0.5)d/C
GLY15-65 47.5(0.2)a/A 44.8(0.3)b/A 43.7(0.4)c/A 40.6(0.8)d/A 39.4(0.4)e/A 40.6(0.2)d/A 37.1(0.4)f/A
GLU12GLY3-65 38.7(0.2)a/B 34.9(0.2)b/C 35.3(0.3)b/C 34.4(0.5)b/B 30.4(0.3)c/BC 28.5(0.5)d/B 20.9(1.0)e/B
Page 130
122
Table 5
Population and relaxation time of the more mobile protons of RTE pasta meals over storage.
Standard deviations are given in parenthesis following the means values; different letters indicate
significant difference among samples (p ≤ 0.05); small letters indicate differences during storage;
capital letters indicate differences among the samples.
Population F
Days 0 7 14 28 42 63 90
STD-59 5.8(0.8)b/B 4.0(0.5)b/AB 2.5(0.1)b/B 3.8(1.8)b/B 23.6(3.1)a/A 26.6(4.3)a/A 27.4(2.2)a/B
GLU15-59 20.5(1.5)b/A 4.5(0.9)d/A 4.1(0.7)d/A 7.0(1.7)cd/A 3.7(1.0)cd/B 8.6(1.7)c/B 39.7(2.5)a/A
GLY15-59 3.1(0.1)a/C 3.1(0.2)a/B 2.9(0.1)ab/B 3.0(0.2)a/B 3.0(0.2)ab/B 2.8(0.1)b/C 3.1(0.2)a/D
GLU3GLY12-59 4.9(0.8)c/B 3.3(0.8)c/B 3.9(0.7)c/A 3.1(0.8)c/B 14.8(4.7)a/A 11.8(1.2)ab/B 9.3(1.9)b/C
STD-62 24.4(3.2)b/B 3.5(0.6)d/AB 8.1(0.5)c/A 4.9(0.4)cd/A 5.1(0.6)cd/B 32.4(2.4)a/A 32.5(3.4)a/A
GLY15-62 2.4(0.1)c/C 3.8(0.4)a/A 2.5(0.2)c/C 2.4(0.3)c/B 2.4(0.1)c/C 2.4(0.1)c/C 2.9(0.2)b/C
TiO2-62 36.8(6.0)a/A 2.9(0.2)c/B 4.5(0.8)c/B 4.3(0.8)c/A 7.4(2.0)c/A 18.0(1.1)b/B 20.8(2.2)b/B
STD-65 34.6(1.4)a/A 21.7(3.6)b/A 9.3(1.6)cd/B 12.2(4.1)c/B 5.8(1.9)d/B 17.3(3.5)b/A 9.2(0.8)cd/C
GLU15-65 5.0(0.1)c/B 13.3(2.8)ab/B 19.8(2.8)ab/A 19.7(3.6)a/A 10.3(4.3)bc/A 13.7(3.1)ab/A 12.1(0.7)b/B
GLY15-65 2.8(0.2)b/C 2.8(0.4)b/C 2.6(0.3)b/C 2.4(0.3)b/C 2.3(0.4)b/C 2.4(0.5)b/B 4.9(1.1)a/D
GLU12GLY3-65 5.8(0.2)cd/B 4.7(0.6)cd/C 4.3(0.7)d/C 4.5(0.8)d/C 6.8(1.1)c/B 14.2(1.6)b/A 28.5(2.4)a/A
T2F
Days 0 7 14 28 42 63 90
STD-59 79.7(5.6)b/C 87.4(7.4)b/C 108.4(6.5)a/C 103.4(2.9)a/C 48.2(1.5)c/D 38.3(3.1)d/D 41.6(1.8)cd/C
GLU15-59 41.8(0.4)e/D 95.7(3.7)b/C 101.9(4.7)b/C 65.6(4.6)c/D 96.5(4.1)ab/B 53.7(2.1)d/C 35.7(1.1)f/D
GLY15-59 228.1(3.6)c/A 251.4(6.9)b/A 248.9(6.9)b/A 269.2(7.2)a/A 266.1(6.2)a/A 233.6(6.5)c/A 182.7(4.3)d/A
GLU3GLY12-59 124.2(4.2)c/B 142.6(4.7)b/B 138.2(2.5)b/B 151.6(4.2)a/B 67.8(3.6)e/C 71.7(1.5)de/B 76.6(5.0)d/B
STD-62 51.6(6.7)d/B 116.7(4.9)a/C 73.3(2.8)c/C 85.0(3.6)b/C 82.9(3.2)b/B 38.6(0.9)e/B 39.2(1.5)e/B
GLY15-62 232.4(4.6)b/A 218.7(4.5)c/A 230.5(4.8)b/A 253.9(5.6)a/A 234.8(4.8)b/A 219.5(7.3)c/A 154.3(1.1)d/A
TiO2-62 49.9(4.8)d/B 130.4(4.7)a/B 97.8(2.6)b/B 98.8(3.5)b/B 75.8(7.0)c/B 34.4(0.6)e/B 36.0(0.3)e/C
STD-65 57.5(0.5)d/D 48.6(1.0)e/D 80.0(3.7)b/C 63.4(5.9)c/C 85.1(3.6)a/B 40.4(0.9)f/C 36.6(0.2)f/C
GLU15-65 117.7(2.4)a/B 61.6(3.6)b/C 56.0(4.0)b/D 47.7(3.2)c/D 48.1(5.8)c/D 41.3(0.8)c/C 43.3(0.3)c/B
GLY15-65 180.3(4.9)cd/A 176.2(5.5)d/A 188.3(5.5)bc/A 205.2(4.0)a/A 195.4(4.2)ab/A 162.8(6.3)e/A 101.3(0.4)f/A
GLU12GLY3-65 102.4(4.5)b/C 102.6(4.5)b/B 103.5(4.9)b/B 111.3(2.5)a/B 69.8(1.7)c/C 54.8(1.9)d/B 36.3(1.1)e/C
Page 131
123
Figure 1
Time (ms)
0.1 1 10 100 1000 10000
Rela
tive inte
nsity
0
20
40
60
80
100
120
Pop C Pop D
Pop E
Pop F
Page 132
124
Figure caption
Figure 1
Characteristic 1H T2 relaxation time distribution for cooked pasta with different formulation
Page 133
125
SECTION C
CHARACTERIZATION OF TOMATO SAUCE
Page 134
126
Diantom et al., to be submitted
Effect of added hydrocolloids on physico-chemical properties of tomato sauce
Page 135
127
Abstract
The effect of different hydrocolloids on physico-chemical properties of tomato sauce was explored.
Guar, xanthan, carboxy methyl cellulose (CMC), locust bean gum, potato fiber, milk, potato and
soy proteins were added to tomato sauce at different concentrations (0, 0.5%, 1% and 1.5%). The
macroscopic water status indicators (water activity and moisture content), rheological properties
(Bostwick consistency and apparent viscosity), color and proton molecular mobility indicators (1H
FID, 1H T2 and
1H D) were investigated.
water activity significantly decreased in processed samples but it was not affected by the added
hydrocolloids, except in the case of potato fiber which significantly decreased water activity.
Bostwick consistency and apparent viscosity were significantly enhanced in the presence of
xanthan, locust bean gum, guar and CMC. Changes were also observed in protons molecular
mobility indicators, which significantly decreased with increasing hydrocolloid concentration.
Keywords Tomato sauce, hydrocolloids Physico-chemical properties . 1H NMR mobility
Page 136
128
1-Introduction
Tomatoes are an important agriculture crop which is great part of the human diet. Tomato can be
used fresh but important quantities are processed to obtain different products, such as tomato juice,
paste, puree, ketchup and sauce. Tomato sauce is a common ingredient used as a condiment, for
example in pasta meals, both fresh and ready to eat (RTE) products. RTE pasta meals available in
the market can be divided in two categories, with tomato sauce being in strict contact with pasta or
placed in a separate compartment from the pasta phase. The presence of tomato sauce in strict
contact with RTE pasta might compromise the quality of the product during storage throughout
exchanges (mainly of water) occurring between the two product phases. In a recent study, Carini et
al. (2013) studied physico-chemical properties and water status of a cooked and sterilized RTE
“fusilli all’arrabbiata” pasta meal (pasta in contact with tomato sauce). Water migration between
pasta and tomato sauce phases was observed by means of proton molecular mobility indicators but
not of macroscopic water status descriptors (i.e. moisture content and water activity), highlighting
the importance of regulating water migration between pasta and sauce with the aim to improve
products quality and stability during storage.
Thus, to enhance RTE pasta meals quality during storage, the improvement of tomato sauce
performance and stability should be addressed, with a proper management of sauce formulation. To
this aim, different actions are available, according to the good practice of tomato sauce production.
For example, the use of additional ingredients, such as citric acid and sodium chloride (NaCl), in
conjunction with high pressure treatment (Palaza et al., 2003) significantly enhanced colour stability
in tomato sauce due to inhibition of enzymes responsible for the browning of tomato sauce. Carini
et al. (2014) investigated the effect of flour, gelatin and salt on physico-chemical properties of
tomato sauce, reporting that salt enhanced the colour of tomato sauce, while gelatin and flour
increased its consistency and viscosity. Salt, gelatin, and flour also differently affected water status
at a molecular level (proton NMR molecular) but they affected macroscopic water descriptors with
Page 137
129
water activity, in particular, significantly dropping only in the presence of added salt (also in
combination with flour and gelatin) and not of only gelatin or flour.
Long chain polymers, such as hydrocolloids (polysaccharides and proteins), are extensively used in
the food industry, in different food systems as soups, beverages, desserts, ketchups, sauces, salad
dressings due to their functional properties (Saha & Bhattacharya, 2010), as thickening (Philips et
al., 1986; Philips & Williams, 2000; Gibinski et al., 2006; Sikora et al., 2007; Kok et al. 1999;
Wang et al., 2000; Dunstan et al., 2001; Alexander, 1999 a, b; Casas et al., 2000; Kulicke et al.,
1996; Murray, 2000; Sahin & Ozdemir, 2004; Koocheki et al., 2009; Saha & Bhattacharya, 2010),
gelling (Aguilera 1992; Oakenfull, 1987, Philips and Williams, 2000; Williams, 2006; Saha &
Bhattacharya, 2010), emulsifying and stabilizing (Milani & Maleki, 2012) agents. The investigation
of the effect of different hydrocolloids on tomato sauce properties may help in the selection of
ingredients that might be used in a pasta meal recipe to improve its shelf-stability.
This study aims, therefore, to explore the effect of different hydrocolloids on physico-chemical
properties of tomato sauce, investigating macroscopic water status indicators, rheological
properties, color as well as proton molecular mobility indicators.
2. MATERIALS AND METHODS
2.1 Materials
Tomato pulp without salt (Siccagno di Valledolmo, Soc. Coop. Rinascita s.r.l., Palermo, Italy,
STD1) was purchased from a local supermarket. All the tomato pulp used in this study originated
from the same industrial production.Xanthan (Xan), Guar (G), Locust bean gum (LBG) and
Carboxy Methyl Cellulose (CMC) gums were provided from Chimab, S.p.a (Campodaresego,
Italy), soy proteins (SP), potato proteins (PP) and milk proteins (MP) from Solae Belgium N.V
(Ieper, Belgium), and potato fiber (PF) from HI-FOOD S.p.a (Collecchio, Parma, Italy).
Tomato pulp (control, STD1) and tomato pulp added with 0.5, 1 and 1.5% of the hydrocolloids
were mixed using an Osterizer® blender (Sunbeam, USA?) for 2 min at low speed (2). 400 g of the
Page 138
130
mixed tomato sauces were inserted in sealed glass jars, placed into a water bath at 100°C for 30 min
to simulate a traditional tomato sauce production. The jars were then cooled at room temperature for
12 hours before analysis. Tomato pulp was also analysed prior to heating (STD2).
2.2 Methods
2.2.1 Moisture content
Moisture content (MC, % g water / 100 g product) of tomato sauces was determined by weight loss
by drying in a forced-air oven (ISCO NSV 9035, ISCO, Milan, Italy) at 80°C to constant weight. At
least triplicate tomato sauce samples were analysed.
2.2.2 Water activity
Water activity of tomato sauces were measured at 25°C with an Aqualab 4TE (Decagon Devices,
Inc. WA, USA). At least triplicate tomato sauce samples were analysed.
2.2.3 Color
The a∗ value (degree of redness) and b∗ value (degree of yellowness) were measured (Colorimeter
Minolta CM 2600d, Minolta Co., Osaka, Japan) equipped with D65 at 10° position of the standard
observer (CIE, 1978). The a∗/b∗ ratio was used to describe tomato sauces redness (Barreiro, Milano,
Sandoval, 1997; Batu, 2004; Weatheral & Lee, 1991; Yang & Chinnan, 1988). At least twelve
measurements were taken for each tomato sauce sample.
2.2.4 Bostwick consistency
Bostwick consistency was measured with a Bostwick Consistometer (LS 100, Laboscientifica,
Parma, Italy). The Bostwick consistometer sample chamber was filled with 100 ml of tomato sauce,
and then the gate of the chamber was released to allow for tomato sauce to flow. The distance (cm)
travelled by the sample was recorded after 30 s (Barringer, Azam, Heskitt, & Sastry, 1998). At least
three measurements were taken for each tomato sauce sample.
2.2.5 Apparent viscosity
Page 139
131
Tomato sauces apparent viscosity was measured with a Brookfield digital viscometer (MODEL
LVDV-I PRIME) using spindle S64 at different speeds (1.5, 3, 6, 10, 12, 20, 30, 50, 60 and 100
rpm). Sauce samples (about 300 ml) were inserted in 300 ml beaker. The apparent viscosity value
(Pa*s) was recorded after 60 seconds. The recorded data were used to calculate the shear rate (γ)
(equation 1) and shear stress (τ) (equation 2). The non-Newtonian model (equation 3) was used to
fit the shear stress vs shear rate curves to obtain the flow index n which represents the fluid
behavior, with 0 < n < 1 indicative of a pseudoplastic behaviour, and K which represent the
consistency coefficient.
γ = C * ω equation 1
where C is the probe constant and ω is the speed (rpm)
τ = γ * η equation 2
where η is the viscosity
τ = K * γn equation 3
where K is the consistency coefficient and n is the flow index
2.2.6 Protons Nuclear Magnetic Resonance (1H NMR )
A low resolution (20 MHz) 1H NMR spectrometer (the MiniSpec, Bruker Biospin, Milano, Italy)
operating at 25.0 ± 0.1 °C was used. About 4 grams of tomato sauce (10 mm high) were placed into
a 10 mm NMR tube that was then sealed with Parafilm® to prevent moisture loss during the NMR
experiment. 1H FIDs were acquired using a single 90° pulse, followed by a dwell time of 7 µs, a
recycle delay of 5 s and a 8 ms acquisition window. 1H FIDs were analysed only in the time range
7–100 µs where the homogeneity of magnetic field was assured. The curves were fitted with a two
components model (exponential and gaussian; Le Grand, Cambert, & Mariette, 2007; Sigmaplot,
v6, Systat Software Inc., USA):
ƒ (t) = y0 + A*exp(-t/TA) + B*exp[-(t/TB)2]
Page 140
132
where y0 is the FID decay offset, A and B are the intensities of each relaxation component, TA and
TB are the apparent relaxation times.
T2 relaxation time was measured with a CPMG pulse sequence with a recycle delay of 3 s (≥5 1H
T1), an interpulse spacing of 0.04 ms and 10000 data points. 1H T2 curves were analysed as quasi-
continuous distributions of relaxation times using a UPENWin software (Alma Mater Studiorum,
Bologna, Italy). Default values for all UPEN settings were used with the exception of one parameter
(LoXtrap) that was set to 1 to avoid extrapolation of relaxation times shorter than the first
experimental point. 1H T2 CPMG relaxation decays were also fitted with a discrete exponential
model (Sigmaplot, v.6, Systat Software Inc., USA).
Proton self-diffusion coefficient (1H D) was measured at 25°C with a pulsed-field gradient spin
echo (PFGSE) pulse sequence and a 30% gradient. The instrument was calibrated with water at
25°C (D = 2.29*10-9
m2 /s).
2.2.7 Statistical analysis
Statistical analysis was carried out with SPSS software (Version 22.0, IBM SPSS Statistics,
Armonk, New York, USA). Significant differences (p ≤ 0.05) among different samples were
verified with by one-way-analysis of variance (ANOVA) with a Tukey-high and LSD significant
difference test.
3- Results and Discussion
3.1 – Moisture content and water activity
Moisture content of STD1 and STD2 was 91% (g water / 100g product), indicating that moisture
content was not affected by heating, as expected since it was carried out in sealed jars. On the
contrary, water activity was significantly reduced by the heating process (Table 1), possibly because
of the establishment of stronger interactions between water and macromolecules during heating.
Even if the changes induced by hydrocolloids were very small, moisture content significantly
Page 141
133
decreased with increasing hydrocolloids concentration in all samples, as expected, except in CMC
where no changes were observed between 1% and 1.5% of hydrocolloids, while SP and PP showed
changes in moisture content only at higher concentration. The ability to bind water was correlated to
the concentration and type of hydrocolloid. In fact at 0.5% of hydrocolloids, LBG showed the
highest capacity to hold water, followed by PP and CMC gum, while Xan and MP showed the
lowest ability to bind water. The interactions between water and hydrocolloids were correlated to
the type and concentration of hydrocolloids. This might be associated to the fact that these
hydrocolloids present different molecular structure.
The addition of hydrocolloids did not affect the water activity, independently of their nature and
concentration, except in the case of potato fiber, which significantly reduced water activity in the
same manner at different concentrations, suggesting that potato fiber was able to bind water more
strongly than the other hydrocolloids used in this study.
3.4 Color
The effect of added hydrocolloids and processing on tomato sauce color was investigated with
Minolta Colorimeter, and the redness index, a*/b* ratio, was carried out (Table 1). Heated tomato
sauce (STD1) showed lower value of redness index than the unheated tomato sauce (STD2),
indicating a reducing effect of heating on the redness of tomato saucePresence of hydrocolloids
drastically changed redness index of the sauce. At 0.5% of hydrocolloids, the redness index ratio
significantly increased in all samples, except in the case PF and MP, which seemed to not affect the
color of tomato sauce. Thus hydrocolloids exalted the color of tomato sauce. This might be
associated to a probable effect of hydrocolloids on burning reaction, with an inhibition of Maillard
reaction, possibly decreasing water availability and reducing the reaction rate. Further increase in
hydrocolloids concentration further decreased redness of all samples, except in the presence of
CMC, Xan, SP and MP. The redness index significantly decreased in the presence of 1% of CMC
while it increased in the presence of 1% of SP, but no changes was observed in the presence of
Page 142
134
these hydrocolloids at 0.5% and 1.5%. In Xan changes in redness index did not depend on
hydrocolloid concentration.
3.5 – Bostwick consistency
The running distance on a inclined plane of heated tomato sauce (STD1) significantly decreased as
compared to STD2, indicating an enhanced consistency resulting from processing. Heating
probably allows the main components of tomato sauce to aggregate, interactions between water and
carotenoids were promoted, and a more rigid network was formed conferring a high resistance to
flow to the sample.
Changes in Bostwick consistency were related to the type of hydrocolloid and concentration. At
0.5% hydrocolloid addition, Bostwick consistency was significantly increased in the presence of
PF, LBG, PP, and SP, significantly reduced in the presence of CMC and Guar, while it did not
significantly change with the addition of Xan and MP. Bostwick consistency significantly increased
with increasing hydrocolloids concentration, more markedly in Xan (from 7.1 ±0.3 cm at 0.5% to
2.5 ± 0.1 at 1.5%) and PF (6.8 ± 0.3 at 0.5% to 2.8 ± 0.3 at 1.5%).
The changes in the consistency might be probably attributed to the formation of a network
following water binding by hydrocolloids molecules, inducing samples to resist to the flow (Gujral
et al., 2002) Sahim & Ozdemir (2004) reported that ketchup fluidity was significantly affected by
the type and concentration of hydrocolloids: xanthan caused the maximum increase of Bostwick
consistency of ketchup, followed by guar and locust bean gums and carboxy methyl cellulose,
respectively. Carini et al. (2014) reported a strong increase in Bostwick consistency due to the
addition of gelatin and flour while the NaCl reduced the consistency.
3.6 Apparent viscosity
Apparent viscosity decreased with increasing probe speed in all samples, which is the typical
behavior of pseudoplastic systems, as tomato sauce (Figure 1). Tomato sauce apparent viscosity
was affected by formulation, and was strongly increased in the presence of all hydrocolloids. The
increase in viscosity was more marked in the presence of Guar, LBG, Xan and CMC, and did not
Page 143
135
allow to measure viscosity at higher concentration (1.5%) and higher speed (100rpm for Guar, 50,
60 and 100 rpm for Xan and CMC, 20, 30, 50, 60 and 100 for LBG) due to exceeding of the
maximum detectable value for the instrument. Apparent viscosity increased with increasing
hydrocolloids concentration (data not shown), except for PP and MP where viscosity was reduced at
higher concentration.
These results were in agreement with the Power law (equation 3) fitting results, consistency
coefficient and flow behavior index, that are reported in Table 2. The model was able to properly
describe the flow behavior of tomato sauce, with R2 values in the range 0.901-0.999. The flow
behavior index behavior (n) was < 1 in all samples, indicating the pseudoplastic (shear thinning)
nature of tomato sauce. The flow index and consistency coefficient were comparable between
tomato pulp before (STD2) and after (STD1) heating, indicating no effect of processing on flow
behavior. The addition of hydrocolloids significantly affected the flow model parameters. For all
hydrocolloids the flow behavior index decreased, more markedly in PP, where it was about 0.08 at
0.5%. The addition of different hydrocolloids induced changes in consistency coefficient (K). At
0.5% the consistency coefficient increased in all samples, except for SP where K was reduced as
compared to STD1. The consistency coefficient increased with increasing concentration in all
samples (Table 2) except for SP where it was approximately constant. Similar changes in viscosity
parameters, consistency coefficient and flow behavior index, were reported by Dervisogh & Kokin
(1986), Rani & Bains (1987), Bottiglieri et al. (1991), Sanchez et al. (1995), Sahim & Ozdemir
(2004), Sharoba et al. (2005), Koockeki et al. (2009) and Carini et al. (2014), and they correlated
those changes to the hydrocolloids capacity to bind water, which might generate the formation of
new network.
3.7 Protons Nuclear Magnetic Resonance (1H NMR )
To better investigate the effect of hydrocolloids on physico-chemical properties at a molecular
level, proton mobility was studied with low resolution 1H NMR (20 MHz) through different
Page 144
136
parameters, Free Induction Decay (1H FID), rotational spin-spin transverse relaxation time (
1H T2)
and self-diffusion coefficient (D).
1H FIDs were fit with a two component model and two proton populations were named population
A and B (data not shown). The more rigid protons population (population A) was ~3% relaxing at ~
0.01 ms while population B, the more represented (~97%) relaxed at ~ 1.2 ms, for both standards
(STD 1 and STD 2), indicating that heating did not affect the more rigid FID protons mobility. The
protons observed in the 1H FIDs were not affected by hydrocolloids and concentration (data not
shown), except for PF where relevant changes were observed at 1.5%. In fact the more mobile
protons (population B) was about 51% and relaxed at about 0.22 ms, indicating a reduced mobility
in this sample. This might be correlated to stronger interactions between water and hydrocolloids
which have generated the formation of a rigid network, and this was in agreement with the strong
increase of Bostwick consistency.
1H T2 representative distributions of tomato sauce with different hydrocolloid are showed in Figure
2. Two unresolved populations were observed in all samples, except for Xan which exhibited three
unresolved populations. According to the distributions, 1H T2 curves were fitted using a bi-
exponential equation for all samples and tri-exponential for Xan. Populations were named
population C (pop C) and population D (pop D) and their corresponding relaxation times T2C and
T2D, respectively. The three populations observed in Xan were named population C, population D
and population E and their corresponding relaxation times T2C, T2D, T2E, respectively. The fitting
results are showed in Table 3.
The more abundant and more mobile population D was significantly larger in STD1 as compared to
the untreated sample STD2, and consequently the less mobile protons population C was less
represented in STD1. The corresponding relaxation times, T2C and T2D significantly decreased in
processed sauce (STD1) (Table 3). The observed changes have been associated to an effect of
processing, which might have promoted the formation of a network of interactions between water
and hydrocolloids and, consequently, a decreased molecular mobility. At the same time, processing
Page 145
137
increased the more mobile protons (population D), although they also became more mobile (higher
T2D). Similar relaxation times in tomato sauce were reported in a recent paper, Carini et al. (2014)..
1H T2 mobility in raw tomato was also previously investigated (Musse et al., 2009), and protons
with different mobility were observed, in relation to the cell compartmentalization, and attributed to
exchangeable solutes (< 100 ms), cell walls (≈100ms), cytoplasm (400-600 ms) and vacuole (900-
1600 ms) protons. A very different mobility was observed as, in the present study, cell
compartments were altered by processing, resulting in the observation of an “averaged” mobility
originating from all protons into tomato pulp matrix, that were not located in separated
compartments.
Hydrocolloids significantly affected tomato sauce proton mobility, in a manner dependent on
hydrocolloids type. At 0.5 % the more abundant population, pop D, was significantly decreased in
all samples as compared to STD1, except for CMC and LGB, where it was significantly increased
(Table 3). These changes in protons mobility might be related to the interactions of each specific
hydrocolloid with water, with a modification of the sauce structure which became more rigid. The
increase in hydrocolloids concentration induced a significant decrease of the more abundant and
more mobile protons abundance, except for CMC where population D significantly increased with
increasing concentration. Consequently population C significantly increase in all samples while it
decreased in the presence of CMC. These changes in proton distribution were in agreement with
those observed in Bostwick consistency, except in the case of Guar, which showed a lower
Bostwick consistency and a decrease in the more abundant and more mobile proton populations.
A reduced mobility was also indicated by the decrease in T2C and T2D. Hydrocolloid concentration
generally decreased molecular mobility (T2D and T2C considerably decreased significantly
decreased) in all samples.
Xan exhibited a very different mobility, with an additional more mobile population (population E)
and the splitting of the correspondent population C observable in the other samples in two
Page 146
138
populations, indicating a higher molecular mobility and a different structure of this sample (Table
3).
Proton self-diffusion coefficient (1H D) values are reported Table 3. Both standards showed similar
D values (1.898 ± 0.003*10-9
m2
/s in STD1 and 1.901 ± 0.004 *10-9
m2
/s STD2 ) , indicating that
processing did not affect translational mobility. The presence of hydrocolloids induced changes in
1H D values. At 0.5% of hydrocolloids
1H D was significantly decreased in LBG and PP, and it
significantly increased in Xan and SP, while it seemed to not be significantly affected by the rest of
added hydrocolloids. D significantly decreased with increasing hydrocolloids concentration in all
samples, except for LBG and SP. This decrease might be correlated to the strong interactions with
tomato sauce components/water with a matrix structure that hindered protons translational mobility.
Similar results were reported by Carini et al., (2014), due to the addition of salt, flour and gelatin to
tomato sauce. In the case of LBG tomato sauce D significantly decreased after the addition of 1%
then it remained constant, while SP induced significant changes in 1H D only at higher
concentration (1.5%). However there was no linear correlation between the proton molecular
mobility and the proton self-diffusion coefficient.
Page 147
139
4- Conclusions
The effect of eight added hydrocolloids and processing on physico-chemical properties of tomato
sauce was explored at different time-space levels. Processing affected macroscopic water status
indicator (water activity), rheological attributes (Bostwick consistency), color and molecular
mobility parameters. Moisture content decreased with increasing amount of added hydrocolloid, as
expected. Whereas water activity was not affected by the added hydrocolloids except in the case of
potato fiber, which significantly reduced water activity. Xan, LBG, Guar and CMC induced strong
changes in rheological properties (Bostwick consistency and apparent viscosity). Hydrocolloids also
induced changes in the molecular mobility indicators.
These results suggested that the addition of hydrocolloids into tomato sauce formulation strongly
affects its physico-chemical at different time-space levels but the effect of single hydrocolloid
might be carefully considered during the production of tomato sauce. In the same way,
hydrocolloids might allow to control the changes in physico-chemical properties of RTE pasta
/sauce meals.
Page 148
140
5- References
Aguilera, J. M. (1992) Generation of engineered structures in gels. In: Schwartzberg HG, Hartel
RW (eds) Physical chemistry of foods. Marcel Dekker, New York, pp 387–421
Alexander, R. J. (1999a) Hydrocolloid gums. Part I: Natural products. Cereal Foods World 44:684–
687
Alexander, R. J. (1999b) Hydrocolloid gums. Part II: Synthetic products. Cereal Foods World
44:722–725
Barreiro, J. A., Milano, M., & Sandoval, A. J. (1997). Kinetics of colour change of double
concentrated tomato paste during thermal treatment. Journal of Food Engineering, 33(3), 359-371.
Barringer, S. A., Azam, A. S., Heskitt, B., & Sastry, S. (1998). Online Prediction Of Bostwick
Consistency From Pressure Differential In Pipe Flow For Ketchup And Related Tomato Products.
Journal Of Food Processing And Preservation, 22(3), 211-220.
Batu, A. (2004). Determination of acceptable firmness and colour values of tomatoes. Journal of
Food Engineering, 61(3), 471-475.
Bottiglieri, P., De Sio, F., Fasanaro, G., Mojoli, G., Impembo, M., & Castaldo, D. (1991).
Rheological characterization of ketchup. Journal of Food Quality, 14, 497–512.
Carini, E., Curti, E., Littardi, P., Luzzini, M., & Vittadini, E. (2013). Water dynamics of ready to eat
shelf stable pasta meals during storage. Innovative Food Science and
Carini, E., Mora, B., Curti, E., Luzzini, M., Vittadini, E. (2014). Tomato sauce: effect of different
ingredients on ¹H NMR mobility and physico-chemical properties. LWT- Food Science and
Technology
Dervisoglu, M. & Kokini, J.L. (1986). Steady shear rheology and fluid mechanics of four semi-
solid foods. Journal of Food Science, 51,
Dunstan, D. E., Chen, Y., Liao, M. L., Salvatore, R., Boger, D. V., Prica, M. (2001) Structure and
rheology of κ-carrageenan/locust bean gum gels. Food Hydrocolloids 15:475–484
Page 149
141
Gibinski, M., Kowaski, S., Sady, M., Krawontka, J., Tonasik, P., Sikora, M. (2006) Thickening of
sweet and sour sauces with various polysaccharide combinations. J Food Eng 75:407–414
Gujral, H. S., Sharma, A., & Singh, N. (2002). Effect of hydrocolloids, storage temperature, and
duration on the consistency of tomato ketchup. International Journal of Food Properties, 5, 179–
191.
Hidalgo, A., & Pompei, C. (2000). Hydroxymethylfurfural and furosine reaction kinetics in tomato
products. Journal of agricultural and food chemistry, 48(1), 78-82.
Hidalgo, A., Pompei, C., & Zambuto, R. (1998). Heat damage evaluation during tomato products
processing. Journal of Agricultural and Food Chemistry, 46(10), 4387-4390.
Kok, M. S., Hill, S.E., Mitchell, J. R. (1999) Viscosity of galactomannans during high temperature
processing: influence of degradation and solubilization. Food Hydrocolloids 13:535–542
Koocheki, A., Ghandi, A., Razavi, S., Mortazavi, S. A., & Vasiljevic, T. (2009). The rheological
properties of ketchup as a function of different hydrocolloids and temperature. International journal
of food science & technology, 44(3), 596-602.
Kulicke, W. M., Kull, A. H., Kull, W., Thielking, H. (1996) Characterization of aqueous
carboxymethyl cellulose solutions in terms of their molecular structure and its influence on
rheological behaviour.
Le Grand, F., Cambert, M., & Mariette, F. (2007). NMR signal analysis to characterize solid,
aqueous, and lipid phases in baked cakes. Journal of Agriculture and Food Chemistry, 55, 10947–
10952.
Milani J, Maleki G. (2012) Hydrocolloids in Food Industry. In: Valdez B. Food industrial
processes-methods and equipment. Tech, Rijeka, Croatia, pp 17-38
Morris VJ , (1986). Gelation of polysaccharides, in Functional Properties of Food Macromolecules,
Ed by Mitchell JR and Ledward DA, Elsevier Applied Science Publishers, London, UK, pp 121–
171
Page 150
142
Murray, J. C. F. (2000) Cellulosics. In: Philips GO, Williams PA (eds) Handbook of hydrocolloids.
Woodhead Publ Ltd, New York, pp 219–229
Musse, M., Quellec, S., Cambert, M., Devaux, M. F., Lahaye, 481 M., & Mariette, F. (2009)
Monitoring the postharvest ripening of tomato fruit using quantitative MRI and NMR relaxometry.
Postharvest Biology and Technology, 53(1), 22-35.
Oakenfull, D. (1987) Gelling agents. CRC Crit Rev Food Sci Nutr 26:1–31
Philips, G. O., Wedlock, D. J., Williams, P. A. (1986) Molecular origin of hydrocolloid
functionality. In: Philips GO, Williams PA, Wedlock DJ (eds) Gums and stabilizers for the food
industry, vol 3.
Philips, G. O., Williams, P. A. (eds) (2000). Introduction to food hydrocolloids. In: Handbook of
hydrocolloids, Woodhead Publ Ltd, New York, pp 1–19
Plaza, L., Muñoz, M., De Ancos, B., & Cano, M. P. (2003). Effect of combined treatments of high-
pressure, citric acid and sodium chloride on quality parameters of tomato puree. European Food
Research and Technology, 216(6), 514-519.
Rani, U. & Bains, G.S. (1987). Flow behaviour of tomato ketchups. Journal of Texture Studies, 18,
125–135.
Saha, D., & Bhattacharya, S. (2010). Hydrocolloids as thickening and gelling agents in food: a
critical review. Journal of Food Science and Technology, 47(6), 587–597.
Sahin, H. & Ozdemir, F., (2004) Effect of some hydrocolloids on the rheological properties of
different formulated ketchups. Food Hydrocolloids 18:1015–1022
Sharoba, A.M., Senge, B., El-Mansy, H.A., Bahlol, H. ElM. & Blochwitz, R. (2005). Chemical,
sensory and rheological properties of some commercial German and Egyptian tomato ketchups.
European Food Research and Technology, 220, 142–151.
Sikora, M,. Kowalski, S., Tomasik, P., & Sady, M., (2007) Rheological and sensory properties of
dessert sauces thickened by starch-xanthan gum combination. J Food Eng 79:1144–1151
Page 151
143
Wang, Q., Ellis, PR, Ross-Murphy, S. B. (2000). The stability of guar gum in aqueous system under
acidic conditions. Food Hydrocolloids 14:129–134
Weatheral, I.L., & Lee, W. (1991). Instrumental evaluation of some new salad fruit colour using
CIELAB values. New Ekond Journal of Botany, 29, 197–205.
Williams, P. A. (2006) An overview of the structure-function relationship of hydrocolloids. In:
Philips GO, Williams PA (eds) Gums and stabilizers for the food industry, vol 13. RSC Publ,
Oxford, pp 15–29
Yang, C.C., & Chinnan, M.S. (1988). Computer modelling of gas composition and colour
development of tomatoes stored in polymeric films, Journal of Food Science, 53, 869–872.
Page 152
144
Table 1
Physico-chemical properties of tomato sauces with different formulations: MC (Moisture Content),
aw (Water Activity), Bostwick consistency, Self-diffusion coefficient (D) and a*/b* (colorimetric
index). Standard deviations are given in parenthesis following the means values; different letters
close to numbers indicate significant difference among samples (p ≤ 0.05), where the small letter
referred the difference due to the concentration and the big one to the type of hydrocolloids. the "a"
and “A” letters were assigned to the highest value.
Moisture content
(%, g H20/100g
sample)
aw Bostwick
consistency (cm) a*/b*
STD 1
STD 2
90.93 (0.03) A
90.85 (0.07) A
0.996 (0.001) A
0.982 (0.003) B
7.3 (0.3) C
8.6 (0.3) B
1.07(0.01)E
1.10(0.01)F
Guar
0.5%
1%
1.5%
90.42 (0.07) a/CD
90.05(0.09) b/C
89.13(0.08) c/DE
0.997(0.001) a/A
0.996 (0.001) a/A
0.996 (0.001) a/A
9.0 (0.1) a/A
8.8 (0.42) a/A
8.0(0.41) b/B
1.14(0.02) a/C
1.14(0.01) a/C
1.10(0.01) b/C
LBG
0.5%
1%
1.5%
89.77(0.10) a/F
89.63(0.05) b/E
89.12(0.05) c/DE
0.992 (0.002) b/A
0.995(0.003) ab/A
0.997(0.001) a/A
6.5(0.1) a/D
5.5(0.1) b/D
5.8(0.3) b/DE
1.21(0.02) a/A
1.17(0.01) b/B
1.06(0.01) c/D
Xan
0.5%
1%
1.5%
90.59(0.06) a/B
89.67(0.05) b/DE
89.05(0.03) c/E
0.996 (0.003) a/A
0.999 (0.001) a/A
0.995 (0.004) a/A
7.1(0.3)a/BC
4.4(0.3) b/E
2.5(0.1) c/G
1.13(0.01)ab/CD
1.14(0.01) a/C
1.13(0.01) b/B
CMC
0.5%
1%
1.5%
90.04 (0.07) a/E
89.28 (0.05) b/F
89.23 (0.04) b/CD
0.996 (0.003) a/A
0.996 (0.003) a/A
0.997 (0.004) a/A
8.9(0.3) a/A
8.3(0.3) b/A
7.1(0.3) c/C
1.15(0.01) b/C
1.20(0.01) a/A
1.16(0.03) b/A
PP
0.5%
1%
1.5%
89.87(0.15) a/EF
89.80(0.09) a/D
89.19(0.03)b/CDE
0.996 (0.004) a/A
0.995 (0.005) a/A
0.998 (0.001) a/A
4.5(0.1) b/F
4.9(0.3) a/E
4.5(0.1) b/F
1.17(0.01) a/B
1.16(0.01) a/B
1.12(0.01) b/B
MP
0.5%
1%
1.5%
90.47(0.06) a/BC
89.96(0.08) b/C
89.28(0.07) c/C
0.997 (0.002) a/A
0.996 (0.002) a/A
0.996 (0.002) a/A
6.9(0.3) a/BCD
6.4(0.3) b/C
5.5(0.1) c/E
1.07(0.01) a/F
1.06(0.01) a/E
1.07(0.01) a/D
SP
0.5%
1%
1.5%
90.28(0.04) a/D
90.28(0.03) a/B
89.47(0.07) b/B
0.993 (0.002) a/A
0.994 (0.002) a/A
0.994 (0.003) a/A
6.6(0.3) b/CD
7.5(0.1) a/B
6.1(0.3) c/D
1.12(0.01) a/D
1.07(0.01) b/E
1.13(0.01) a/B
PF
0.5%
1%
1.5%
90.29(0.06) a/D
89.65(0.09) b/DE
89.14(0.09) c/DE
0.986(0.001) a/B
0.986 (0.001) a/B
0.985 (0.001) a/B
6.8(0.3) a/CD
4.4(0.3) b/E
2.8(0.3) c/G
1.07(0.01) a/F
1.06(0.01) b/E
1.07(0.01) b/D
Page 153
145
Table 2
Consistency coefficient (K) and flow behaviour index (n) of tomato sauce with different
formulation
Consistency coefficient (K) Flow behavior index (n)
STD 1
STD 2
12.39
12.88
0.315
0.306
Guar
0.5%
1%
1.5%
17.25
29.53
41.35
0.365
0.303
0.339
LBG
0.5%
1%
1.5%
32.66
50.08
81.08
0.285
0.293
0.283
Xan
0.5%
1%
1.5%
26.32
56.47
94.50
0.202
0.175
0.136
CMC
0.5%
1%
1.5%
19.70
31.26
51.58
0.284
0.328
0.357
PP
0.5%
1%
1.5%
33.51
29.51
33.33
0.080
0.113
0.096
MP
0.5%
1%
1.5%
21.21
22.20
18.45
0.178
0.194
0.236
SP
0.5%
1%
1.5%
11.74
11.23
11.12
0.371
0.369
0.399
PF
0.5%
1%
1.5%
18.25
17.74
18.55
0.256
0.259
0.277
Page 154
146
T2C (ms) Pop C (%) T2D (ms) Pop D (%) T2E (ms) Pop E(%) Self-diffusion coefficient D
10-9
m2 /s)
STD 1
STD 2
93.4(0.6) C
115.8(1.1) A
6.3(0.1) E
11.5(0.1) A
303.0 (0.1) B
322.6(0.1) A
93.7(0.1) B
88.5(0.1) F
-
-
-
-
1.898(0.003) BC
1.901(0.004) B
Guar
0.5%
1%
1.5%
97.8(1.8) a/B
85.4(0.8) b/E
96.7(1.4) a/C
9.5(0.3) c/B
12.6(0.3) b/A
13.7(0.5) a/C
294.1(4.5) a/C
250.0(0.1) c/E
270.3(0.1) b/D
90.5(0.3) a/E
87.4(0.3) b/F
86.3(0.5) c/F
-
-
-
-
-
-
1.894(0.002) a/BC
1.848(0.004) b/G
1.825(0.004) c/F
LBG
0.5%
1%
1.5%
84.1(0.9) a/E
76.0(0.5) c/G
80.7(0.5) /F
5.4(0.1) b/F
5.8(0.1) b/F
8.1(0.2) a/F
301.8(3.4) a/B
268.2(3.5) b/C
270.3(0.1) b/D
94.3(0.1) a/A
94.2(0.1) a/A
91.9(0.2) b/C
-
-
-
-
-
-
1.850(0.005) a/E
1.831(0.003) b/E
1.834(0.003) b/E
Xan
0.5%
1%
1.5%
18.4(1.0) b
22.5(1.0) b
21.6(0.4) a
0.9(0.1) c
1.3(0.1) b
1.5(0.1) a
212.0(1.8) a
127.4(1.7) b
116.8(1.8) c
76.8 (1.6)b
b 64.5(3.5) c
84.8(1.8) a
128.9(4.9) c
194.2(3.2) b
207.5 (3.6) a
22.3(2.6) b
34.2(3.4) a
13.8(1.8) c
1.919(0.005) a/A
1.898(0.005) b/B
1.880(0.003) c/B
CMC
0.5%
1%
1.5%
83.7(2.0) a/C
72.0(0. 6) c/H
73.8(0.6) b/G
6.0(0.3) a/F
6.0(0.1) a/F
5.4(0.1) b/H
277.8(0.1) a/E
250.0(0.2) c/E
270.3(2.4) b/D
94.1(0.3) b/A
94.0(0.1) b/A
94.6(0.1) a/A
-
-
-
-
-
-
1.894(0.004) a/BC
1.839 (0.002) b/F
1.831(0.004) c/EF
PP
0.5%
1%
1.5%
91.1(1.0) a/D
79.7(0.6) c/F
86.3(2.1) b/E
11.8(0.2) c/A
10.9(0.2) b/C
15.9(1.3) a/B
238.1(0.1) a/F
197.1(2.0) b/F
183.2(1.8) c/F
88.2(0.2) a/F
89.1(0.2) a/D
84.1(1.3) b/G
-
-
-
-
-
-
1.882(0.003) a/D
1.869(0.002) b/D
1.855(0.004) c/D
MP
0.5%
1%
1.5%
90.8(1.0) c/D
88.2(0.8) b/D
148.4(1.2) a/A
7.7(0.1) c/C
9.0(0.2) b/D
48.5(0.1) a/A
285.7 (0.1) a/D
263.2(0.1) b/D
285.7(0.1) a/C
92.4(0.1) a/D
91.0(0.3) b/C
51.5(0.1) c/H
-
-
-
-
-
-
1.893(0.002) a/C
1.879(0.002) b/C
1.852(0.002) c/D
SP
0.5%
1%
1.5%
85.6(1.3) a/E
76.5(0.7) b/G
68.0(0.4) c/H
7.0(0.1) b/D
5.9(0.1) c/F
7.4(0.1) a/F
277.8(0.1) a/E
270.3(0.1) b/C
232.6(0.1) c/G
93.0(0.1) b/C
94.1(0.1) a/A
92.6(0.1) c/C
-
-
-
-
-
-
1.923(0.003) a/A
1.926(0.003) a/A
1.903(0.004) b/B
PF
0.5%
1%
1.5%
90.3(1.9) a/D
89.9(1.1) a/C
80.3(1.0) c/F
8.9 (0.3) c/B
11.2(0.2) a/C
10.5(0.2) b/E
285.7(0.1) a/D
270.3 (0.1)b/C
263.2(0.1) c/E
91.1(0.3) a/E
88.8(0.2) c/D
89.5(0.2) b/D
-
-
-
-
-
-
1.891(0.002) a/C
1.883(0.001) b/C
1.872(0.002) b/C
Page 155
147
Table 3
1H T2 relaxation times and populations of tomato sauce with different formulation. Standard
deviations are given in parenthesis following the means values; different letters indicate significant
difference among samples (p ≤ 0.05); small letters indicate differences in the same sample at
different concentrations; capital letters indicate differences among the samples, including STD1 and
STD 2
Page 157
149
Figure 2
Times (ms)
0.1 1 10 100 1000 10000
STD1
MP
Xan
CMC
PP
Guar
STD2
PF
SP
LBG
Rel
ativ
e in
tens
ity
Page 158
150
Figure captions
Figure 1
Apparent viscosity of tomato sauce with different formulations
Figure 2
Characteristic 1H T2 relaxation time distribution for tomato sauce with different formulation