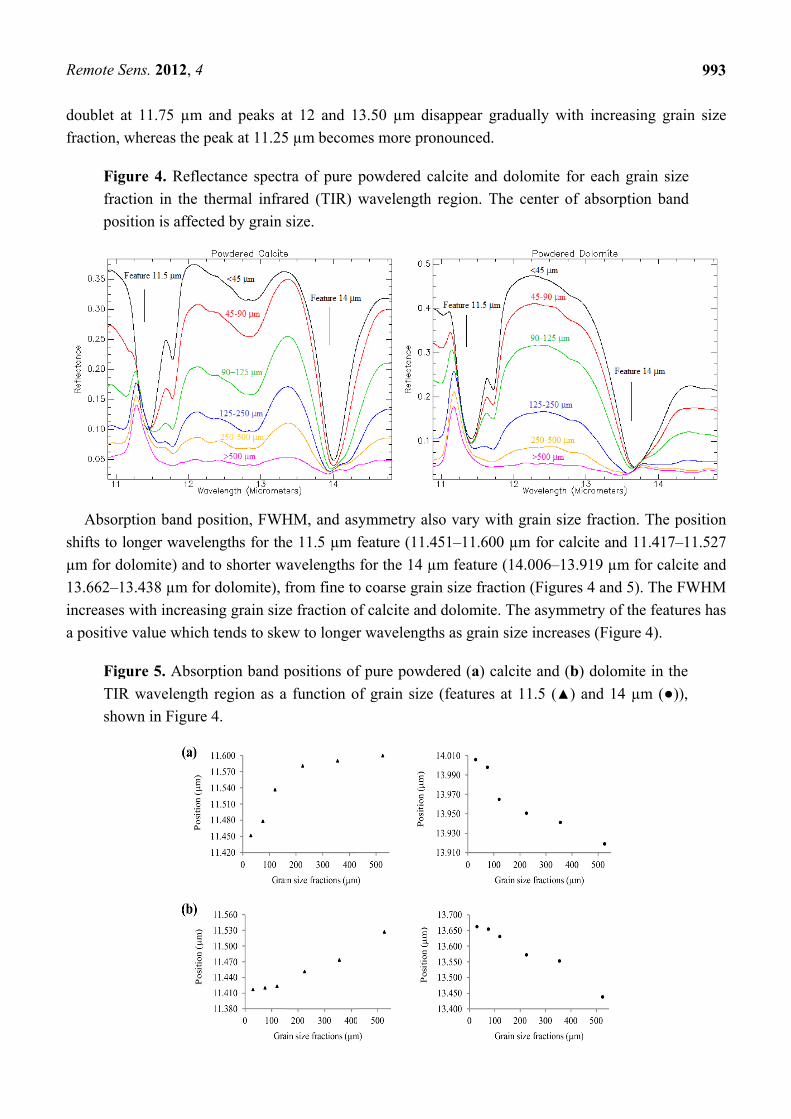
Remote Sens. 2012, 4, 987-1003; doi:10.3390/rs4040987 Remote Sensing ISSN 2072-4292 www.mdpi.com/journal/remotesensing Article Effect of Grain Size and Mineral Mixing on Carbonate Absorption Features in the SWIR and TIR Wavelength Regions Nasrullah Zaini 1,2, *, Freek van der Meer 1 and Harald van der Werff 1 1 Department of Earth Systems Analysis, Faculty of Geo-Information Science and Earth Observation (ITC), University of Twente, Hengelosestraat 99, P.O. Box 217, 7500 AE Enschede, The Netherlands; E-Mails: [email protected] (F.M.); [email protected] (H.W.) 2 Department of Physics, Faculty of Mathematics and Natural Sciences, Syiah Kuala University, Darussalam, Banda Aceh 23111, Aceh, Indonesia * Author to whom correspondence should be addressed; E-Mail: [email protected]; Tel.: +31-53-487-4444; Fax: +31-53-487-4400. Received: 24 February 2012; in revised form: 27 March 2012 / Accepted: 28 March 2012 / Published: 10 April 2012 Abstract: Reflectance spectra of carbonate minerals in the shortwave infrared (SWIR) and thermal infrared (TIR) wavelength regions contain a number of diagnostic absorption features. The shape of these features depends on various physical and chemical parameters. To accurately identify carbonate minerals or rocks in pure and mixed form, it is necessary to analyze the effects of the parameters on spectral characteristics. In this study, we analyzed spectral absorption feature characteristics of calcite and dolomite in the SWIR (features at 2.3 and 2.5 μm) and TIR (features at 11.5 and 14 μm) wavelength regions, as a function of grain size and carbonate mineral mixtures. Results showed that varying grain sizes and mineral contents in the sample, influence reflectance values and absorption feature characteristics. Absorption band positions of pure and mixed calcite and dolomite in the SWIR and TIR regions for both features were displaced slightly as observed in previous studies. The band positions of calcite and dolomite varied relative to grain size only in the TIR region. These positions shifted to longer wavelengths for the feature at 11.5 μm and to shorter wavelengths for the feature at 14 μm from fine to coarse grain size. The band positions of calcite-dolomite mixtures in the SWIR and TIR regions were determined by the quantity of calcite and dolomite in the sample. These results can be applied for the identification of pure and mixed calcite and dolomite, as well as estimating the relative abundance of both minerals with different grain size and mineral mixtures in a OPEN ACCESS
Effect of Grain Size and Mineral Mixing on Carbonate Absorption Features in the SWIR and TIR Wavelength Regions
Nasrullah Zaini 1,2,*, Freek van der Meer 1 and Harald van der Werff 1
1 Department of Earth Systems Analysis, Faculty of Geo-Information Science and Earth Observation (ITC), University of Twente, Hengelosestraat 99, P.O. Box 217, 7500 AE Enschede, The Netherlands; E-Mails: [email protected] (F.M.); [email protected] (H.W.)
2 Department of Physics, Faculty of Mathematics and Natural Sciences, Syiah Kuala University, Darussalam, Banda Aceh 23111, Aceh, Indonesia
* Author to whom correspondence should be addressed; E-Mail: [email protected]; Tel.: +31-53-487-4444; Fax: +31-53-487-4400.
Received: 24 February 2012; in revised form: 27 March 2012 / Accepted: 28 March 2012 / Published: 10 April 2012
Abstract: Reflectance spectra of carbonate minerals in the shortwave infrared (SWIR) and thermal infrared (TIR) wavelength regions contain a number of diagnostic absorption features. The shape of these features depends on various physical and chemical parameters. To accurately identify carbonate minerals or rocks in pure and mixed form, it is necessary to analyze the effects of the parameters on spectral characteristics. In this study, we analyzed spectral absorption feature characteristics of calcite and dolomite in the SWIR (features at 2.3 and 2.5 μm) and TIR (features at 11.5 and 14 μm) wavelength regions, as a function of grain size and carbonate mineral mixtures. Results showed that varying grain sizes and mineral contents in the sample, influence reflectance values and absorption feature characteristics. Absorption band positions of pure and mixed calcite and dolomite in the SWIR and TIR regions for both features were displaced slightly as observed in previous studies. The band positions of calcite and dolomite varied relative to grain size only in the TIR region. These positions shifted to longer wavelengths for the feature at 11.5 μm and to shorter wavelengths for the feature at 14 μm from fine to coarse grain size. The band positions of calcite-dolomite mixtures in the SWIR and TIR regions were determined by the quantity of calcite and dolomite in the sample. These results can be applied for the identification of pure and mixed calcite and dolomite, as well as estimating the relative abundance of both minerals with different grain size and mineral mixtures in a
OPEN ACCESS
Remote Sens. 2012, 4
988
synthetic sample or rock. They can also be used as a preliminary proxy for assessing dolomitization patterns in carbonate rocks.
Carbonate rocks, which are recognized as an important natural resource for construction materials and the cement industry [1,2], are sedimentary rocks that mostly consist of calcite (CaCO3) and dolomite (CaMg(CO3)2) [1–4]. These carbonate minerals in the form of limestones also have an economic interest in terms of petroleum geology, because their porosity is a potential storage reservoir for oil and natural gas [1,2,5,6]. The development of porosity in limestones is affected by the sequence of diagenetic processes, which include dolomitization [1,5,6]. The dolomitization process involves the replacement of calcite by dolomite in the rock when magnesium-rich water permeates through limestone [1,6,7]. The process may result in an increase in the porosity of the rock by up to 12%, making it suitable as a natural reservoir for oil [5,6,8]. The implications of dolomitization for oil exploration [9,10] and the importance of dolomite in making cement make it a favorable mineral to be investigated.
Besides the interest in oil and gas reservoir characterization, there is an interest in looking into calcite-dolomite mineralogy from an ‘ore geology’ perspective, as carbonates are important pathfinder and alteration minerals associated with calcic skarn deposits, low sulphidation epithermal deposits and porphyry Cu deposits [11,12]. In addition, coral reefs are under worldwide decline as a result of climate change [13]. Corals are among the species that contribute to carbon sequestration, the capture of carbon dioxide (CO2) from the atmosphere, and act as natural carbon sinks. As they are largely built of carbonate material, more information on its spectral characteristics will help in better species differentiation and in mapping using remote sensing [14,15].
Carbonate minerals have diagnostic absorption features in the shortwave infrared (SWIR) and thermal infrared (TIR) regions due to vibrational processes of the carbonate ions (CO ) [16–20]. In general, carbonate minerals can be distinguished by the presence of two prominent spectral absorption features in the wavelength ranges around 2.50–2.55 µm and 2.30–2.35 µm in the SWIR [8,18,20–22] and around 13.70–14.04 µm and 11.19–11.40 µm in the TIR [17,19,23,24]. These features can be used to identify pure and mixed calcite and dolomite in synthetic samples or carbonate rocks, because the absorption band position of calcite is located at a slightly longer wavelength than that of dolomite [8,21]. Although the absorption band positions of these particular minerals have been observed by multiple researchers, the precise position of calcite and dolomite absorption bands in the SWIR [8,18,21,22] and TIR [19,23–26] spectra has been recorded at different wavelengths.
There are several factors controlling the position of carbonate absorption bands at the atomic level: cation mass, cation radius, cation and anion valences, cation coordinate number, the gap between cation and anion, and site symmetry [27,28]. Spectral absorption features of carbonate minerals in the infrared region are also influenced by physical and chemical parameters such as grain size [8,21,29], texture [29], packing or porosity [21], carbonate mineral content [8], and chemical composition (metal
Remote Sens. 2012, 4
989
ion impurity) [8,18,27]. Previous studies of the effect of particle size on carbonate absorption features in the SWIR revealed that differences in grain size change reflectance values and absorption feature depth [8,21,29], but absorption band position, width [8,21], and asymmetry of the features [8] are invariant to grain size. Position, depth, and asymmetry of carbonate absorption feature in the SWIR are displaced by changing the relative amounts of calcite and dolomite composing a sample [8]. The presence of iron in the form of Fe2+ in carbonate minerals reduces the reflectance value [8,27] and depth of the carbonate absorption feature in the SWIR [8].
Although the spectral absorption features of carbonate minerals in the SWIR wavelength region have been extensively studied [8,21,29], they have not been fully explored and observed in the TIR region, particularly with regard to the influences of grain size and carbonate mineral mixtures. In this study, we analyze the spectral absorption feature characteristics of calcite and dolomite in both the SWIR and TIR wavelength regions as a function of grain size and calcite-dolomite mixtures. To accurately identify carbonate minerals in pure and mixed forms, it is necessary to analyze the effects of those parameters that change spectral characteristics.
2. Material and Methods
2.1. Sample Preparation
Synthetic samples of calcite and dolomite were prepared by crushing, sieving, mixing and packing. Rock samples of calcite from the Serra de Ficalho, Moura, Portugal and dolomite of chemical grade from the UK were separately pulverised using a jaws-crusher and a steel percussion mortar and pestle. The pulverized samples were dried in an oven overnight at 105 °C to evaporate water, and subsequently sieved into six grain size fractions of pure powdered minerals (<45 μm, 45–90 μm, 90–125 μm, 125–250 μm, 250–500 μm and >500 μm) using a Fritsch sieving machine with stainless steel sieves. Synthetic mixtures of calcite and dolomite were prepared by mixing weight percentages of powdered minerals ranging from pure calcite to pure dolomite with same grain size fractions. The samples used in this mixing process consisted of three different grain size fractions with a combination of some pure fractions, namely <45, 45–125, and 125–500 μm. The pure powdered calcite and dolomite were weighed on the basis of weight percentage of each mineral respectively, using a top-loading precision balance (Mettler PE360) with a reading precision of ±1 g. The total amount of material needed to prepare a synthetic sample was 25 g and the compositions of calcite-dolomite mixtures with different mineral contents for each grain size fractions were 75%–25%, 50%–50%, and 25%–75%. To obtain homogenous mixtures, samples were manually stirred in a porcelain mortar using a spoon-spatula for 5 min. For packing of the samples, the pure and mixed synthetic samples were placed separately in a cylindrical aluminum cup of 5 cm in diameter and 5 mm in depth, and pressed using a weight pressure of 1,090 g for 5 min.
2.2. FTIR Reflectance Spectra Measurement
A Bruker Vertex 70 FTIR Spectrometer was used to measure reflectance spectra of the synthetic samples in the SWIR (1.0–3.3 µm) and TIR (5.0–20 µm) wavelength regions. The spectrometer was equipped with a near infrared (NIR) source, Calcium Fluoride (CaF2) beam splitter, and Indium
R
Gmsss
ssass(m
2
fusthothfloahw
Remote Sens
Gallium Arsmeasured thspectra weresplitter, andsample was
Directionsphere [30]spectrometeapproximatesample areascattered byInGaAs) o
measuremen
2.3. Spectra
Absorptiofull width atspectra [31–he maximum
of the absorphe position
feature at hogarithm o
absorption phas a perfewavelengths
s. 2012, 4
senide (InGhe SWIR spe recorded
d Mercury Cscanned 4,0
nal hemisph attached tr passed t
ely 10°. Tha measured y the gold-cof the sphent was cond
l Absorption
on feature ct half maxim
–34] (Figurem absorptioption featurof the abso
half the maf the ratio
position (Arect asymms, and a pos
F
GaAs) on-sphpectra with using an exCadmium T096 times pherical refleto the Bruthrough thehe sample wwas approx
coated spherere. A go
ducted.
n Features
characteristimum (FWHe 1). The poon or minimre indicates orption waveaximum dep
of the arearea A) [33],
metry, a neitive value f
Figure 1. D
here detecto16 cm−1 sp
xternal mid Telluride (Mer acquisitioectance meauker Vertexe sphere awas placed ximately 25re was recold-coated p
Analysis
cs analysis HM), and asosition of thmum reflect
the reflectaelength [8,3pth [33]. Ta right of t, where theegative valfor a skewe
efinitions o
or for the Spectral resoinfrared (M
MCT) on-spon with 8 cmasurements
x 70. The and illumin
under a sa5 mm in diaorded by deplate was
consisted osymmetry [he absorptiotance of an ance value a31,32]. The
The asymmethe absorpti result of thue for a
ed absorptio
of absorption
WIR spectrolution at 2MIR) sourcephere detectm−1 spectrawere mad
beam of Snated the sample port ameter. Radetectors plac
used for
of determini8,31–33], con band is dabsorption at the shoulFWHM is
etry of the ion positionhe calculatiskewed ab
on feature to
n feature ch
ra measurem56 scans pee, Potassiumtor cooled
al resolutione using a c
SWIR or Tsample surf
at the bottdiation refleced on the treferencing
ng absorpticalculated frdefined as tfeature occ
lders minusdefined as tabsorption
n (Area B)on is zero i
bsorption feowards long
haracteristic
ments. The er acquisitim Bromide by liquid n
n. custom-builTIR radiatioface with tom of the ected by thetop (MCT)
g, before e
on band porom continuthe wavelencurred [8,31 the reflectathe width on feature re) to the areif the absorfeature towger waveleng
cs.
99
spectrometeon. The TI(KBr) beam
nitrogen. Th
lt integratinon from than angle osphere. Th
e sample anand the rea
each samp
osition, depthuum-removength at whic1]. The deptance value f the spectrepresents thea left of thrption featur
wards shortegths [33].
90
er IR m he
ng he of he nd ar le
h, ed ch th at al he he re er
R
ffpinrI
3
3
agda2d
aT242da
Remote Sens
A continufeatures [32field [34–36prominent vn the wavelange of 10DL scripts
3. Results
3.1. SWIR Sp
SWIR spand dolomitgrain size frdepth of absabsorption b250 µm, andecreases w
FWHM aabsorption bThe absorpti2.515 µm fo45 to 500 µm2.5 µm is wdolomite feaand the featu
Figurefractioband p
s. 2012, 4
uum is a m2], which ha6], laborato
vibrational alength range.89–14.81 µ[31,38] with
pectra of Pu
pectral charte are showaction influsorption babands increand decreasesith increasinand asymmebands for boion band po
or dolomite m, but slighider and deatures has aure at 2.3 µm
e 2. Reflecton in the shposition is n
mathematicaas been useory [37,38]absorption fe of 2.164–µm (TIR). Thin IDL-EN
ure Calcite
acteristics own for each uences the reands and theases with ins when theng grain sizetry of the foth featuresositions are (Figure 3(a
htly decreaseper than th
a negative vm skews mo
tance specthortwave innot affected
al function ted for vario], and imafeatures in
–2.653 μm (The absorp
NVI softwar
and Dolom
of the two grain size
eflectance ve overall brncreasing gre grain size ze fraction ofeatures also of calcite acentered at
a,b)). The Fses when grhe feature avalue whichore to short
tra of pure nfrared (SWby grain siz
that can isoous applicatage [31,39–carbonate rSWIR) andtion featurere package [
mite with Va
vibrational fraction in
value and abrightness inrain size fra
is greater of the samplo vary slighand dolomitt 2.340 µm WHM increrain size is
at 2.3 µm foh tends to ster waveleng
powdered cWIR) wavelze.
olate and entions to ana–41] reflecreflectance sd features ate characteri[42].
rying Grain
absorptionFigure 2. I
bsorption fen the SWIRaction of cathan 250 µ
le (Figure 2htly with grate is invariaand 2.537 µeases with ilarger than
or both minekew to shogths than th
calcite andlength regio
nhance specalyze the fetance specspectra: feat 11.5 and 1stics were c
n Size
n features inIt can be obeature charaR wavelengtalcite and doµm (Figure 2). ain size fracant to grain µm for calcincreasing g
n 500 µm (Ferals. The arter wavele
he feature at
dolomite foon. The cen
cific spectraeature chartra. We an
atures at 2.34 µm in thecomputed u
n pure powbserved thatacteristics, eth region. Tolomite bet3). Overal
ction, but thsize fractio
cite and at 2grain size frFigure 3). Tsymmetry o
engths (Figut 2.5 µm.
for each granter of abso
99
al absorptioacteristics onalyzed fou3 and 2.5 µme wavelengtusing custom
try of bothch grain sizrain size giv5% of calcihorter wave
rying Miner
te mixtures hapes and a
cite and doloize fractionral curve w
te mixtures alcite conteneral conten
h features aze fraction, ves deeper ite is in the elengths.
ral Contents
in the TIRabsorption fomite conte
n. The thermwhen grain s
for each gnt in the sa
nts in percen
also vary sthe depth oabsorption sample. Th
s
R wavelengtfeature charents. Overalmal infraresize fraction
grain size frample. (C = nt).
99
slightly witof absorptiofeatures tha
he asymmetr
th region, foracteristics oll reflectanc
ed spectra ons are in th
raction. calcite
96
th on an ry
or of ce of he
R
ccda4bf
4
4
cbs
Remote Sens
The positcomposing tchange to lodolomite miand 13.662–45–125 μm,band depth,features tend
Figuregrain sfrom (a
4. Discussio
4.1. Effect of
Varying characteristicbands changshow that th
s. 2012, 4
tion of absthe sample,onger wavelixtures in th–14.006 μm , and 11.46 FWHM, ad to have po
e 9. Absorpsize fractiona) feature a
ons
f Grain Size
grain size cs in the SWge (Figures he reflectanc
orption ban, where the lengths as che TIR regifor grain si
69–11.578 μand asymmositive asym
ption band pn (grain sizeat 11.5 µm a
e
in carbonaWIR and TIR
2 and 4). Tce and depth
Fi
nds of bothband posit
calcite contion are centize <45 μm,μm and 13.etry of the
mmetry whic
positions of e: <45 µm
and (b) featu
ate samplesR wavelengtThe studies h of absorpt
igure 8. Co
h features dtions range ent increasetered within, 11.421–11563–13.940features al
ch skews to
f calcite-dol(●), 45–125ure at 14 µm
s influencesth regions. Pby van der tion bands o
ont.
depends on from that o
es (Figure 9n the wavel1.497 μm an0 μm for grlso vary wi
o longer wav
omite mixtu5 µm (■), am, shown in
s spectral sParticularly,Meer [8], G
of these min
the calciteof pure dol9). These balength rangnd 13.631–1rain size 12ith calcite cvelengths.
ures in the and 125–50n Figure 8.
shape and , reflectanceGaffey [21]nerals in SW
content anomite to puand position
ge of 11.41713.977 μm f25–500 μmcontent (Fig
TIR region 0 µm (▲))
thus absorpe and depth , and Crow
WIR spectra
99
nd grain sizure calcite ons of calcite7–11.451 μmfor grain siz
m. Absorptiogure 8). Th
for each obtained
ption featurof absorptio
wley [29] alsa are affecte
97
ze or e-m ze on he
re on so ed
Remote Sens. 2012, 4
998
by grain size. Coarse grain size fractions absorb more electromagnetic radiation penetrating to the grain surface than fine grain size associated with thickness of the grain or internal optical path of the grain [19,32] according to Lambert-Beer’s Law, typical of transparent material [19], and roughness of the grain surface [29].
The presence of carbonate ion in a mineral or rock is characterized by several fundamental vibrational bands in the SWIR [17,18,20,21] and TIR [17,19,20] regions. The two prominent absorption features in SWIR reflectance spectra of calcite and dolomite (Figure 2) are caused by overtones and combination tones of internal vibrational processes of carbonate ions [17,18,20,21]. In TIR spectra (Figure 4), the two diagnostic absorption features are generated by two vibrational bending modes of carbonate ions, which are out-of-plane bends for the feature at 11.5 µm and in-plane bends for the feature at 14 µm [17,19,20].
The position of absorption bands for both features in pure powdered calcite and dolomite spectra in the SWIR wavelength region appeared invariant to grain size fraction (Figure 3), confirming results reported by van der Meer [8] and Gaffey [21]. Although the center of the absorption band position is not influenced by grain size, the band positions are centered at a slightly different wavelength, when compared to previous studies [8,18,21,22]. Gaffey [21] revealed that using different spectroscopic instruments and methods to calculate band position may result in changing the center of the band position. In this study, we used an advance hyperspectral spectrometer with very high spectral resolution for reflectance spectra measurement, so that it could be the reason why our result is slightly different from others. The FWHM and asymmetry of the features at 2.3 and 2.5 µm in the SWIR region varied with grain size fraction (Figures 2 and 3), which is in contrast to what has been published in prior studies [8,21]. Here it was stated that the width and asymmetry of absorption features, and the number of absorption bands are not changing or invariant with particle size [8,21]. In addition, the FWHM for both absorption features is wider for dolomite than for calcite.
The band position of both features in the TIR wavelength region appeared to be dependent on grain size fraction of the sample (Figure 4). The center of the band position changed slightly at different wavelengths, confirming results of previous studies [19,23–26]. Reflectance intensity of band shoulders on the left and right sides of both features at 11.5 and 14 µm decreased considerably more than for the band centers, when the grain size becomes coarser in the sample. Therefore, it influences spectral shapes and absorption feature characteristics. As grain size affects the shape of absorption features [19], it may also affect band position. The absorption band depth, FWHM, and asymmetry of the TIR carbonate features also varied with grain size, but the feature parameters were difficult to analyze given the weak nature of spectral features at larger grain sizes, especially between 125 and 500 µm grain sizes.
4.2. Effect of Mineral Mixing
Varying quantity of calcite and dolomite in the sample affects absorption band position in the SWIR and TIR wavelength regions. Work reported by van der Meer [8] for carbonate band positions in SWIR spectra of calcite-dolomite mixtures shows the same trends found in the course of this study. Gaffey [27] also reported that absorption band position in calcite and dolomite spectra displaces with changed chemical composition such as increased Mg content in calcite and Fe content in dolomite. However,
Remote Sens. 2012, 4
999
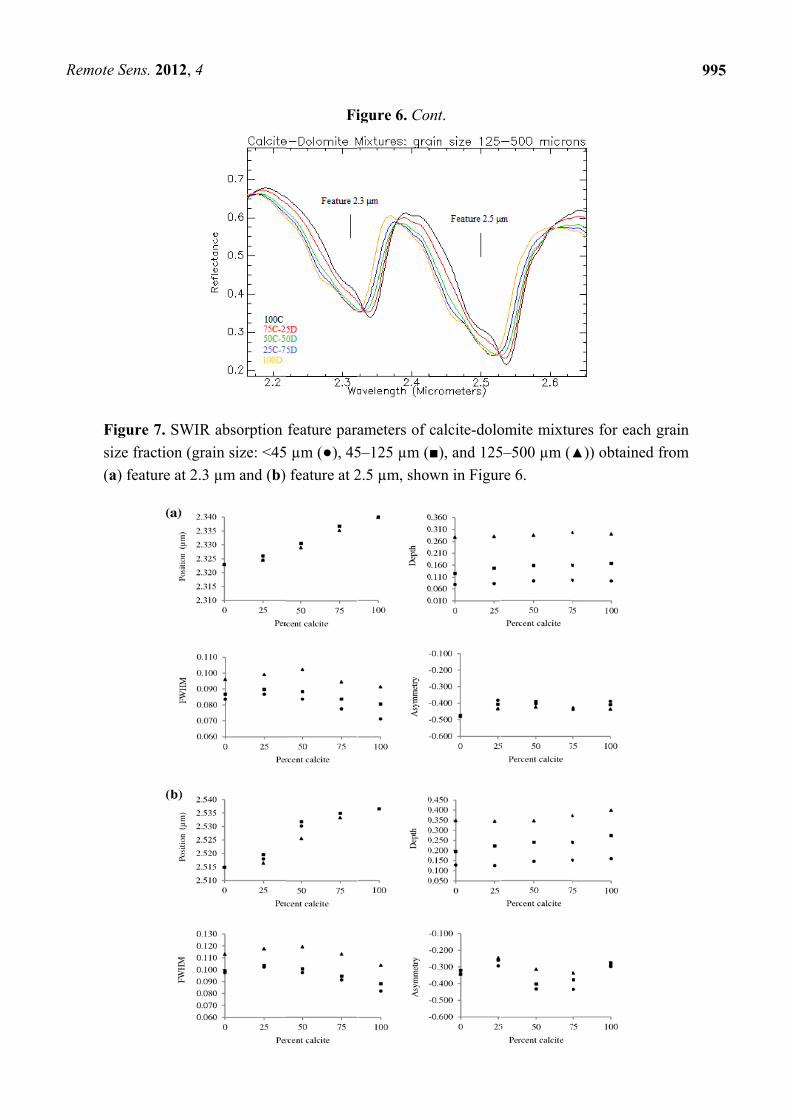
the absorption band position displaced also with grain size, especially when the calcite content in the samples increases from 25% to 75% (Figure 7), although the band position did not shift in the SWIR spectra of pure powdered calcite and dolomite (Figure 3). This effect may be caused by the mixing of calcite and dolomite in the sample, which is dominated by one of the two carbonate minerals or “pilling effect” of the fine grains in the sample [18]. The FWHM of the 2.5 µm feature in mixed mineral spectra is wider than the 2.3 µm feature (Figure 7), which is the same as the FWHM of pure calcite and dolomite spectral features (Figure 3), most likely due to stronger vibrational absorption at 2.5 µm [18].
The absorption band position of calcite-dolomite mixtures in the TIR was not only dependent on mineral contents, but also on grain size (Figure 9). Absorption features may be affected by grain size and multiple scattering effects [19]. The absorption band depth, FWHM, and asymmetry of the features also varied with calcite content (Figure 8). These characteristics show the same pattern as pure calcite or dolomite feature characteristics (Figure 4), when the quantity of calcite-dolomite mixtures composing a sample is dominated by one of those minerals. It was also difficult to analyze due to less pronounced spectral features with increased grain size.
4.3. Mineralogical Mapping Applications
Results of this study indicate that absorption band positions of the two prominent carbonate features in the SWIR and TIR wavelength regions are distinctive of carbonate minerals with different grain size and mineral content (Figures 3, 5, 7 and 9). Previous research has revealed that the two prominent carbonate features in the SWIR [8,18,21,22] and TIR [17,19,23] regions are essential to distinguish between calcite and dolomite, as they contain the strongest vibrational absorption features of carbonate ions. Therefore, these features are useful for identifying pure and mixed calcite and dolomite as well as estimating the relative abundances of both minerals in a synthetic sample or rock. Previous research has demonstrated that distinctive spectral reflectance characteristics in the near infrared through laboratory experiment and remote sensing imagery can assist in identification of carbonate minerals and dolomitization patterns [9,10,43]. Van der Meer [8] stated that estimation of the calcite-dolomite ratio from spectra could be done using diagnostic absorption features around 2.30–2.34 µm, of which the exact position is dependent on the relative amounts of calcite and dolomite. Consequently, knowledge of these precise absorption band positions may be applied to analysis of hyperspectral remote sensing imagery for mapping carbonate minerals and dolomitization patterns in limestones.
5. Conclusions
Absorption feature characteristics and reflectance values of pure and mixed calcite and dolomite spectra in the SWIR and TIR wavelength regions were influenced by grain size and carbonate mineral content. Absorption band positions of both features in these wavelength regions were displaced slightly as observed in previous studies. The positions of SWIR calcite features at 2.340 µm and 2.537 µm and dolomite features at 2.323 µm and 2.515 µm were invariant to grain size. The FWHM and asymmetry of the calcite and dolomite spectral features at 2.3 and 2.5 µm in the SWIR region varied with grain size fraction, in contrast to what has been published in prior studies that the width and asymmetry of absorption features, and the number of absorption bands are not changing or
Remote Sens. 2012, 4
1000
invariant with particle size. In the TIR region, the positions depended on grain size and shifted to longer wavelength for the feature at 11.5 μm and to shorter wavelength for the feature at 14 μm from fine to coarse grain size fractions. The positions of both features of calcite-dolomite mixtures in the SWIR and TIR wavelength regions were determined by the calcite or dolomite content composing the sample. The positions of the features in the SWIR region were centered within the wavelength range of 2.323–2.340 μm and 2.515–2.537 μm. In the TIR region, however, the absorption band positions of the calcite-dolomite mixtures not only depended on mineral content, but also on grain size in the sample. Knowledge of these detailed feature characteristics can increase the accuracy of spectral identifications of pure and mixed calcite and dolomite with different grain size and carbonate mineral content, which is of particular use for assessments of dolomitization patterns in limestones.
This study has contributed to understanding the effects of grain size and mineral mixtures on the spectral absorption feature characteristics in the SWIR and TIR wavelength regions, which will help in improving mineral identification on the earth’s surface using hyperspectral remote sensing.
Acknowledgments
The authors would like to thank Boudewijn de Smeth, who kindly supported and facilitated of sample preparations at Faculty of Geo-Information Science and Earth Observation (ITC), University of Twente, The Netherlands. We want to express our gratitude to Christoph Hecker for his assistance in the spectral measurements and for the discussions on the TIR carbonate spectroscopy.
References
1. Pettijohn, F.J. Limestones and Dolomites. In Sedimentary Rocks, 3rd ed.; Harper & Row: New York, NY, USA, 1975; pp. 316-391.
2. Blatt, H.; Middleton, G.; Murray, R. Origin of Limestones. In Origin of Sedimentary Rocks; Prentice-Hall: Englewood Cliffs, NJ, USA, 1972; pp. 409-455.
3. Deer, W.A.; Howie, R.A.; Zussman, J. Carbonates. In Introduction to the Rock: Forming Minerals; Longman: London, UK, 1966; pp. 473-503.
4. Waltham, A.C. Sedimentary Processes and Rocks. In Foundations of Engineering Geology, 3rd ed.; Spon: London, UK, 2009; pp. 8-10.
5. Harbaugh, J.W. Carbonate Oil Reservoir Rock. In Carbonate Rocks: Origin, Occurence and Classification; Chilingar, G.V., Bissell, H.J., Fairbridge, R.W., Eds.; Elsevier: Amsterdam, The Netherlands, 1976; Volume 9A, pp. 349-398.
6. Friedman, G.M.; Sanders, J.E. Origin and Occurrence of Dolostones. In Carbonate Rocks: Origin, Occurence and Classification; Chilingar, G.V., Bissell, H.J., Fairbridge, R.W., Eds.; Elsevier: Amsterdam, The Netherlands, 1967; Volume 9A, pp. 266-348.
7. Hatch, F.H.; Rastall, R.H. Carbonate Rocks: Magnesian Limestones and Dolomites. In Textbook of Petrology: Vol. 2. Petrology of the Sedimentary Rocks; 4th revised ed.; Allen & Unwin: London, UK, 1965; pp. 221-234.
8. van der Meer, F.D. Spectral reflectance of carbonate mineral mixtures and bidirectional reflectance theory: Quantitative analysis techniques for application in remote sensing. Remote Sens. Rev. 1995, 13, 67-94.
Remote Sens. 2012, 4
1001
9. van der Meer, F. Classification of remotely-sensed imagery using an indicator kriging approach: Application to the problem of calcite-dolomite mineral mapping. Int. J. Remote Sens. 1996, 17, 1233-1249.
10. van der Meer, F. Mapping dolomitization through a co-regionalization of simulated field and image-derived reflectance spectra: A proof-of-concept study. Int. J. Remote Sens. 1998, 19, 1615-1620.
11. Rockwell, B.W.; Hofstra, A.H. Identification of quartz and carbonate minerals across northern Nevada using ASTER thermal infrared emissivity data—Implications for geologic mapping and mineral resource investigations in well-studied and frontier areas. Geosphere 2008, 4, 218-246.
12. Kozak, P.K.; Duke, E.F.; Roselle, G.T. Mineral distribution in contact-metamorphosed siliceous dolomite at Ubehebe Peak, California, based on airborne imaging spectrometer data. Am. Mineralogist 2004, 89, 701-713.
13. Baker, A.C.; Glynn, P.W.; Riegl, B. Climate change and coral reef bleaching: An ecological assessment of long-term impacts, recovery trends and future outlook. Estuar. Coast. Shelf Sci. 2008, 80, 435-471.
15. van der Meer, F. Spectral mixture modelling and spectral stratigraphy in carbonate lithofacies mapping. ISPRS J. Photogramm. 1996, 51, 150-162.
16. Gupta, R.P. Remote Sensing Geology, 2nd ed.; Springer: Berlin, Germany, 2003; p. 655. 17. Clark, R.N. Spectroscopy of Rocks and Minerals, and Principles of Spectroscopy. In Remote
Sensing for the Earth Sciences: Manual of Remote Sensing, 3rd ed.; Rencz, A.N., Ed.; John Wiley and Sons: New York, NY, USA, 1999; Volume 3, pp. 3-58.
18. Hunt, G.R.; Salisbury, J.W. Visible and near infrared spectra of minerals and rocks: II. Carbonates. Mod. Geol. 1971, 2, 23-30.
19. Salisbury, J.W.; Hapke, B.; Eastes, J.W. Usefulness of weak bands in mid infrared remote sensing of particulate planetary surface. J. Geophys. Res. 1987, 92, 702-710.
20. Clark, R.N.; King, T.V.V.; Klejwa, M.; Swayze, G.A.; Vergo, N. High spectral resolution reflectance spectroscopy of minerals. J. Geophys. Res. 1990, 95, 12653-12680.
21. Gaffey, S.J. Spectral reflectance of carbonate minerals in the visible and near infrared (0.35–2.55 microns): Calcite, aragonite, and dolomite. Am. Mineralogist 1986, 71, 151-162.
22. Baissa, R.; Labbassi, K.; Launeau, P.; Gaudin, A.; Ouajhain, B. Using HySpex SWIR-320m hyperspectral data for the identification and mapping of minerals in hand specimens of carbonate rocks from the Ankloute Formation (Agadir Basin, Western Morocco). J. Afr. Earth Sci. 2011, 61, 1-9.
23. Huang, C.K.; Kerr, P.F. Infrared study of the carbonate minerals. Am. Mineralogist 1960, 45, 311-324.
24. Lane, M.D.; Christensen, P.R. Thermal infrared emission spectroscopy of anhydrous carbonates. J. Geophys. Res.-Planet. 1997, 102, 25581-25592.
25. Ji, J.F.; Ge, Y.; Balsam, W.; Damuth, J.E.; Chen, J. Rapid identification of dolomite using a Fourier Transform Infrared Spectrophotometer (FTIR): A fast method for identifying Heinrich events in IODP Site U1308. Mar. Geol. 2009, 258, 60-68.
Remote Sens. 2012, 4
1002
26. Reig, F.B.; Adelantado, J.V.G.; Moreno, M.C.M.M. FTIR quantitative analysis of calcium carbonate (calcite) and silica (quartz) mixtures using the constant ratio method. Application to geological samples. Talanta 2002, 58, 811-821.
27. Gaffey, S.J. Reflectance spectroscopy in the visible and near infrared (0.35–2.55 microns): Applications in carbonate petrology. Geology 1985, 13, 270-273.
28. Povarennykh, A.S. Use of infrared-spectra for determination of minerals. Am. Mineralogist 1978, 63, 956-959.
29. Crowley, J.K. Visible and near-infrared spectra of carbonate rocks-reflectance variations related to petrographic texture and impurities. J. Geophys. Res.-Solid 1986, 91, 5001-5012.
30. Hecker, C.; Hook, S.J.; van der Meijde, M.; Bakker, W.; van der Werff, H.; Wilbrink, H.; van Ruitenbeek, F.J.A.; de Smeth, B.; van der Meer, F.D. Thermal infrared spectrometer for earth science remote sensing applications—Instrument modifications and measurement procedures. Sensors 2011, 11, 10981-10999.
31. van der Meer, F.D. Analysis of spectral absorption features in hyperspectral imagery. Int. J. Appl. Earth Obs. 2004, 5, 55-68.
32. Clark, R.N.; Roush, T.L. Reflectance spectroscopy-quantitative analysis techniques for remote sensing applications. J. Geophys. Res. 1984, 89, 6329-6340.
33. Kruse, F.A.; Lefkoff, A.B.; Dietz, J.B. Expert system-based mineral mapping in Northern Death-Valley, California Nevada, using the airborne visible infrared imaging spectrometer (AVIRIS). Remote Sens. Environ. 1993, 44, 309-336.
34. Kokaly, R.F.; Clark, R.N. Spectroscopic determination of leaf biochemistry using band-depth analysis of absorption features and stepwise multiple linear regression. Remote Sens. Environ. 1999, 67, 267-287.
35. Smith, M.J.; Stevens, T.; MacArthur, A.; Malthus, T.J.; Lu, H.Y. Characterising Chinese loess stratigraphy and past monsoon variation using field spectroscopy. Quatern. Int. 2011, 234, 146-158.
36. Mutanga, O.; Skidmore, A.K.; Prins, H.H.T. Predicting in situ pasture quality in the Kruger National Park, South Africa, using continuum-removed absorption features. Remote Sens. Environ. 2004, 89, 393-408.
37. Yitagesu, F.A.; van der Meer, F.; van der Werff, H.; Hecker, C. Spectral characteristics of clay minerals in the 2.5–14 μm wavelength region. Appl. Clay Sci. 2011, 53, 581-591.
38. Luleva, M.I.; van der Werff, H.; Jetten, V.; van der Meer, F. Can infrared spectroscopy be used to measure change in potassium nitrate concentration as a proxy for soil particle movement? Sensors 2011, 11, 4188-4206.
40. Hecker, C.; van der Meijde, M.; van der Werff, H.; van der Meer, F.D. Assessing the influence of reference spectra on synthetic SAM classification results. IEEE Trans. Geosci. Remote Sens. 2008, 46, 4162-4172.
Remote Sens. 2012, 4
1003
41. Hubbard, B.E.; Crowley, J.K.; Zimbelman, D.R. Comparative alteration mineral mapping using visible to shortwave infrared (0.4–2.4 μm) Hyperion, ALI, and ASTER imagery. IEEE Trans. Geosci. Remote Sens. 2003, 41, 1401-1410.
42. ITT. Visual Information Solutions; Available online: http://www.ittvis.com (accessed on 18 May 2010).
43. Windeler, D.S.; Lyon, R.J.P. Discriminating dolomitization of marble in the Ludwig Skarn near Yerington, Nevada using high-resolution airborn infrared imagery. Photogramm. Eng. Remote Sensing 1991, 57, 1171-1177.