Page 1
NASA/TM--2000-210185
Effect of In-Flight Exercise and Extravehicular
Activity on Postflight Stand Tests
Stuart M.C. Lee
Wvle Laboratories
Houston TX 77058-2787
Alan D. Moore, Jr.
Wy/e LaboratoriesHouston TX 77058-2787
Janice M. Fritsch-Yelle
Johnson Space CenterHouston TX 77058-3696
Michael Greenisen
Johnson Space CenterHouston TX 77058-3696
Suzanne M. Schneider
Johnson Space CenterHouston TX 77058-3696
Philip P. Foster
Bavlor College of MedicineHouston TX 77058
May 2000
https://ntrs.nasa.gov/search.jsp?R=20000057301 2018-05-25T14:17:18+00:00Z
Page 2
The NASA STI Program Office ... in Profile
Since its founding, NASA has been dedicated to
the advancement of aeronautics and spacescience. The NASA Scientific and Technical
Information (STI) Program Office plays a key
part in helping NASA maintain this importantrole.
The NASA STI Program Office is operated by
Langley Research Center, the lead center forNASA's scientific and technical information. The
NASA STI Program Office provides access to the
NASA STI Database, the largest collection of
aeronautical and space science STI in the world.
The Program Office is also NASA's institutional
mechanism for disseminating the results of its
research and development activities. These results
are published by NASA in the NASA STl Report
Series, which includes the following report types:
TECHNICAL PUBLICATION. Reports of
completed research or a major significant
phase of research that present the results of
NASA programs and include extensive data
or theoretical analysis. Includes
compilations of significant scientific andtechnical data and information deemed to
be of continuing reference value. NASA
counterpart of peer-reviewed formal
professional papers, but having less
stringent limitations on manuscript length
and extent of graphic presentations.
CONFERENCE PUBLICATION.
Collected papers from scientific and
technical conferences, symposia,
seminars, or other meetings sponsored or
co-sponsored by NASA.
SPECIAL PUBLICATION. Scientific,
technical, or historical information from
NASA programs, projects, and missions,
often concerned with subjects having
substantial public interest.
TECHNICAL TRANSLATION. English-
language translations of foreign scientific
and technical material pertinent toNASA's mission.
Specialized services that complement the STI
Program Office's diverse offerings include
creating custom thesauri, building customized
databases, organizing and publishing researchresults ... even providing videos.
For more information about the NASA STI
Program Office, see the following:
• Access the NASA STI Program Home
Page at http://www.sti.nasa.gov
• E-mail your question via the Intemet to
[email protected]
TECHNICAL MEMORANDUM.
Scientific and technical findings that are
preliminary or of specialized interest, e.g.,
quick release reports, working papers, and
bibliographies that contain minimalannotation. Does not contain extensive
analysis.
CONTRACTOR REPORT. Scientific and
technical findings by NASA-sponsored
contractors and grantees.
• Fax your question to the NASA STI HelpDesk at (30 ! ) 621-0 !34
• Telephone the NASA STI Help Desk at(301) 621-0390
Write to:
NASA STI Help Desk
NASA Center for AeroSpace Information7121 Standard Drive
Hanover, MD 21076-1320
Page 3
NASA/TM--2000-210185
Effect of In-Flight Exercise and Extravehicular
Activity on Postflight Stand Tests
Stuart M.C. Lee
Wvle Laboratories
Houston, TX 77058-2 787
Alan D. Moore, ,11".
Wvle Laboratories
Houston TX 77058-2787
Janice M. Fritsch-Yelle
Johnson Space CenterHouston TX 77058-3696
Michael Greenisen
Johnson Space Center
Houston TX 77058-3696
Suzanne M. Schneider
Johnson Space CenterHouston TX 77058-3696
Philip P. Foster
Baylor College of Medicine
Houston TX 77058
National Aeronautics and
Space Administration
Lyndon B. Johnson Space CenterHouston, Texas 77058-3696
May 2000
Page 4
Acknowledgments
The authors wish to thank all the crewmembers who participated in this investigation; the
Exercise Physiology and Cardiovascular Laboratory staff at Johnson Space Center for
participating in the data collection; Donna South for assistance with collating the stand test data;
the Johnson Space Center Flight Projects Group for coordinating all the testing sessions;
Dr. Karin Loftin and Dr. Michael Powell of the Environmental Physiology Laboratory for
assistance with EVA data; Dr. Todd Schlegei, Chris Miller, Elisabeth Spector, Scott Smith,
Dr. Phillip Bishop, and Lesley Lee for their editorial comments; and Dr. Charles Sawin for his
support of this project.
This work was supported by NASA Grant #NAS9-18492 and the Extended Duration Orbiter
Medical Project.
Available from:
NASA Center for AeroSpace Inlbrmation7121 Standard DriveHanover, MD 21076-1320301-621-0390
National Technical Inlormation Service
5285 Port Royal RoadSpringfield, VA 22 !61
703 -605 -6000
This report is also available in electronic form at http://techreports.larc.nasa.gov/cgi-bin/NTRS
Page 5
Contents
Acknowledgments .................................................................................................................
Acronyms and Nomenclature ................................................................................................
Abstract .................................................................................................................................
I. Introduction ...................................................................................................................
II. Methods .........................................................................................................................
A. Stand Test ..................................................................................................................
B. Pre- and In-Flight Exercise ........................................................................................
C. Fluid Loading ............................................................................................................
D. Statistical Analyses ....................................................................................................
III. Results ...........................................................................................................................
A. Subject Characteristics, Exercise, and Fluid Ingestion .............................................
B. Stand Test Tolerance Time .......................................................................................
C. Heart Rate ..................................................................................................................
D. Systolic Blood Pressure .............................................................................................
E. Diastolic Blood Pressure ...........................................................................................
F. Mean Arterial Pressure ..............................................................................................
G. Pulse Pressure ............................................................................................................
H. EVA Group ...............................................................................................................
IV. Discussion .....................................................................................................................
Ao
B.
C.
D.
E.
F.
V.
VI.
Plasma Volume .........................................................................................................
Lower Body Compliance ...........................................................................................
Cardiac Atrophy and Mechanics ...............................................................................
Baroreceptor Function ...............................................................................................
EVA Only Group .......................................................................................................
Limitations ................................................................................................................
Summary .......................................................................................................................
References .....................................................................................................................
Pageii
V
vi
l
2
3
3
4
5
5
5
6
7
8
9
9
9
lO
12
13
13
14
15
15
16
17
17
..,
111
Page 6
Contents(continued)
Tables
Table l: Subject Characteristics ............................................................................................
Table 2: Pre- and In-Flight Exercise ....................................................................................
Table 3: HR and BP Responses to Standing (Mean _+SE) ...................................................
Table 4: HR and BP Responses to S[anding (Mean _+SE) in EVA Group Only .................
Figures
Figure I: Increase in HR from supine to standing in all the exercise groups
pre- and postflight ..........................................................................................................
Figure 2: Decrease in PP from supine to standing in all thlee exercise groups
pre- and postflight ..........................................................................................................
Page
2
6
7
il
8
10
iv
Page 7
Acronyms and Nomenclature
ANOVA
bpmBP
d
DBP
degEVA
G
HI_×
hr
HR
HR_
L
LBNP
LO¢.,
MAP
MEDe_
min
mmHgPOST
PP
PRE
SBP
SE
sec
analysis of variance
beats per minute
blood pressure
day(s)
diastolic blood pressure
degree
extravehicular activity
gravity
high
hour(s)
heart rate
maximum heart rate
liter
lower body negative pressurelow
mean arterial pulsemedium
minute(s)
milligrams of mercury (pressure reading)
after landing
pulse pressure
prior to launch
systolic blood pressurestandard error
second(s)
V
Page 8
ABSTRACT
The purpose of this study was to determine whether exercise performed by Space Shuttle
crewmembers during short-duration spaceflights (9-16 d) affects the heart rate (HR) and blood
pressure (BP) responses to standing within 2-4 hr of landing. Thirty crewmembers performed
self-selected in-flight exercise and maintained exercise logs to monitor their exercise intensity
and duration. A 10-rain stand test, preceded by at least 6 min of quiet supine rest, was completed
10-15 d before launch (PRE) and within four hours of landing (POST). Based upon their in-
flight exercise records, subjects were grouped as either high (HI, x: = 3x/week, HR = 70% HRm_x,
= 20 min/session, n = 11), medium (MEDex: = 3x/week, HR = 70% HRm,_, = 20 min/session,
n = 10), or low (LOex: = 3x/week, HR and duration variable, n = 11) exercisers. HR and BP
responses to standing were compared between groups (ANOVA. or analysis of variance,
P <0.05). There were no PRE differences between the groups in supine or standing HR and BP.
Although POST supine HR was similar to PRE, all groups had an increased standing HR
compared to PRE. The increase in HR upon standing was significantly greater after flight in the
LO_x group (36 + 5 bpm) compared to HI_ or MED_× groups (25 + 1 bpm; 22 + 2 bpm).
Similarly, the decrease in pulse pressure (PP) from supine to standing was unchanged after
spaceflight in the MEDe_ and HI_ groups, but was significantly less in the LOex group (PRE:
-9 + 3; POST: -19 + 4 mmHg). Thus, moderate to high levels of in-flight exercise attenuated HR
and PP responses to standing after spaceflight compared.
vi
Page 9
I. INTRODUCTION
Postflight orthostatic intolerance is a consistent finding among Space Shuttle
crewmembers (I, 2, 3). Fluid loading before reentry and the inflation of an anti-orthostatic lower
body pressure garment (G-suit) during gravitational stress are lwo countermeasures to postflight
orthostatic intolerance which are currently required on a routine basis (Space Shuttle Operational
Flight Rules. NSTS 12820, Vol. A. Section 13: Aeromedical, 1996). However, fluid-loading
alone does not completely maintain posfflight orthostatic responses, even after short-duration
flights (4). Seventeen crewmembers who employed the fluid loading countermeasure after
spaceflights of 54 hr to 92 hr had lower standing heart rates (HR) compared to nine controls.
However, the postflight standing HR of the fluid-loading subjects still was significantly greater
(24%) than preflight. Further, Fritch-Yelle et al. (3) found no significant differences in plasma
volume between crewmembers who became presyncopal during standing on landing day and
those who did not. The anti-G-suit has been shown to increase stroke volume and cardiac output
during standing (5) and to increase +Gz stress tolerance during acceleration in high-performance
aircraft (6). Unfortunately its use may be detrimental during emergency egress since the G-suit
severely restricts mobility during ambulation and increases the metabolic cost of walking (7). A
countermeasure to postflight orthostatic intolerance is desired which would have the benefits of
the G-suit without its limitations.
Current NASA flight rules require crewmembers on missions greater than 10 d to perform
in-flight exercise to protect emergency egress abilities (Space Shuttle Operational Flight Rules,
NSTS 12820, Vol. A. Section 13: Aeromedical: 13-57, 1996). The Shuttle flight crew
(commander, pilot, and flight engineer) are required to exercise every other day during a nominal
Space Shuttle mission. Mission and payload specialists are required to exercise every third day,
although every other day is preferred if the work schedule allows. Although the frequency of
exercise is defined, the exercise duration and intensity are not delineated.
The effect of exercise on orthostatic tolerance is somewhat controversial. In cross-
sectional and training studies in ambulatory subjects, exercise capacity has been shown to have
no effect, a detrimental effect, or a positive influence on orthostasis (8). After real or simulated
microgravity exposure, orthostatic intolerance has been associated with reduced plasma and
blood volume, increased heart rate during orthostatic stress, lower standing stroke volume and
cardiac output, decreased responsiveness of the carotid baroreceptor cardiac reflex, and increased
leg compliance (9). Exercise during spaceflight may serve as an effective countermeasure to
each of these potential contributing mechanisms to orthostatic intolerance.
Page 10
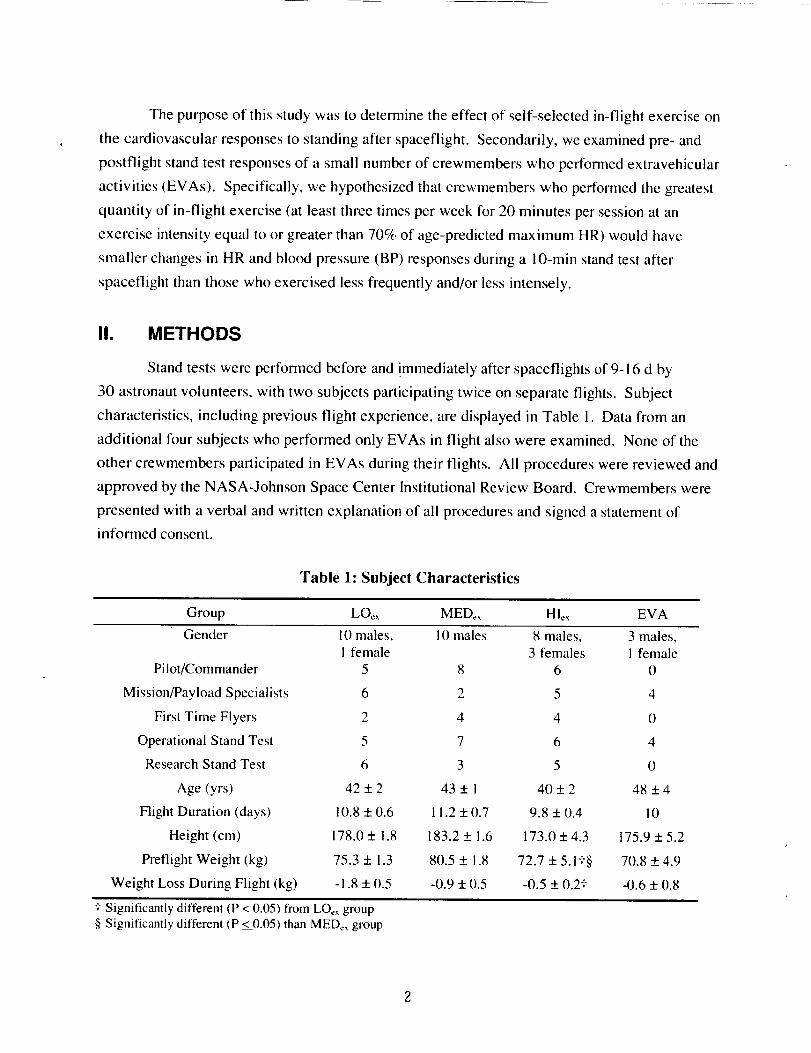
The purpose of this study was to determine the effect of self-selected in-flight exercise on
the cardiovascular responses to standing after spaceflight. Secondarily, we examined pre- and
postflight stand test responses of a small number of crewmembers who performed extravehicular
activities (EVAs). Specifically, we hypothesized that crewmembers who performed the greatest
quantity of in-flight exercise (at least three times per week for 20 minutes per session at an
exercise intensity equal to or greater than 70% of age-predicted maximum HR) would have
smaller changes in HR and blood pressure (BP) responses during a 10-min stand test after
spaceflight than those who exercised less frequently and/or less intensely.
II. METHODS
Stand tests were performed before and !mmediately after spaceflights of 9-16 d by
30 astronaut volunteers, with two subjects participating twice on separate flights. Subject
characteristics, including previous flight experience, are displayed in Table 1. Data from an
additional four subjects who performed only EVAs in flight also were examined. None of the
other crewmembers participated in EVAs during their flights. All procedures were reviewed and
approved by the NASA-Johnson Space Center Institutional Review Board. Crewmembers were
presented with a verbal and written explanation of all procedures and signed a statement of
informed consent.
Table 1: Subject Characteristics
Group LOex MEDex HLx EVA
Gender 10 males, 10 males 8 males, 3 males,i female 3 females 1 female
Pilot/Commander 5 8 6 0
Mission/Payload Specialists 6 2 5 4
First Time Flyers 2 4 4 0
Operational Stand Test 5 7 6 4
Research Stand Test 6 3 5 0
Age (yrs) 42 + 2 43 + ! 40 + 2 48 + 4
Flight Duration (days) 10.8 + 0.6 11.2 + 0.7 9.8 + 0.4 10
Height (cm) 178.0 + 1.8 183.2 + 1.6 173.0 + 4.3 175.9 + 5.2
Preflight Weight (kg) 75.3 + 1.3 80.5 + 1.8 72.7 + 5.1 t§ 70,8 + 4.9
Weight Loss During Flight (kg) -I .8 + 0.5 -0.9 + 0.5 -0.5 + 0.2? -0.6 + 0.8
I Significantly different (P < 0.05) from LO_xgroup§ Significantly different (P <0.05) than MEDCxgroup
Page 11
Eachcrewmembercompleteda standtest I0 to 15d beforelaunchandwithin 2 to 4 hr
after landing. All preflight standtestswerecompletedat NASA-JohnsonSpaceCenterin
Houston,Texas.Postflight standtestswereconductedeitherat NASA-KennedySpaceCenter,
Florida,or at theDrydenFlightResearchCenterat EdwardsAir ForceBase.California.
Crewmembersself-selectedin-flightexerciseregimens,andweregroupedretrospectivelyduring
dataanalysisaccordingto the intensity,duration,andfrequencyof exercisetheyperfoNned.
A. Stand Test
Stand tests were performed using one of two protocols. One set of data (n = 22) was
obtained using the "operational" protocol, a stand test which was routinely administered to
crewmembers returning from a Shuttle mission. Subjects in this category were supine for 6 min
before standing. Subjects in the second data set (n = 13) participated in a research protocol
which required that they were supine for at least 30 min before standing. The distribution of
crewmembers participating in each test by subject group is displayed in Table 1. All subjects
were supine for the same amount of time after flight as they were before flight.
At the completion of the supine portion of each protocol, crewmembers were assisted by
test operators to a free standing position with their feet approximately 15 cm apart where they
remained for a period of 10 min or until signs or symptoms of pre-syncope occurred. Subjects
who became presyncopal were immediately returned to the supine position, and the test was
terminated. Presyncope was defined as any of the following: a sudden drop in systolic blood
pressure (SBP) greater than 25 mmHg/min, a sudden drop in diastolic blood pressure (DBP)
greater than 15 mmHg), a sudden drop in HR greater than 15 bpm, an absolute SBP less than
70 mmHg, dizziness, lightheadedness, or nausea.
HR was recorded from a 3-lead electrocardiogram during the last 15 sec of each rain.
SBP and DBP were measured by the auscultatory method by a trained technician during the last
30 sec of each minute. Mean arterial (MAP = 1/3 SBP +2/3 DBP) and pulse pressures (PP =
SBP - DBP) were calculated from SBP and DBP measurements. Heart rhythm and change in BP
in the finger (Finapres, Ohmeda, Inc.) were monitored continuously for signs of presyncope, but
were not used for subsequent data analysis.
B. Pre- and In-Flight Exercise
Crewmembers self-selected exercise before and during spaceflight. To document the
exercise performed, crewmembers recorded HR each 15 sec during their exercise sessions using
a HR monitor (Vantage XL, Polar, Inc., Stamford, CN) previously validated in our laboratory and
Page 12
during spaceflight (10). They also maintained a written exercise log of their activities. Data files
from the HR monitor were downloaded and analyzed postflight. The average HR during each
exercise session was compared against the subject's age-predicted maximal HR to estimate
exercise intensity. The frequency of exercise was normalized as the number of exercise sessions
completed in a 7-d period.
Before flight, crewmembers wore a HR monitor during exercise sessions and maintained
an exercise log for approximately 25-30 d before launch. Exercise performed by these subjects
was primarily running or jogging, but also included some cycling, rowing, and swimming.
During spaceflight, crewmembers exercised primarily on a semi-recumbent cycle
ergometer (Innovision, Inc., Denmark) that was specifically designed for use in microgravity.
Three crewmembers on one flight performed all their in-flight exercise on experimental versions
of the new flight treadmill and rower ergometer.
Crewmembers were grouped retrospectively for statistical analysis based upon their in-
flight exercise routines. Subjects in the high exercise group (HIex) exercised at least three times
per week at an average exercise intensity greater than 70% of age-predicted maximum HR for an
average of at least 20 min per session. Subjects in the medium exercise group (MEDex) exercised
at least three times per week at an average exercise intensity less than 70% of age-predicted
maximum HR for an average of at least 20 min per session. Subjects in the low exercise group
(LO_x) exercised less than three times per week and their exercise intensity and duration varied.
Of the three subjects who performed in-flight exercise on the prototype treadmill and rower, two
were in the MED_x group and one was in the LO_x group.
Of the four subjects in the EVA group, three subjects performed only EVAs. A fourth
subject on this flight performed EVAs and one cycle exercise session.
C. Fluid Loading
It is a NASA flight rule that crewmembers consume approximately one liter of water and
eight salt tablets, or some other approved isotonic drink solution, during the two hours before
Shuttle landing as a countermeasure to orthostatic intolerance (Space Shuttle Operational Flight
Rules, NSTS 12820, vol. A, Section 13: Aeromedicah 13-57, 1996). Crewmembers also are
allowed to consume fluid on the crew transport vehicle as they return to the clinic for medical
testing. Crewmembers are requested to report the fluid and salt tablets they've ingested during
their in-flight fluid loading procedure as well as the fluid ingested after landing before the
administration of the stand test at the medical testing facility.
Page 13
D. Statistical Analyses
The last 2 min of data in the supine posture were averaged to represent the HR and
arterial BP values in that position. Because not all subjects were able to complete the entire
10 rain of standing postflight, data from minute seven of standing in all subjects were used as the
standing value which represented 97% of all participants.
Statistical comparisons were made only between the LO¢_, MED_, and HI_x groups. Due
to the relatively small sample size of the EVA group, their results are reported separately without
statistical comparison. Time completed during the upright portion of the stand test before and
after flight was analyzed using a three-by-two analysis of variance (ANOVA) design with groups
as the non-repeated measure factor and time as the repeated measure factor. HR and BP data pre-
and postflight were analyzed using a two-by-two-by-three ANOVA design in which group was
the non-repeated measure factor and time and posture were the repeated measure factors. The
change of HR and BP from supine to standing was analyzed by using a two-by-three ANOVA
design in which group was the non-repeated measure factor and time was a repeated measure
factor. Tukey's Honest Significant Difference test was used for post-hoc comparisons. All
analyses were completed using STATISTICA for the Macintosh (Statsoft, Inc., Tulsa, OK), and
statistical significance was accepted at P = 0.05. All values are reported as mean + standard error
(SE).
III. RESULTS
A. Subject Characteristics, Exercise, and Fluid Ingestion
The three groups did not differ in age, height, or flight duration (Table I ). The preflight
body weight of the HIe_ group was significantly less than that of the other two groups. The
MED_x group consisted entirely of male crewmembers and the LO_,_ group included one female,
while the Hie× group included three females. Postflight body weight was significantly less than
preflight only in the LOCx group. The change in body weight in the LO¢_ group from pre- to
postflight was significantly greater than in the HI_ group but not significantly different from the
MEDc_ group.
Before flight, the three groups of subjects did not differ in mean exercise HR and duration
per exercise session, but were significantly different in the frequency with which they exercised
(Table 2). The Hie,, group exercised significantly more frequently than the LOex group but not
the MED¢x group.
Page 14
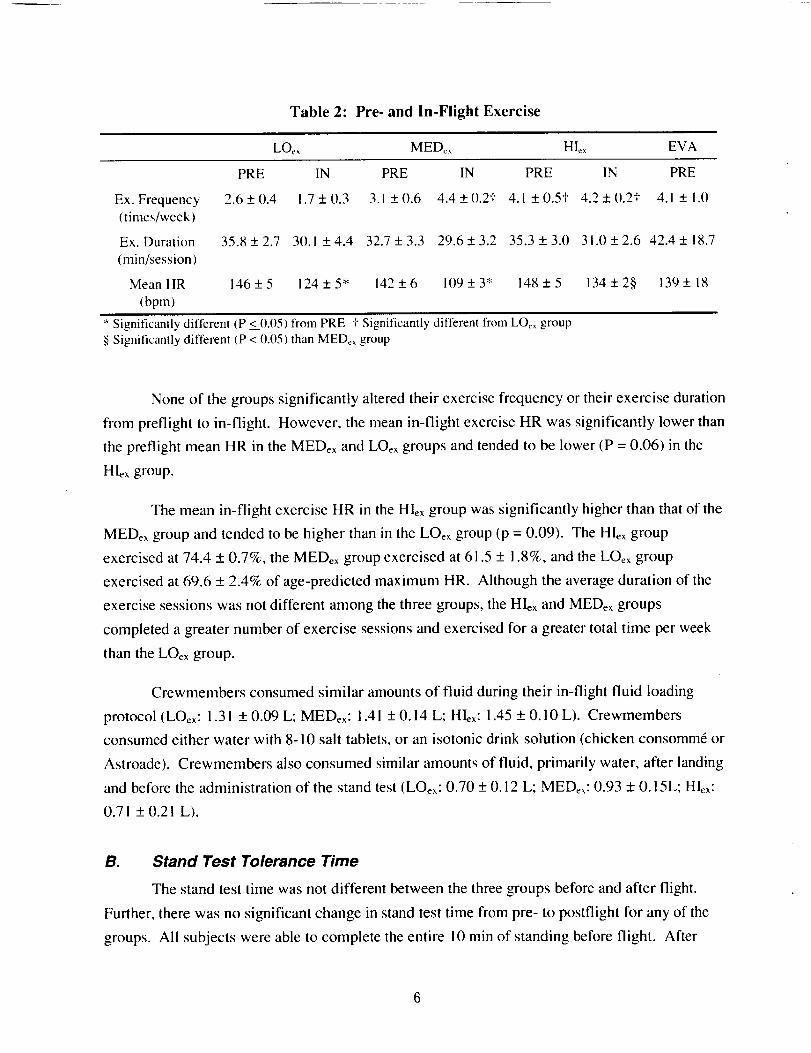
Table 2: Pre- and In-Flight Exercise
LO_ MED_ HI_ EVA
Ex. Frequency(times/week)
Ex. Duration
(min/session)
Mean HR
(bpm)
PRE IN PRE IN PRE IN PRE
2.6+0.4 !.7+0.3 3.1+0.6 4.4+0.2t 4.1+0.5+ 4.2+(I.2+ 4.1+1.0
35.8+2.7 3(1.1 +4.4 32.7+3.3 29.6+3.2 35.3+3.0 31.0+2.6 42.4+18.7
146+5 124 + 5" 142+6 109+3" 148+5 134+2§ 139+ 18
* Significantly different (P <__0.05)from PRE _"Significantly different from LO_ group§ Significantly different (P <0.05) than MED¢_ group
None of the groups significantly altered their exercise frequency or their exercise duration
from preflight to in-flight. However, the mean in-flight exercise HR was significantly lower than
the preflight mean HR in the MEDex and LOex groups and tended to be lower (P = 0.06) in the
Hlex group.
The mean in-flight exercise HR in the HIcx group was significantly higher than that of the
MEDe_ group and tended to be higher than in the LOe_ group (p = 0.09). The HIex group
exercised at 74.4 + 0.7%, the MED_x group exercised at 61.5 + 1.8%, and the LOe_ group
exercised at 69.6 + 2.4% of age-predicted maximum HR. Although the average duration of the
exercise sessions was not different among the three groups, the HIcx and MED_x groups
completed a greater number of exercise sessions and exercised for a greater total time per week
than the LO_ group.
Crewmembers consumed similar amounts of fluid during their in-flight fluid loading
protocol (LOex: 1.31 + 0.09 L; MED¢×: 1.41 + 0.14 L; HI, x: 1.45 + 0.10 L). Crewmembers
consumed either water with 8-10 salt tablets, or an isotonic drink solution (chicken consomm6 or
Astroade). Crewmembers also consumed similar amounts of fluid, primarily water, after landing
and before the administration of the stand test (LO¢_: 0.70 + 0.12 L; MED_x: 0.93 + 0.15L; HI, x:
0.71 + 0.21 L).
B. Stand Test Tolerance Time
The stand test time was not different between the three groups before and after flight.
Further, there was no significant change in stand test time from pre- to postflight for any of the
groups. All subjects were able to complete the entire 10 min of standing before flight. After
Page 15
flight, onesubjectin theLOexgroup(9%), two subjectsin theMEDexgroup(20%),andone
subjectin theHIexgroup(9%)becamepre-syncopalbeforethecompletionof the I0 rain of
standing.Meanpostflight standtesttimeswere9.5_+0.5,9.4+ 0.4. and 9.8 + 0.2 rain in the
LOeb, MED_, and HI_x groups, respectively.
Of the four subjects who reported signs and symptoms of presyncope which resulted in
early test termination during the postflight stand test, two subjects reported general weakness,
one reported nausea and vomited, and one reported iightheadedness. All four subjects who
became presyncopal had failing BP at presyncope from initial standing. However, the decline in
standing BP was not rapid and did not meet the criteria for test termination. HR initially
increased in each subject as BP fell, but decreased immediately before presyncope in three of the
four. All four subjects were mission or payload specialists. Two were first-time flyers and two
were on their second flight. Two had military aviation backgrounds. None of the presyncopal
subjects were female.
Table 3: HR and BP Responses to Standing (Mean +_SE)
LO_ MED_ HI_,-
Supine Stand Supine Stand Supine Stand
HR Pre 59+3 78+4# 54+4 71+4# 56+2 74+3#
(bpm) Post 63+ I 99+6*# 60+4 83+5*+# 61 +2 86+3"I"#
SBP Pre 113+3 112+3 114+3 106+3 115+4 109+5
(mmHg) Post 119+3 11(t+4# 120+3 110+_4# 119+5 114_+5
DBP Pre 73 _+2 79 _+2 74 + 3 76 + 3 71 -+3 75 -+4
(mmHg) Post 77 _+2 87 _+2*# 80 + 2 82 _+3 78 _+4* 86 _+4#
MAP Pre 86 _+2 90 _+2 87 + 3 86 _+3 86 _+3 87 _+4
(mmHg) Post 91 _+2 95_+2* 94+2* 91 -+3 92-+4* 95_+4*
PP Pre 41 _+2 33 _+3 40 + 1 30 + 2# 44 + 3 34 _+3#
(mmHg) Post 42 _+2 23 _+4*# 40 + 3 28 + 3# 41 _+2 28 _+2#
* Significantly different from PRE "i"Significantly different from LO_, group # Significantly different than supine
C. Heart Rate
Preflight supine and standing HR and the HR change from supine to standing did not
differ between groups (Table 3). After spaceflight, supine HR was not different from preflight in
any group, but standing HR was elevated significantly above preflight standing HR in all groups.
Page 16
The postflight standing HR in the LOex group was significantly greater than that of either the
MED_x or HI_x groups, which did not differ from each other. The change in HR from supine to
standing was significantly greater in the LO_x group (36 + 5 bpm) after flight than either the
MED_x (22 + 2 bpm) or HI_ groups (25 + 2 bpm), which did not differ from each other (Figure 1).
E
,4,,,,a
ZZ¢,q
[] Pre
• Post
• t ,t
0
LOex MEDex HIex
* Significantly greater increase than preflight (P < 0.05). t Significantly less increase than LOeb.
Figure 1: Increase in HR from supine to standing in all the exercise groups
pre- (open bar) and postflight (solid bar).
D. Systolic Blood Pressure
Supine and standing SBP did not differ between groups before flight and were not
different among groups after flight (Table 3). Preflight standing SBP was not significantly
different than supine SBP in all groups, but after spaceflight SBP decreased significantly from
supine to standing in the MED_ and LO_ groups. There was no significant change in SBP from
supine to standing after flight in the HI_ group. However, the SBP change from supine to
standing was not different among the groups before flight and was not significantly changed in
any group after flight.
Page 17
E. Diastolic Blood Pressure
Supine and standing DBP were not different among any of the groups before flight
(Table 3). Postflight supine DBP increased significantly from preflight in the HI_ group and
tended to increase (P = 0.06) in the MEDex group but not in the LOe_ group. Postflight standmg
DBP was elevated significantly above preflight in the HIe_ and LOex groups and tended to
increase (P = 0.08) in the MEDex group. DBP was unchanged fi'om supine to standing preflight,
but after spaceflight increased significantly from supine to standing in the Hl_ and LO_, groups.
However, the change in DBP from supine to standing was unaffected by spaceflight in any group.
F. Mean Arterial Pressure
Supine and standing MAP did not differ between groups before flight (Table 3).
Postflight supine MAP increased significantly from preflight in the HI_ group and in the MED_
group and tended to increase (P = 0.08) in the LO_x group. Postflight standing MAP was
elevated significantly above preflight in the HI_x and LO_ groups but only tended (p = 0.10) to
increase in the MED_x group. MAP did not change from supine to standing either before or after
spaceflight, and the change in MAP from supine to standing was unaffected by spaceflight in any
group.
G. Pulse Pressure
Supine and standing PP were not different among groups before flight and were not
different in either the HI_ or MED_x groups after flight (Table 3). Although the postflight supine
PP was similar to preflight in the kOex group, the standing PP was significantly less after flight
than preflight. Standing PP was not different after spaceflight in the MEDe_ and HI_ groups. PP
decreased significantly from supine to standing in all groups both pre- and postflight, except in
the LO_x group preflight in whom it only tended to decrease (P = 0.06). There was no change in
the PP response from supine to standing after flight compared to preflight in the HI_x and MED_
groups (Figure 2), but the response was significantly greater postflight than preflight in the LO_
group (- 19 + 4 vs. -9 + 3 mmHg).
9
Page 18
EEcD
t
[] Pre
• Post
LOex MEDex HIcx
* Significantly greater decrease than preflight (P < 0.05). t Significantly less decrease than LOe,.
Figure 2: Decrease in PP from supine to standing in all three exercise groups
pre- (open bar) and postflight (solid bar).
H. EVA Group
Subjects in this group (n = 4) were all crewmembers from the same flight and appear
similar in height, weight, and flight duration to the other three groups (Table 1). However, the
mean age of this group (48 + 4 yr) appeared higher than the other three groups. This group of
subjects was composed of crewmembers who had made a minimum of two previous flights. One
crewmember was a veteran of four previous missions.
The preflight exercise habits of this group appeared similar to those of the MEDex and
HI_x groups (Table 2) in duration, frequency, and mean HR. During their mission, two
crewmembers performed two EVAs, and two crewmembers performed three EVAs. The average
length of each EVA was 383 + 22 min. The mean HR during EVA was 108 + 12 bpm,
approximately 62 + 6% of age-predicted maximal HR for these crewmembers. Only one
crewmember performed any additional exercise. This crewmember performed very low-intensity
cycle exercise for 90 rain but did not wear a HR monitor.
EVA crewmembers appeared to have consumed more fluid and salt tablets than the
crewmembers in the other groups. Before landing, EVA crewmembers consumed an average of
1.58 + 0.20 L of fluid with 12 salt tablets each. The mean consumption for all other
10
Page 19
crewmembers was !.39 + 0.06 L of fluid and 9.3 + 0.9 salt tablets. Further, EVA crewmembers
consumed an average of 1.26 + 0.42 L of fluid from the time of landing to the performance of the
stand test but other crewmembers consumed only an average 0.79 + 0.10 L of fluid during
transport from the landing site to the data collection facility.
Preflight, all EVA crewmembers completed the 10-min stand test. Preflight HR and BP
data from this group appeared quantitatively similar to data from the other three groups (Table 4).
On landing day, all EVA subjects completed the 10-rain stand test. Supine HR appeared
unchanged from preflight but standing HR was elevated. The mean change in HR from supine to
standing (27 + 10 bpm) in the EVA crewmembers was quantitatively similar to the MEDe, and
HIcx groups. The change in BP from supine to standing in the EVA group appeared similar to the
other three groups preflight and appeared to be more similar to the LOex and MED_x groups
postflight. However, the resting SBP (134 + 3 mmHg) in the EVA group was higher postflight
than in any of the other groups. The DBP and MAP appeared to be similar to the other three
groups before and after spaceflight. However, the change in PP from supine to standing after
flight most closely resembled the response observed in the LOex group.
Table 4: HR and BP Responses to Standing (Mean + SE) in EVA Group Only
All Without Veteran
(n=4) Flyer (n=3t
Supine Stand Supine Stand
HR Pre 60 + 6 72 + 9 63 + 8 76 + 12
(bpm) Post 62 + 5 89 + 10 64 + 6 99 + 3
SBP Pre 115 + 6 104 + 3 112_+ 7 106 + 3
(mmHg) Post 134+3 123+6 133+4 119+6
DBP Pre 74+1 73+2 74+1 73+3
(mmHg) Post 83 + 3 86 + 3 8(7 + 0 85 + 4
MAP Pre 88 + 2 83 + 3 87 + 2 84 + 3
(mmHg) Post 99 + I 98 + 2 98 + 1 96 + 2
PP Pre 41+6 31+2 38+8 37+7
(mmHg) Post 53 + 3 33 + 1 54 + 4 35 + 9
11
Page 20
IV. DISCUSSION
This study, the first to document in-flight exercise practices of Space Shuttle
crewmembers in relation to their postflight HR and BP responses to standing, has resulted in a
significant finding. Crewmembers who exercise at least three sessions per week and 20 rain per
session (HI_x and MEDex) during spaceflight had lower HR and PP responses to postflight
standing compared to crewmembers who exercised less than three times per week (LOex).
Additionally, crewmembers who exercised at an intensity level which elicited greater than 70%
of age-predicted maximum HR for 20 min three or more times per week (HI, x) were better able
to maintain their SBP and increase their DBP from supine to standing after spaceflight.
Beginning with early experiences in the Mercury program, it has been well documented
that many crewmembers are subject to orthostatic intolerance after spaceflight ( ! i ). Recent
investigations have documented that this problem persists after Space Shuttle missions. Standing
HR was significantly elevated and the maintenance of mean arterial blood pressure was
compromised after spaceflights as short as 2 to 8 d (4). Further, 13% of crewmembers could not
complete a 5-min stand test (12), and 25% could not complete a 10-min stand test (2, 3) after
Shuttle flights of less than 15 d. Five out of ten crewmembers could not tolerate a complete
lower body negative pressure (LBNP) ramp test to -60 mmHg after Shuttle missions of 6 to 14 d
although all were tolerant before microgravity exposure (13). Recently, Buckey et al. ( I )
reported that 60% of the payload specialists participating in the SLS-1 and -2 Spacelab flights
were unable to tolerate a 10-rain stand test. Although the mechanisms involved have not been
identified clearly, postflight orthostatic intolerance has been associated with reduced plasma and
blood volume (12), lower standing stroke volume (1, 11, 12), inability to increase total peripheral
resistance ( 1, 3, !2), decreased vasoconstrictor responsiveness with standing ( 12), decreased
responsiveness of the carotid baroreceptor cardiac reflex (2, 14), and possibly decreased in-flight
variability of HR and BP (15).
The effect of exercise on orthostatic tolerance after bed rest, an analogue of spaceflight, is
unclear. The combination of exercise and orthostatic stress appears to have a beneficial effect on
post-bed rest orthostatic tolerance. One of two subjects who performed chair exercise during a
24-d bed rest maintained pre-bed rest tilt tolerance (16), and subjects who performed upright
exercise or supine exercise against LBNP maintained tilt tolerance to a greater degree than
subjects who performed no exercise (17). However, similar results have not been shown
consistently in subjects who performed exercise in the supine position ( 16, 18), a position used to
simulate exercise during spaceflight. The +Gz tolerance of subjects who performed two 30-min
periods of supine cycle exercise daily at 68% of maximal oxygen uptake during a 14-d bed rest
12
Page 21
wasreducedto a similardegreeassubjectswho performednoexercise(19). Also, when subjects
who were bed rested for 30 d performed intense interval exercise twice daily, with exercise
intensities alternating between 40% and up to 90% of maximal oxygen consumption, tolerance to
60-deg head-up tilt was not different from control subjects (20). However, iq a recent
investigation, LBNP tolerance was maintained in subjects performing a single bout of intense
exercise 24 hr before the cessation of a 16-d bed rest (21 ).
A. Plasma Volume
Plasma volume loss has been consistently observed after spaceflight ( 11 ) and bed rest
(22). A maintenance of plasma volume in crewmembers returning fi'om spaceflight may
attenuate the increased HR, decreased venous return, and reduced stroke volume observed during
postflight standing (1, 12). In bed rest, when subjects performed either twice daily 30-min bouts
of supine aerobic cycle exercise at 68% of VO2m,,x (22) during a 14-d bed rest or an supine
intense interval cycle exercise twice a day 5 d/week during bed rest during a 30-d bed rest (24),
plasma volume loss was prevented. In the present study, the in-flight exercise performed by
MEDe_ and HI_ groups may have attenuated the plasma volume loss, partially reflected in
decreased body weight loss in these two groups after spaceflight and may have contributed to a
lower standing HR response than in the LOe_ group.
Even if in-flight exercise attenuated plasma and blood volume loss, one might still expect
to see changes in HR and BP responses to standing after spaceflight. In bed rest investigations of
24 hr (25) to one week (26), intravenous fluid loading at the end of bed rest to restore plasma
volume improved but did not restore orthostatic responses to pre-bed rest levels. Also, when
plasma volume was maintained with supine exercise, orthostatic tolerance was not maintained
( 19, 20). Similarly, although the HR response to standing in crewmembers who completed the
current Space Shuttle fluid loading protocol immediately before reentry was significantly less
than the response in those who did not fluid load, their postflight HR response still was greater
than the preflight response (4). These studies suggest that the restoration of plasma volume only
partially restores the cardiovascular responses to standing after spaceflight. However, plasma
volume status has not been correlated with orthostatic tolerance on landing day ( I, 3).
B. Lower Body Compliance
Increased leg or lower body compliance results in greater venous pooling, decreased
venous return, and the earlier onset of presyncope in some subjects (27). However, increased leg
compliance has not been consistently observed after spaceflight ( 1, 11 ) or bed rest (22). A recent
13
Page 22
investigation which employed a stand test similar to the one used in this investigation after
spaceflights of similar duration suggested that there was no postflight increase in leg compliance
during standing although 60% of its subjects became presyncopal on landing day ( I ).
Despite a lack of increase in leg compliance after short-duration spaceflight, it is possible
that blood pooling may be enhanced in different locations in the lower body. Splanchnic blood
flow normally decreases by 40% and splanchnic vascular resistance increases by 45% as the
cardiovascular system adjusts to the head-up posture (28). This vasoconstriction accounts for
approximately 30% of total adjustment by the peripheral vasculature to maintain MAP (29).
Savilov et al. (30) found that ambulatory subjects with poor orthostatic tolerance had a larger
sequestering of blood in the abdominal region during LBNP than those who tolerated the
stressor. Similarly, after a 120-d bed rest, blood was sequestered in the abdomen during LBNP
although vasoconstriction was evident in this ,'egion before bed rest (30). It is possible that
splanchnic pooling increases with standing after spaceflight and that in-flight exercise may
attenuate or prevent this response. Exercise is well known to produce both splanchnic and renal
vasoconstriction (27); repetitive and moderately intense exercise may be effective in maintaining
this vasoconstrictor response during spaceflight.
C. Cardiac Atrophy and Mechanics
Recent data from Levine et al. (31 ) suggest that changes in cardiac mechanics and
function during bed rest may have a significant impact on cardiac responses to standing.
Subjects in a 14-d bed rest study who performed no exercise countermeasures had a 5% decrease
in cardiac mass, a decrease in left ventricular distensibility, and an increase in the slope of the left
ventricular Starling relationship. This would result in an accentuated fall in stroke volume for a
given decline in venous return and could contribute to post-bed rest orthostatic intolerance.
Similar data were reported by these authors after short-duration spaceflight. Levine et al. (31)
suggested that these cardiac changes may have occurred as a result of decreased cardiac work
during bed rest. Decreased cardiac work, as indicated by lower HR and BP, also has been
reported during spaceflight (15). Levine et al. (31) speculated that exercise at 75% of maximum
HR for 90 min/d may be necessary to counteract such changes in cardiac performance. In the
present study, the crewmembers in the HI_x and MEDex groups may have performed enough
exercise to ameliorate some of this decline in cardiac function as potentially reflected in their
relatively preserved HR and PP responses during postflight standing. Perhaps the addition of a
simulated orthostatic stress during in-flight exercise through LBNP or centrifugation may further
increase cardiac work and assist in the maintenance of cardiac muscle mass and function.
14
Page 23
D. Baroreceptor Function
Previous investigations have shown an impairment of the carotid-cardiac baroreflex after
Shuttle missions as short as 4-5 d (14). In these subjects, the slope, range, and operational point
of the reflex were all reduced on landing day relative to preflight. These results were duplicated
in missions of 8-14 d, and the reduction in the operational point of the baroreflex was correlated
with reduced standing arterial pressures after spaceflight (2). Acute intense exercise at the end of
a 16-d bed rest has been shown to increase the sensitivity and operational point of the carotid-
cardiac baroreflex to restore baroreflex function and reduce post-bed rest orthostatic intolerance
(21 ). Although no subjects in the present study exercised at intensities equivalent to those in the
bed rest study by Engelke et al. (21), the performance of regular exercise throughout the duration
of the mission may have attenuated the changes in baroreflex function which have been reported
previously in bed rest (32, 33) and spaceflight investigations of similar duration (2).
E. EVA Only Group
In the EVA group after spaceflight, the mean change in HR from supine to standing was
quantitatively similar to the change in HR in the MEDe_ and HIe_ groups. However when
examining the individual data from these subjects, differences between crewmembers became
apparent. One of the crewmembers was a veteran of four previous Shuttle flights. This
crewmember's responses were most similar to those of the HIe_ group, and may have been
influenced by a selection for increased tolerance with respect to prior aviation and spaceflight
experience (3) or decreased HR to orthostatic stress response with older age (34).
When examining the data from the other three EVA crewmembers, the postflight stand
test responses most closely resembled those responses seen in the LO_ group. The postflight
change from supine to standing in HR (35 + 8 bpm) and PP (-19 + 5 mmHg) of these three
subjects was similar to the LO_x group. Interestingly, a similar observation had been made
previously when examining the HR response during submaximai exercise in these crewmembers
on landing day. Crewmembers in the EVA and LO_x groups had greater increases in submaximal
HR during upright cycle ergometry after spaceflight when compared to preflight than
crewmembers in the MED_x and HI_x groups (35). Data from this investigation and these
preliminary exercise study results suggest that the performance of EVAs only, although
physically and mentally fatiguing, does not protect against cardiovascular deconditioning during
spaceflight.
15
Page 24
F. Limitations
Spaceflight investigations are typically very difficult to control due to the wide variety of
crew assignments and other experiments which are performed during each Shuttle flight as well
as crew preferences for different activities (36, 14). In this study, the preflight and in-flight
exercise routines were not controlled but self-selected. Therefore, it is difficult to extrapolate
with certainty our results to a specific exercise protocol. Future investigation of specific exercise
countermeasures is indicated. However, as an indication of the possible influence of different in-
flight exercise regimens on the postflight stand test response in the same subjects, we examined
the data of the two subjects who participated in this investigation during two different missions.
One subject performed exercise in flight, which placed him in the LOex group for one flight and
in the MEDex group for another. As a subject in the LO_x group, his HR response to standing
increased from 17 bpm preflight to 34 bpm postflight. However, as a subject in the MED_ group
his HR response was unchanged from pre- to postflight (18 vs. 18 bpm). The second subject
performed exercise at an intensity level to place her in the Hie× exercise group for both of their
missions and had no change in HR response to standing pre- to postflight after either mission ( 17
vs. 18 bpm; 20 vs. 22 bpm).
This investigation also was limited by our inability to strictly control pre-landing fluid
loading regimens. All Shuttle crewmembers participate in some form of fluid loading, based
primarily on personal preferences. Crewmembers consume more or less fluid based upon
palatability of the fluids, feeling of well-being before reentry, previous experiences with fluid
loading, and the advice of other crewmembers. However, in the present study it appears that
crewmembers in each group consumed similar amounts of fluid.
Additionally, although four of the subjects became presyncopal postflight, the 10-min
stand test used in this investigation was not designed as a test of orthostatic tolerance. It is often
assumed that elevated HR and decreasing BP during standing after flight can be used as an
indicator orthostatic tolerance, but this has not been conclusively proven (22). A more
appropriate orthostatic testing protocol would take all subjects to pre-syncope before and after
spaceflight and use more sensitive measurement techniques.
A final limitation of this study design was that the subjects could not be randomly
assigned to the three exercise groups. Despite differences in preflight physical activity pattems,
the preflight stand test responses of the three groups were not different. However, it remains
possible that differences in preflight exercise habits may have influenced postflight stand test
results.
16
Page 25
V. Summary
In summary, moderate aerobic exercise in-flight seemed to attenuate the elevated standing
HR and decreased PP typically observed in crewmembers after spaceflight. However, the
performance of EVAs did not lead to similar results. In-flight aerobic exercise may prevent
plasma volume loss, maintain cardiac mechanics, reduce splanchnic pooling, and maintain the
carotid-cardiac baroreflex function, all of which may contribute to postflight orthostatic
intolerance. Further studies are required to examine these mechanisms.
Vl. References
!. Buckey, J.C., Jr., L.D. Lane, B.D. Levine, D.E. Watenpaugh, S.J. Wright, W.E. Moore, F.A.
Gaffney, and G.C. Blomqvist. Orthostatic intolerance after spaceflight. J. Appl. Physiol. 81:
7-18, 1996.
2. Fritsch-Yelle, J.M., J.B. Charles, M.M. Jones, L.A. Beightol, and D.L. Eckberg. Spaceflight
alters autonomic regulation of arterial pressure in humans. J. Appl. Physiol. 77: 1776-1783,
1994.
3. Fristch-Yelle, J.M., P.A. Whiston, R.L. Bondar, and T.E. Brown. Subnormal norepinephrine
release relates to presyncope in astronauts after spaceflight. ,l. AppI. Physiol. 81 : 2134-2141,
1996.
4. Bungo, M.W., J.B. Charles, and P.C. Johnson, Jr. Cardiovascular deconditioning during
spaceflight and the use of saline as a countermeasure to orthostatic intolerance. Aviat. Space
Environ. Med. 56: 985-990, 1985.
5. Seaworth, J.F., T.J. Jennings, L.R. Howell, J.W. Frazier, C.D. Goodyear, and E.D. Grassman.
Hemodynamic effects of anti-G suit inflation in a I-G environment. ,I. Appl. Physiol. 59:
i 145-1151, 1985.
6. Burton, R.R., S.D. Leverett, and E.D. Michaelson. Man at high sustained +Gz acceleration: a
review. Aerosp. Med. 45: I 115-1136, 1974.
7. Bishop, P.A., S.M.C. Lee, N.E. Conza, L. Clapp, A.D. Moore, W.J. Williams, M.E.
Guilliams, and M.C. Greenisen. Carbon dioxide accumulation, walking performance, and
metabolic cost in the NASA Launch and Entry Suit. Aviat. Space. Environ. Med. In Review.
17
Page 26
8. Geelen,G., andJ.E.Greenleaf.Orthostasis:exerciseandexercisetraining. Exec. Sport Sci.
Rev. 21: 201-230, 1993.
. Convertino, V.A. Exercise and adaptation to microgravity environments. In: Handbook (f
Physiology: Environmental Physiology. Edited by M.J. Fregly and C.M. Biatteis. III: The
Gravitational Environment, 2: Microgravity, Chapter 36. New York: Oxford University
Press, pp. 815-843, ! 996.
10. Moore, A.D., S.M.C. Lee, P. Kulkami, and M.C. Greenisen. In-flight cycle exercise
mitigates reduced oxygen consumption at submaximal heart rates following spaceflight.
Med. Sci. Sports Ever. 29: S 190, 1997.
i 1. Watenpaugh, D.E., and A.R. Hargens. The cardiovascular system in microgravity. In:
Handbook of Physiology: Environmental Physiology. Edited by M.J. Fregly and C.M.
Blatteis. III: The Gravitational Environment, i: Microgravity, Chapter 29. New York:
Oxford University Press, pp. 631-674, 1996.
12. Whitson, P.A., J.B. Charles, W.J. Williams, and N.M Cintron. Changes in sympathoadrenal
response to standing in humans after spaceflight. J. Appl. Physiol. 79: 428-433, 1995.
! 3. Lee, S.M.C., L. Steinmann, M. Wood, L. Dussack, and S.M. Fortney. Recovery of
cardiovascular responses to lower body negative pressure (LBNP) after spaceflight. Med.
Sci. Sports Exec. 29: $36, 1997.
14. Fritsch, J.M., J.B. Charles, B.S. Bennett, M.M. Jones, and D.L. Eckberg. Short-duration
spaceflight impairs human carotid baroreceptor-cardiac reflex responses. J. Appl. Physiol.
73: 664-671, 1992.
15. Fritsch-Yelle, J.M., J.B. Charles, M.M. Jones, and M.L. Wood. Microgravity decreases heart
rate and arterial pressure in humans. J. Appl. Physiol. 80: 910-914, 1996.
16. Birkhead, N.C., J.J. Blizzard, J.W. Daly, G.J. Haupt, B. Issektuz, Jr., R.N. Myers, and K.
Rodahl. Cardiodynamic and metabolic effects of prolonged bed rest with daily recumbent or
sitting exercise and sitting inactivity. Technical Report AMRL-TDR-64-61. Wright Patterson
Air Force Base, OH, 1964, pp. 1-28.
17. Watenpaugh, D.E., S.M. Fortney, R.E. Ballard, S.M.C. Lee, B.S. Bennett, G. Murthy, G.C.
Kramer, and A.R. Hargens. Lower body negative pressure exercise during bed rest maintains
orthostatic tolerance. FASEB J. 8: A261, 1994.
18
Page 27
18.Birkhead,N.C.,J.J.Blizzard,B. Issekutz,Jr.,andK. Rodahl.Effectof exercise,standing,
negativetrunkandpositiveskeletalpressureonbed-restinducedorthostasisand
hypercalciuria.Technical Report AMRL-TDR-66-6. Wright Patterson Air Force Base, OH,
1966, pp. 1-29.
19. Greenleaf, J.E., R.F. Haines, E.M. Bernauer, J.T. Morse, H. Sandier. R. Annbruster,
L. Sagan, and W. Van Beaumont. +Gz tolerance in man after 14-day bedrest periods with
isometric and isotonic exercise conditioning. Aviat. Space Environ. Med. 40: 671-678, 1975.
20. Greenleaf, J.E., C.E. Wadem and G. Leflheriotis. Orthostatic responses following 30-day bed
rest deconditioning with isotonic and isokinetic exercise training. Aviat. Space Environ.
Med. 60: 537-542, 1989.
2 I. Engelke, K.A., D.F. Doerr, and V.A. Convertino. Application of acute maximal exercise to
protect orthostatic tolerance after simulated microgravity. Am. J. Physiol. 271 (Regulatm3,
Integrative Comp. Physiol. 40): R837-R847, 1996.
22. Fortney, S.M., V.S. Schneider, and J.E. Greenleaf. The physiology of bed rest. In:
Handbook q/'Physiology: Environmental Physiology. Edited by M.J. Fregly and C.M.
Blatteis. III: The Gravitational Environment, 2: Microgravity, Chapter 39. New York:
Oxford University Press, pp. 889-939, 1996.
23. Stremel, R.W., V.A. Convertino, E.M. Bernauer, and J.E. Greenleaf. Cardiorespiratory
deconditioning with static and dynamic leg exercise during bed rest. J. Appl. Physiol. 41:
905-909, 1976.
24. Greenleaf, J.E., J. Vernikos, C.E. Wade, and P.R. Barnes. Effect of leg exercise training on
vascular volumes during 30 days of 6 ° head-down bed rest..I. Appl. Physiol. 72:1887-1894,
1992.
25. Blomqvist, C.G., J.V. Nixon, R.L. Johnson, Jr., and J.H. Mitchell. Early cardiovascular
adaptation to zero gravity simulated by head-down tilt. Acta Astronautica, 7: 543-553, 1980.
26. Hyatt, K.H., and D.A. West. Reversal of bedrest-induced orthostatic intolerance by lower
body negative pressure and saline. Aviat. Space Environ. Med. 48: 120-124, 1977.
27. Rowell, L.B. Human Circulation: Regulation During Physical Stress. Oxford: Oxford
University Press, 1986, pp. 137- ! 73.
19
Page 28
28.Culbenson,J.W.,R.W. Wilkins, F.J. Ingelfinger,andS.E.Bradley. Theeffectof upright
posture upon hepatic blood flow in normotensive and hypertensive subjects. J. Clin. Invest.
30:305-311, 1951.
29. Rowell, L.B., J.-M. R. Detry, J.R. Blackmon, and C. Wyss. Importance of the splanchnic
vascular bed in human blood pressure regulation. J. Appl. Physiol. 32: 213-220, 1972.
30. Savilov, A.A., V.I. Lobachik, and A.M. Babin. Cardiovascular function of man exposed to
LBNP tests. The Physiologist 33 (Supplement): S 128-S 132, 1990.
3 i. Levine, B.D., J.H. Zuckerman, and J.A. Pawelczyk. Cardiac atrophy after bed rest
deconditioning: a non-neural mechanism for orthostatic intolerance. Circulation 96: 517-
525, 1997.
32. Convertino, V.A., D.F. Doerr, D.L. Eckberg, J.M. Fritsch, and J. Vernikos-Danellis. Head-
down bed rest impairs baroreflex responses and provoke orthostatic hypotension. J. Appl.
Physiol. 68: 1458-1464, 1990.
33. Convertino, V.A., D.F. Doerr, A. Guell, and J.-F. Marini. Effects of acute exercise on
attenuated vagal baroreflex function during bed rest. Aviat. Space Environ. Med. 63: 999-
1003, 1992.
34. Smith, J.J., and C.J.M. Porth. Posture and circulation: the age effect. Exper.Gerontology
26: 141-162, 1991.
35. Moore, A.D., S.M.C. Lee, M.C. Greenisen, and P.A. Bishop. Validity of the heart rate
monitor for use during work in the laboratory and on the Space Shuttle. Am. lndust. Hygiene
Assoc. J. 58:299-301, 1997.
36. Bishop, P.A. and M.C. Greenisen. Limitations to the study of man in space in the U.S. space
program. Aviat. Space Environ. Med. 64: 238-242, 1993.
20
Page 30
Form ApprovedREPORT DOC UM ENTATION PAGE OMB No. 0704-0188
Public reporting burden for this collection of information is estimated to average 1 hour per response, including the time for reviewing instructions, searching existing data sources, gathering andmaintaining the data needed, and completing and reviewing the collection of inlormation. Send comments regarding this burden estimate or any other aspect of this collection of information, includingsuggestions for reducing this burden, to Washington Headquarters Services, Directorate for information Operations and Reports, 1215 Jefferson Davis Highway, Suite 1204, Arhngton, VA 22202-4302,and to the Office of Management and Budget, Paperwork Reduction Project (0704-0188), Washington, DC 20503
1. AGENCY USE ONLY (Leave Blank) 2. REPORT DATE 3. REPORT TYPE AND DATES COVEREDMay 2000 NASA Technical Memorandum
4. TITLE AND SUBTITLE 5. FUNDING NUMBERS
Effect of In-Flight Exercise and Extravehicular Activity on Postflight Stand Tests
6. AUTHOR(S)Stuart M.C. Lee*; Alan D. Moore, Jr.*: Janice M. Fritsch-Yetle: Michael Greenisen:
Suzanne M. Schneider: Philip P. Foster**
7. PERFORMING ORGANIZATION NAME(S) AND ADDRESS(ES)
Lyndon B. Johnson Space CenterHouston, Texas 77058
9. SPONSORING/MONITORING AGENCY NAME(S) AND ADDRESS(ES)
National Aeronautics and Space Administration
Washington, DC 20546-0(X)1
8. PERFORMING ORGANIZATIONREPORT NUMBERS
S-860
10. SPONSORING/MONITORINGAGENCY REPORT NUMBER
TM-2(XX)-210185
11, SUPPLEMENTARY NOTES
* Wyle Laboratories, Houston, TX 77058-2787;**Baylor College of Medicine, Houston. TX 77058
12a. DISTRIBUTION/AVAILABILITY STATEMENT
Available from the NASA Center for AeroSpace Information (CASI)7121 StandardHanover, MD 21076-1320 Subject Category: 52
12b. DISTRIBUTION CODE
13. ABSTRACT (Maximum 200 words)The purpose of this study was to determine whether exercise performed by Space Shuttle crewmembers during short-durationspaceflights (9-16 d) affects the heart rate (HR) and blood pressure (BP) responses to standing within 2-4 hr of landing. Thirty
crewmembers performed self-selected in-flight exercise and maintained exercise logs to monitor their exercise intensity and duration.
A 10-rain stand test, preceded by at least 6 min of quiet supine rest, was completed 10-15 d before launch (PRE) and within four hours
of landing (POST). Based upon their in-flight exercise records, subjects were grouped as either high (HIex: = 3x/week, HR = 70%HRmax, = 20 min/session, n = 11 )+medium (MEDex: = 3x/week, HR = 70% HRmax, = 20 min/session, n = 10)+ or low (LOex: =
3x/week, HR and duration variable, n = ! ! ) exercisers. HR and BP responses to standing were compared between groups (ANOVA,
or analysis of variance, P < 0.05). There were no PRE differences between the groups in supine or standing HR and BP. Although
POST supine HR was similar to PRE, all groups had an increased standing HR compared to PRE. The increase in HR upon standing
was significantly greater after flight in the LOex group (36 + 5 bpm) compared to HIex or MEDex groups (25 + 1 bpm; 22 + 2 bpm).
Similarly, the decrease in pulse pressure (PP) from supine to standing was unchanged after spaceflight in the MEDex and Hlex groups,but was significantly less in the LOex group (PRE: -9 + 3: POST: -19 + 4 mmHg). Thus, moderate to high levels of in-flight exercise
attenuated HR and PP responses to standing after spaceflight compared.
14. SUBJECT TERMS
microgravity, orthostasis, exercise countermeasures, aerobic exercise, blood pressure,
extravehicular activity, EVA
15. NUMBER OFPAGES
30
16. PRICE CODE
17. SECURITY CLASSIFICATIONOF REPORT
Unclassified
18. SECURITY CLASSIFICATIONOF THIS PAGE
Unclassified
19. SECURITY CLASSIFICATIONOF ABSTRACT
Unclassified
20. LIMITATION OF ABSTRACT
Unlimited
Standard Form 298 (Rev Feb 89) (MS Word Mar 97)
Prescribed by ANSI Std. 239-18298-102
NSN 7540-01-280-5500