EFFECT OF INDOOR ENVIRONMENTAL QUALITY ON OCCUPANT’S PERCEPTION OF PERFORMANCE: A COMPARATIVE STUDY By PREETHI PRAKASH A THESIS PRESENTED TO THE GRADUATE SCHOOL OF THE UNIVERSITY OF FLORIDA IN PARTIAL FULFILLMENT OF THE REQUIREMENTS FOR THE DEGREE OF MASTER OF INTERIOR DESIGN UNIVERSITY OF FLORIDA 2005
Transcript
EFFECT OF INDOOR ENVIRONMENTAL QUALITY ON OCCUPANT’S
PERCEPTION OF PERFORMANCE: A COMPARATIVE STUDY
By
PREETHI PRAKASH
A THESIS PRESENTED TO THE GRADUATE SCHOOL OF THE UNIVERSITY OF FLORIDA IN PARTIAL FULFILLMENT
OF THE REQUIREMENTS FOR THE DEGREE OF MASTER OF INTERIOR DESIGN
UNIVERSITY OF FLORIDA
2005
Copyright 2005
by
Preethi Prakash
This document is dedicated to my parents who persuaded me to do my masters’ and funded my education.
iv
ACKNOWLEDGMENTS
I would like to take this opportunity to thank everyone who, directly or indirectly,
helped me complete this thesis. First, I would like to thank my committee chair, Dr.
Debra Harris, for all the encouragement and guidance rendered to me during my course
of study. I would also like to thank my committee member, Dr. Charles Kibert, for
engaging my interest in sustainable movement.
I would like to extend my gratitude to the departments’ of Facilities, Planning and
Construction, Environmental Health and Safety, and Statistics. I would also like to thank
Karen Cano, webmaster for DCP, for her help with the web-based surveys, all the
participants of the survey, and members of Gerson Hall and Rinker Hall for their support.
Special thanks go to James Albury, my supervisor at Electronic Thesis & Dissertation
Technical Support, for all his support and guidance.
I would like to thank my parents, Vanitha and Lt. Colonel Prakash, and my brother,
Vinod Prakash, for their support and encouragement, without which this project would
have never been completed. I would also like to thank my good friend, Boman Irani for
his patience, love and support, and for persuading me to do better in all aspects of life. I
would also like to extend my gratitude to all my friends here, and in India, for being there
for me every time I needed them.
Lastly, and most importantly I am grateful for all the wonderful opportunities, and
guidance rendered by God. It was this faith that gave me strength and courage during dire
situations.
v
TABLE OF CONTENTS page
ACKNOWLEDGMENTS ................................................................................................. iv
LIST OF TABLES............................................................................................................ vii
LIST OF FIGURES ......................................................................................................... viii
ABSTRACT....................................................................................................................... ix
Purpose of the Study.....................................................................................................2 Rationale of the Study ..................................................................................................2 Significance of the Study..............................................................................................4 Summary.......................................................................................................................5
2 LITERATURE REVIEW .............................................................................................6
Introduction...................................................................................................................6 Green Building Movement and LEED .........................................................................7
Green Building Movement ....................................................................................7 Green Building Movements World Over ..............................................................9 High Performance Delivery System....................................................................10 LEED...................................................................................................................11
Ventilation Effectiveness.....................................................................................19 Indoor Air Quality ...............................................................................................19 Acoustics .............................................................................................................23 Thermal Comfort .................................................................................................24 Daylight and Views .............................................................................................25
Solutions for a Better Indoor Environmental Quality.................................................26 Design and Material Selection.............................................................................27 Construction Practices .........................................................................................27 Operations and Maintenance ...............................................................................27
Classroom............................................................................................................32 Office/Faculty Area .............................................................................................33 Method.................................................................................................................34
Students Appraisal...............................................................................................39 Faculty and Staff Appraisal .................................................................................44
5 DISCUSSION AND CONCLUSION ........................................................................46
Limitations..................................................................................................................53 Suggestions for Future Research ................................................................................54 Suggestions to Architects, Designers, and Facility Planners......................................54 Design Guidelines.......................................................................................................55 Conclusions.................................................................................................................55
APPENDIX
A SUMMARY SHEET FOR RINKER HALL..............................................................57
B INSTRUMENTS ........................................................................................................58
C IRB FORMS ...............................................................................................................61
D SURVEYS ..................................................................................................................62
LIST OF REFERENCES...................................................................................................65
Table page 2.1 LEED-NC categories and credits .............................................................................12
2-2 Issues related to indoor environmental quality ........................................................21
3-1 Rinker Hall IEQ category of LEED certification.....................................................31
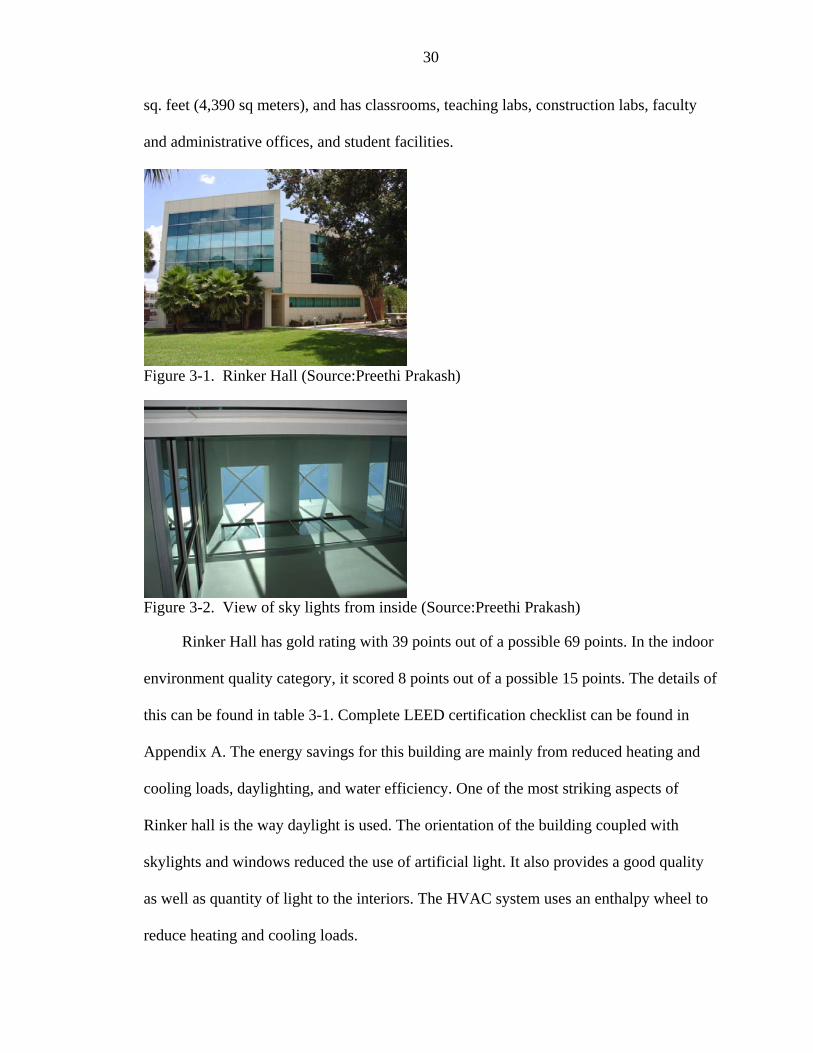
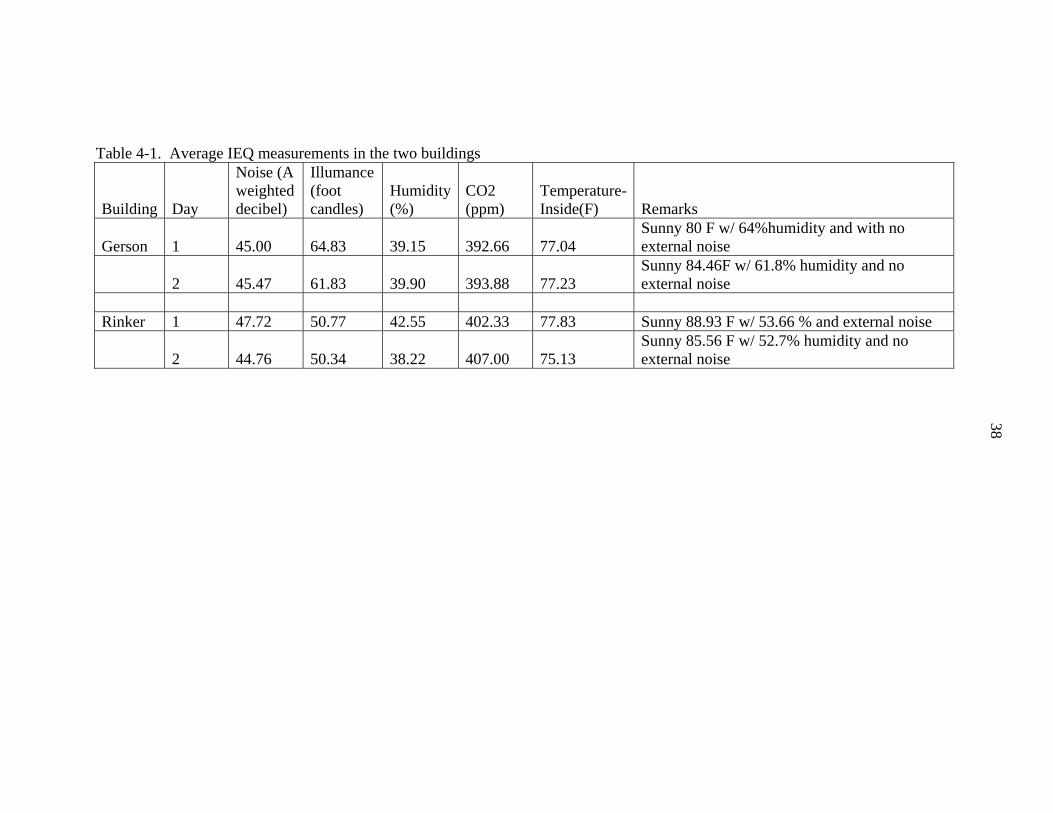
4-1 Average IEQ measurements in the two buildings ....................................................38
4-2 Results of t-test for over IEQ between the two buildings ........................................40
4-3 Result for chi-square test for the variable of odor....................................................40
4-4 Results of chi-square test for daylighting between the two buildings......................42
5-1 Average IEQ measurements in the two buildings compared to standards ...............47
5-2 Summary of the descriptive statistics.......................................................................51
5-3 Results of chi-square test for daylight......................................................................52
5-4 Result for chi-square test for the variable of odor....................................................53
viii
LIST OF FIGURES
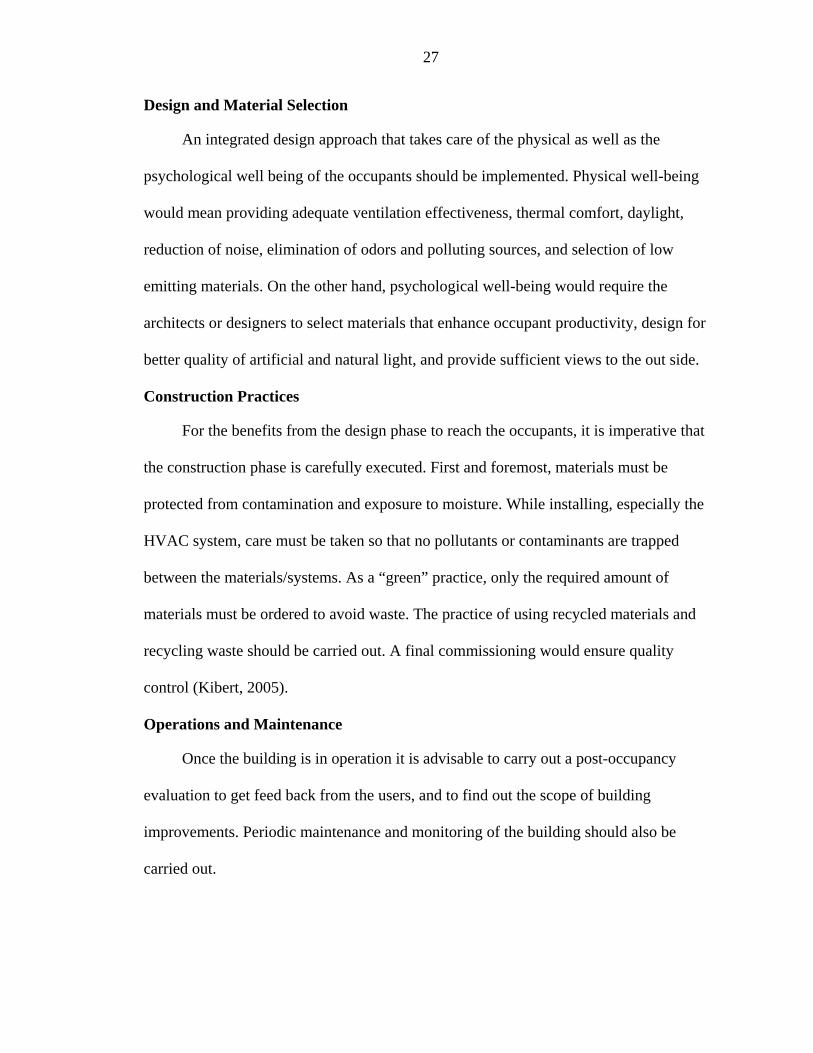
Figure page 3-1 Rinker Hall ..............................................................................................................30
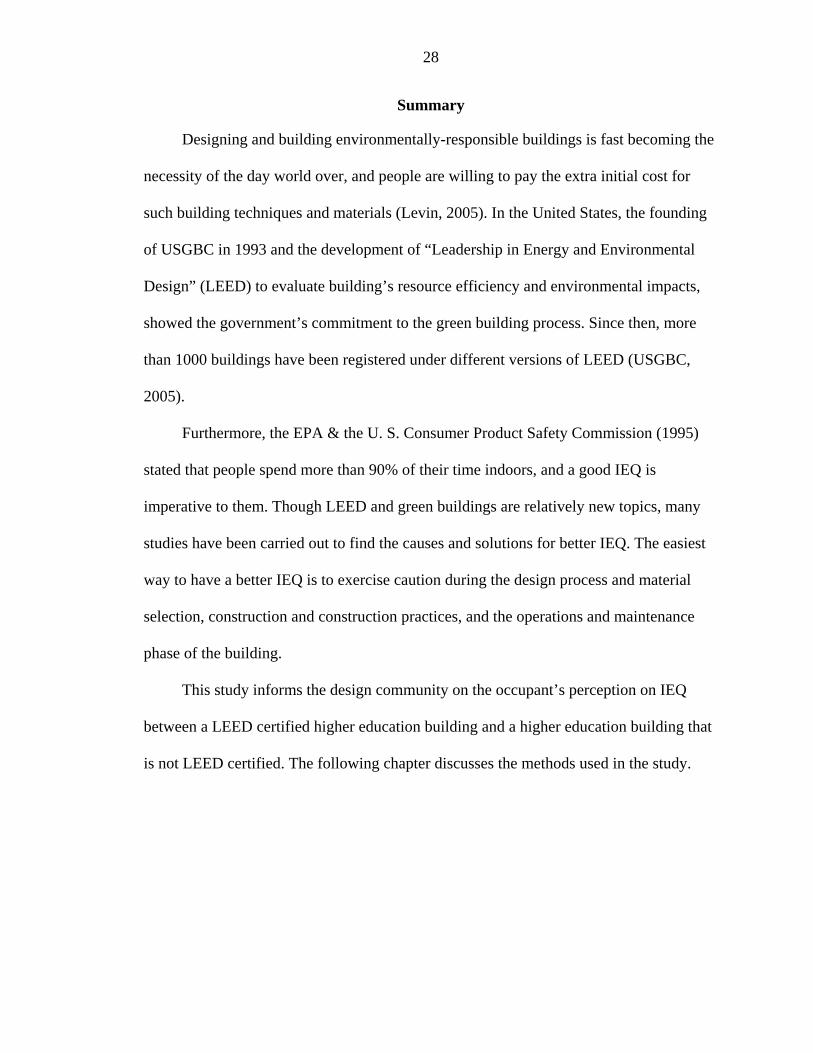
3-2 View of sky lights from inside ................................................................................30
3-3 Gerson Hall .............................................................................................................31
3-4 Detail of classroom at Rinker Hall ..........................................................................32
3-5 Detail of classroom at Gerson Hall .........................................................................32
3-6 Plans of the two classrooms .....................................................................................33
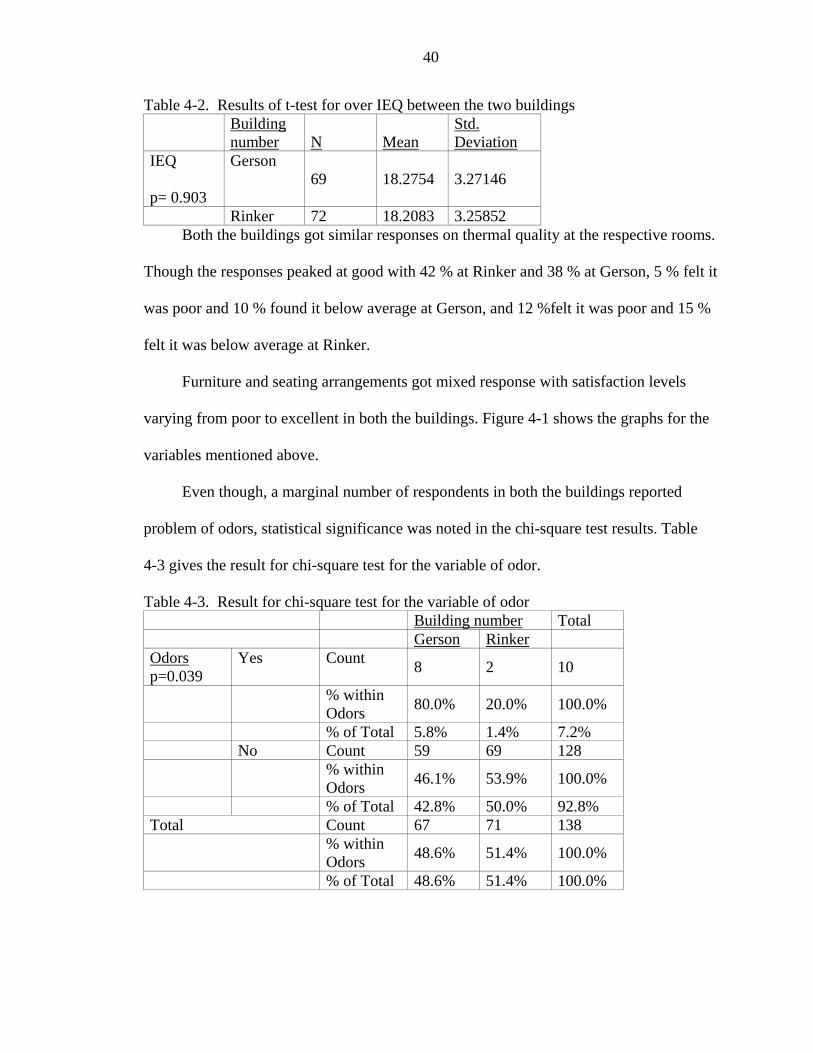
4-1 Comparisons of responses from student surveys about the IEQ of the two buildings. ..................................................................................................................41
4-2 Graphical representation of the results from student surveys about the IEQ of the two buildings ............................................................................................................43
5-1 Classroom at Gerson Hall (A) and classroom at Rinker Hall (B) ............................48
5-2 Equipment placed in the front corner of the classroom at Rinker Hall....................49
5-3 Faculty/staff area on the third floor at Rinker Hall ..................................................49
A-1 LEED summary sheet for Rinker Hall ....................................................................57
B-1 IAQ monitor-product specification and instrument .................................................58
B-2 Dosimeter-product specification and instrument .....................................................59
B-3 Light meter-product specification and instrument ...................................................60
Abstract of Dissertation Presented to the Graduate School of the University of Florida in Partial Fulfillment of the Requirements for the Degree of Doctor of Philosophy
EFFECT OF INDOOR ENVIRONMENTAL QUALITY ON OCCUPANT’S PERCEPTION OF PERFORMANCE:
A COMPARITIVE STUDY
By
Preethi Prakash
December 2005
Chair: Debra Harris Major Department: Interior Design
It is a well-documented fact that people spend most of their time indoors and
various aspects of the indoor environment affect the occupant’s well-being and
performance. Furthermore, design of high performance green buildings promises a better
and healthier environment for its occupants. It is this promise that is encouraging the
construction industry and clients, to opt for sustainable construction and LEED certified
building. While, it is proved that LEED certified buildings help in resource conservation
and economic benefits, more research needs to be conducted to see its effect on
occupant’s perception.
This study documented the difference between the occupant’s perception of
performance in a LEED certified higher education building with a higher education
building that is not LEED certified, and this study hypothesized that, the occupants of the
LEED certified building would perceive the indoor environmental quality (IEQ) of their
building to have a positive effect on their performance. For the purpose of this study,
x
“performance” was defined as the comfort with which the user groups can carry out their
daily activities or tasks, such as studying in a classroom or working in an office.
A multi-method approach was used to collect information in this study. The details
of the physical conditions were obtained by measuring the noise levels, lighting levels
and thermal comfort conditions at the two buildings over a period of two days in addition
to contextual information on the two buildings. Occupants’ perceptions were documented
through web-based surveys.
It was found that LEED certification did not influence the perception of the
occupants. Furthermore, it was found that even though the buildings meet the
recommended standards, occupants often complained about various parameters.
Daylighting and thermal comfort contributed to better IEQ, and had a positive affect
occupant’s perception of productivity and performance.
However, more research needs to be conducted to optimize LEED standards for the
benefit of the occupants. It is critical that sustainable development results not just in
resource conservation, but also in increasing productivity and occupant well-being.
1
CHAPTER 1 INTRODUCTION
The U.S. Environmental Protection Agency (EPA) & the U. S. Consumer Product
Safety Commission (1995) stated that people spend approximately 90 percent of their
time indoors. Therefore, for many, the risks to health may be greater due to exposure to
indoor air pollution than outdoor air pollution. The current study investigates the effect
indoor environmental quality has on the occupant’s perception of performance, with the
LEED certification as the test parameter.
According to the famous environmental psychologist, Dr. Judith H. Heerwagen (as
cited in Kolleeny, 2003), many factors, such as exposure to nature and daylight, air
quality, temperature, odors, noise, ergonomics, and opportunities for social gathering,
relaxation, and exercise, affect occupants' performance and well-being. Based on such
studies, and recent findings, the U.S. Green Building Council (USGBC) in its Leadership
in Energy and Environmental Design (LEED) certification criteria has dedicated an entire
category to indoor environmental quality (IEQ). It consists of indoor air quality, thermal
comfort, acoustics, daylight and views. The maximum number of attainable points in this
section is 15, out of which minimum indoor air quality performance and environmental
tobacco smoke control is a prerequisite (U.S Green Building Council (USGBC), 2002).
Many involved with the construction industry and green building research have the
opinion that the LEED standard helps make the building more sustainable and more
“green” (Gonchar,2005; Kibert,2005; Zagreus, Huizenga, Arens& Lehrer,2004). Much
has been written about this LEED standard and its benefits to the building occupants,
2
however no research has tested to see if it has an impact on the perception of the
occupants.
Purpose of the Study
This study primarily focuses on LEED’s IEQ section and tries to evaluate whether
the criteria set by LEED has an effect on the occupant’s perception of performance. For
the purpose of this study, “performance” is defined as the comfort with which the user
groups can carry out their daily activities or tasks, such as studying in a classroom or
working in an office. To test this proposition, two classroom buildings, one that is LEED
certified, and the other that is not LEED certified was selected as the test sites.
Parameters of the two buildings like, size, occupancy of the classroom, location, and
period of occupancy are similar to each other.
This study hypothesizes that the occupants of the LEED certified building would
perceive the IEQ of their building to have a positive effect on their performance.
Furthermore, this study also hypothesizes that the occupants of the LEED certified
building would perceive the IEQ and its components to be significantly better than the
occupants in a non-LEED certified building. Any suggestions recommended by the
occupants are also reported.
Rationale of the Study
Since its launch, LEED has been accepted as a standard for sustainability or
“greenness” of the building. However, in recent years there have been complaints from
the users about the accuracy of the certification process, the sustainability, and
performance of these certified buildings over time (Gonchar, 2005).
In an attempt to quantify the performance of the LEED certified buildings, the
Center for the Built Environment (CBE) at the University of California, Berkeley, has
3
used its indoor environmental quality survey to compare the performance of LEED and
non-LEED rated buildings (Gonchar, 2005; Zagreus et al., 2004). As of November 2004,
the center had collected a database of responses from 25,000 occupants of 150 buildings,
of which only six were LEED certified (Gonchar, 2005). According to Charlie Huizenga
(as cited in Gonchar, 2005), CBE research specialist, the satisfaction levels for these six
buildings varied, however, the second highest score for “overall building satisfaction”,
was the LEED-rated headquarters for the Chesapeake Bay Foundation, Annapolis, MD.
This building was completed in 2000.
Although users of LEED are convinced of its potential, there have been complaints
about the fit of this standard to all buildings, as LEED was conceived with office
buildings in mind (Gonchar, 2005). Users often feel that deviation from any particular
point’s set standards requires obtaining a credit interpretation from the Council. For
example, Steve McDowell, principal of BNIM Architects, Kansas City talks of the
difficulty his firm faced during the certification of its School of Nursing at the University
of Texas Health Science Center. The building depended on an existing central chiller that
used a refrigerant prohibited by LEED, though the owner and the Council were able to
work out a refrigerant change-out schedule; without which the certification would have
come under uncertainty (Gonchar, 2005).
Such complaints have been taken seriously and the Council has been taking steps to
revise the versions of LEED. It is also developing application guides to make LEED a
better fit for different market segments like as health-care, schools and laboratories. For
example, the Health Care Application Guide will mostly include credits to address the
4
importance of process water in addition to potable water, energy efficiency of medical
equipment and issues that impact health of occupants (Gonchar, 2005).
Many studies have proved that building occupants can inform the design
community on the performance of the building, and conventionally they have been
underutilized (Zagreus et al., 2004). In schools and universities, for example, students
and staff using the building would be the best source of information on the performance
of the building. It is essential for these buildings to have good IEQ, as it affects the
productivity and health of the students and staff. This study hopes to inform the design
community on the student’s, faculty/staff’s perception of performance based on IEQ
criteria. This study will add to the growing body of research on sustainable design, LEED
and occupant’s perception of IEQ.
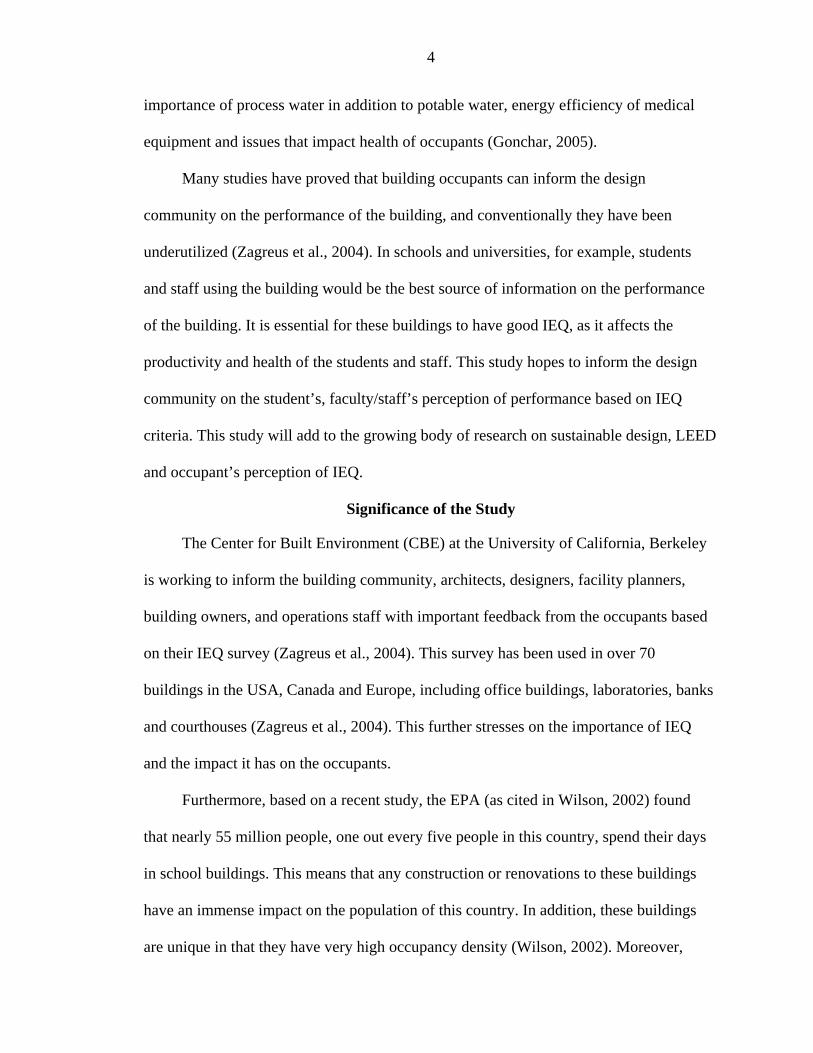
Significance of the Study
The Center for Built Environment (CBE) at the University of California, Berkeley
is working to inform the building community, architects, designers, facility planners,
building owners, and operations staff with important feedback from the occupants based
on their IEQ survey (Zagreus et al., 2004). This survey has been used in over 70
buildings in the USA, Canada and Europe, including office buildings, laboratories, banks
and courthouses (Zagreus et al., 2004). This further stresses on the importance of IEQ
and the impact it has on the occupants.
Furthermore, based on a recent study, the EPA (as cited in Wilson, 2002) found
that nearly 55 million people, one out every five people in this country, spend their days
in school buildings. This means that any construction or renovations to these buildings
have an immense impact on the population of this country. In addition, these buildings
are unique in that they have very high occupancy density (Wilson, 2002). Moreover,
5
schools and universities have the kind of funding that can accommodate the initial
investment of long term, performance oriented goals (Wilson, 2002).
Furthermore, due to the “No Child Left Behind Act” of 2001 and efforts of Senator
Hillary Rodham Clinton, the Department of Education can award grants to state agencies
for developing healthy, high-performance schools (Wilson, 2002).
At the University of Florida, efforts are on to “green” the campus; all new buildings
and renovations are expected to achieve LEED sliver certification and meet stringent
standards set by the university (Facilities Planning & Construction, 2005).
Hence, it is worthwhile to investigate the effect LEED has on the occupant’s
perceptions of performance in educational facilities, in particular at the first LEED
certified building on the University of Florida campus.
Summary
Based on the fact that people spend most of their time indoors and the IEQ has an
impact on the occupants (EPA & the U. S. Consumer Product Safety Commission, 1995),
it is beneficial to get feedback from the users themselves (Zagreus et al., 2004).
Furthermore, at least one fifth of the population spends the majority of their time in
schools and universities (Wilson, 2002) making this study more significant.
Hence, this study intends to investigate the impact of LEED’s IEQ criteria on the
occupant’s perception of performance in two classroom buildings at the University of
Florida.
6
CHAPTER 2 LITERATURE REVIEW
Introduction
To those of us entrenched in the green building world the benefits seem obvious. Why would anyone choose to build in a way that isn't comfortable, healthy, and energy efficient? (Wilson, 2005)
For the past two decades, the green building movement has been gathering
momentum and has changed the way the building industry is viewing resource
consumption and the efficiency of the buildings. This also resulted in the development of
various standards to remove the ambiguity surrounding green building design (Kibert,
2005).
In the United States, the U.S. Green Building Council (USGBC), founded in 1993,
showed the government and industry’s commitment to high-performance green building,
and the green building movement. In 1998, USGBC developed a standard called
Leadership in Energy and Environmental Design (LEED), to evaluate building’s resource
efficiency and environmental impacts.
As stated by Hoffman (2003), poor indoor air quality affects the health of the
employees and results in enormous loss to the nation’s commerce; nevertheless, this
problem can be solved. According to study by Fisk (2000), the United States can save
from $6 to $14 billion from reduced respiratory illness, $1 to $4 billion from reduced
allergies and asthma, $10 to $30 billion from reduced sick building syndrome (SBS), $20
to 160 billion from worker performance and productivity gains.
7
This chapter reviews literature pertaining to the green building movement, LEED
certification process and its significance, and specifically talks about the indoor
environmental quality (IEQ) and its impact on occupants. It concludes with suggestions
for better IEQ.
Green Building Movement and LEED
Green Building Movement
The built environment has a direct impact on our planet and consequently it affects
the lives of all living creatures. Furthermore, the responsibility on the construction
industry is enormous because the buildings and its construction process will affect the
population long after, the ones who conceived the ideas or designed the buildings have
deceased. Moreover, the resource consumption and waste generated by the construction
industry is massive. For example, Kibert (2005) stated that in the U.S., the construction
industry consumes 40% of extracted materials, and construction waste is generated at the
rate of about 0.5 tons per person each year equal to about 5-10 lbs per square foot (45-90
kilograms per square meter) of new construction.
Hence, the green building movement or sustainable development is fast becoming a
necessity. The Bruntland Report (1987), defines sustainable development as “. . . meeting
the needs of the present without compromising the ability of future generations to meet
their needs.”
The green building movement, high-performance green building, and LEED are
relatively new topics and the book, Sustainable Construction: Green Building Design and
Delivery (2005), by Charles J. Kibert, gives comprehensive information on these topics.
From the same book, the basic reasons for the success of green buildings are:
8
1. Their construction techniques provide an ethical and practical response to issues of environmental impact and resource consumption.
2. Though they may have a higher initial cost, they fare better on a life cycle cost (LCC) basis.
3. It acknowledges the potential effect of the physical structure, including its operation, on the health of its human occupants.
Owing to these factors, both the government and the construction industry are
coming together and participating in the movement, by greening their projects. The years
of effort put in by environmentalist on creating awareness on this topic is finally paying
off.
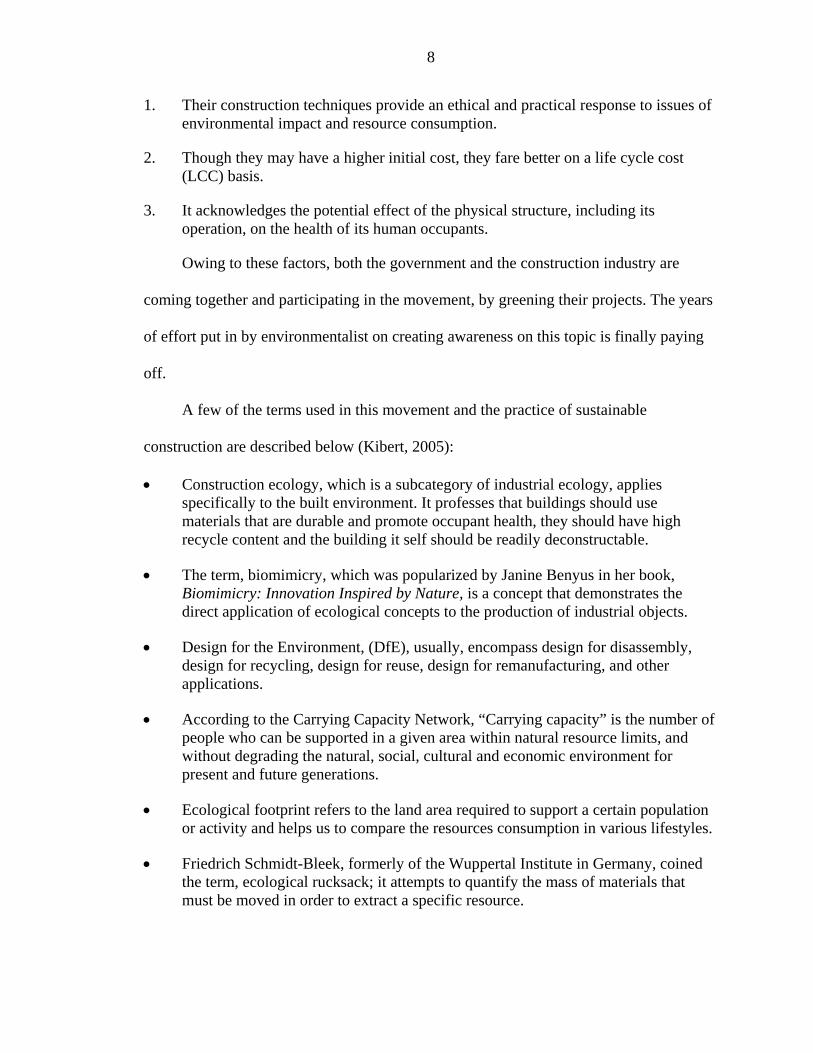
A few of the terms used in this movement and the practice of sustainable
construction are described below (Kibert, 2005):
• Construction ecology, which is a subcategory of industrial ecology, applies specifically to the built environment. It professes that buildings should use materials that are durable and promote occupant health, they should have high recycle content and the building it self should be readily deconstructable.
• The term, biomimicry, which was popularized by Janine Benyus in her book, Biomimicry: Innovation Inspired by Nature, is a concept that demonstrates the direct application of ecological concepts to the production of industrial objects.
• Design for the Environment, (DfE), usually, encompass design for disassembly, design for recycling, design for reuse, design for remanufacturing, and other applications.
• According to the Carrying Capacity Network, “Carrying capacity” is the number of people who can be supported in a given area within natural resource limits, and without degrading the natural, social, cultural and economic environment for present and future generations.
• Ecological footprint refers to the land area required to support a certain population or activity and helps us to compare the resources consumption in various lifestyles.
• Friedrich Schmidt-Bleek, formerly of the Wuppertal Institute in Germany, coined the term, ecological rucksack; it attempts to quantify the mass of materials that must be moved in order to extract a specific resource.
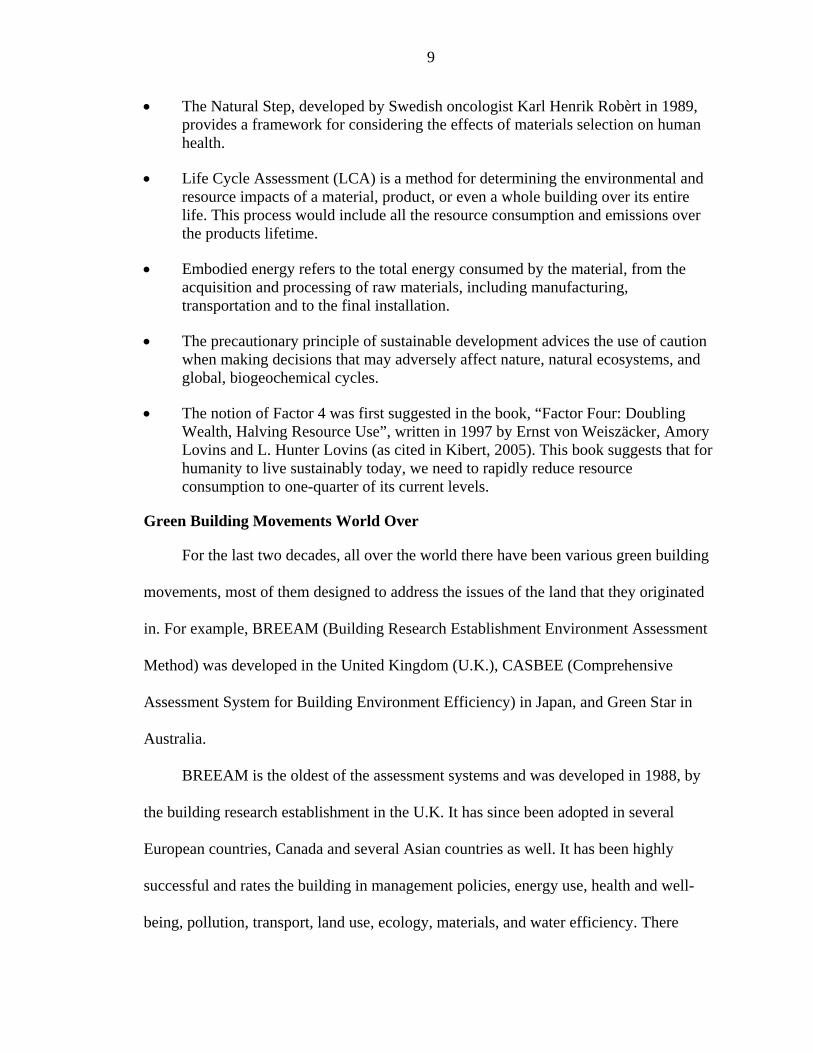
9
• The Natural Step, developed by Swedish oncologist Karl Henrik Robèrt in 1989, provides a framework for considering the effects of materials selection on human health.
• Life Cycle Assessment (LCA) is a method for determining the environmental and resource impacts of a material, product, or even a whole building over its entire life. This process would include all the resource consumption and emissions over the products lifetime.
• Embodied energy refers to the total energy consumed by the material, from the acquisition and processing of raw materials, including manufacturing, transportation and to the final installation.
• The precautionary principle of sustainable development advices the use of caution when making decisions that may adversely affect nature, natural ecosystems, and global, biogeochemical cycles.
• The notion of Factor 4 was first suggested in the book, “Factor Four: Doubling Wealth, Halving Resource Use”, written in 1997 by Ernst von Weiszäcker, Amory Lovins and L. Hunter Lovins (as cited in Kibert, 2005). This book suggests that for humanity to live sustainably today, we need to rapidly reduce resource consumption to one-quarter of its current levels.
Green Building Movements World Over
For the last two decades, all over the world there have been various green building
movements, most of them designed to address the issues of the land that they originated
in. For example, BREEAM (Building Research Establishment Environment Assessment
Method) was developed in the United Kingdom (U.K.), CASBEE (Comprehensive
Assessment System for Building Environment Efficiency) in Japan, and Green Star in
Australia.
BREEAM is the oldest of the assessment systems and was developed in 1988, by
the building research establishment in the U.K. It has since been adopted in several
European countries, Canada and several Asian countries as well. It has been highly
successful and rates the building in management policies, energy use, health and well-
being, pollution, transport, land use, ecology, materials, and water efficiency. There
10
exists a different assessment system for different types of buildings and the final
certificate judges the building as pass, good, very good or excellent (Kibert, 2005).
The Sustainable Building Consortium in Japan has developed CASBEE, to
specifically suit the Japanese cultural, social and political conditions. Here the various
phases of the building construction are assessed, for example, planning, design,
completion, operation and renovation (Kibert, 2005).
Green Star is a relatively new assessment tool developed in Australia; it is based on
the existing building assessment methods like BREEAM and LEED. It eventually shall
have rating tools for different phases of the building life cycle as well as for different
building types. The number of stars awarded to a particular building will indicate its
performance level (Kibert, 2005).
High Performance Delivery System
In contrast to conventional construction processes, the high-performance green
building delivery system requires much closer collaboration among all parties involved in
the construction process. It is this collaboration that ensures gains in multiple levels in the
building and results in an over all savings.
Three powerful approaches coexist to ensure the creation of a truly high
performance building; performance based fees, the charrette, and building commissioning
(Kibert, 2005). While performance based fees can prove to be an added incentive for the
designers as the amount that the building saves, gets them a higher fee, the process of
charrette, gets the people involved in the building, a chance to participate in its
development and improvement. Furthermore, building commissioning will ensure that a
system for quality control is in place.
11
From an early stage, the owner must be clear on his commitment to the project and
must be diligent in choosing an appropriate team for the purpose; a team that is
knowledgeable of the project requirements and is willing to work as a group to ensure
quality and performance at the end of the process. The process would end with the final
commissioning and the owner taking possession of the building.
LEED
The U.S. Green Building Council (USGBC) has been arduously working towards
“greening” the construction market. In 1998, it developed the LEED standard to evaluate
a building’s resource efficiency and environmental impacts.
Ever since its launch, LEED has undergone several upgrades and changes, to better
reflect the market conditions, and to be more efficient. In 2004 alone, it has had three
new entities to its credit, LEED for Existing Buildings (EB), Commercial Interiors (CI)
and LEED for Core & Shell (CS), currently in its test phase. This is in addition to LEED
for New Construction (NC), which has been in place for six years now (USGBC, 2002).
LEED uses a point system to award either a platinum, gold, silver or certified rating
to buildings, based on evaluation to specific, predetermined criteria throughout several
categories. The six major categories based on which the points are awarded are 1)
sustainable sites, 2) water efficiency, 3) energy and atmosphere, 4) materials and
resources, 5) indoor environmental quality, and 6) innovation and design process. The
maximum number of attainable points is 69 points. The rating system levels are: 1)
platinum with 52-69 points, 2) gold with 39-51 points, sliver with 33-38 points, and 4)
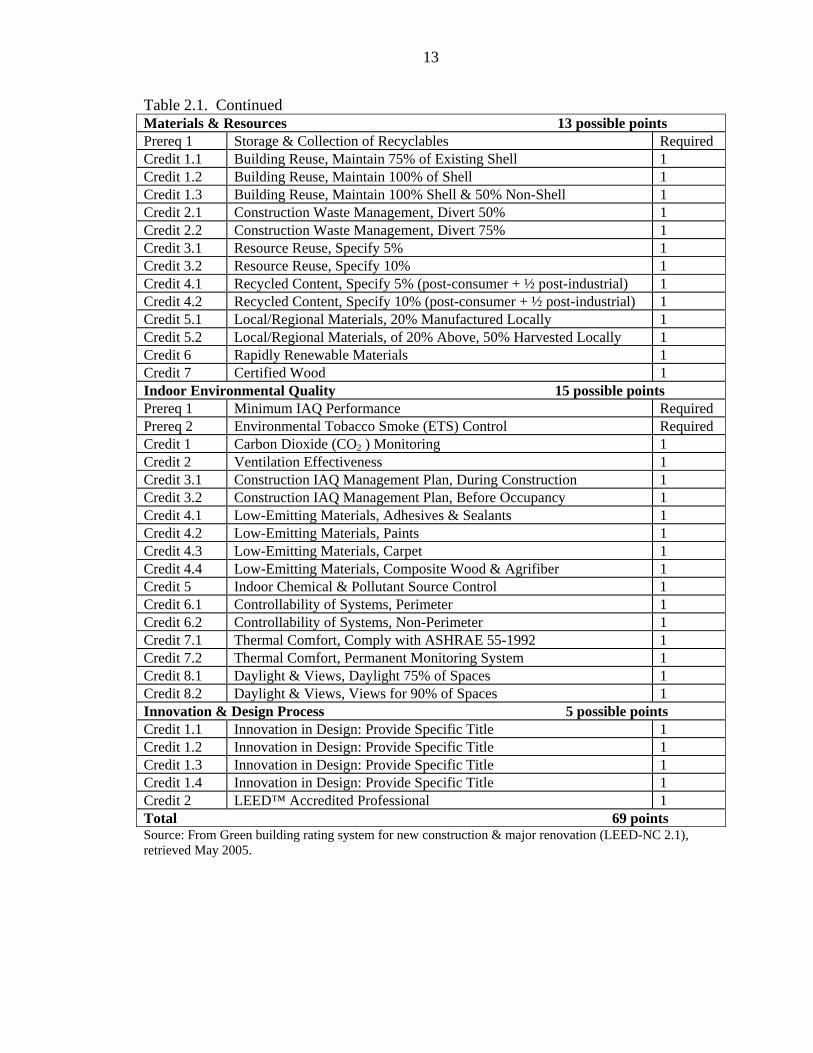
certified with 26-32 points (USGBC, 2002). Table 2.1 gives a break up of the LEED
categories. However, details on each point and its implications can be obtained from the
Table 2.1. LEED-NC categories and credits Sustainable Sites 14 possible points Prereq 1 Erosion & Sedimentation Control Required Credit 1 Site Selection 1 Credit 2 Development Density 1 Credit 3 Brownfield Redevelopment 1 Credit 4.1 Alternative Transportation, Public Transportation Access 1 Credit 4.2 Alternative Transportation, Bicycle Storage & Changing Rooms 1 Credit 4.3 Alternative Transportation, Alternative Fuel Vehicles 1 Credit 4.4 Alternative Transportation, Parking Capacity and Carpooling 1 Credit 5.1 Reduced Site Disturbance, Protect or Restore Open Space 1 Credit 5.2 Reduced Site Disturbance, Development Footprint 1 Credit 6.1 Stormwater Management, Rate and Quantity 1 Credit 6.2 Stormwater Management, Treatment 1 Credit 7.1 Landscape & Exterior Design to Reduce Heat Islands, Non-Roof 1 Credit 7.2 Landscape & Exterior Design to Reduce Heat Islands, Roof 1 Credit 8 Light Pollution Reduction Water Efficiency 5 possible points Credit 1.1 Water Efficient Landscaping, Reduce by 50% 1 Credit 1.2 Water Efficient Landscaping, No Potable Use or No Irrigation 1 Credit 2 Innovative Wastewater Technologies 1 Credit 3.1 Water Use Reduction, 20% Reduction 1 Credit 3.2 Water Use Reduction, 30% Reduction 1 Energy & Atmosphere 17 possible points Prereq 1 Fundamental Building Systems Commissioning Required Prereq 2 Minimum Energy Performance Required Prereq 3 CFC Reduction in HVAC&R Equipment Required Credit 1.1 Optimize Energy Performance,20% new/ 10% existing 2 Credit 1.2 Optimize Energy Performance,30% new/ 20% existing 2 Credit 1.3 Optimize Energy Performance,40% new/ 30% existing 2 Credit 1.4 Optimize Energy Performance,50% new/ 40% existing 2 Credit 1.5 Optimize Energy Performance,60% new/ 50% existing 2 Credit 2.1 Renewable Energy, 5% 1 Credit 2.2 Renewable Energy, 10% 1 Credit 2.3 Renewable Energy, 20% 1 Credit 3 Additional Commissioning 1 Credit 4 Ozone Depletion 1 Credit 5 Measurement & Verification 1 Credit 6 Green Power 1
13
Table 2.1. Continued Materials & Resources 13 possible points Prereq 1 Storage & Collection of Recyclables Required Credit 1.1 Building Reuse, Maintain 75% of Existing Shell 1 Credit 1.2 Building Reuse, Maintain 100% of Shell 1 Credit 1.3 Building Reuse, Maintain 100% Shell & 50% Non-Shell 1 Credit 2.1 Construction Waste Management, Divert 50% 1 Credit 2.2 Construction Waste Management, Divert 75% 1 Credit 3.1 Resource Reuse, Specify 5% 1 Credit 3.2 Resource Reuse, Specify 10% 1 Credit 4.1 Recycled Content, Specify 5% (post-consumer + ½ post-industrial) 1 Credit 4.2 Recycled Content, Specify 10% (post-consumer + ½ post-industrial) 1 Credit 5.1 Local/Regional Materials, 20% Manufactured Locally 1 Credit 5.2 Local/Regional Materials, of 20% Above, 50% Harvested Locally 1 Credit 6 Rapidly Renewable Materials 1 Credit 7 Certified Wood 1 Indoor Environmental Quality 15 possible points Prereq 1 Minimum IAQ Performance Required Prereq 2 Environmental Tobacco Smoke (ETS) Control Required Credit 1 Carbon Dioxide (CO2 ) Monitoring 1 Credit 2 Ventilation Effectiveness 1 Credit 3.1 Construction IAQ Management Plan, During Construction 1 Credit 3.2 Construction IAQ Management Plan, Before Occupancy 1 Credit 4.1 Low-Emitting Materials, Adhesives & Sealants 1 Credit 4.2 Low-Emitting Materials, Paints 1 Credit 4.3 Low-Emitting Materials, Carpet 1 Credit 4.4 Low-Emitting Materials, Composite Wood & Agrifiber 1 Credit 5 Indoor Chemical & Pollutant Source Control 1 Credit 6.1 Controllability of Systems, Perimeter 1 Credit 6.2 Controllability of Systems, Non-Perimeter 1 Credit 7.1 Thermal Comfort, Comply with ASHRAE 55-1992 1 Credit 7.2 Thermal Comfort, Permanent Monitoring System 1 Credit 8.1 Daylight & Views, Daylight 75% of Spaces 1 Credit 8.2 Daylight & Views, Views for 90% of Spaces 1 Innovation & Design Process 5 possible points Credit 1.1 Innovation in Design: Provide Specific Title 1 Credit 1.2 Innovation in Design: Provide Specific Title 1 Credit 1.3 Innovation in Design: Provide Specific Title 1 Credit 1.4 Innovation in Design: Provide Specific Title 1 Credit 2 LEED™ Accredited Professional 1 Total 69 points Source: From Green building rating system for new construction & major renovation (LEED-NC 2.1), retrieved May 2005.
14
LEED for New Construction and Major Renovations (LEED-NC) is designed for
rating commercial and institutional buildings, with a focus on office buildings, though it
has also been applied to many other building types, including high-rise residential
buildings (USGBC, 2005).
Kats (2003) states that a 20-year life and health and productivity savings for LEED
certified and silver buildings is $36.89 per square foot and $ 55.33 square foot for LEED
gold and platinum buildings.
So far, many local and state governments have adopted LEED, with variations to
suit their specific needs. Examples of these are, the Portland LEED, the Seattle LEED
supplements, San Jose LEED, California LEED, and the Triangle region (North Carolina)
High Performance Guidelines (Kibert, 2005; USGBC, 2005).
Even the U.S Army has developed a variant of LEED called the SPiRiT, it is based
on 100 points rating compared to 69 points on LEED- N.C 2.1, and focuses on conditions
encountered on military bases, and serves as a checklist and scoring system for
implementing Sustainable Design and Development (SDD) (Kibert, 2005).
LEED certification process: The process of LEED certification begins with a
decision from the owner to seek a LEED rating for his building, this decision can take
place prior to the design phase or even after the construction has begun; though the
former is always preferred. All commercial buildings as defined under the standard
building codes are eligible for certification.
The owner must be extremely lucid about issues concerning the budget, level of
certification, design team required, and important design and sustainable issues. Soon
after the project is registered, the design team begins to prepare the documentation and
15
calculations to satisfy the prerequisites and credit submittals requirements. USGBC
conducts a technical review, which usually happens within a week of registration, the
results of which are then given to the project team; who then have up to 30 days to
provide additions or corrections. After this, a final review is conducted and a LEED
certification is issued to the project team. The team then has up to 30 days to either accept
or appeal the award certification. At the end of this period, a metal LEED plaque
indicating the certification level, and a certificate is presented to the design team (Kibert,
2005).
Nevertheless, the documentation process is complicated and it helps to have a
LEED accredited professional on the team. However, the LEED Version 2.1 attempts to
provide technical clarifications, and streamlines the documentation requirements for
LEED certification. According to USGBC, these improvements are expected to simplify
the documentation process for project teams and to reduce the costs of documenting
LEED credits, while retaining the stringency and integrity of the LEED Version 2.0
standards (USGBC, 2005).
Projects may be submitted using either the version's documentation path or a mixed
submittal of the two (per credit) (USGBC, 2005). Furthermore, the LEED Version 2.1
Letter Template is a dynamic tracking and documentation tool that is used by project
teams to track progress and prepare a LEED application (USGBC, 2005). For each credit,
the Letter Template prompts LEED practitioners for summary data and signed
declarations of performance. It also indicates when documentation requirements have
been adequately fulfilled for submittal, and serves as a letter template for printing on
letterhead, and summarizes progress (USGBC, 2005).
16
Educational Settings
Though, LEED NC was designed for rating commercial and institutional buildings,
with a focus on office buildings (USGBC, 2005), it has been applied to many other
buildings. However, many complain that it is not appropriate for other building types, due
to the peculiarities of other institutional buildings. For example, University buildings
depend on existing central chillers that may use a refrigerant prohibited by LEED, it then
becomes the responsibility of the client to work out refrigerant change or take the matter
up with the council.
However, it is essential to tackle the issue of “greening” schools as nearly 20% of
the population spend their days in schools buildings – as students, teachers,
administrators, and staff; these statistics from the EPA make it imperative that the
occupant well-being should be a priority (Wilson, 2002).
In addition, schools have the kind of funding that can take care of the initial cost
involved in the case of materials and design elements with long-term benefits. They also
can have a tremendous potential for conveying a message about sustainability and its
benefits (Wilson, 2002).
Furthermore, post occupancy evaluation of educational settings and information
from the occupants can better inform the design community, and help in building better
buildings.
There have been several studies pertaining to these building types, to see the effect
it has on student performance, and effectiveness of the individual building components.
However, no study has compared the perception of occupants of a LEED certified
building with a building that is not certified, especially in terms of indoor environmental
quality.
17
Occupant Performance
It is a known fact that the quality of office space can affect the productivity, health
and comfort of workers. In their study, Gary W Evans, and Rachel Stecker (2004) found
that both severe and constant exposure to uncontrollable environmental stressors, like
noise, crowding, traffic congestion, or air pollution, can produce “learned helplessness”
in adults as well as in children.
Clinical psychologists have documented the role of positive or negative emotions
on various individual outcomes including productivity (Wright, Cropanzano, Denney,
Moline & Park, 2002). They feel that “sad” or “depressed” individuals have low self-
esteem, and would exhibit reduced motivation and slowed thought process.
A study conducted by Wright, Cropanzano, Denney, Moline, and Park (2002), on
worker productivity, found that psychological well-being (PWB) was positively related to
job performance. In their field study, they defined PWB as that which measures the
“pleasantness dimension” of individual feelings. Positive feelings were measured by
terms, such as, “active”, “alert”, “enthusiastic”, and “interested” and negative feelings
were measured by, “afraid”, “hostile”, “irritable”, and “upset”(Wright, Cropanzano,
Denney, Moline, & Park, 2002).
Hence, it can be said without doubt that there are various factors that affect
occupant performance and well-being. These include, but not limited to, indoor air
quality (IAQ), ergonomics, noise, daylight, thermal comfort, and ventilation
effectiveness. The American Industrial Hygiene Association Ergonomics Committee
defines Ergonomics as “..a multidisciplinary science that applies principles based on the
physical and psychological capabilities of people to the design or modifications of the
jobs, equipment, products, and work places.” They further go on to say that, the purpose
18
of ergonomics is to decrease worker discomfort and improve the worker performance
(DiNardi, 1998).
Indoor Environmental Quality
As mentioned earlier, in the United States people spend about 90 percent of their
time indoors and indoor environmental quality is critical (EPA & the U. S. Consumer
Product Safety Commission, 1995). According to Fisk (2000), the U S can save from $6
to $14 billion from reduced respiratory illness, $1 to $4 billion reduced allergies and
asthma, $10 to $30 billion from reduced SBS, $20 to 160 Billion from worker
performance and productivity gains.
Under the category of Indoor environmental quality in the LEED checklist, IEQ
comprises of indoor air quality (IAQ), including, environment tobacco smoke, Carbon
dioxide monitoring, indoor chemical and pollutant source, thermal comfort, and daylight
and views . Table 2-1 gives an overview of the structure of the IEQ and details of these
can be found at LEED reference manual. However, IEQ is comprised of many more
complex factors that may have an effect on the occupants, for example, noise,
ergonomics, quality of the artificial lighting, and spectrum of the paint used etc. This
factor makes the study of IEQ a lot more complex, and during the review of literature, it
was found that most studies concentrated on one aspect of IEQ or the other, however
none had included more than three conditions for their study. For the purpose of this
study, the respondents are quizzed on most aspects of IEQ but the study does not touch
any one aspect in detail. The main purpose being to inform rather than to find a cause and
effect of a variable of IEQ has on occupants.
The following sections look at the various elements affecting IEQ.
19
Ventilation Effectiveness
For the well-being of the building occupants, it is essential to bring in a required
quantity of fresh air, and how well this quantity serves the occupants is measured in terms
of ventilation effectiveness of the building (Kibert, 2005). The American Society of
Heating, Refrigerating and Air Conditioning Engineers (ASHRAE) current ventilation
standards is ASHRAE Standard 62-2001, "Ventilation for Acceptable Indoor Air
Quality”, which addresses the fundamentals of good indoor air quality including 1)
contaminant source control; 2) proper ventilation; 3) humidity management; and 4) air
filtration.
A study conducted by Milton, Glencross, and Walters (2000) found that the energy
cost of providing additional ventilation was compensated by the savings that resulted
from reduced sick leave. This study recommended that ventilation rates be increased well
above the applicable standard for offices at that time, ASHRAE Standard 62-1999.
Furthermore, a study by Wargocki, Wyon, Sundell, Clausen, & Fanger (2000)
suggested that increased ventilation effectiveness can help decrease the intensity of Sick
Building Syndrome (SBS) symptoms, improving the perceived air quality and
productivity of the occupants.
Indoor Air Quality
According to the Centers for Disease Control and Prevention (CDC), health risks
like asthma, which are triggered by indoor air quality problems, have increased by 42%
between 1982 and 1992 (Wilson & Malin, 1996). Furthermore, a study by Fisk and
Rosenfeld (1998) cited the annual cost of indoor air quality related problems at $100
billion. These costs are incurred due to problems like SBS, building related illness,
20
absenteeism, and operation and maintenance cost of problematic buildings. Table 2-2
summaries the various issues associated with IAQ.
Adhesives, sealants, caulks, coatings, and finishes inherently release VOCs as they
dry. While some materials are low emitting others are not. Typical materials having the
potential to release VOCs are, paints, carpets- they also act as sinks to other VOC
releasing materials, furnishings, insulation materials, and ceiling tiles. Water-based
finishes are typically low emitting compared to organic based solvents (Hoffmann,2003;
Kibert, 2005).
Due to the fact that these VOCs can react with ozone and contribute to outdoor
smog, the highest emitting products—including many solvent-based paints and
adhesives—are now banned from use in nine U.S. jurisdictions, including New Jersey,
Massachusetts, and heavily populated parts of California. Most of these regions are
designated by the U.S. EPA as air quality non-attainment areas. California’s South Coast
Air Quality Management District has the strictest restrictions in most product categories
(Wilson & Malin, 1996).
In a review of literature conducted by Seppanen and Fisk (2002), they found that
there was an increase in SBS symptoms associated with mechanically ventilated
buildings, though they could not conclude the reasons for such an increase. More than
eleven studies from six countries in Northern Europe and one from the United States of
America (U.S.) were included in the review. Multiple deficiencies in HVAC system
design, construction, operation, or maintenance may contribute to the increases in
symptom occurrence, including deficiencies that lead to pollutant emissions from HVAC
systems.
21
Table 2-2 Issues related to indoor environmental quality Term Definition Causes Solution Sick Building Syndrome (SBS)
A condition in which at least 20 percent of the population display symptoms of illness for more than two weeks, and the source of these illnesses can not be identified. Symptoms may include headache, fatigue, drowsiness, and irritation of nose, eye, throat, and skin.
Poor IEQ Occupants -Disease carriers of allergens. Building components-Materials, finishes, HVAC, VOCs. Out door environment-Climate, moisture, outdoor air, combustion, dust particles.
Better design, ventilation, thorough clean up of building, change problematic building components, identify outdoor pollutants and solve the same.
Building related Illness (BRI)
Illnesses caused due to specific, identifiable building pollutant or indoor air quality problem. Symptoms include hypersensitivity pneumonitis, humidifier fever, allergic asthma, allergic rhinitis, legionellosis, tuberculosis, and toxic syndromes.
Specific problems in building components, HVAC, finish materials, and /or building occupants.
Identify and solve the specific problems.
Multiple Chemical Sensitivity (MCS)
It is marked by a person’s sensitivities to a number of chemicals, most of them at trace amounts. Patients display similar symptoms as SBS.
Caused by exposure to trace amounts of chemicals/ VOC’s in indoor air.
MCS is a recently identified condition and as of yet, no solution has been found.
22
Table 2-2 Continued Term Definition Causes Solution Volatile Organic Compounds (VOC)
VOCs are carbon-containing compounds that are found in many building components and household products. In any indoor environment there can be up to 100 VOCs present at any given time.
VOCs, readily evaporate at room temperature and at high concentrations cause allergic reactions and health related problems.
Carbon filters can be used be used to absorb VOCs. Low emitting materials must be selected. Air out periods must be followed, both before and after installation of materials.
Biological contaminants
They cause allergies, asthma and health related problems. Biological contaminants include pollens, dust mites, dander, viruses, and bacteria.
High humidity levels (above50 %) and insufficient airflows are the main causes that encourage the growth and spread of these contaminants.
Maintain relative humidity within comfort levels (30-50%) and ensure sufficient ventilation and air exchanges in the building. Good maintenance and cleaning routine to be carried out.
Heating, Ventilation, and Air Conditioning Systems (HVAC)
As the name suggest, it takes care of the heating, ventilation, and air conditioning of the air within the building. It is of top most priority to provide a good HVAC to have a good IEQ.
Poor design and installation of HVAC system can lead to discomfort in the occupant zone, spread and growth of biological contaminants, and spread of SBS/ BRI.
Maintain temperature between 65°-78° F, and relative humidity between 30-50%. Ensure proper installation, to avoid collection of dust, mold prior to operation, and have periodic maintenance.
23
Furthermore, another study by Fisk (2000), documented literature on the major
indoor environment factors affecting human health and productivity. Five published
papers were included in the study. For the U.S., this paper estimates that health effects
experienced by millions of people annually could be significantly reduced by improving
IEQ, with associated annual economic benefits of tens of billions of dollars. The paper
indicates that improvements in lighting and thermal conditions may lead to additional,
and even larger, productivity gains.
Odors are one of the most common and annoying of IAQ problems. They can be a
result of activities in the building, occupants or materials off gassing (Kibert, 2005). This
aspect of IEQ has been over looked in the LEED standards.
Acoustics
Noise from HVAC, light and other sources can cause discomfort, annoyance and
result in headaches and fatigue (Kibert, 2005), in some cases continuous and chronic
exposure to excessive noise can lead to permanent hearing loss (Bruce, Bommer &
Moritz, 1998) to occupants. The most acceptable standards for classroom noise levels are
35 decibels (dBA). A-weighted decibels are values measured by sound meters that
largely ignore the low-frequency sound energy, just as the human ears do.Despite this
consequence, this issue has not yet been addressed by the green building assessment
standards like LEED.
In a review of literature conducted by Evans and Stecker (2004), it was found that a
person’s motivation to complete certain tasks might be reduced by exposure to
environmental stress. Inability to cope with such environmental stressors may also result
in “learned helplessness” and negatively affect learning and performance (Evans &
Stecker, 2004). Over the past 25 years, there have been many studies that show that both
24
acute and chronic exposures to environmental stressors such as noise, crowding, traffic
congestion, and pollution, lead to motivational deficits among human beings. For
example, Hiroto (as cited in Evans and Stecker, 2004) examined college students
performing a task under escapable or inescapable loud noise, or under quiet conditions
without a task. Participants who worked under inescapable noise conditions were less
likely to successfully perform a subsequent task to avoid noise than those who had
previously worked in escapable noise or were in a control group who had no noise
exposure. These effects were demonstrated in a separate study conducted by Krantz,
Glass, and Snyder, in 1974 (as cited in Evans and Stecker, 2004).
Thermal Comfort
Excessively hot or cold environments can affect motor and cognitive behavior of
individuals. Extremely hot conditions can lead to loss of performance capacity and slow
production out put, while excessively cold environments have affect on manual agility,
and sometimes are associated with pain (Ramsey & Beshir, 1998).
The CBE survey was used by Brager, Paliaga and de Dear in 2004 (as cited in
Zagreus, Huizenga, Arens, & Lehrer, 2004), to study the effects of operable windows on
worker’s thermal comfort, in a municipal office building in California. The survey, and
physical measurements of conditions at each workstation, was conducted during both,
warm and cool weather. This study found that people were willing to accept variations in
temperature as long as they have high degree of personal control over their environment.
Furthermore, they are aware that increased air movement can affect their thermal
comfort. People with higher degrees of personal control also reported more satisfaction
and increased perceived productivity than those with lower degrees of personal control.
25
This study suggests that operable windows have a positive effect on occupants, and also
helps conserve energy.
Daylight and Views
According to O'Connor, Lee, Rubinstein & Selkowitz, (1997), lighting and its
associated cooling energy use constitute 30-40% of a commercial building’s total energy
use. Consequently, daylight can be efficiently used to maximize occupant comfort, and to
conserve energy. While designing windows to optimize occupant comfort one must keep
in mind the amount of daylight needed, type of activity in the room, and select materials
with recommended surface reflectance and matte finish.
Furthermore, it is proved that green schools with natural daylighting improve
learning. A daylighting study (Heschong Mahone Group, 1999) of Capistrano school
district, California, found that students in classrooms with the most daylighting,
progressed 20% faster in math and 26% faster in the reading than students in classroom
with the least daylighting.
Thus far, studies have repeatedly shown that access to a window is not only a
matter of preference (Heerwagen & Orians, 1986) but also of health and well-being
Furthermore, since people spend most of their time indoors and the IEQ has an impact on
the occupants (EPA & the U. S. Consumer Product Safety Commission, 1995), it is
beneficial to get feedback from the users themselves (Zagreus et al., 2004).
Design of high performance green buildings promises a better and healthier
environment for its occupants. This promise is one of the main driving forces for the
construction industry and clients to opt for sustainable designs and LEED certified
buildings. However, review of literature revealed both satisfaction and complaints on the
rating system, though its significance was never denied (Gonchar, 2005).
This study documented the difference between the occupant’s perception of
performance in a LEED certified building with a building that is not LEED certified. For
the purpose of this study, “performance” was defined as the comfort with which the user
groups can carry out their daily activities or tasks, such as studying in a classroom or
working in an office.
47
A multi-method approach was used to collect information about the physical
conditions in the two buildings, as well as the occupant’s perceptions. The details of the
physical conditions were obtained by measuring the noise levels, lighting levels and
thermal comfort conditions at the two buildings over a period of two days in addition to
contextual information on the two buildings. Occupant’s perceptions were documented
through web-based surveys.
The following sections discuss the findings of the study. The chapter ends with
suggestions for future research, suggestions for architects, designers, and planners, and
the conclusions of the study.
Physical Environment
Classroom
The IEQ elements namely, temperature, humidity, carbon dioxide levels,
illuminance, and noise levels were measured over a period of two days in summer, at the
selected classrooms. The outdoor weather conditions were similar during measurements
at 84.7°F and 61.12% relative humidity. As evident from Table 5-1, all levels recorded
were within the permissible levels. However, small variations were recorded between the
buildings.
Table 5-1. Average IEQ measurements in the two buildings compared to standards
Noise (A weighted decibel)
Illumance (foot candles )
Humidity (%)
CO2 (ppm)
Temperature-Inside(F)
Standard 35 50 30-60% 72-80°F Rinker Hall
46.24
50.56
40.38
404.66
76.48 Building Gerson
Hall 45.23
63.33
39.52
393.27
77.13
48
Temperature was with in the permissible level of 72-80°F, with average at Gerson
being 77.13°F and Rinker at 76.48°F. Similarly, relative humidity (standard is between
30-60%) was at 39.52% at Gerson and 40.38 % at Rinker.
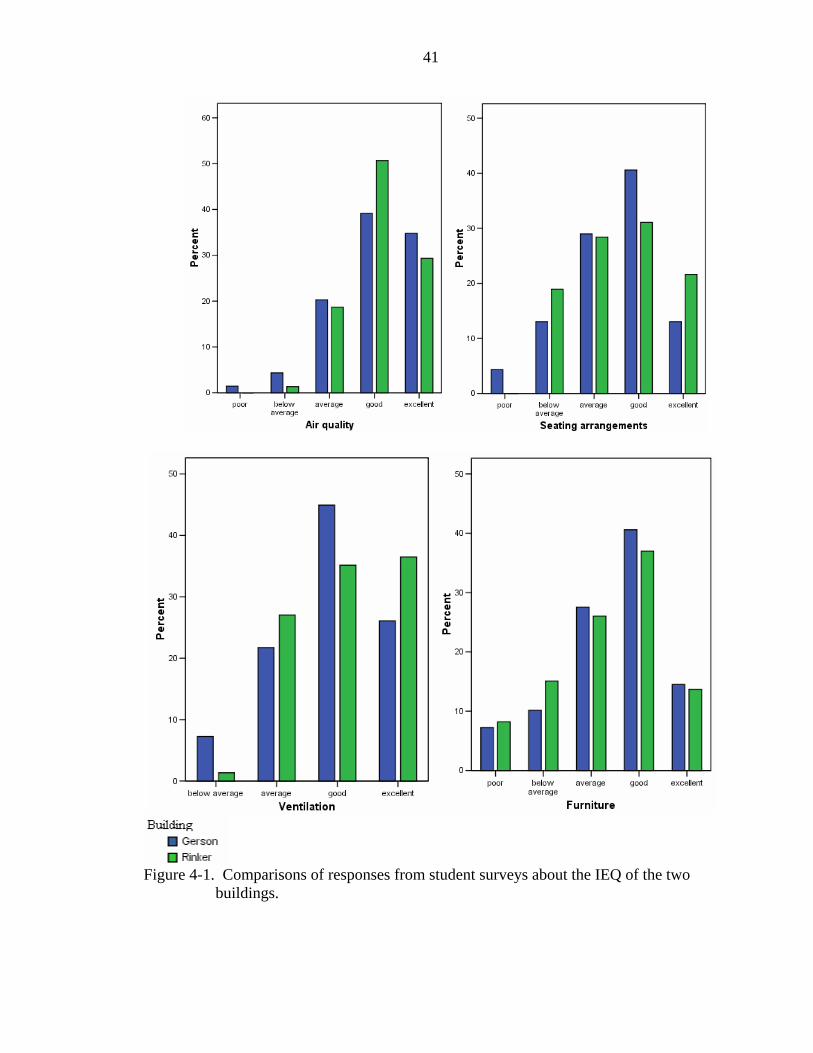
Surprisingly Rinker (50.55 foot-candles) had a lower illuminance level compared to
Gerson (63.33 foot-candles).The standard for classroom is 50 foot-candles. However, as
evident from Figure 5-1, the quality of light in Rinker was better than at Gerson, with a
good mix of natural and artificial lighting; the classroom was more evenly lit than at
Gerson. Window coverage, color of the walls, and materials used contributed to a better
quality of light in Rinker Hall.
Another interesting point is the use of technology in Gerson Hall, where the blinds
automatically close when the projector is turned on; though it seems like a good use of
technology, users often complain on the lack of illumination in the room.
F
a
f
t
B
A
igure 5-1. Classroom at Gerson Hall (A) and classroom at Rinker Hall (B)
However, the noise levels were higher at Rinker (46.24dbA), even though the
verage reading between the two buildings was different by just 1A-weighted decibel, the
ront rows of desks at Rinker were subject to more noise levels, which would make the
eachers/ presenters raise their voices higher to reach the audience. The higher noise
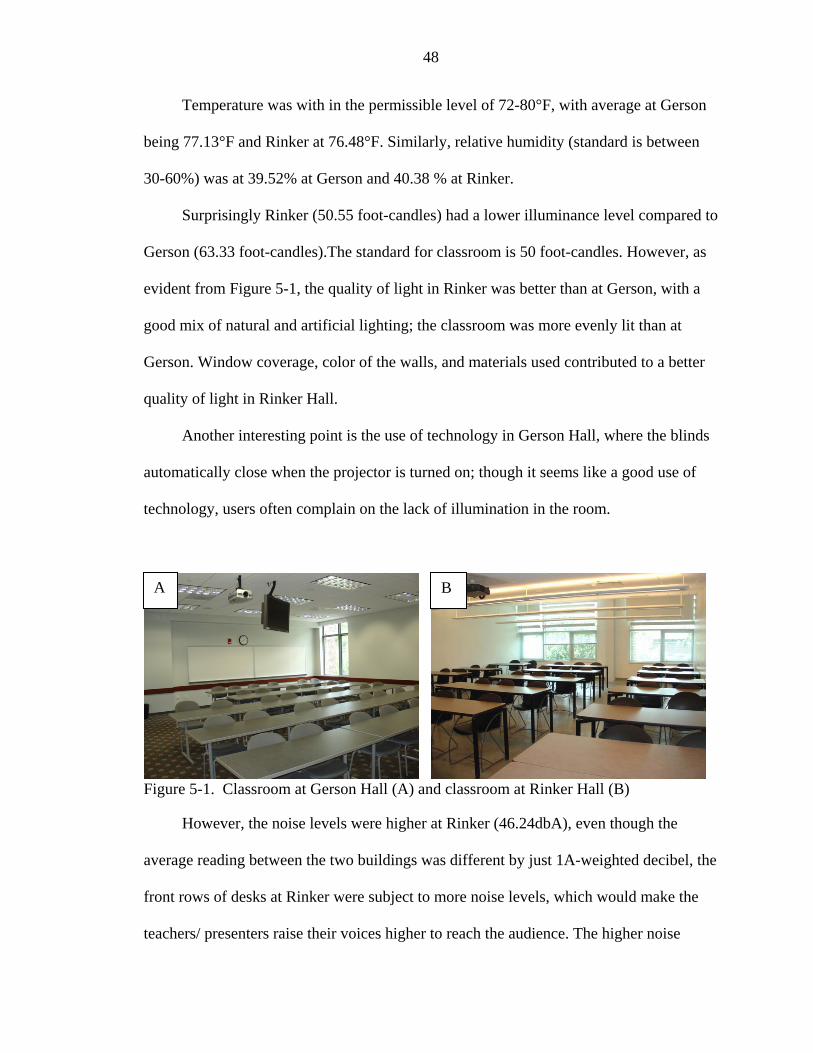
49
levels were contributed by the HVAC system and equipment placed near the front rows
(refer Figure.5-2). The noise levels at Gerson (45.23 dbA) were evenly distributed. The
standard for noise levels is 35dbA, proving that both classrooms representing the two
buildings exceed recommended noise levels. Strategies for minimizing noise levels
would enhance the quality of the teaching environment.
Figure 5-2. Equipment placed in the front corner of the classroom at Rinker Hall
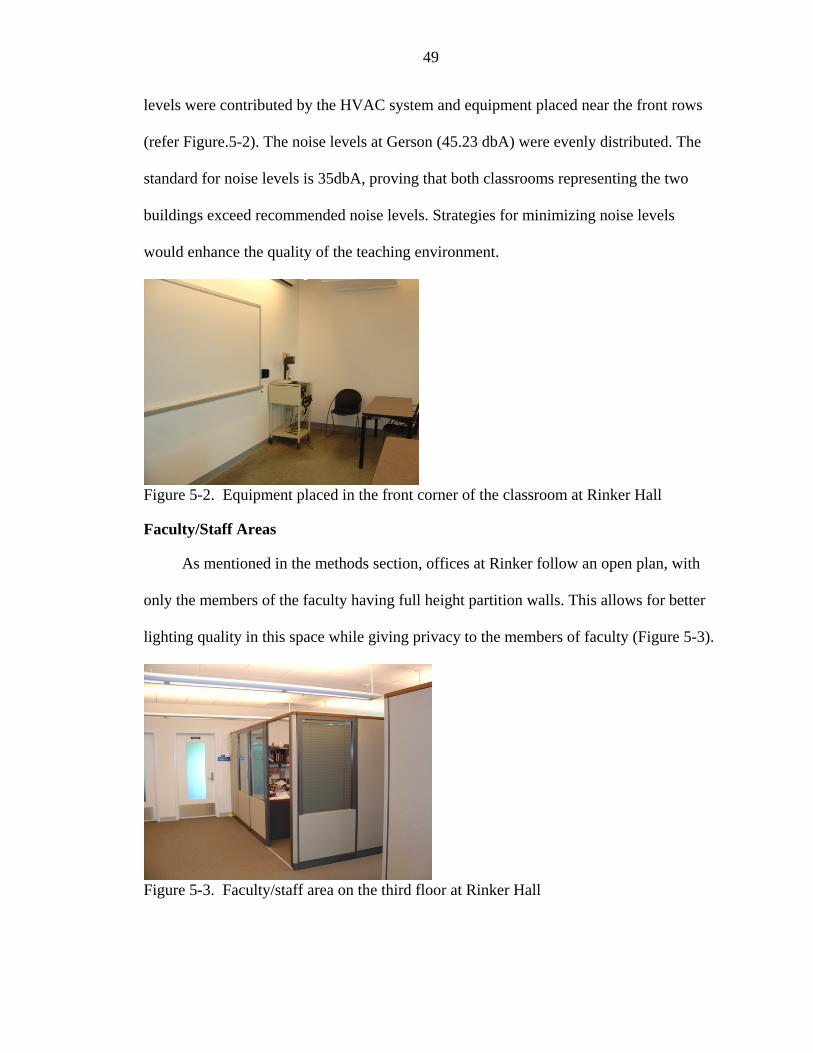
Faculty/Staff Areas
As mentioned in the methods section, offices at Rinker follow an open plan, with
only the members of the faculty having full height partition walls. This allows for better
lighting quality in this space while giving privacy to the members of faculty (Figure 5-3).
Figure 5-3. Faculty/staff area on the third floor at Rinker Hall
50
While at Gerson hall, the space under study had only faculty offices. The offices
were located along the periphery and opened into a dimly lit corridor space (Figure 5-4).
In both the buildings, the office areas have carpet.
Figure 5-4. Faculty area on third floor at Gerson Hall
Occupants Perceptions
The occupant’s perceptions were collected through a web-based survey. The survey
was available online for a period of two weeks after which the results were analyzed
using statistical software SPSS. The following sections discuss the results, often
comparing the results of the survey with the IEQ measurements and observations by the
author.
Student Appraisal
Out of 80 participants from each building, 76 responded in Rinker Hall while 69
responded in Gerson Hall. The surveys were analyzed using SPSS software for statistical
methods. Independent t-test, chi-square tests, and one-sided significance test were used to
analyze the data.
There was no statistically significant difference found between the overall IEQ
conditions between the two buildings. This implies that occupants of both the buildings
are equally satisfied with their respective buildings. This also could be due to the fact that
occupants of both buildings moved from older, problematic buildings to newer buildings.
51
Even though, p value in analysis to many individual variables of IEQ is not less
than alpha level (0.1), the graphs and open-ended question show strong satisfaction or
dissatisfaction among occupants.
Some of the most noteworthy trends in graphs were observed in the categories of
air quality, ventilation, thermal comfort, seating arrangements, daylight, odors, and glare.
Table 5-2 gives a summary of descriptive statistic. Though, the p-value for the t-
test for IAQ was not significant, from the percentages, it can be said that more percentage
of occupants are satisfied by the air quality at Rinker (80 % good to excellent
satisfaction) than at Gerson (74 % good to excellent satisfaction).
Table 5-2. Summary of the descriptive statistics Gerson Hall Rinker Hall IEQ variables
Combined results for ratings of
excellent and good (%)
Combined results for rating of
average, below average and
poor (%)
Combined results for ratings of
excellent and good (%)
Combined results for rating of
average, below average and
poor (%) IAQ 74 26 80 20
Ventilation 70 30 71 29 Thermal comfort
47 53 53 47
Seating arrangements
45 55 54 46
Yes No Yes No Odors 15 85 10 90
Daylight 68 32 81 19 Glare 10 90 15 85
Noise level 85 82 82 17
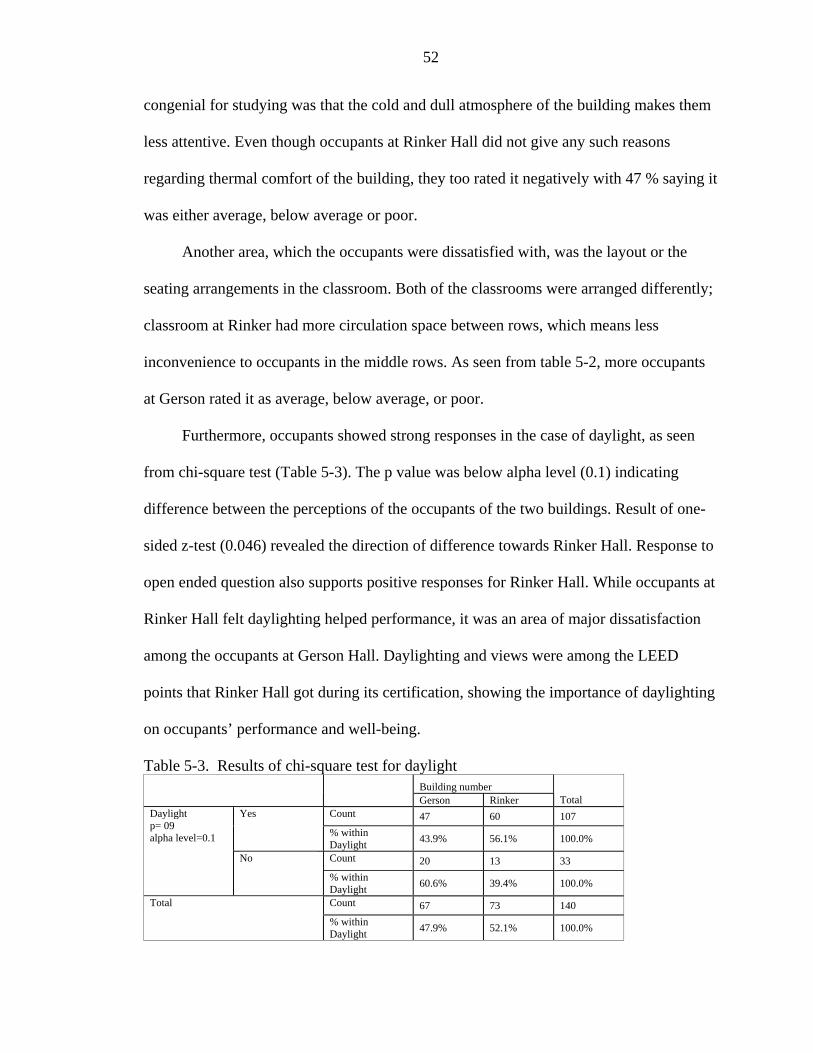
Furthermore, when the occupants were asked to rate the thermal comfort of their
respective room, dissatisfaction levels between both the buildings is noticeable (Table
5-2). At Gerson 47% of occupants rated it as average, below average or poor.
Interestingly, one of the main reasons cited by occupants for not finding the building
52
congenial for studying was that the cold and dull atmosphere of the building makes them
less attentive. Even though occupants at Rinker Hall did not give any such reasons
regarding thermal comfort of the building, they too rated it negatively with 47 % saying it
was either average, below average or poor.
Another area, which the occupants were dissatisfied with, was the layout or the
seating arrangements in the classroom. Both of the classrooms were arranged differently;
classroom at Rinker had more circulation space between rows, which means less
inconvenience to occupants in the middle rows. As seen from table 5-2, more occupants
at Gerson rated it as average, below average, or poor.
Furthermore, occupants showed strong responses in the case of daylight, as seen
from chi-square test (Table 5-3). The p value was below alpha level (0.1) indicating
difference between the perceptions of the occupants of the two buildings. Result of one-
sided z-test (0.046) revealed the direction of difference towards Rinker Hall. Response to
open ended question also supports positive responses for Rinker Hall. While occupants at
Rinker Hall felt daylighting helped performance, it was an area of major dissatisfaction
among the occupants at Gerson Hall. Daylighting and views were among the LEED
points that Rinker Hall got during its certification, showing the importance of daylighting
on occupants’ performance and well-being.
Table 5-3. Results of chi-square test for daylight Building number
Gerson Rinker Total Count 47 60 107 Yes
% within Daylight 43.9% 56.1% 100.0%
Count 20 13 33
Daylight p= 09 alpha level=0.1
No
% within Daylight 60.6% 39.4% 100.0%
Count 67 73 140 Total
% within Daylight 47.9% 52.1% 100.0%
53
Similarly, chi-square test for occupant’s perception on the presence of odors in the
room, showed significance (Table 5-4), and one-sided z-test (0.019) further supported the
direction of difference to be in favor of Rinker Hall. This may be due to the fact that the
classroom at Gerson had carpet, thus influencing the perceived air quality. The author did
not notice any odors in either of the rooms.
Table 5-4. Result for chi-square test for the variable of odor Building number Total Gerson Rinker Odors p=0.039
Count 8 2 10
alpha level=0.1
Yes
% within Odors 80.0% 20.0% 100.0%
Count 59 69 128
No % within
Odors 46.1% 53.9% 100.0%
Count 67 71 138 Total % within
Odors 48.6% 51.4% 100.0%
Faculty/Staff Appraisal
As apparent from the results, faculty and staff in both the buildings were satisfied
with there respective buildings. However, the reasons for their perceptions that the
building helped improve their performance was different. While at Rinker, the occupants
choose IEQ parameters such as daylighting, the occupants of Gerson felt it facilitated
multiple activities, and had a good over all ambience.
Limitations
There were a few factors that impacted this study. First, the students of both Rinker
and Gerson had only taken classes in their respective building and their previous
building; hence, their perceptions were based on the previous buildings that they had
54
classes in, and not necessarily between the two buildings. Similarly the faculty and staff
were not exposed to both the buildings.
Even though an attempt was made to keep the occupancy levels of the classes
similar, numbers varied by course numbers. In addition, the teachers could have impacted
the perceptions of the students depending on the interest created by the course and
teaching methods.
Most importantly, the results of this study are limited to these particular buildings.
However, one may assume that the IEQ factors reported by the occupants are universally
applicable, and architects and designers would benefit by considering these suggestions
for future designs of higher education facilities.
Suggestions for Future Research
Research needs to be conducted with regards to LEED and occupant satisfaction,
especially in terms of design and design intent. While this study provides a good start, it
could be structured differently to obtain significant and universally applicable results.
Lengthening the time line of data collection for the study with same groups of student
taking classes in both buildings and/or the same classes taught in both the buildings can
provide actual test scores to support, and provide triangulation with student, faculty, and
staff’s perception of performance in the two buildings.
Suggestions to Architects, Designers, and Facility Planners
As noted in the results of the study, design intents always infiltrate to the
occupants; whatever the primary design intent, it is essential to provide a productive and
comfortable atmosphere to the occupants. A pre-design charrette, or gathering
information through participation from the occupants before finalizing the design will
provide invaluable information on occupant’s comfort and needs.
55
Design Guidelines
Based on this study it can be said that an integrated approach to design is essential
in providing a productive and comfortable atmosphere. It was noticed that despite IEQ
parameters (temperature/humidity/light) being within permissible levels occupants often
complained about the same parameters. Hence, it would be advisable to look into the
quality of IEQ provided rather than the quantity.
From this study, daylight emerged as the most important IEQ factor. It would then
be best to optimize daylighting to increase energy savings, improve quality of light, and
provide attentive/alert environment. Selection of materials should enhance this property.
Materials can also be used to retard ambient noise. Equipment and HVAC should be
designed and placed in such a way that the ambient noise is within permissible levels.
Furthermore, operable windows will give occupants the ability to manipulate
ventilation rate, temperature, and humidity to their advantage.
Quality of furnishings, space planning, and optimal use of technology are also
important factors successful design.
Conclusions
This study hypothesized that, the occupants of the LEED certified building would
perceive the IEQ of their building to be significantly better so as to have a positive effect
on their performance. However, the results do not support the hypothesis completely.
Perception of occupants of the LEED certified building and non-LEED certified building
did not vary, and LEED certification did not translate into a better-perceived IEQ.
However, there were differences among individual IEQ characteristics between the two
buildings. The issues of dissatisfaction reported in Gerson Hall (non-LEED certified)
56
were addressed during the design of Rinker Hall (LEED certified), because of using the
LEED criteria for IEQ.
Furthermore, daylighting emerged as an important IEQ factor, which is inherently
affected by material and color selections, and thermal comfort largely contribute to better
IEQ, which affected occupant’s perception of productivity and performance. Other IEQ
factors like acoustics, indoor air quality, comfortable furniture, and quality of lighting
should be kept in mind while designing. A pre-design charrette is a process opportunity
to assist in resolving these important issues related to occupant comfort.
This study intended to provide architects, designers, facility planners, and
researchers with valuable information on occupant’s perception and LEED, adding to the
body of research in the topic of LEED, IEQ, and the design and construction of academic
buildings.
More research needs to be conducted to optimize LEED standards for the benefit of
the occupants. It is critical that sustainable development results not just in resource
conservation, but also in increasing productivity and occupant well-being.
57
APPENDIX A SUMMARY SHEET FOR RINKER HALL
Figure A-1. LEED summary sheet for Rinker Hall
58
APPENDIX B INSTRUMENTS
Figure B-1. IAQ monitor-product specification and instrument
59
Figure B-2. Dosimeter-product specification and instrument
60
Figure B-3. Light meter-product specification and instrument
61
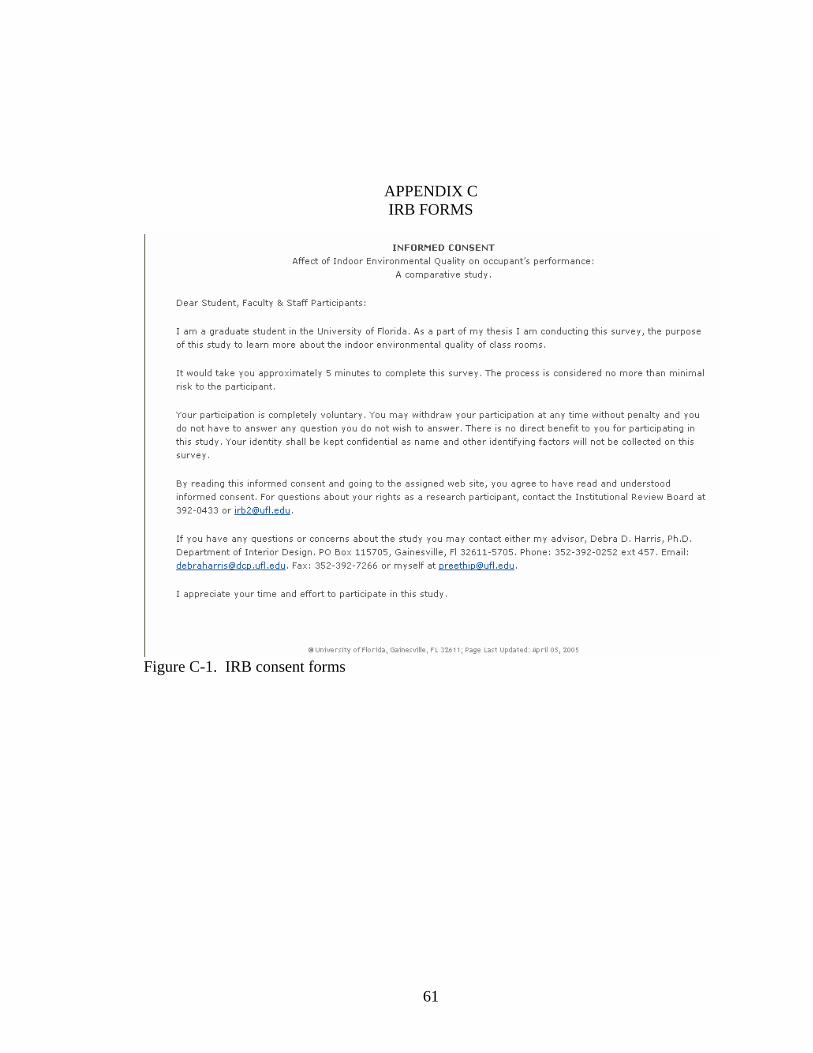
APPENDIX C IRB FORMS
Figure C-1. IRB consent forms
APPENDIX D SURVEYS
63
Figure D-1. Faculty and staff questionnaire
64
Figure D-2. Student questionnaire
65
LIST OF REFERENCES
Boubekri, M., Hulliv, R. B. & Boyer, L. L. (1991). Impact of Window Size and Sunlight Penetration on Office Workers' Mood and Satisfaction: A Novel Way of Assessing Sunlight. Environment and Behavior, 23(4), 474-493.
Bruce, R. D., Bommer, A. S. & Moritz, C. T.(1998). Noise, Vibration, and Ultrasound. In DiNardi, S. R. (Eds.), The Occupational Environment-Its Evaluation and Control (425-489). Fairfax, Virginia: American Industrial Hygiene Association.
Bruntland, G. (Eds.). (1987). Our common future: The World Commission on Environment and Development. Oxford: Oxford University Press.
DiNardi, S. R. (1998). Ergonomics. In DiNardi, S. R. (Eds.), The Occupational Environment-Its Evaluation and Control (726-775). Fairfax, Virginia: American Industrial Hygiene Association.
Environmental Protection Agency & the U. S. Consumer Product Safety Commission (1995). The Inside Story: A Guide to Indoor Air Quality. Retrieved August 2005 from http://www.epa.gov/iaq/pubs/insidest.html
Erikson, C., & Kuller, R. (1983). Non-Visual Effects of Office Lighting: CIE 20th Session. Amsterdam: Commission internationale de L'Eclairage.
Evans, G. W. & Stecker, R. (2004).Motivational Consequences of Environmental stress. Journal of Environmental Psychology, 24(2), 143-165.
Facilities Planning & Construction. University of Florida. Retrieved January 2005 from http://www.facilities.ufl.edu/sustain/index.htm
Fisk, W. J. (2000). Health and Productivity Gains from Better Indoor Environments and Their Implications for the U.S. Department of Energy. In Proceedings of E-Vision 2000 Conference. Washington, DC: Indoor Environment Department.
Fisk, W. J. & Rosenfeld, A.H. (1998). Potential nationwide improvements in productivity and health from better indoor environments. ACEEE Summer Study (85-97).
Gonchar. J. (2005, February 28). Rapidly Evolving Rating System Draws Applause and Criticism. Engineering News-Record. Retrieved May 2005 from http://enr.ecnext.com/
Heerwagen, J. H., & Orians, G. H. (1986). Adaptations to Windowlessness: A Study of the Use of Visual Decor in Windowed and Windowless Offices. Environment and Behavior, 18(5), 623-639.
Heschong Mahone Group. (1999). Daylighting in Schools. An investigation into the relationship between daylight and human performance. Fair Oaks, CA: Heschong Mahone Group.
Hoffmann, S. (2003). Carpet isn't the Culprit. Environmental Design & Construction, 6(3), 27-29.
Kaplan, S., Talbot, J. F., & Kaplan, R. (1988). Coping With Daily Hassles: The Impact of Nearby Nature on the Work Environment. USDA Forest Service, North Central Forest Experiment Station, Urban Forestry Unit Cooperative Agreement.
Kats, G. H. (2003). The Cost and Financial Benefits of Green Buildings. California's Sustainable Building Task Force. Retrieved August 2005 from www.cap-e.com
Keep, P. J., James, J., & Inman, M. (1980). Windows in the intensive therapy unit. Anaesthesia, 35, 257-262.
Kibert, C., J. (Eds.). (2005). Sustainable Construction: Green Building Design and Delivery. Hoboken, N.J.: John Wiley & Sons, Inc.
Kolleeny, F. J. (2003). Designing for Well-Being: Environments That Enhance The Quality of Life. Architectural Record, 191(11), 90-118.
Kuller, R., & Lindsten, C. (1992). Health and Behavior of Children in Classrooms with and Without Windows. Journal of Environmental Psychology, 12, 305-317.
Leather, P., Pyrgas, M., Di Beale, & Lawrence, C. (1998). Windows in the Workplace: Sunlight, View, and Occupational Stress. Environment and Behavior, 30(6), 739-763.
Levin, H. (2005). Ten Basic Concepts for Architects and Other Building Designers: Best Sustainable Indoor Air Quality Practices in Commercial Buildings. Retrieved July 2005 from http://www.buildinggreen.com/elists/halpaper.cfm
Madhavi, A. & Unzeitig, U. (2005).Occupancy Implications of Spatial, Indoor-Environmental, and Organizational Features of Office Spaces. Building and Environment, 40(1), 113-123
Milton, D. K., Glencross, P. M. & Walters, M. D. (2000). Risk of Sick Leave Associated with Outdoor Air Supply Rate, Humidification, and Occupant Complaints. Indoor Air, 10(4), 212-221.
O'Connor, J., Lee, E., Rubinstein, F. & Selkowitz, S. (1997). Tips for Daylighting. California Institute for Energy Efficiency. Retrieved April 2005 from http://windows.lbl.gov/daylighting/designguide/designguide.html
Ramsey, J. D. & Beshir, M. Y. (1998). Thermal Standards and Measurement Techniques. In DiNardi, S. R. (Eds.), The Occupational Environment-Its Evaluation and Control (661-687). Fairfax, Virginia: American Industrial Hygiene Association.
Rosenthal, N. E., Sack, D. A., Carpenter, C. J., Parry, B. L., Mendelson, W. B., & Wehr, T. A. (1985). Antidepressant Effects of Light in Seasonal Affective Disorder. American Journal of Psychiatry, 142, 163-170.
Seppanen, O & Fisk, W. J. (2002). Association of ventilation system type with SBS symptoms in office workers. Indoor Air, 12(2), 98-112.
Stone, N. J., & Irvine, J. M. (1993). Direct or Indirect Window Access, Task Type, and Performance. Journal of Environmental Psychology, 14, 57-63.
Ulrich, R. S. (1984). View through A Window May Influence Recovery from Surgery. Science, 224, 420-421.
U. S Green Building Council. (2002). Green building rating system for new construction & major renovations (LEED-NC 2.1.) Retrieved May 2005 from https://www.usgbc.org/Docs/LEEDdocs/LEED_RS_v2-1.pdf
U. S Green Building Council. (2005). LEED-NC version 2.1Rating System. Retrieved August 2005 from http://www.usgbc.org/Docs/LEEDdocs/LEED_RS_v2-1.pdf
Wargocki, P., Wyon, D.P, Sundell, J., Clausen, G, & Fanger, P.O. (2000). The Effects of Outdoor Air Supply Rate in an Office on Perceived Air Quality, Sick Building Syndrome (SBS) Symptoms and Productivity. Indoor Air, 10(4), 222-236.
Wilson, A. (2002, November). Green Schools: Learning as We Go. Environmental Building News. Retrieved April 2005 from http://www.buildinggreen.com
Wilson, A. (2005, April). Making the Case for Green Building. Environmental Building News, 14(4). Retrieved April 2005 from http://www.buildinggreen.com
Wilson, A., Malin, N. (1996). The IAQ Challenge: Protecting the Indoor Environment. Environmental Building News. Retrieved April 2005 from http://www.buildinggreen.com
Wright, T. A., Cropanzano, R., Denney, P. J., Moline, G. L., & Park R. (2002). When a Happy Worker is a Productive Worker: A Preliminary Examination of Three Models. Canadian Journal of Behavioral Science, 34(3), 146-150.
Zagreus, L., Huizenga, C., Arens, E. & Lehrer, D. (2004).Listening to the Occupants: A Web-Based Indoor Environmental Quality Survey. Indoor Air, 14(s8), 65-75.