About the Center for Retirement Research The Center for Retirement Research at Boston College, part of a consortium that includes parallel centers at the University of Michigan and the National Bureau of Economic Research, was established in 1998 through a grant from the Social Security Administration. The Center’s mission is to produce first-class research and forge a strong link between the academic community and decision makers in the public and private sectors around an issue of critical importance to the nation’s future. To achieve this mission, the Center sponsors a wide variety of research projects, transmits new findings to a broad audience, trains new scholars, and broadens access to valuable data sources.
Center for Retirement Research at Boston College
Hovey House 140 Commonwealth Avenue
Chestnut Hill, MA 02467 phone: 617-552-1762 fax: 617-552-0191
The Brookings Institution Massachusetts Institute of Technology
Syracuse University Urban Institute
3
Abstract
Cross-sectional evidence in the United States finds that informal caregivers have less
attachment to the labor force, measured both by the number of hours worked and labor
force participation. The causal mechanism is unclear: do children who work less become
informal caregivers, or are children who become caregivers working less? Using
longitudinal data from the Health and Retirement Study (HRS), this project identifies the
relationship between informal care and labor force participation in the United States, both
on the intensive and extensive margins, and whether there are wage penalties from
informal care. We use our results to examine retirement wealth effects, in particular,
changes in Social Security benefits. In our approach we carefully test for endogeneity;
control for time invariant individual heterogeneity; and, lastly, explore the effects across
key domains of behavior for men and women – stage and duration of care. We find that
there are modest decreases – around 2 percentage points – in the likelihood of being in
the labor force for caregivers. We find that female caregivers who have longer spells
face significant but modest risks of not working, that the negative effect on work for male
caregivers occurs right away, and that both male and female caregivers who have ended
caregiving are not significantly more likely to work. In addition, wage penalties exist for
female caregivers and wage premiums exist for male caregivers. There are minimal
expected changes to caregivers’ future Social Security benefits. Finally, despite strong
instruments, there is no evidence of endogeneity between informal care and work,
suggesting that controlling for individual heterogeneity with fixed effects is a sufficient
approach in longitudinal inquiries of informal care’s effect on work and wealth.
1
I. Introduction
For elderly parents, adult children are the most common type of informal care
providers, especially daughters. Furthermore, adult children are predicted to be an
increasingly important source of informal care as the baby boomer generation ages, the
number of divorcees increases, and the differential life expectancy between men and
women results in a larger number of widowed elderly women. Given that a typical adult
child caregiver is in his or her late 50s or early 60s, and hence still in the labor force, the
effect of caregiving on labor market decisions is an important policy issue.
Caregiving could affect work behavior on the extensive margin, the intensive
margin, or both (Crespo 2006; Heitmueller 2007). Changes in the extensive margin
include quitting work temporarily or retiring early. Changes in the intensive margin
include reducing work hours, or taking on fewer responsibilities, or forgoing a promotion
to fulfill caregiving obligations (Carmichael and Charles 2003). Both margins are
important, with implications for current earnings and potentially longer-term impacts on
retirement income that could affect quality of life long after the caregiving episode ends.
Although there is a substantial literature trying to estimate the causal relationship
between caregiving and work, it suffers from three main problems. The most significant
methodological concern in this pursuit is whether there is an endogeneity problem that
leads to biased estimates of the causal effect of informal care on work. Adult children
who have poor labor market opportunities may be more likely to become caregivers,
creating a selection bias in reduced-form estimates. Much of the older literature ignores
the problem, and newer work tries a variety of different estimation methods to address it,
and draws mixed conclusions about its existence. Second, much of the longitudinal
2
literature has focused on Europe, leaving it an open question as to how informal care
affects work in the United States over time. The United States has a relatively less
generous welfare state than in Europe, less generous public pension coverage, health
insurance that is tied to work under age 65, different patterns of female labor market
participation, and a more fluid job market. Hence, we might find a much smaller effect
of informal care on work in the United States than in Europe. Third, the literature has yet
to reach a consensus. Much of the literature looks at either the extensive or intensive
margin, or measures the impact on wages, but does not measure all margins of adjustment
and ignores the longer-term wealth concerns. Given the lack of consensus about the
impact caregiving has on work, it is very difficult to pool estimates across papers to have
a comprehensive and cohesive picture of the impact caregiving has on work and wealth.
This paper strives to fill the gap in the literature. Specifically, we identify the
relationship between informal care and labor force participation in a U.S. sample of
nationally representative prime age working individuals (age 50-64 at the start of the
study). We examine both the intensive and extensive margins of work and whether there
are wage penalties from informal care. We carefully test for endogeneity and control for
time invariant individual heterogeneity. Lastly, we explore the effects across key
domains of behavior separately for men and women — stage and duration of informal
care — and we use our results to examine retirement wealth effects. A comprehensive
approach has been lacking in U.S. studies.1
The rest of the paper is as follows: Section Two describes the existing literature
and highlights the lack of consensus. Section Three provides details about the data,
1 Johnson and Lo Sasso (2000) control for unobserved heterogeneity using random effects, but their data is limited to two waves of the HRS and their focus on hours of work neglects to inform us about effects on the extensive margin.
3
sample selection criteria, and measures. Section Four presents the methodology and
models. Section Five presents the main results: informal care’s effect on labor force
participation and on wages, estimated separately for men and women.2 Section Five also
presents the robustness checks and counterfactual estimates for the retirement wealth
effects. Section Six concludes.
II. Background
Ex ante, it is not clear what effect caregiving will have on work in the United
States. Time being scarce, caregivers may reduce work hours or exit employment in
response to the informal care needs of a parent. However, caregivers may instead
decrease their leisure time and maintain their labor force attachment due to financial
considerations such as health insurance or because it provides a break from caregiving
(Carmichael and Charles 2003; Wilson, Van Houtven, Stearns and Clipp 2007). Further,
the relationship between caregiving and work may change over the caregiving spell. A
caregiver may try to juggle both for a time, then experience burnout and forgo the other
activity. Alternatively, if the care recipient’s health deteriorates, the caregiving demands
may fall as formal care is sought and hence the number of work hours may increase
(O'Hara 2004). Conversely, with health decline of the care recipient the burden of
caregiving may increase and work hours may decrease. Hence, it is important to measure
the relationship between caregiving duration and work.
As proof of the importance of this topic, the literature exploring the relationship
between caregiving and work is quite extensive, using a variety of datasets, country and
2 We set out to also report the effects of informal care on hours of work (the intensive margin), but there were no significant effects in any specification, so we do not focus on this in the results section.
4
3 Table A1 summarizes the findings of the main published studies that address endogeneity between informal care and work in the cross-section. Table A2 provides detail on the longitudinal studies of informal care, in which either IV methods or longitudinal methods address endogeneity. 4 Studies that examine the initiation of caregiving include: Berecki-Gisolf et al. 2008; Pavalko and Artis 1997; Pavalko and Henderson 2006; Spiess and Schneider 2003; Wakabayashi and Donato 2005. Studies that study the termination of the spell include Pavalko and Artis 1997 and Spiess and Schneider 2003. 5 These studies define intensive caregivers by the number of hours of care provided per week/month. However, the data we use only records the hours of care at two-year intervals, making it particularly difficult to identify intensive caregivers based on a measure of hours. We prefer the type of care given, personal care versus chore care, as a better measure of the commitment provided by the child, and will not be able to directly compare our findings to these studies.
institutional settings, cross-section and longitudinal approaches, estimation methods, and
instrumental variables. However, this long literature has not led to a consensus about the
causal relationship between these two activities.3
Most studies have found a negative correlation between informal care provision and
the extensive and intensive margins of work (Spiess and Schneider 2004; Stone,
Cafferata, and Sangl 1987; Stone and Short 1990). Studies that look at different points of
the caregiving spell — initiation and termination — generally suggest that women who
initiate caregiving are less likely to participate in the labor force, more likely to work
decreased hours, and more likely to leave the labor force than non-caregivers, and these
changes are not reversed at the end of a caregiving spell (Berecki-Gisolf, Lucke, Hockey
and Dobson 2008; Pavalko and Artis 1997; Pavalko and Henderson 2006; Spiess and
Schneider 2003; Wakabayashi and Donato 2006).
4 In addition, some studies have found
wage penalties, (Carmichael and Charles 2003; Heitmueller and Inglis 2007) forgone
promotions, and losses in pension entitlements (Parker 1990) from providing informal
care. The existing European literature finds substantial heterogeneity of the impact of
caregiving on work, namely that the effect of caregiving on work tends to be stronger for
intensive caregivers (Carmichael and Charles 2003; Casado-Marin, Garcia-Gomez, and
Lopez-Nicolas 2010; Crespo 2006; Heitmueller 2007; Spiess and Schneider 2003).5
5
6 We do not have a large enough sample size to measure any heterogeneity of the effect for residential caregivers.
Coresidential caregiving has stronger negative effects on work in Europe (Casado-Marin,
Garcia-Gomez and Lopez-Nicolas 2010; Heitmueller 2007; Heitmueller, Michaud and
Nazarov 2010) whereas only noncoresidential women caregivers experience short-term
negative work effects in the United States (Ettner 1995).6 Some studies find stronger
impacts on women caregivers compared to men (Carmichael and Charles 2003; Do,
Norton, and Stearns 2008) while others do not (Bolin, Lindgren, and Lundborg 2008;
Johnson and Lo Sasso 2006).
Overall, it is hard to discern from the literature the total impact of caregiving on work
behavior of American caregivers over a long period. It is unclear if international
experience can be generalized to the United States. Virtually all U.S. studies use cross-
sectional data and thus cannot distinguish between temporary or permanent work
changes. Johnson and Lo Sasso (2000) are the exception in the United States, using two
waves of Health and Retirement Study (HRS) data and focusing on the intensive work
margin (they include non-workers by assigning zero hours of work to them), but the
limited panel length means that their findings are for short-term work effects only.
Several European studies have focused on labor market outcomes of caregivers at very
specific points in a caregiving spell, but none of the studies is truly comprehensive,
exploring the intensive, extensive, and wage margins of response at different stages of
caregiving, using similar methods on similar data.
6
III. Data, Sample Selection Criteria, and Measures
We use data from nine waves of the HRS (1992-2008). The HRS is a nationally
representative sample of the near elderly in the United States with rich informal
caregiving, labor force, and wealth data. HRS respondents were ages 50 to 64 when they
entered the sample, thus, their parents were prime candidates to be care recipients, with
ages ranging between 70 and 100, and a mean age of 82.
Sample selection criteria. We examine men and women separately, given their
different attachment to the labor force. Sample members include adult children who have
at least one parent or parent in-law alive in the current wave or two previous waves, who
are observed in at least two waves (Table 1). The 1992 wave did not have chore
assistance included in the definition of informal care, which was used in all subsequent
waves, thus, for the estimations of any chore or personal assistance, 1992 observations
were eliminated (4,458 female-wave and 3,945 male-wave observations). Furthermore,
to be included, sample weights had to be non-zero, in order to ensure that our results
applied to a nationally representative group of near elderly and elderly adults,
(eliminating 3,842 female-wave observations and 1,661 male-wave observations who
were very young or very old HRS respondents). Table 1 shows details of the sample
inclusion criteria for our baseline estimations — the any caregiving indicator for the LFP
and wage specifications — in which there are 18,995 female-wave and 17,775 male-wave
observations. The sample size changes slightly in each specification, depending on
which measure of informal care we use (any care, personal care, stage, or duration) and
whether we are looking at labor force participation (LFP), hours of work, or wages (The
exact number of observations in each specification appears at the bottom of tables 5-8).
7
Dependent variables. We examine three separate self-reported labor market
outcomes, taken from the RAND HRS data files. For labor force participation, our first
work measure, we categorize anyone who reports that they are working for pay (either for
someone else or self-employed) as working, and those out of work, looking for work, or
retired as not working. We also explore the usual number of hours worked per week
among workers to address the intensive margin of the work decision. Lastly, we examine
wages per hour among workers to examine whether informal care causes wage penalties.7
Key Explanatory Variables. Informal care is self-reported by the HRS
respondents. Specifically, the HRS asks, “Did you spend a total of 100 or more hours
(since Previous Wave Interview Month-Year/in the last two years) helping your or your
spouse’s (parents/mother/father) with basic personal activities such as dressing, eating,
and bathing?” The HRS also asks, “Did you spend a total of 100 or more hours (since
Previous Wave Interview Month-Year/in the last two years) helping your or your
spouse’s (parents/mother/father) with other things, such as household chores, errands,
transportation, etc.?” Our baseline specification uses the combined discrete measure of
any caregiving (personal care and chores), but we explore differential effects for those
providing any personal care, as a proxy for intensity of the caregiving episode.8 Personal
care likely indicates a higher commitment of time and effort to caregiving than assistance
with chores, given that it represents hands-on care in the care recipient’s home (Coe and
Van Houtven 2009).
7 If the respondent reports wages at a frequency other than hourly, the hourly wage rate is calculated using the usual hours worked per week, usual weeks worked per year, and pay rate, and adjusting for the periodicity of pay reported. 8 The caregiving question regarding chores and errands was not asked in 1992. Thus, we omit the 1992 wave from our specifications that use the combined measure of caregiving. However, we include the 1992 wave in the specifications that use the personal care measure.
8
Besides the discrete measures of caregiving, we also examine key points during
the caregiving experience, in order to examine whether there is a differential effect on
work by the stage of a caregiving episode. We look at stage of caregiving, which is
whether an adult child has initiated caregiving recently (defined as new to caregiving in
the past wave, that is, roughly in the last two years), whether he or she is a continuing
caregiver (defined as caring in the previous wave and still reporting caregiving in the
most recent HRS interview), and whether he or she reported no longer caregiving in the
most recent interview (but caregiving in the previous interview). Besides understanding
whether there are initial or continuing effects of caregiving during the episode of care,
examining the coefficient on ‘ended caregiving’ provides information about whether
labor market effects are fleeting or permanent. That is, if caregivers who have ended an
episode of caregiving are not more likely to work, it suggests that the effects of
caregiving on work are permanent.
We also examine the duration of caregiving using a set of dummy variables:
providing care anytime in the last two years (reporting caregiving in one wave),
providing care during the last four years (reporting caregiving in two consecutive waves),
last six years, and last eight or more years. The reference group is no caregiving.
Examining duration of caregiving is of interest because it can capture phenomena such as
informal care becoming more difficult to juggle along with work responsibilities the
longer the caregiving episode lasts.
Additional explanatory variables. The models include individual fixed effects to
capture time-invariant observed and unobserved individual characteristics. Thus many of
the standard demographic variables shown to be important in other labor supply models
9
are not included here, such as the respondent’s race and education. However, time-
varying characteristics remain: marital status, age and age squared, a discrete variable for
achieving the Social Security early entitlement age (62) or full retirement age (65-66
depending on birth year), discrete variables for self-reported health (poor/fair and good
with excellent as the omitted category) and changes in home ownership (1 indicates
person is a home owner).
The strength of one’s attachment to the labor force is measured in years of
previous work experience, tenure, and, for the wage equation only, whether a person was
a salaried worker (versus a wage worker). Individual logged spousal earnings, as well as
a dummy variable for one’s spouse having no earnings, are included. Household
characteristics in the models include household size, whether there is a child under the
age of 18 in the home, and household asset quartiles (lowest quartile omitted). Wave
dummies control for time trends in the data.
Selection
We take seriously the issue of differential selection into caregiving, as have many
other researchers examining this question. With the exception of Crespo (2006), most
studies are not able to reject exogeneity of informal care with respect to work (Bolin,
Lindgren, and Lundborg 2008; Casado-Marin, Garcia-Gomez, and Lopez-Nicolas 2010;
Heitmueller, Michaud, and Nazarov 2010; Heitmuller 2007; Wolf and Soldo 1994) or can
reject exogeneity only at borderline significance levels (Johnson and Lo Sasso 2006).
These studies use various techniques to address the selection issue, including
simultaneous equations (Wolf and Soldo 1994), lags and leads of caregiving (Heitmueller
10
2007), dynamic panel data methods (Heitmueller, Michaud, and Nazarov 2010) or
instrumental variables. However, some of the instruments are weak (Bolin, Lindgren,
and Lundborg 2008; Heitmueller 2007) or their own exogeneity has been called into
question (for example, distance between parents and children or lagged work status).
Thus, there is no consensus about the importance of controlling for endogeneity bias in
studies of informal care and work.
We undergo extensive testing for potential endogeneity. Appendix Table A3
provides detailed results of these tests. The group of identifying instruments differs
slightly across specifications, but includes: an indicator for parent or in-law needs
assistance with ADLs; indicator for parent or in-law cannot be left alone; separate
indicators for mother, father, mother-in-law, and father-in-law has not been alive at any
time in the last two years; separate indicators for mother (mother-in-law) became
widowed at some point since the last wave. The instruments are empirically strong
(Table A3). Regardless of which of the four groups of instruments is used, the joint F-
statistics are far above the conventionally accepted floor of 10 (Staiger and Stock 1997)
and the partial R-squared values range from .015 to .05.
The instruments are also theoretically strong. Having a parent or in-law who is
widowed means the spouse is not available to assume the caregiving role, increasing the
demand for an adult child or child-in-law to provide care. ADL limitations or memory
problems of a parent or parent-in-law should directly increase demand for informal care
but not directly affect work behavior other than through the informal care path. A
parent’s health is not likely to affect the work outcome directly, but instead through the
informal care behavior of the child. There is some concern that one’s parents’ health may
11
affect work directly, if this provides new information about the child’s own ability to
work later, or if the mental health of watching a parent decline has a direct negative effect
(Amirkhanyan and Wolf 2006). We suspect these pathways are unlikely to be strong
enough to affect work directly. Yet even in specifications that did not use parent health
as identifying instruments (bottom row of Table A3), the instruments were jointly strong
(F-statistic ranging between 32 and 84, and partial R-squared statistics of .015 to .05).
Thus, if parent health is not viewed to be theoretically palatable, the other instruments
remain strong.
IV. Methods
We model the labor market decisions of the HRS respondents as a function of
individual characteristics and caregiving activity. The basic specification is:
The work outcome, LFP, measures whether or not an adult child works.9
9 We also ran the same regression on the number of hours worked per week, conditional on being in the labor force. Caregiving never has an impact in the hours equation (results available by request).
Informal Care, Ac, is defined as: any personal or chore informal care; any personal care;
stage of informal care (initial, continuing, or recently ended); and duration of informal
care (two waves, four waves, six waves, eight or more waves). The vector Xc refers to
time varying individual characteristics of the adult child, such as age, marital status, self-
reported health, home ownership, and work attributes, such as experience. Xs refers to
spousal work attributes, such as logged spousal earnings and zero spousal earnings. XH
12
refers to time-varying household characteristics such as household asset quartiles, having
a child under 18 in the household, and household size.
For the subsample who work, we also estimate the log hourly wage, using the
We augment a traditional Mincer wage equation by including informal care, Ac,
defined as above, and Yc is a vector of time-varying individual characteristics, including a
married indicator and self-reported health category indicators. Jc is a vector of job
characteristics, including experience, experience squared, tenure, tenure squared, and
indicator for whether a person was a salaried or a wage worker.
Both models include fixed effects (µc), to control for time invariant individual
unobserved heterogeneity. The use of fixed effects helps ensure that differences in labor
market attachment not attributable to caregiving, such as distaste for work or unobserved
disability, are not driving the results.
V. Results
Descriptive results.
Caregiving adult daughters were very similar to non-caregiving adult daughters in
their labor force participation, with around 48 percent of them reporting working.
Caregiving daughters worked around half an hour less a week than non-caregiving
daughters, 34.2 compared to 34.8 hours per week. Along with working fewer hours,
caregiving daughters had slightly lower average hourly wages among workers, at $15.07
per hour compared to $16.67 per hour for non-caregivers. Among adult sons, labor
13
participation was 3 percentage points higher across all waves for non-caregivers, with 56
percent of caregivers working compared to 59 percent of non-caregivers. Hours of work
per week were similarly slightly lower among caregiving sons compared to non-
caregiving sons by just under two hours per week, as were wages (by $0.60 an hour).
There are some surprising characteristics of caregivers compared to non-
caregivers in the sample. Caregivers were more educated than non-caregivers, with 18.7
percent (25.7 percent) of adult female (male) caregivers completing college compared to
16.4 percent (24.3 percent) of non-caregiving females (males), and a similar pattern
exists for the other education categories. Most striking, 17 percent (17.8 percent) of
caregiving females (males) had less than a high school education whereas nearly 26
percent (27.5 percent) of non-caregiving females (males) did. In general, differences by
caregiving status are more evident for females than for males. Female caregivers had
higher rates of home ownership than non-caregiving women (by 5 percentage points),
had longer attachment to the labor force (as measured by years of experience), and rated
their own health higher than non-caregiving females. These descriptive statistics do not
square with the conventional wisdom that the adult child with the lowest opportunity cost
of time may become the caregiver.
Age and marital status are similar by caregiving status, yet a lower proportion of
caregiving females are non-white compared to non-caregiving females. This difference is
more pronounced among men: 12.9 percent of caregiving males were non-white,
whereas 15.8 percent of non-caregiving males were non-white.
In addition, there is great variation in caregiving stages and duration in the sample
(Table 2a). Eleven percent (10.63 percent) of the female (male) sample recently had
14
initiated caregiving and 18.8 percent (13.6 percent) of the female (male) sample was in a
continuing caregiving phase. It was most common to be observed caregiving in an early
duration of caregiving, with just under 14 percent of the female sample and 13 percent of
the male sample providing care for one wave. The proportion of the sample providing
longer-term caregiving declined as one looked farther out in duration, with 4 percent and
3 percent of women and men, respectively, providing care for three waves (up to six
years) and 4.5 percent and 2.7 percent of women and men, respectively, providing care
for four waves or more.
Transitions between work and caregiving are found in tables 3 (for women) and 4
(for men). Looking across the diagonal from top left to bottom right shows that behavior
is persistent: for example, 60 percent of women who were not working and not
caregiving in time t were also not working and not caregiving two years later (t+2).
Around two-thirds of women and men who were working and not caregiving in time t
were also in that state in time t+2. Caregiving behavior is less persistent than working
behavior, with around 50 percent (46 percent) of women (men) remaining in a
caregiving-only state in t+2. Similarly, around 46 percent (43 percent) of women (men)
were working and caregiving at t and t+2.
Among women working and caregiving in time t, 12.8 percent were only
caregiving two years later. This compares to just under 10 percent for men. Not
surprisingly given the age profile of the sample, few persons who were caregiving only in
time t picked up work two years later, around 4 percent of women and 5 percent of men.
A higher proportion of women (men) who were only working in t started caregiving (and
remained working) two years later, around 14.6 percent (12.2 percent).
15
Main Results.
After including individual fixed effects, we could not reject exogeneity between
informal care and work, despite strong instrumental variables (Table A3). Thus, we
present the results from reduced form models of informal care and work treating informal
care as exogenous. We discuss both the decision to work or not (extensive margin) and
logged wages among workers, examining differential effects by the different caregiving
definitions (any chore or personal; any personal care; stage of care; duration of care).
Unless noted in parentheses in the text, the significant effects discussed below have a
significance level of at least 5 percent.
Extensive Margin.
Any informal care. The linear probability model with individual fixed effects
indicates that caregiving of any type, e.g., assistance with either chores, personal tasks, or
both, has a modest, but significant, negative effect on labor force participation for both
men and women (Table 5). Women caregivers have a reduction in the likelihood of
working by 1.3 percentage points (p<0.10), whereas male caregivers have a reduction of
1.7 percentage points. These represent a reduction in the mean participation rates of
almost 3 percent (2.7 percent for women and 2.9 percent for men). Limiting the
definition of informal care to personal assistance with activities of daily living, the effects
are about twice as strong for women (2.4 percentage points) or a 5 percent decrease from
mean LFP rates. For men, the impacts are also stronger; there is a 2.3 percentage point
reduction in the likelihood of any work, or a 4 percent decrease from the mean.
16
Some of the strongest negative effects on labor force participation are the Social
Security early and full retirement ages. Being over 62 makes women 6-7 percentage
points less likely to work and men 9-10 percentage points less likely. The effects are
similar for being at least 65 years old. Being married makes one less likely to work for
men and women, with a larger magnitude for women. Being in poor or fair health makes
one less likely to work for women and men than those in good health or better — women
in poor or fair health are 7.6 percentage points less likely to work compared to women in
excellent health, whereas men are 10 percentage points less likely to work. More
experience increases the likelihood of working for men and women. Finally, higher
earnings of one’s wife make a man more likely to work, but one’s husband’s earnings do
not matter for women. Many of these secondary findings are consistent across all of the
definitions of informal care, which we will discuss next.
Stage of informal care. To define stage of informal care, we looked at where the
person was in the caregiving episode, in the first wave (initiate), in the middle of
caregiving (e.g., provided care in the previous wave and reported still caregiving at the
last HRS interview), and recently ended caregiving (e.g., caregiving in the previous
wave(s) but no longer caregiving in the last wave). Caregiving includes the broader
definition for these specifications — chores and/or personal assistance. Among women,
caregivers who were in the continuing stage of caregiving had a reduced likelihood of
working by 2.2 percentage points (p<0.10) (Table 6). For men, the only stage of
caregiving that significantly reduces labor force participation is when caregiving is first
initiated, that is, when a man has provided care for less than two years (p<0.10).
A positive and significant sign on the “end caregiving” dummy variable would
17
indicate that caregivers have an increased likelihood of entering, or re-entering, or
remaining in the labor force. We find no evidence that caregivers are more likely to work
once caregiving has ended (Table 6). We have also tested for lagged impacts of returning
to work after a caregiving episode ends, that is, to understand whether people are more
likely to work two years after the care episode ended, and still do not find any significant
effects on work. This suggests that the measured impacts of informal care on labor force
participation are permanent.
Duration of informal care. For women caregivers, the reduction in labor force
participation observed using a discrete measure of caregiving (Table 5), appears to occur
between the first two and the first four years of being a caregiver (see coefficient on “2
waves of caregiving” in Table 6), with women caregivers in this phase having a 2.5-
percentage-point reduction in their labor force participation compared to non-caregivers.
This finding is consistent with the findings that continuing caregivers have a negative
impact on work. The effect of caregiving for other durations (four-six, six-eight, or eight
or more years) on any work are not significant for women.
The labor force participation effects of caregiving for men, by contrast, are more
immediate. Controlling for the duration of caregiving, men who had provided care for
two years or less (one wave only) were significantly less likely to work compared to non-
caregivers (1.7 percentage points less likely). There were no other periods of duration
that have significant effects on work for male caregivers (Table 6).
18
Wage Penalties.
Providing any informal care (chores and/or personal care) has a negative effect on
female workers’ wages. Becoming a caregiver leads to a 3-percent reduction in a
woman’s hourly wage on average compared to not becoming a caregiver (p<0.10) (Table
7). Using a Duan smearing factor to account for retransformation bias (Duan 1983),
female caregivers are predicted to have a wage of $12.57 compared to $12.94 for non-
caregivers, or a loss of $0.37 per hour in absolute terms. Extrapolating to a year’s worth
of work given mean hours a week worked among workers observed in our sample was 35
and, assuming 52 weeks of paid work a year, the wage penalty accumulates to $670 in
lost earnings for one year. Being a personal care task caregiver does not have a
significant effect on women’s wages. We do not find evidence of a wage penalty among
male workers in this specification (Table 7).
Examining stage of informal care, there is evidence that female caregivers in the
continuing stage, that is, caring for at least two years and not yet finished caregiving,
have a significant wage penalty, by just under 5 percent (p<0.10). There is no evidence
that caregivers who have recently ended caregiving face a wage penalty, thus, the wage
effects among caregivers who remain in the workforce are limited to during the
caregiving episode.
For men, caregivers in the initial phase see a statistically significant increase in
their hourly wage, by 9.1 percent (Table 8, column III). This result is somewhat
puzzling, considering time trends are controlled for in the model. For men who have
recently ended caregiving, there is the same magnitude increase in the hourly wage, of
9.5 percent. Using predictions of the linear wage and adjusting by a Duan smearing
19
factor to account for retransformation bias, this translates to a predicted hourly wage
increase of $2.26 for male caregivers who have recently ended caregiving, compared to
never-caregivers ($24.88 for caregivers versus $22.62 for non-caregivers). One potential
explanation is that male caregivers are also likely to have a wife providing care, and thus
he may be increasing his work hours in order to make up for her lost wages. We leave it
to future work to examine the intra-household bargaining decisions between husbands
and wives during a caregiving episode.
Regarding duration of care, there were no commensurate wage effects for men —
men with longer duration of caregiving had negative but non-significant wage effects.
Working women caregivers, on the other hand, were seen to have a considerably lagged
effect on wages. Female workers who reported providing care in four or move waves of
the HRS faced a large wage penalty, upward of a 14-percent reduction in the hourly wage
(Table 8). Relating this effect to the predicted hourly wages of long duration caregivers
($11.25) versus non-caregivers ($12.90), this translates to a loss of $1.65 an hour. Of
course, this is the rarest type of caregiver, with only 4.5 percent of the female sample
providing care for such a long duration (Table 2a). Nevertheless, making the same
assumptions about hours per week and weeks per year paid, this totals around $3,000 in
lost earnings per year for this sub-group. Notably, this wage difference is much higher in
magnitude than in the case where caregiving is measured discretely as providing any care
in the past two years. Thus, considering stage and duration picks up important dynamic
effects of the relationship between informal care and work that would be masked with a
more simplistic approach.
20
Impact of Informal Caregiving on Retirement Income.
Beyond the immediate impact caregiving has on labor market outcomes, it is also
important to estimate the longer-term impact that caregiving may have on lifetime wealth
and retirement income. In order to do so, we use our results to estimate the change in
Social Security wealth for caregivers.
First, we use the labor force participation model results (detailed in Table 5) to
predict the probability that an individual is working. We define a cutoff point in the
predicted probability (58 percent for men, 50 percent for women) over which we say the
individual is working, based on the threshold that best matches the prediction to observed
behavior. For informal care providers, we then run the counterfactual for the wave in
which they begin caregiving and all subsequent waves, and predict the likelihood they
would work if they did not provide care. Using the same cutoff points described above,
our estimates indicate that an additional 2.4 percent of caregivers would work if they had
not been caregivers.
Then, we use our estimated wage equations to predict the wage for caregivers,
both in the baseline and in the counterfactual when they do not provide care. If we
predicted them to work and they had not otherwise, we also adjust upward the experience
and tenure variables in the wage equation, allowing indirect effects on wages to enter
through the increased experience and tenure. We then use the historical earnings
information from the Social Security matched dataset and our estimates of earnings
between the initial wave of caregiving for an individual until 2008 to calculate an
individual’s Social Security monthly benefit amount as if they claimed at age 62.10
10 For some respondents we only estimate their counterfactual behavior until 2006 because they attrite from the sample by 2008.
21
Comparing Social Security benefits under these two scenarios leads us to believe
that caregiving does not lead to substantial changes in Social Security benefits for this
cohort, for a variety of reasons. First, the additional number of workers is small, only 2.4
percent (36 of 1494 individuals). Second, the increase in the primary insurance amount
(PIA) associated with these added workers is too small to amount to a large change in the
benefit. The additional years of work for most of these individuals do contribute to the
top 35 years of their working history (30 out of the 36), with a resulting increase to the
PIA ranging from $1.52 to $65.86 a month (in 2008 dollars). Yet, because 98 percent of
the sample faces no increase in their PIA through an increase in wages, the end result is
that there is very little impact on Social Security benefits. Finally, 23 percent of the care
providers who are married with both members of the couple being at least age 62 have
sufficiently higher-earning spouses, so a few additional years of earnings do not change
their actual Social Security benefit.
VI. Conclusion
In general, the magnitude of the effects on labor force participation of providing
any informal care is similar for men and for women. Our findings, of a 1.2 to 2.4-
percentage-point drop in labor force participation for women and 1.7 to 2.3-percentage-
point drop for men, is near the lower end of the zero (Bolin 2008) to 40 (Crespo 2006)
range found in the current international literature. The lower response in the United
States may be due to the relatively less generous social safety net in the United States
compared to Europe. That said, we also find no change in the intensive work margin, in
contrast to the only other U.S. study using panel data and controlling for unobserved
22
heterogeneity. Johnson and LoSasso (2006), who find that women caregivers who
provided care in the past two years cut back their current work hours by 367 hours in the
current year (1998), a 41-percent reduction on average (Johnson and Lo Sasso 2006).
Their approach differs from ours in considering non-caregivers in the estimation of the
intensive margin (assigning zero hours to them) and using only two waves of data.
We find that longer-duration female caregivers face significant but modest risks
of exiting the labor force, that the negative effect on work for male caregivers occurs
right away, and that both male and female caregivers who have ended caregiving are not
significantly more likely to be working.
We also find modest wage penalties among female caregivers when measuring
caregiving discretely, around $0.40 per hour in wages. Wage penalties become more
pronounced for long-duration caregivers, upward of $3,000 for one year of work among
caregivers who had cared for four or more waves, compared to non-caregivers. We find
a wage premium among male caregivers who recently initiated caregiving and who
recently ended caregiving, compared to non-caregivers. The wage benefits to these male
caregivers are not insubstantial — a $2.20-an-hour gain in predicted wages. This result is
hard to interpret, but may have to do with joint-caregiving decisions in the household, in
which the caregiving responsibility falls primarily upon the wife. It could also be that
lower wage caregiving men drop out of the labor force, and higher paid men are still in
the labor market, so the average wage increases among workers.
Using the results from the labor force participation estimations, we find that the
ramifications for a caregiver’s future Social Security benefits are miniscule, mostly
driven by the lack of movement in working behavior that informal care is found to
23
induce. The counterfactual exercise shows that only a very small proportion of
caregivers would have experienced higher Social Security benefits (2.4 percent) if they
had never become caregivers.
Our approach has allowed us to learn about three important features that should
be considered in future work: 1) We do not find evidence of endogeneity across any of
the specifications explored in this paper, despite theoretically and empirically strong
instruments. We conclude from this that selection bias may not be a major concern in
this line of research once one controls for individual heterogeneity with fixed-effects. 2)
Overall there are not major work disruptions or large negative wage effects of caregiving
except in special cases, such as for long-duration caregivers in the United States. Not
measuring caregiving in terms of stage and duration would have missed these important
effects. Finally, 3) it is important to model separately the effects of caregiving on men
and women. Whereas the women and men look very similar to each other in the labor
force participation equations, male caregivers tend to experience work effects
immediately upon caregiving whereas for women caregivers, there is a lagged effect. In
addition, men experience a wage premium from caregiving whereas women experience a
wage penalty in several cases.
It is likely that labor market effects of caregiving occur that we did not measure.
We do not model the joint labor supply changes of a couple in the face of caregiving.
Given that decisions about caregiving for one’s parents or in-laws is likely a household
decision, there may be minimal effects in our current paper because a non-working
spouse can take up the slack. Extending this work to considering joint-labor market
effects and joint-caregiving will enlighten us about the importance of this phenomenon.
24
Table 1. Sample Attrition
LFP Estimation Wage Estimation
Women Men Women Men Person-wave observations (1992-2008) Have at least one parent or parent in-law alive in current wave or previous two waves Eliminate 1992 wave (no chore caregiving question asked) Have non-zero sample weight Working in current wave Non-missing wage Person-wave observations in estimation Unique individuals in estimation
50,867
27,430
22,972
19,130
18,995
4,239
40,756
23,458
19,513
17,852
17,775
3,879
50,867
27,430
22,972
19,130 9,112 7,854 7,744
2,629
40,756
23,458
19,513
17,852 10,303 8,702 8,562
2,670
Note: This sample size is for the any caregiving specification that predicts labor force participation and wages. For duration of caregiving (2, 4, 6, and 8 or more waves) we use the same sample as described in this table. When we use the personal caregiver indicator we gain observations since we can also estimate on the 1992 wave. For stage of caregiving (initiate, continue, and recently ended caregiving) we lose observations since we can only create such variables for 1996 and on. The sample sizes for the latter two specifications are reported in each of the results tables.
25
Table 2. Characteristics of Adult Children Variable Description Women Men Caregivers Non-
Caregivers Caregivers Non-
Caregivers Dependent variables Working for pay 0.485 0.473 0.556 0.585 Hours of work /week (for those who work)
34.19 (14.61)
34.78 (14.17)
39.37 (15.32)
41.12 (15.13)
Hourly wage 15.07 (24.25)
16.67 (51.63)
24.89 (58.00)
25.50 (65.70)
Log hourly wage (for those who work)
2.43 (0.68)
2.42 (0.75)
2.77 (0.87)
2.75 (0.88)
Age 61.18 (4.96)
61.06 (5.39)
62.99 (5.37)
62.95 (5.79)
Between ages of 62 and 65 0.194 0.181 0.201 0.192 Age 65 or older 0.214 0.218 0.338 0.335 Married 0.723 0.716 0.852 0.860 Non-white 0.162 0.188 0.129 0.158 Less than high school education
0.170 0.256 0.178 0.275
High school education 0.413 0.369 0.349 0.298 Some years of college 0.230 0.211 0.216 0.184 College graduate 0.187 0.164 0.257 0.243 Has a child under 18 0.029 0.041 0.056 0.088 Household size 2.314
(1.03) 2.372 (1.21)
2.415 (0.98)
2.504 (1.17)
Excellent or very good self-reported health
0.495 0.468 0.470 0.448
Good self-reported health 0.304 0.290 0.323 0.313 Fair or poor self-reported health
0.201 0.242 0.207 0.239
Years of work experience 28.18 (13.68)
25.984 (14.10)
40.132 (9.25)
39.673 (9.97)
Home owner 0.881 0.833 0.898 0.865 Person-wave observations 5,783 13,212 4,392 13,383 Source: Authors’ calculations from the HRS.
26
Table 2a. Caregiving behavior by stage and duration of care Women Men Caregiving Stage (%) Recently initiated caregiving 11.00 10.63 Continuing caregiving 18.82 13.58 Recently ended caregiving 13.89 12.50 Not caregiving in current wave and did not recently end caregiving
56.29 63.29
Number of observations 18,995 17,775 Caregiving Duration (%) 0 waves 70.60 76.30 1 wave 13.82 12.68 2 waves 6.90 5.47 3 waves 4.23 2.86 4+ waves 4.45 2.69 Number of observations 22,111 21,049 Note: The table shows the percentage of female-waves and male-waves falling into each category of caregiving stage for the specification for LFP with caregiving stage indicators on the RHS (Table 6 results, columns II, IV) and the percentage of female-waves and male-waves falling into each category of duration for the specification for LFP with duration indicators on the RHS (Table 6 results, columns I, III) and into each category. As such, the number of non-caregivers is not exactly the same across samples. Adding up the proportion who were initial and continuing caregivers roughly equals the proportion who were 1, 2, 3, or 4+ duration caregivers.
27
Table 3. Transitions between Work and Caregiving for Women Time t+2 Time t Not working,
not caregiving Working only
Caregiving only
Working, caregiving
Not working, not caregiving
4,618 (59.59)
1,557 (20.09)
1,023 (13.20)
551 (7.11)
Working only 821 (15.40)
3,536 (66.33)
198 (3.71)
776 (14.56)
Caregiving only 1,053 (40.38)
105 (4.03)
1,300 (49.85)
150 (5.75)
Working, caregiving 237 (8.90)
842 (31.63)
341 (12.81)
1,242 (46.66)
Source: Authors’ calculations from the HRS. Percent of each row given in parenthesis. Table 4. Transitions between Work and Caregiving for Men Time t+2 Time t Not working,
not caregiving Working only
Caregiving only
Working, caregiving
Not working, not caregiving
3,467 (51.23)
2,088 (30.85)
679 (10.03)
534 (7.89)
Working only 940 (14.54)
4,539 (70.23)
199 (3.08)
785 (12.15)
Caregiving only 727 (43.82)
86 (5.18)
771 (46.47)
75 (4.52)
Working, caregiving 196 (8.89)
842 (38.19)
213 (9.66)
954 (43.27)
Source: Authors’ calculations from the HRS. Percent of each row given in parenthesis.
28
Table 5: Linear probability model of Informal Care’s Effect on Labor Force Participation Women Men I II III IV
Care Definition Caregiver -0.0129* -0.0170** (any type) (0.0075) (0.0081)
Personal -0.0242*** -0.0228** caregiver (0.0091) (0.0107)
Demographics Age -0.0446** -0.0173 -0.0732*** -0.0526**
(0.0226) (0.0202) (0.0246) (0.0208) Age squared 0.0002* 0.0000 0.0005*** 0.0004***
(0.0001) (0.0001) (0.0001) (0.0001) Age 62 -0.0648*** -0.0744*** -0.0891*** -0.1028***
R-squared 0.69 0.67 0.68 0.66 Robust standard errors in parentheses * significant at 10%; ** significant at 5%; *** significant at 1% Note: All regressions also include individual fixed effects and wave dummy variables.
29
Table 6: Linear probability model of Stage of Informal Care’s Effect on Labor Force Participation
Women Men I II III IV
Care Definition Initiate caregiving -0.0184 -0.0214*
1 wave of caregiving -0.0083 -0.0166* (0.0089) (0.0093)
2 waves of caregiving -0.0245** -0.0140 (0.0120) (0.0133)
3 waves of caregiving -0.0146 -0.0203 (0.0152) (0.0184)
4+ waves of 0.0024 0.0050 caregiving (0.0170) (0.0216)
Person-wave observations
16,130 18,995 14,824 17,775
Unique individuals in estimation
4,084 4,239 3,691 3,879
R-squared 0.72 0.69 0.70 0.68 Robust standard errors in parentheses * significant at 10%; ** significant at 5%; *** significant at 1% Note: All regressions also include all variables shown in table 5, individual fixed effects, and wave dummy variables.
30
Table 7. Informal Care’s Effect on Logged Hourly Wage
Women Men I II III IV
Care Definition Caregiver -0.0296* 0.0281 (any type) (0.0173) (0.0253)
Personal caregiver -0.0176 -0.0054 (0.0238) (0.0326)
Demographics Married -0.0008 -0.0307 0.0213 0.0144
(0.0416) (0.0339) (0.0528) (0.0429) Good self-reported 0.0130 0.0045 0.0122 0.0137
R-squared 0.75 0.74 0.72 0.71 Robust standard errors in parentheses * significant at 10%; ** significant at 5%; *** significant at 1% Note: All regressions also include individual fixed effects and wave dummy variables.
31
Table 8. Stage of Informal Care’s Effect on Logged Hourly Wage Women Men I II III IV
Care Definition Initiate caregiving -0.0295 0.0914**
R-squared 0.77 0.75 0.74 0.72 Robust standard errors in parentheses * significant at 10%; ** significant at 5%; *** significant at 1% Note: All regressions also include individual fixed effects and wave dummy variables.
32
Appendix Table 1. Cross-sectional studies that test for endogeneity of informal care and work.
Paper Country X-Section v. Long
Intensive vs. Any?
Co-residential
Men v. Women
Married v. Single
Instruments IVs Empirically Strong?
Evidence of Exogeneity
Bolin, Lindgren, Lundborg (2008)
Europe Cross-Section
Log of weekly hours of care is variable of interest; indicator for any caregiving in sensitivity analysis
Exclude coresidents in main analysis; distinguish between them using indicators in sensitivity analysis
Yes Marital status controlled for in regressions
Indicator for mother's health is bad/very bad, indicator for father's health is bad/very bad, mother's age, father's age, indicator for mother lives 100+ km away, indicator for father lives 100+ km away, indicator for mother is deceased, indicator for father is deceased, total # of living siblings
Generally strong for full sample and female sample; poor for male sample
Generally cannot reject exogeneity
Casado-Marin, Garcia-Gomez, Lopez-Nicolas (2010)
Spain Longitudinal Yes Yes Only Women
Marital status controlled for in regressions
Does not IV in main analysis but employs FE and allows for state dependence in a dynamic ordered probit model; in sensitivity analysis they estimate a bivariate dynamic model of caregiving and employment with fixed effects and allowing for correlation among the random components of the eqns where the instrument or excluded variable in the caregiving eqn is an indicator for whether there was anyone 65+ in the household in the previous period.
Indicator for 65+ in household in previous period is significant at 5%
Cannot reject exogeneity (in this case no correlation between random components of error terms)
Crespo (2006)
Europe Cross-Section
Only consider caregivers who provide care on daily or weekly basis
Not in estimation, only descriptive stats
Only women
Marital status controlled for in regressions
Age of oldest parent (Yes), dummies for health status of parent that is in worst health (Sometimes), dummies for having sisters (Yes) and brothers (No), dummy for both parents alive (Sometimes), parents' income (No)
Some are significant. The validity and explanatory power of the variables used as `instruments' for the caregiving indicator have been checked.
Evidence of positive correlation between unobservables in the error term of the LFP equation and caregiving regressor (note: simultaneous bivariate probit is the estimation technique).
33
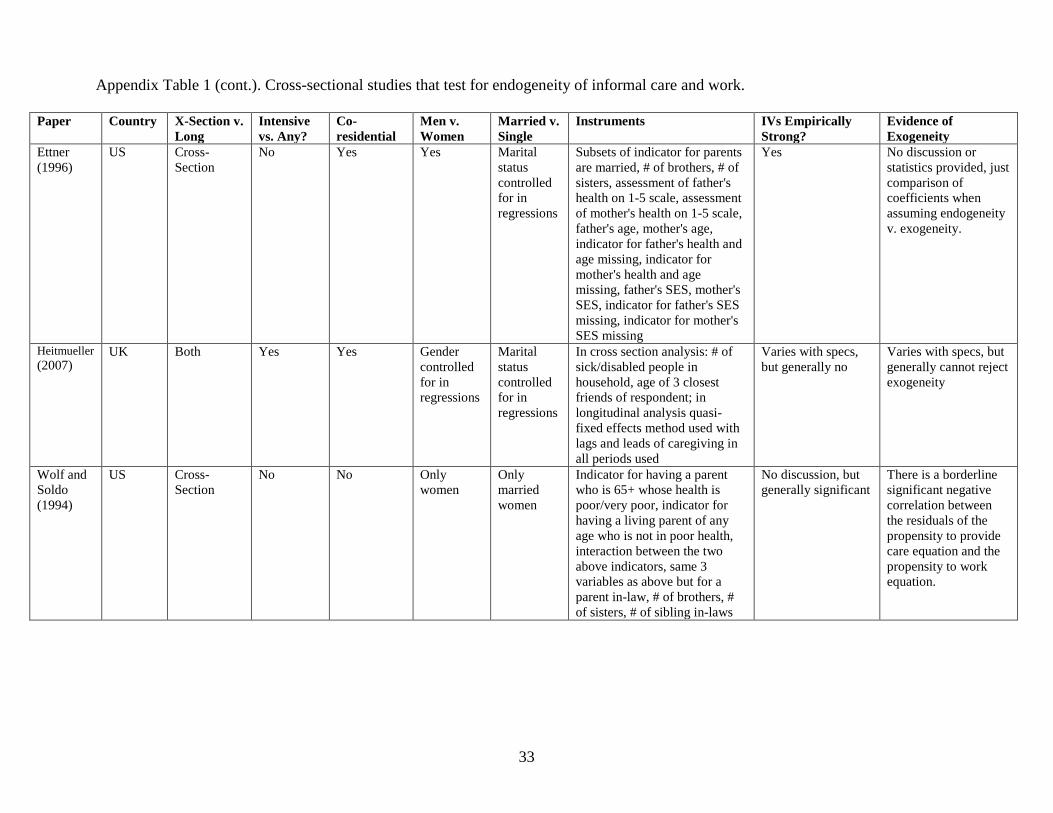
Appendix Table 1 (cont.). Cross-sectional studies that test for endogeneity of informal care and work.
Paper Country X-Section v. Long
Intensive vs. Any?
Co-residential
Men v. Women
Married v. Single
Instruments IVs Empirically Strong?
Evidence of Exogeneity
Ettner (1996)
US Cross-Section
No Yes Yes Marital status controlled for in regressions
Subsets of indicator for parents are married, # of brothers, # of sisters, assessment of father's health on 1-5 scale, assessment of mother's health on 1-5 scale, father's age, mother's age, indicator for father's health and age missing, indicator for mother's health and age missing, father's SES, mother's SES, indicator for father's SES missing, indicator for mother's SES missing
Yes No discussion or statistics provided, just comparison of coefficients when assuming endogeneity v. exogeneity.
Heitmueller (2007)
UK Both Yes Yes Gender controlled for in regressions
Marital status controlled for in regressions
In cross section analysis: # of sick/disabled people in household, age of 3 closest friends of respondent; in longitudinal analysis quasi-fixed effects method used with lags and leads of caregiving in all periods used
Varies with specs, but generally no
Varies with specs, but generally cannot reject exogeneity
Wolf and Soldo (1994)
US Cross-Section
No No Only women
Only married women
Indicator for having a parent who is 65+ whose health is poor/very poor, indicator for having a living parent of any age who is not in poor health, interaction between the two above indicators, same 3 variables as above but for a parent in-law, # of brothers, # of sisters, # of sibling in-laws
No discussion, but generally significant
There is a borderline significant negative correlation between the residuals of the propensity to provide care equation and the propensity to work equation.
34
Appendix Table 1 (cont.). Cross-sectional studies that test for endogeneity of informal care and work. Paper Results: Extensive Margin? Results: Extensive
Margin-Reentry? Results: Intensive Margin?
Bolin, Lindgren, Lundborg (2008)
10% increase in weekly hours of care leads to 3.7% reduction in employment probability for full sample, 2.8% decrease for female sample, 3.2% decrease for male sample
10% increase in weekly hours of care leads to 2.6% reduction in # hours worked, but effects insignificant when men and women are analyzed separately
Casado-Marin, Garcia-Gomez, Lopez-Nicolas (2010)
Caring for someone at home reduces probability of working FT by 2.7%; caring elsewhere has no effect; probability of working FT does not diminish significantly in first caregiving year, but in subsequent years; caring 28+ hours a week reduces probability of working as much as 4.5%
In one specification, stopping care has a positive effect on leaving non-work and entering PT or FT
No evidence of women transiting from FT to PT, only evidence of transitions from FT/PT to non-work
Crespo (2006) Caregiving decreases LFP 30% on average for southern European countries and from 30-40% in northern European countries when endogeneity is taken into account; finds a 4-6% decrease when caregiving is treated as exogenous.
Coresident caregiving leads to a large, significant reduction in work hours
Ettner (1996) Non-coresidential caregiving significantly decreases women's work by 11-12 hours per week; effect only significant for women caregiving outside the household.
Heitmueller (2007) Cross section: Being a care provider reduces LFP by 6%; coresident caregiving reduces LFP by up to 15%, extra-residential caregiving has no effect; caring 20+ hours a week reduces LFP by 26%
Wolf and Soldo (1994) Caregiving does not significantly reduce married women's employment
Caregiving does not significantly reduce married women's hours of work
35
Appendix Table 2. Studies using longitudinal data that either test for endogeneity of informal care and work or use longitudinal methods to control for unobserved heterogeneity.
Paper Country
Cross-Section v. Longitudinal Intensive vs. Any?
Co-residential Men v.
Women? Panel Techniques Used Heitmueller, Michaud, and Nazarov (2010) UK Longitudinal
Only in sensitivity analysis Yes Women only
Time invariant unobserved heterogeneity via a random effect specification; state dependence (lagged work status, lags of past caregiving in the propensity to work eqn) but note current caregiving is not in the eqn for propensity to work
Johnson and Lo Sasso (2000) US
Longitudinal (two periods only) No No Yes
Simultaneous equations model of annual hours of paid work and any informal care provision. Individual unobserved heterogeneity in the caregiving and labor supply equations incorporated via random effects. The informal care equation also includes several variables which are excluded from the labor supply equation including the age of the older parent, indicator for parent needs personal care assistance, indicator for parent cannot be left alone, indicator for mother alive, indicator for parents are married, indicator for parent owns a home, indicator for finances of parent are better than respondent's, indicator for finances of parent are worse than respondent's. Time-invariant individual effects can be correlated with one another across equations.
Moscarola (2010) Netherlands Longitudinal No No Women only
LFP and CG equations are estimated jointly with a dynamic binary probit model. State dependence and cross-state dependence are incorporated via lagged work and CG decisions in both eqns. Unobserved heterogeneity introduced via random effects in both eqns which are allowed to be correlated across eqns. Current CG is NOT in current work eqn and current work NOT in current CG eqn.
Spiess, Schneider (2003) Europe
2 survey year panel
Indicators for increase, decrease, and stable care hours are included No Women only
OLS regressions but with a simplified version of a difference-in-difference approach where changes in work hours between 1996 and 1994 are regressed on changes in care status/intensity and other control variables measured at 1994.
Viitanen (2005) Europe Both No No Women only
Dynamic random effects probit models controlling for lagged work (state dependence) and a pooled estimator are estimated.
36
Appendix Table 2 (cont). Studies using longitudinal data that either test for endogeneity of informal care and work or use longitudinal methods to control for unobserved heterogeneity.
Paper Results: Extensive Margin? Results: Intensive Margin?
Heitmueller, Michaud, and Nazarov (2010)
Current coresidential caregiving, but not non-coresidential caregiving, is significantly negatively associated with future employment. After one year of CG, average employment probabilities go down by 4.8% for coresidential caregivers and less than 1.6% for non-coresidential caregivers. Within 3 years of the caregiving decision, the change is mostly eliminated. Conclusions are largely unchanged in the sensitivity analysis where people are only defined as caregivers if they care 10+ hours per week (in the baseline model caregivers provided at least 5+ hours per week).
Johnson and Lo Sasso (2000)
Providing at least 100 hours of time assistance to parents in past 12 months reduces annual labor supply for women by 459 hours and 462 hours for men.
Moscarola (2010)
Caring in the previous period reduces the probability of working by 5.8%. Note, they conclude "no significant impediment seems to hinder the contemporaneous practice of work activities and care" based on the finding that there is no significant correlation between the time variant error terms of the eqns.
Spiess, Schneider (2003)
Result that terminating care is insignificantly related to change in work hours suggests reductions in work hours or exits from the labor force are not likely to be recovered after caregiving stops.
Starting care and increasing care are negatively correlated with a change in work hours. Terminating care, reducing care effort, or maintaining the same care intensity are insignificantly related to change in work hours.
Viitanen (2005)
Caregiving only has a negative impact on the probability of being employed in the case of Germany. However, when using only specific subgroups of women, there are significant negative effects of caregiving in several countries among middle-aged women (Belgium, Finland and Germany) and among single women (Greece, The Netherlands, Italy and Germany).
37
Appendix Table 3. IV FE Specification Tests Results for Women Instrumenting for beginning caregiving, continuing caregiving and ending female LFP linear probability model with FE.
caregiving for
Instruments F-Stat Range
Partial R-Squared Range
Reject Exogeneity?
Indicator for Parent or In-law Has ADL Needs, Indicator for Parent or In-law Cannot be Left Alone, Separate Indicators for Mother, Father, Mother-in-law, and Father-in-law Died, Separate Indicators for Mother Became Widowed and Mother-in-law Became Widowed
22.53 – 59.64
0.0170 – 0.0514 No
Separate Indicators for Mother, Father, Mother-in-law, and Father-in-law Died, Separate Indicators for Mother Became Widowed and Mother-in-law Became Widowed
28.13 – 68.83
0.0157 – 0.510 No
Indicator for Parent or In-law Has ADL Needs, Indicator for Parent or Inlaw Cannot be Left Alone, Separate Indicators for Mother, Father, Mother-in-law, and Father-in-law Died, Indicator for a Parent or In-law Became Widowed
24.64 – 68.03
0.0160 – 0.0513 No
Separate Indicators for Mother, Father, Mother-in-law, and Father-in-law Died, Indicator for a Parent or In-law Became Widowed
32.19 – 82.49
0.0146 – 0.0509 No
Note: Similar results for men and exogeneity are not rejected in any specification. Joint F tests were run on each of the three potentially endogenous caregiving measures, initial, continuing, and recently ended caregiving. Results are very similar for the labor force participation equation with any caregiving. The instruments perform least well for the wage equations when stage of caregiving is used (sometimes dipping below a joint-F statistic of 10), but in no case is exogeneity rejected in the specifications where they are jointly strong. First stage models also controlled for: Age, age squared, achieving the Social Security early entitlement age (62) or full retirement age, discrete variables for self-reported health, home ownership, years of work experience, logged spousal earnings, indicator for one’s spouse having no earnings, household size, indicator for having a child under the age of 18 in the home, household asset quartiles, wave dummies.
38
References:
Amirkhanyan, A. A. and D. A. Wolf (2006). "Parent care and the stress process: findings from panel data." J Gerontol B Psychol Sci Soc Sci 61(5): S248-55.
Berecki-Gisolf, J., J. Lucke, R. Hockey and A. Dobson (2008). "Transitions into informal caregiving and out of paid employment of women in their 50s." Soc Sci Med 67(1): 122-7.
Bolin, K., B. Lindgren and P. Lundborg (2008). "Your next of kin or your own career? Caring and working among the 50+ of Europe." Journal of Health Economics 27(3): 718-38.
Carmichael, F. and S. Charles (2003). "The opportunity costs of informal care: does gender matter?" Journal of Health Economics 22(5): 781-803.
Casado-Marin, D, P Garcia-Gomez and A Lopez-Nicolas (2010). "Informal care and labour force participation among middle-aged women in Spain." Journal of the Spanish Economic Association
Coe, N. B. and C. H. Van Houtven (2009). "Caring for mom and neglecting yourself? The health effects of caring for an elderly parent." Health Econ 18(9): 991-1010.
Crespo, L (2006). Parental caregiving and work employment status of mid-life European women, Departamento de Fundamentos del Análisis Económico, University of Alicante, Campus San Vicente del Raspeig, 03080 Alicante, Spain.
Do, Young Kyung, EC Norton and SC Stearns (2008). The Effect of Informal Caregiving on Labor Market Outcomes in South Korea: 1-24.
Duan, N. (1983). "Smearing estimate: a nonparametric retransformation method." Journal of the American Statistical Association 78: 605-610.
Ettner, S. L. (1995). "The impact of "parent care" on female labor supply decisions." Demography 32(1): 63-80.
Heitmueller, A (2007). "The chicken or the egg? Endogeneity in labour market participation of informal carers in England." Journal of Health Economics 26: 536-559.
Heitmueller, A, PC Michaud and Nazarov (2010). "A dynamic analysis of informal care and employment in England." Labour 17(3): 455-465.
Heitmueller, A. and K. Inglis (2007). "The earnings of informal carers: Wage differentials and opportunity costs." Journal of Health Economics 26(4): 821-41.
Heitmuller, A (2007). "The chicken or the egg? Endogeneity in labour market participation of informal carers in England." Journal of Health Economics 26: 536-559.
Johnson, RW and AT Lo Sasso (2006). "The Impact of Elder Care on Women's Labor. Supply at Midlife." Inquiry 43(3): 195-210.
O'Hara, B (2004). "Do Mothers Work to Support Ailing Husbands?" Journal of Family and Economic Issues 25(2): 179-198.
Parker, G (1990). With Due Care and Attention: A Review of Research on Informal Care. . London, Family Policy Studies Centre.
Pavalko, E. K. and J. E. Artis (1997). "Women's caregiving and paid work: causal relationships in late midlife." Journals of Gerontology, Series B, Psychological Sciences and Social Sciences 52(4): S170-9.
39
Pavalko, E. K. and K. A. Henderson (2006). "Combining Care Work and Paid Work : Do Workplace Policies Make a Difference?" Research on Aging 28(3): 359-374.
Spiess, C K and A.U Schneider (2004). "The effects of informal care on paid-work participation in Great Britain: a lifecourse perspective." Ageing and Society 24: 851-880.
Spiess, K and K Schneider (2003). "Interactions between care-giving and paid work hours among European midlife women, 1994 to 1996." Ageing & Society 23: 41-68.
Staiger, D. and J.H. Stock (1997). "Instrumental variables regression with weak instruments." Econometrica 65(3): 557-586.
Stone, Robyn, Gail Lee Cafferata and Judith Sangl (1987). "Caregivers of the Frail Elderly: A National Profile." The Gerontologist 27(5): 616-626.
Stone, Robyn and P.F. Short (1990). "The competing demands of employment and informal caregiving to disabled elders." Medical Care 28(6): 513-526.
Wakabayashi, C. and K. M. Donato (2006). "Does caregiving increase poverty among women in later life? Evidence from the Health and Retirement survey." J Health Soc Behav 47(3): 258-74.
Wilson, MR, CH Van Houtven, SC Stearns and EC Clipp (2007). "Depression and Missed Work Among Caregivers." Journal of Family and Economic Issues 28(4): 684-698.
Wolf, D and B Soldo (1994). "Married Women's Allocation of Time to Employment and Parental Care." Journal of Human Resources 29(4): 1259-1276.
RECENT WORKING PAPERS FROM THE CENTER FOR RETIREMENT RESEARCH AT BOSTON COLLEGE
Recessions, Wealth Destruction, and the Timing of Retirement Barry P. Bosworth and Gary Burtless, December 2010 Measuring the Spillover to Disability Insurance Due to the Rise in the Full Retirement Age Norma B. Coe and Kelly Haverstick, December 2010 Is the Reduction in Older Workers' Job Tenure a Cause for Concern? Steven A. Sass and Anthony Webb, December 2010 Accounting for Disability Insurance in the Dynamic Relationship Between Disability Onset and Earnings Perry Singleton, November 2010 The Treatment of Married Women by the Social Security Retirement Program Andrew G. Biggs, Gayle L. Reznik, and Nada O. Eissa, November 2010 What is the Impact of Foreclosures on Retirement Security? Irena Dushi, Leora Friedberg, and Anthony Webb, November 2010 Children and Household Utility: Evidence from Kids Flying the Coop Norma B. Coe and Anthony Webb, November 2010 Overview of the CRR 2009 Retirement Survey Alicia H. Munnell, Norma B. Coe, Kelly Haverstick, and Steven A. Sass, October 2010 State Wage-Payment Laws, the Pension Protection Act of 2006, and 401(k) Saving Behavior Gary V. Englehardt, October 2010 Asset Cycles and the Retirement Decisions of Older Workers Jan Ondrich, October 2010 Price Deflators, the Trust Fund Forecast, and Social Security Solvency Barry Bosworth, October 2010 The Impact of a DROP Program on the Age of Retirement and Employer Pension Costs Samson Alva, Norma B. Coe, and Anthony Webb, September 2010 Housing Consumption in Late Life: The Role of Income, Health Shocks, and Marital Shocks Douglas A. Wolf and Janet M. Wilmoth, September 2010
All working papers are available on the Center for Retirement Research website (http://crr.bc.edu) and can be requested by e-mail ([email protected]) or phone (617-552-1762).