Effect of Isolated Micron-Sized Roughnesson Transition in Swept-Wing Flows
Ronald H. Radeztsky Jr.,* Mark S. Reibert,f and William S. Saric*Arizona State University, Tempe, Arizona 85287-6106
Boundary-layer transition-to-turbulence studies are conducted in the Arizona State University Unsteady WindTunnel on a 45-deg swept airfoil. The pressure gradient is designed so that the initial stability characteristicsare purely crossflow dominated. Flow-visualization and hot-wire measurements show that the development ofthe crossflow vortices is influenced by roughness near the attachment line. Comparisons of transition locationare made between a painted surface (distributed 9-/xm peaks and valleys on the surface), a machine-polished sur-face (0.5-/xm rms finish), and a hand-polished surface (0.25-/im rms finish). Then isolated 6-/im roughness elementsare placed near the attachment line on the airfoil surface under conditions of the final polish (0.25-/zm rms). Theseelements create an enhanced packet of stationary crossflow waves, which results in localized early transition. Thediameter, height, and location of these roughness elements are varied in a systematic manner. Spanwise hot-wiremeasurements are taken behind the roughness element to document the enhanced vortices. These scans are made atseveral different chord locations to examine vortex growth.
Nomenclaturec = chordD = diameter of roughnessk = height of roughnessN = linear stability amplification factor, L(uf/uf
Q)Rec = chord Reynolds numberRek = roughness Reynolds numberx = distance along chord, mjctr/c = transition locationy = wall-normal coordinate, mz = distance along span, ma = angle of attackA = stationary crossflow vortex wavelength along spanAct = stationary crossflow vortex wavelengthCD = traveling-wave frequency
I. Introduction
T HE present investigation is a continuation of previous effortsto determine the fundamental nature of the crossflow instabil-
ity that is characteristic of the breakdown to turbulence in three-dimensional boundary layers that are found in swept-wing flows.Reviews of the current literature and problems are given by Reedand Saric1 and Reed et al.2
This experiment uses the NLF(2)-0415 airfoil3 as the basic testconfiguration. The model has a pressure minimum on the uppersurface at approximately jc/c = 0.71 (see Fig. 1) and, thus, is anideal crossflow generator when swept. Specially designed wall lin-ers within the wind-tunnel nozzle and test section produce an infiniteswept-wing flow with no spanwise gradients.4 Standard boundary-layer codes5 are used for this configuration. The pressure fields andundisturbed boundary-layer profiles have been thoroughly docu-mented and are in agreement with the calculations.4'6
With a 45-deg sweep and a small negative angle of attack, thefavorable pressure gradient produces a boundary-layer flow that is
* Assistant Research Professor, Mechanical and Aerospace Engineering.Member AIAA.
* Faculty Research Associate; currently Senior Software Engineer, Data-soft Corp., 7669 Myrtle Avenue, Tempe, AZ 85284. Member AIAA.
* Professor, Mechanical and Aerospace Engineering. Associate FellowAIAA.
subcritical to Tollmien-Schlichting (T-S) wave formation at moder-ate chord Reynolds numbers, but produces considerable crossflow.This permits the isolated examination of the crossflow stability prob-lem. The instability at a = — 4 deg was analyzed using the MARIAand SALLY stability codes. Although it is recognized that morecomplete codes can be used, e.g., by Reed et al.,2 these were usedprimarily as design codes to produce a general picture of the stabilitybehavior. At a chord Reynolds number of Rec = 3.8 x 10⁶, the max-imum predicted N factor is N — 16.0 for / = 200 Hz. Dagenhart7
indicates that, according to standard N -factor correlation methods,transition may be expected for N factors in the range from 9 to 11.Thus, for sufficiently high Reynolds numbers (less than 3.8 x 10⁶),the transition due to crossflow vortex amplification is expected tooccur well ahead of the pressure minimum at x/c = 0.71. The funda-mental linear stability results for this configuration are complete andinclude the wavelengths, local growth rates, frequencies, and evolu-tion patterns of the crossflow vortices in the linear range.8'10 In thiswork, the frequencies of the crossflow instability are observed to es-tablish the existence of the theoretically predicted moving crossflowvortices in addition to stationary crossflow vortices.
Whereas linear stability theory predicts that the traveling cross-flow waves are more amplified than the stationary crossflow waves,many experiments observe stationary waves. The answer to the ques-tion of whether one observes stationary or traveling crossflow wavesis cast inside the receptivity problem. One of the key missing ingre-dients in many three-dimensional boundary-layer experiments is theunderstanding of receptivity and initial conditions. Here, receptivityrefers to the mechanisms that cause environmental disturbances toenter the boundary layer and cause unstable waves.' * Receptivity hasmany different paths through which to introduce a disturbance intothe boundary layer. They include the interaction of freestream tur-bulence and sound with model vibrations, leading-edge curvature,discontinuities in surface curvature, or surface roughness. Any oneor a combination of these may lead to unstable waves in the bound-ary layer. If the initial amplitudes of the disturbances are small,they will tend to excite the linear normal modes of the boundarylayer.
The importance of environmental conditions in the crossflowproblem is illustrated by comparing equivalent experiments in dif-ferent facilities. Bippes and Mtiller12 and Bippes13 describe a se-ries of comparative experiments in a low-disturbance tunnel and ahigh-disturbance tunnel. Their results show that traveling crossflowwaves are observed in the high-disturbance tunnel rich in unsteadyfreestream disturbances and that the dominant boundary-layer struc-ture in a low-disturbance tunnel is a stationary crossflow vortex. Be-cause the flight environment is more benign than the wind tunnel,
1370
RADEZTSKY, REIBERT, AND SARIC 1371
-1.00
-0.75
-0.50
-0.25
O 0.00
0.25
0.50
0.75
1.000.0 0.1 0.2 0.3 0.4 0.5 0.6 0.7 0.8 0.9 1.0
Fig. 1 NLF(2)-0415 upper-surface pressure distribution in wind tunnel at a = —4 deg.
one expects the low-disturbance results to be more important. Recentwork by Deyhle et al.14 and Deyhle and Bippes15 confirms these ear-lier results. However, there was no attempt to separate sound levelsfrom turbulence levels within the freestream disturbance environ-ment. In Sec. II.C, we conclude that the Bippes and Muller12 effectis due to turbulence.
The nonlinear processes that control transition are documentedby Kohama et al.16 In this work, the stationary crossflow vortex isshown to be the harbinger of transition by causing a high-frequencysecondary instability that results from distortions in the steadyboundary-layer flow. Thus, crossflow transition in a low-disturbanceenvironment is determined by the characteristics of the stationarywave.
The receptivity problem for stationary waves is dominated bysmall-scale surface roughness rather than turbulence. This is sug-gested by Dagenhart,4 who observed that transition patterns due tostationary crossflow waves on the NLF(2)-0415 airfoil remainedfixed throughout many test entries, even with changes in theturbulence-treatment section of the wind tunnel. This is also consis-tent with the observation of Bippes and Muller12 that the stationarycrossflow transition pattern remains fixed relative to their flat-platemodel when the model is translated laterally in the test section. Thus,the present work concentrates on the role of surface roughness ininfluencing swept-wing transition.
II. ResultsA. Distributed Micron-Sized Roughness Due to Surface Finish
The transition measurements in this part of the study are ob-tained from naphthalene flow visualization. This technique relieson the sublimation patterns of the naphthalene to identify the sta-tionary crossflow structure and the location of transition. The naph-thalene technique was calibrated in previous experiments by the useof surface-mounted hot films, hot wires, and liquid crystals4'9'17
and has been shown to provide very reliable measurements of tran-sition for the stationary patterns studied here. Surface roughnessmeasurements were done by taking castings of the surface with adental pattern resin that created a rigid sample suitable for pro-filometer measurements. The accuracy of the casting method wascalibrated by making castings of submicrometer reference grooveson a steel block. Although the casting method is locally accurate tobetter than 0.1 /xm, the larger scales, including those of interest forcrossflow, are dominated by warping of the sample. Thus, the dis-tributed roughness amplitudes presented here serve to compare thecharacter of various model surfaces, but the samples are not suitablefor spectral analysis at the crossflow wavelengths.
Figure 2 shows the surface characteristics of the original paintedmodel. This surface was used for all of the previous exper-iments.4'8"10'16 The peak-to-peak roughness in this case is around8-10 /xm. For the present experiment, the paint was removed, andthe surface was sanded and machine polished to the level of Fig. 3.Here the surface finish is 0.5 /^m rms. The model was then subjectedto a systematic hand polish, and the surface finish was reduced to0.1 /xm rms in the midchord region and 0.25 /xm rms near the at-tachment line as shown in Fig. 4.
Transition measurements were conducted at a number of differ-ent chord Reynolds numbers Rec, under the conditions of the differ-ent surface finishes just described. With random distributed surfaceroughness, the transition front is a fixed, jagged pattern of mergingturbulent wedges beginning in areas where the stationary crossflowwaves have produced strongly inflected mean profiles as describedby Kohama et al.16 The earliest transition wedges, i.e., those begin-ning at the lowest x/c, are correlated in the spanwise position withdistinct imperfections in the paint finish near the attachment line.Thus, the initiation of transition due to stationary crossflow is a localevent and is not described by a single x/c for the entire model, eventhough the transition location at any particular spanwise location isvery well defined and repeatable. Following Dagenhart,4 the aver-age transition location x^/c is defined as the spanwise average of
1372 RADEZTSKY, REIBERT, AND SARIC
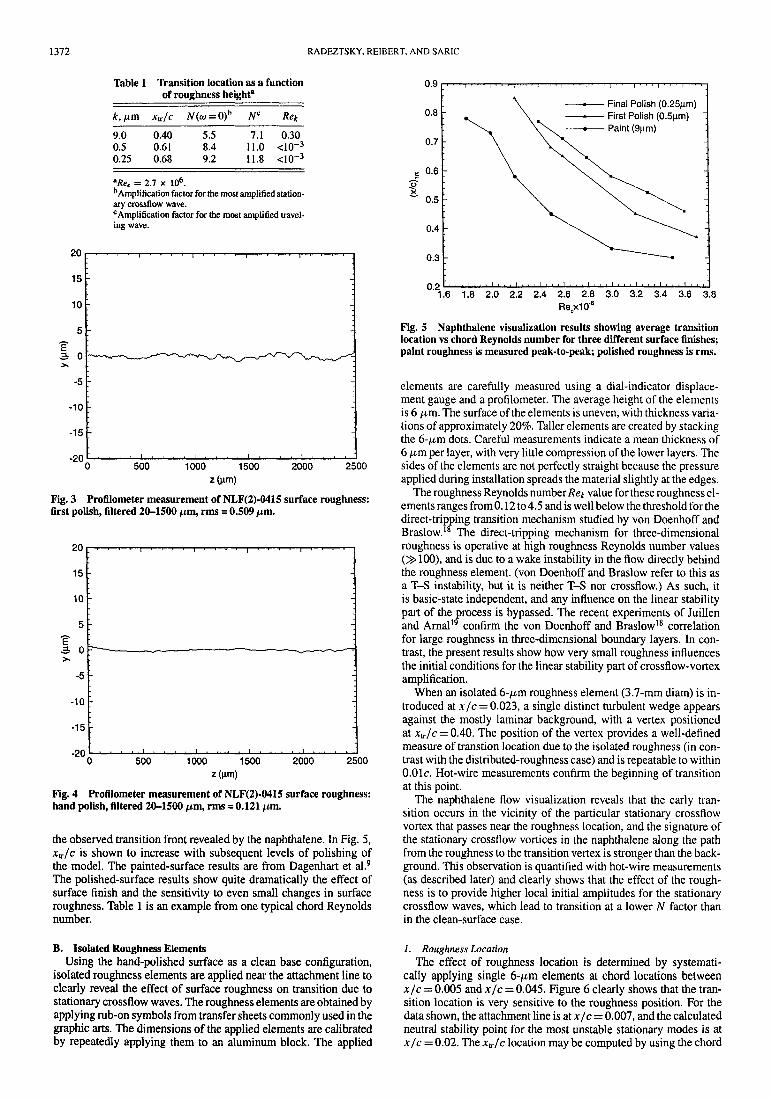
Table 1 Transition location as a functionof roughness height3
*J Nc Rek9.00.50.25
0.400.610.68
5.58.49.2
7.111.011.8
0.30<10~3
<10~3
*Rec = 2.7 x 106.b Amplification factor for the most amplified station-ary crossflow wave.c Amplification factor for the most amplified travel-ing wave.
E
20
15
10
5
0
-5
-10
-15
-20500 1000 1500 2000 2500
Fig. 3 Profilometer measurement of NLF(2)-0415 surface roughness:first polish, filtered 20-1500 pirn, rms = 0.509 m.
the observed transition front revealed by the naphthalene. In Fig. 5,jCtr/c is shown to increase with subsequent levels of polishing ofthe model. The painted-surface results are from Dagenhart et al.9The polished-surface results show quite dramatically the effect ofsurface finish and the sensitivity to even small changes in surfaceroughness. Table 1 is an example from one typical chord Reynoldsnumber.
Final Polish (0.25|im) :First Polish (0.5M.m)Paint (9jam)
Fig. 5 Naphthalene visualization results showing average transitionlocation vs chord Reynolds number for three different surface finishes;paint roughness is measured peak-to-peak; polished roughness is rms.
elements are carefully measured using a dial-indicator displace-ment gauge and a profilometer. The average height of the elementsis 6 /im. The surface of the elements is uneven, with thickness varia-tions of approximately 20%. Taller elements are created by stackingthe 6-/im dots. Careful measurements indicate a mean thickness of6 /im per layer, with very little compression of the lower layers. Thesides of the elements are not perfectly straight because the pressureapplied during installation spreads the material slightly at the edges.
The roughness Reynolds number/te* value for these roughness el-ements ranges from 0.12 to 4.5 and is well below the threshold for thedirect-tripping transition mechanism studied by von Doenhoff andBraslow.18 The direct-tripping mechanism for three-dimensionalroughness is operative at high roughness Reynolds number valuesO100), and is due to a wake instability in the flow directly behindthe roughness element, (von Doenhoff and Braslow refer to this asa T-S instability, but it is neither T-S nor crossflow.) As such, itis basic-state independent, and any influence on the linear stabilitypart of the process is bypassed. The recent experiments of Juillenand Arnal19 confirm the von Doenhoff and Braslow18 correlationfor large roughness in three-dimensional boundary layers. In con-trast, the present results show how very small roughness influencesthe initial conditions for the linear stability part of crossflow-vortexamplification.
When an isolated 6-/xm roughness element (3.7-mm diam) is in-troduced at x/c = 0.023, a single distinct turbulent wedge appearsagainst the mostly laminar background, with a vertex positionedat /c = 0.40. The position of the vertex provides a well-definedmeasure of transtion location due to the isolated roughness (in con-trast with the distributed-roughness case) and is repeatable to withinO.Olc. Hot-wire measurements confirm the beginning of transitionat this point.
The naphthalene flow visualization reveals that the early tran-sition occurs in the vicinity of the particular stationary crossflowvortex that passes near the roughness location, and the signature ofthe stationary crossflow vortices in the naphthalene along the pathfrom the roughness to the transition vertex is stronger than the back-ground. This observation is quantified with hot-wire measurements(as described later) and clearly shows that the effect of the rough-ness is to provide higher local initial amplitudes for the stationarycrossflow waves, which lead to transition at a lower N factor thanin the clean-surface case.
B. Isolated Roughness ElementsUsing the hand-polished surface as a clean base configuration,
isolated roughness elements are applied near the attachment line toclearly reveal the effect of surface roughness on transition due tostationary crossflow waves. The roughness elements are obtained byapplying rub-on symbols from transfer sheets commonly used in thegraphic arts. The dimensions of the applied elements are calibratedby repeatedly applying them to an aluminum block. The applied
1. Roughness LocationThe effect of roughness location is determined by systemati-
cally applying single 6-/im elements at chord locations betweenx/c = 0.005 and x/c = 0.045. Figure 6 clearly shows that the tran-sition location is very sensitive to the roughness position. For thedata shown, the attachment line is at x/c = 0.007, and the calculatedneutral stability point for the most unstable stationary modes is atx/c = 0.02. The x^/c location may be computed by using the chord
RADEZTSKY, REIBERT, AND SARIC 1373
2.00
1.90
1.80
1.70
1.60
\ 1'50oT 1.40
DC1.30
1.20
1.10
1.000.900.80
Rec = 3.4x10Rec = 3.0x10⁶
Re =2.6x10⁶
2.00
0.0 0.5 1.0 1.5 2.0 2.5 3.0XR(%c)
3.5 4.0 4.5 5.0
Fig. 6 Variation of transition Reynolds number with roughness x/c atthree chord Reynolds numbers; single roughness element is used withD = 3.7 mm, k = 6 /xm.
Fig. 7 Transition location as a function of roughness height and diam-eter; single roughness element is at x/c = 0.023; Rec = 2.6 x 10⁶.
Reynolds number values given in Fig. 6. When the roughness islocated upstream of the neutral stability point, the crossflow modesinfluenced by the roughness will initially decay, so that the influenceof the roughness is minimized. For roughness too far downstream ofthe neutral point, the influence is also minimized, with roughness be-yond x/c = 0.04 having no effect on the transition location at leastfor Rek <4.5. When the roughness is located outside of the nar-row band around the neutral stability point, the transition Reynoldsnumber returns to the no-roughness value. This result justifies aposteriori the use of naphthalene in the midchord region.
2. Roughness SizeTo more fully characterize the effect of isolated roughness near
the attachment line, a variety of roughness sizes were introduced atx/c = 0.023. Roughness diameters D ranged from 0.3 to 3.7 mm,which corresponds to 0.08 to 0.5 times the dominant stationarycrossflow vortex wavelength Xcf. Heights varied between 6 and36 /im. The roughness Reynolds number Re^ based on roughnessheight and local velocity ranged from 0.12 to 4.5. Flow-visualizationmeasurements reveal a strong dependence of transition-wedge lo-cation on both the roughness height and the roughness diameter,as shown in Fig. 7. The transition location moves forward for thelarger diameters and heights and moves downstream as the rough-ness height or diameter is reduced. Figure 7 also shows that forthe smallest roughness diameter tested, the transition wedge has re-treated to the x/c = 0.71 location and has merged into the naturalbackground transition front associated with the clean baseline sur-face. Even if the roughness height is tripled to 18 /zm, the transition
1.90 -
1.80 r
1.70 \
1.60
1.50
1.40
1.30
1.20
1.10
1.00
0.90
0.80
Rec = 3.4x10⁶
Rec = 3.0x10⁶
Re =2.6x10⁶
0.00 0.10 0.20 0.30 0.40 0.50 0.60
Fig. 8 Variation of transition Reynolds number with roughness diame-ter at three chord Reynolds numbers; roughness is located at x/c = 0.023.
wedge does not reappear, indicating that any effect of the small-diameter roughness on the stationary crossflow is very weak andhas dropped below the background level of the experiment.
The effect of roughness diameter on transition is directly relatedto the Fourier spectrum of the roughness element and its relation tothe dominant stationary crossflow wavelengths. Although the anal-ysis is more complicated for the continuous spectrum of an isolatedthree-dimensional element than for the discrete spectrum of a uni-form spanwise roughness distribution, the result is similar. As theroughness diameter decreases, the coupling between the roughnessspectrum and the dominant crossflow modes decreases rapidly. Thiseffect was investigated by Choudhari,20 who obtained results thatare consistent with the present observations.
The effect of roughness diameter on the transition location wasstudied at three different unit Reynolds numbers. The results areshown in Fig. 8, which shows transition Reynolds number vs rough-ness diameter. The xtr/c location may be obtained by scaling tran-sition Reynolds number by chord Reynolds number. Again, as theroughness diameter becomes small, the transition location returns tothe no-roughness location because the effect of the roughness dropsbelow the background. In Fig. 8, it is clear that the dependence oftransition on chord Reynolds number is not really a unit Reynoldsnumber effect but instead is a roughness Reynolds number effect.
These measurements illustrate the importance of both the rough-ness height, as measured by roughness Reynolds number, and ofspanwise scale, vis a vis with A.ef, in assessing the role of surfaceroughness. Note that these conclusions are for Rek < 4.5. Obviously,very large roughness heights, even with small diameters (like paintspecks), could cause early transition through the direct-trippingmechanism discussed earlier.
3. Two-Dimensional RoughnessWhen a long (100 mm) spanwise strip of 6-/urn roughness is
applied at x/c = 0.023, early transition wedges appear downstreamonly on the stationary vortices that originate near the ends of theroughness strip. This shows that the roughness has a strong effecton the stationary crossflow only in those regions where the localspectrum of the roughness contains the appropriate scales. The wakebehind the center regions of the strip is stable and has no measurableinfluence on the transition location.
C. Insensitivity to Freestream SoundSound, along with two- and three-dimensional roughness (fol-
lowing Saric et al.21 for two-dimensional boundary layers), has noobservable effects on transition. Sound pressure levels of up to95 dB were introduced at all important frequencies, e.g., the fre-quency of the maximum amplified traveling crossflow wave, thefrequency of a destabilized T-S wave, the frequency of the sec-ondary instability, as well as broad-band sound, with negative resultsin each case. This further substantiates the important role of the sta-tionary crossflow wave in causing transition in this flow condition.
1374 RADEZTSKY, REIBERT, AND SARIC
1.00
0.75
0.50 -
0.25
0.00100
Fig. 9 Spanwise hot-wire scans at x/c = 0.35; constantly scans at u/Ue = 0.25,0.50, and 0.75; single roughness element with D = 3.7 mm, k = 6 /xm isat x/c = 0.023; Rec = 2.6 x 10⁶.
x/c
z(mm)
Fig. 10 Spanwise hot-wire scans showing streamwise vortex growth; constantly scans at ulUe = 0.50; single roughness element with D -k = 6 /-im is at x/c = 0.023; Rec = 2.6 X 10⁶.
3.7 mm,
Moreover, it suggests that the Bippes and Miiller12 results are dueto turbulence.
D. Hot-Wire MeasurementsDetailed hot-wire measurements are made downstream of the iso-
lated 6-n,m roughness element to quantify further the behavior of theroughness-induced vortices. Because the stationary vortices are veryweak, a direct measurement of the v' and w' velocities is impossible.However, when acting over large distances, these weak vortices pro-duce strong distortions (10-50%) in the streamwise velocity profile,and this can be easily measured. The qualitative description of thisfollows Kohama et al.16 In regions of v' > 0, low momentum fluidnear the wall is entrained into the upper regions of the boundarylayer. In regions of v' < 0, high momentum fluid is driven down-ward. Thus, very small v1 can produce O(l) changes in the meanstreamwise velocity. This behavior is responsible for the spanwiseperiodic streaks in the naphthalene and for the secondary instabilityleading to transition.16
Four different chord locations and three different heights in theboundary layer are chosen for hot-wire scans. These sensitive (andtedious) measurements require very long run times. The ArizonaState University Unsteady Wind Tunnel does not have an activecooling system, and so hot-wire temperature drift could be a po-tential problem. However, this is obviated by applying a software
temperature-compensation technique22 during the test runs and alsoduring calibration of the wires.
Figure 9 shows the results at x/c = 0.35 and also shows a mod-ulation in the streamwise velocity over the entire scan and a strongmodulation in the region influenced by the roughness element. Trac-ing the streamline downstream from the roughness element wouldlocate it at z = 25 mm in Fig. 9. The disturbances take the form ofa wave packet that is confined to a region of roughly z = 0-50 mmin the scan. The remaining portion of the scan shows a lower levelmodulation caused by the background crossflow level along withany noise in the measurement process. The strongest gradients inu' occur well up in the boundary layer, as documented by Kohamaetal.16
The streamwise growth of the vortices can be seen in Fig. 10,which shows a three-dimensional representation of the hot-wiredata taken at u/ Ue — 0.5. The scans have been aligned so that thestreamline of the roughness element is centered at z = 25 mm. Atx/c = 0.25, the streamwise velocity distortions are already sizableand the enhanced vortices behind the roughness can already beseen near z = 25 mm. The distortions grow dramatically back tox/c = 0.40, which is near the start of the transition wedge. One alsosees a spreading of the wave packet as it grows and travels down-stream. This is due to a slight difference in the propagation directionof the spectral components of the wave packet.23
RADEZTSKY, REIBERT, AND SARIC 1375
0.50
0.40 -
0.30 -
0.20 -
0.10 -
0.00
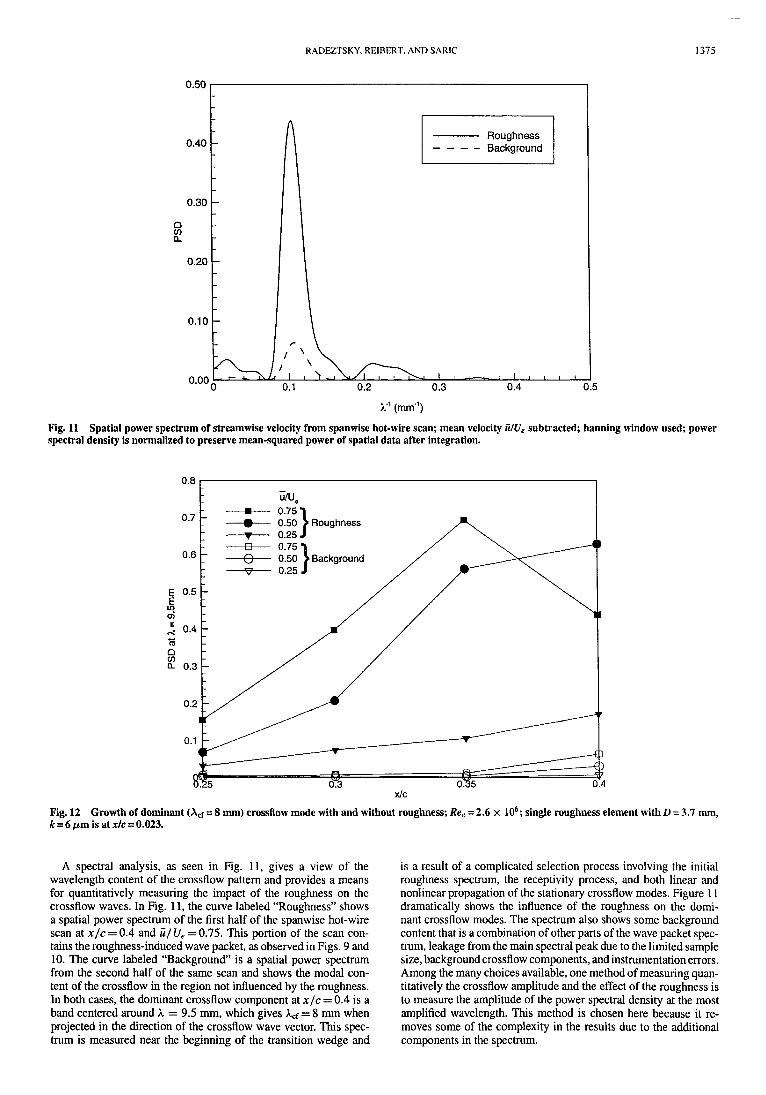
Fig. 11 Spatial power spectrum of streamwise velocity from spanwise hot-wire scan; mean velocity UIUe subtracted; banning window used; powerspectral density is normalized to preserve mean-squared power of spatial data after integration.
Fig. 12 Growth of dominant (Acf = 8 mm) crossflow mode with and without roughness; Rec = 2.6 x 10⁶; single roughness element with D = 3.7 mm,
A spectral analysis, as seen in Fig. 11, gives a view of thewavelength content of the crossflow pattern and provides a meansfor quantitatively measuring the impact of the roughness on thecrossflow waves. In Fig. 11, the curve labeled "Roughness" showsa spatial power spectrum of the first half of the spanwise hot-wirescan at x/c = 0.4 and «/ Ue = 0.75. This portion of the scan con-tains the roughness-induced wave packet, as observed in Figs. 9 and10. The curve labeled "Background" is a spatial power spectrumfrom the second half of the same scan and shows the modal con-tent of the crossflow in the region not influenced by the roughness.In both cases, the dominant crossflow component at x/c = 0.4 is aband centered around A. = 9.5 mm, which gives Xcf = 8 mm whenprojected in the direction of the crossflow wave vector. This spec-trum is measured near the beginning of the transition wedge and
is a result of a complicated selection process involving the initialroughness spectrum, the receptivity process, and both linear andnonlinear propagation of the stationary crossflow modes. Figure 11dramatically shows the influence of the roughness on the domi-nant crossflow modes. The spectrum also shows some backgroundcontent that is a combination of other parts of the wave packet spec-trum, leakage from the main spectral peak due to the limited samplesize, background crossflow components, and instrumentation errors.Among the many choices available, one method of measuring quan-titatively the crossflow amplitude and the effect of the roughness isto measure the amplitude of the power spectral density at the mostamplified wavelength. This method is chosen here because it re-moves some of the complexity in the results due to the additionalcomponents in the spectrum.
1376 RADEZTSKY, REIBERT, AND SARIC
Z 2 -
diameterFig. 13 Magnitude of dominant (Acf = 8 mm) crossflow mode with varying roughness diameter; Rec = 2.6 x 10⁶; single roughness element withk = 6 /xm is at x/c = 0.023.
Figure 12 shows a result of the discribed spectral amplitude mea-surement at XCf = 8 mm for the four chord positions and three meanboundary-layer positions measured in the test. The data at all posi-tions clearly show the impact of the roughness on the system by pro-viding higher initial amplitudes for the dominant crossflow modes,which leads to high amplitudes at earlier x/c than for the backgroundcase. At x/c = 0.4 (just before transition), the nonlinear saturationhas caused a change in the profile of the dominant mode. Note that inthe background scans, the amplitudes of the dominant mode are farbelow the transitional amplitudes of the roughness-produced wavepacket, which is consistent with the much higher jctr/c without theroughness.
The degree of crossflow enhancement increases dramatically withthe roughness diameter as indicated in Fig. 13. This is consistentwith the variation of transition location with roughness size andemphasizes the point that crossflow transition N factors are tieddirectly to the initial conditions provided by the surface-roughnessspectrum at the attachment line.
III. ConclusionsA. Specific Conclusions from Present Results
We have shown that micrometer-sized roughness can strongly in-fluence crossflow-dominated transition, and the effect of roughnessheight and roughness diameter is quantified for the circular rough-ness shapes tested here. This effect is confined to roughness nearthe attachment line and is tied directly to the coupling of the initialroughness spectrum with the dominant crossflow modes throughthe receptivity process. The stationary crossflow modes do not ap-pear to be influenced by acoustic disturbances, in contrast with T-Swaves.
B. General Conclusions on Crossflow-Dominated TransitionThe a = —4 deg condition of the present experiment is completely
subcritical to T-S wave growth. The growth is stretched to 71%chord (the pressure minimum) so that the boundary-layer thicknessis large (3 mm). On an actual flight airfoil, the pressure minimumwould, of course, be forward of this. However, the basic idea hasalways been that the effects of both Reynolds number and fetch areincluded in the N factor. Thus, we can compare transition at 40%chord in these experiments with, for example, 15% chord in flightbecause the N factors would be the same. Therefore, the final inter-pretation of our data should be in terms of the change in N and notin the change in location. The utility of these experiments is that wecan measure sensitive phenomena in a quantitative way and be able
to see the difference between 0.25- and 0.5-/xm roughness. At thesame time, of course, we can see that the 6-/xm roughness changes Nby 3.
We have shown before that, when transition is crossflow dom-inated in a low-disturbance environment, the stationary crossflowwave is the dominant instability that causes transition even thoughtheory may predict that traveling crossflow waves are moreamplified.16 The role of three-dimensional roughness is to providea source of streamwise vorticity that influences the initial ampli-tude of the stationary wave. We have found that the low-amplituderoughness (6 pm) influences transition until the roughness diame-ter is a small fraction of the crossflow wavelength (see Figs. 7 and8). This is consistent with our conjecture that the relation of theroughness parameters (and the resulting spectrum of the roughness)to the wavelengths of the dominant stationary crossflow modes isof primary importance in determining the transition behavior. If theroughness diameter exceeds 0.08Xcf, we can see the change in tran-sition location regardless of roughness height. An increase in heightdecreases N.
We can conclude the following. In a low-disturbance environ-ment, stationary crossflow vortices dominate transition via a high-frequency secondary instability.16 The initial conditions (recep-tivity) are determined by surface roughness; hence, roughnessinfluences transition N factors. Isolated roughness influences tran-sition until the diameter is much less than the crossflow wavelength.Roughness Reynolds numbers Re^ in the range of 1-4 can change Nby 3. Distributed roughness (random) appears to have the dangerousscales that effect transition. In a high-turbulence environment, trav-eling crossflow waves dominate transition,12'13 and the saw-toothedpattern of transition is not strong. One may conjecture that rough-ness is not as important in this case.
AcknowledgmentsThe experimental work was supported by NASA Langley Re-
search Center Grant NAG 1-937. R. H. Radeztsky was supportedby NASA Langley Research Center Fellowship NAG1-1111, andM. S. Reibert was supported by the Office of Naval Research Fel-lowship Program. The authors would like to thank Shohei Takagifor his contributions to the preliminary phase of this work. The in-valuable help of D. Clevenger, who polished the model and preparedthe roughness samples, and D. J. Orr, who measured and analyzedthe roughness samples, is gratefully acknowledged. Thomas Corkesuggested the use of dental acrylics.
RADEZTSKY, REIBERT, AND SARIC 1377
Referencesd, H. L., and Saric, W. S., "Stability of Three-Dimensional Bounda-
ry Layers," Annual Review of Fluid Mechanics, Vol. 21,1989, pp. 235-284.2Reed, H. L., Saric, W. S., and Arnal, D., "Linear Stability Theory Applied
to Boundary Layers," Annual Review of Fluid Mechanics, Vol. 28, 1996, pp.389-428.
3Somers, D. M., and Horstmann, K. H., "Design of a Medium-SpeedNatural-Laminar-Flow Airfoil for Commuter Aircraft Applications,"DFVLR, Rept. IB/29-85/26, Gottingen, Germany, July 1985.
4Dagenhart, J. R., "Crossflow Disturbance Measurements on a 45 DegreeSwept Wing," Ph.D. Dissertation, Dept. of Engineering Mechanics, VirginiaPolytechnic Inst. and State Univ., Blacksburg, VA, Dec. 1992.
5Kaups, K., and Cebeci, T., "Compressible Laminar Boundary Layerswith Suction on Swept and Tapered Wings," Journal of Aircraft, Vol. 14,No. 7, 1977, pp. 661-667.
6Reibert, M.S., "Nonlinear Stability, Saturation, and Transition in Cross-flow-Dominated Boundary Layers," Ph.D. Dissertation, Dept. of Mechanicaland Aerospace Engineering, Arizona State Univ., Tempe, AZ, May 1996.
7Dagenhart, J. R., "Amplified Crossflow Disturbances in the LaminarBoundary Layer on Swept Wings with Suction," NASA TP-1902, 1981.
8Saric, W. S., Dagenhart, J. R., and Mousseux, M. C., "Experiments inSwept-Wing Transition," Numerical and Physical Aspects of AerodynamicFlows, Vol. 4, edited by T. Cebeci, Springer-Verlag, Berlin, 1990, pp. 359-415.
9Dagenhart, J. R., Saric, W. S., Mousseux, M. C., and Stack, J. P.,"Crossflow-Vortex Instability and Transition on a 45-Degree Swept Wing,"AIAA Paper 89-1892, June 1989.
10Dagenhart, J. R., Saric, W. S., Hoos, J. A., and Mousseux, M. C., "Exper-iments on Swept-Wing Boundary Layers," Laminar-Turbulent Transition,Vol. 3, edited by D. Arnal, Springer-Verlag, Berlin, 1990, pp. 369-380.
1 * Saric, W. S., Reed, H. L., and Kerschen, E. J., "Leading-Edge Receptiv-ity to Sound," AIAA Paper 94-2222, June 1994.
12Bippes, H., and Miiller, B., "Disturbance Growth in an Unstable Three-Dimensional Boundary Layer," Numerical and Physical Aspects of Aerody-namic Flows, Vol. 4, edited by T. Cebeci, Springer-Verlag, Berlin, 1990, pp.345-358.
13Bippes, H., "Experiments on Transition in Three-Dimensional Accel-erated Boundary Layer Flows," Proceedings of the Royal Aeronautical So-ciety: Boundary Layer Transition and Control, edited by M. Caster, RoyalAeronautical Society, Cambridge, England, UK, 1991.
14Deyhle, H., Hohler, G., and Bippes, H., "Experimental Investigationof Instability Wave Propagation in a Three-Dimensional Boundary-LayerFlow," AIAA Journal, Vol. 31, No. 4, 1993, pp. 637-645.
15Deyhle, H., and Bippes, H., "Disturbance Growth in an Unstable Three-Dimensional Boundary Layer and Its Dependence on Environmental Con-ditions," Journal of Fluid Mechanics, Vol. 316, 1996, pp. 73-113.
16Kohama, Y., Saric, W. S., and Hoos, J. A., "A High-Frequency Sec-ondary Instability of Crossflow Vortices that Leads to Transition," Proceed-ings of the Royal Aeronautical Society: Boundary Layer Transition and Con-trol, edited by M. Caster, Royal Aeronautical Society, Cambridge, England,UK, 1991.
17Mangalam, S. M., Maddalon, D. V, Saric, W. S., and Agarwal, N. K.,"Measurements of Crossflow Vortices, Attachment-Line Flow, and Transi-tion Using Microthin Hot Films," AIAA Paper 90-1636, June 1990.
18von Doenhoff, A. E., and Braslow, A. L., "The Effect of DistributedSurface Roughness on Laminar Flow," Boundary Layer Control, Vol. 2,edited by V. Lachmann, Pergamon, Oxford, 1961, pp. 657-681.
19Juillen, J. C., and Arnal, D., "Etude Experimental du de Clenchementde la Transition par Rugosites et par Rainer sur de Bord d'Attaque d'uneAile en Fleche en Encoulement Incompressible," CERT/ONERA, RapportFinal No. 51/5018.35, Toulouse, France, June 1990.
20Choudhari, M., "Roughness-Induced Generation of Crossflow Vorticesin Three-Dimensional Boundary Layers," Theoretical and ComputationalFluid Dynamics, Vol. 6, 1994, pp. 1-30.
21 Saric, W. S., Hoos, J. A., and Radeztsky, R. H., "Boundary-LayerReceptivity of Sound with Roughness," Boundary Layer Stability andTransition to Turbulence, edited by D. C. Reda, H. L. Reed, andR. Kobayashi, FED Vol. 114, American Society of Mechanical Engineers,New York, 1991, pp. 17-22.
22Radeztsky, R. H., Jr., Reibert, M. S., and Takagi, S., "A Software So-lution to Temperature-Induced Hot-Wire Voltage Drift," Proceedings of theThird International Symposium on Thermal Anemometry, FED Vol. 167,American Society of Mechanical Engineers, Washington, DC, 1993, pp. 49-55.
23Mack, L. M., "The Wave Pattern Produced by a Point Source on aRotating Disk," AIAA Paper 85-0490, Jan. 1985.
R. WlezienAssociate Editor
The Aerospace Sciences Meeting is the largest of the AIAAtechnical conferences and one of the preeminent technicalgatherings within the entire spectrum of aerospace activities.The multidisciplinary character of this meeting provides anideal forum for scientists and engineers from industry, gov-ernment, and academia to share and disseminate scientificknowledge and research results.