Effect of numerical aperture on signal level in cylindrical waveguide evanescent fluorosensors Thomas R. Glass, Steve Lackie, and Tomas Hirschfeld The effect of numerical aperture on signal level from fluorescent substances or solutions in the evanescent zone of a cylindrical waveguide is analyzed. The analysis applies to the case in which the fluorescence is excited by the evanescent wave of a fiber and the fluorescence signal is that which tunnels back into the same fiber. The analysis is for two cases: bulk fluorescence and fluorescence of a thin film layer. Experimental results are also presented. 1. Introduction A number of authors'- 9 have discussed the feasibil- ity of performing fluorescence immunoassays using evanescent fluorosensors. These sensors are all based on the principle of total reflection fluorescence (TRF), first described by Hirschfeld,' 0 wherein fluorescence is excited by the evanescent wave on or near the bound- ary of a totally reflecting element such as a prism or waveguide. In the earliest cases, investigators# 6 used evanescent excitation but collected fluorescent emis- sion in free propagation. Block and Hirschfeld'- 39 first proposed evanescent excitation with a collection of the fluorescence that tunneled back into trapped modes of the waveguide, an approach also taken by Andrade et al. 7 Using an optical fiber or rod as the TRF element and collecting fluorescence tunneling back into the fiber, as dia- gramed in Fig. 1, has a number of advantages over other approaches. Several authors1"1 3 have discussed the enhancement of fluorescence which arises when a fluorescent moiety is in close proximity to a waveguide surface. This advantage applies to planar and cylin- drical waveguidesand to prisms so long as tunneled, or evanescent, fluorescence is collected. The fiber or rod, as shown by Block and Hirschfeld,1-3 9 has an addition- al advantage over planar waveguides or prisms. If the total optical absorption is much less than the incident When this work was done Tomas Hirschfeld was with Lawrence Livermore National Laboratory; the other authors are with ORD, Inc., 238 Broadway, Cambridge, Massachusetts 02139. Received 3 October 1986. 0003-6935/87/112181-07$02.00/0. 3 1987 Optical Society of America. power, as it usually will be, all the fluorescent mole- cules along the waveguide see the same excitation pow- er.' In conjunction with the fact that the fluorescence tunneling into bound modes of the fiber is efficiently transmitted to the fiber face for detection, this results in higher brightness of the observed fluorescence and in the observed signal being directly proportional to the length of fiber used. Also, as discussed by Hirsch- feld and Block,- 39 collecting fluorescence at the proxi- mal end of the fiber, into which the excitation is cou- pled, greatly reduces the background compared to detecting fluorescence at the distal end of the fiber, as discussed by Sutherland et al. 6 In addition, the fiber geometry, in conjunction with a capillary, lends itself nicely to an immunoassay format with no volume mea- surement steps. 23 The last advantage may prove par- ticularly important since it removes the last skill inten- sive step from the fluorescent immunoassay. The purpose of this paper is to describe in detail the importance of numerical aperture, or maximum opti- cal cone size, in both the collection and excitation optics of an instrument designed for using fibers or rods as evanescent fluorosensors. The theory present- ed extends earlier unpublished work by the late Tomas Hirschfeld to include nonmeridional rays. II. Theory The fundamental phenomenon employed in fiber- optic evanescent fluorosensors is that of exciting and detecting fluorescence just outside the boundary of a waveguide through evanescent interaction. The exci- tation is accomplished through the evanescent wave associated with propagation of trapped modes in a waveguide. The fluorescent emission detected is that which tunnels back into trapped modes of the same waveguide. Figure 1 illustrates the sensor geometry. The purpose of this paper is to derive a functional 1 June 1987 / Vol. 26, No. 11 / APPLIED OPTICS 2181
Transcript
Effect of numerical aperture on signal level in cylindricalwaveguide evanescent fluorosensors
Thomas R. Glass, Steve Lackie, and Tomas Hirschfeld
The effect of numerical aperture on signal level from fluorescent substances or solutions in the evanescentzone of a cylindrical waveguide is analyzed. The analysis applies to the case in which the fluorescence isexcited by the evanescent wave of a fiber and the fluorescence signal is that which tunnels back into the samefiber. The analysis is for two cases: bulk fluorescence and fluorescence of a thin film layer. Experimentalresults are also presented.
1. Introduction
A number of authors'- 9 have discussed the feasibil-ity of performing fluorescence immunoassays usingevanescent fluorosensors. These sensors are all basedon the principle of total reflection fluorescence (TRF),first described by Hirschfeld,' 0 wherein fluorescence isexcited by the evanescent wave on or near the bound-ary of a totally reflecting element such as a prism orwaveguide. In the earliest cases, investigators# 6 usedevanescent excitation but collected fluorescent emis-sion in free propagation.
Block and Hirschfeld'-3 9 first proposed evanescentexcitation with a collection of the fluorescence thattunneled back into trapped modes of the waveguide,an approach also taken by Andrade et al. 7 Using anoptical fiber or rod as the TRF element and collectingfluorescence tunneling back into the fiber, as dia-gramed in Fig. 1, has a number of advantages overother approaches. Several authors1"13have discussedthe enhancement of fluorescence which arises when afluorescent moiety is in close proximity to a waveguidesurface. This advantage applies to planar and cylin-drical waveguides and to prisms so long as tunneled, orevanescent, fluorescence is collected. The fiber or rod,as shown by Block and Hirschfeld,1-39 has an addition-al advantage over planar waveguides or prisms. If thetotal optical absorption is much less than the incident
When this work was done Tomas Hirschfeld was with LawrenceLivermore National Laboratory; the other authors are with ORD,Inc., 238 Broadway, Cambridge, Massachusetts 02139.
Received 3 October 1986.0003-6935/87/112181-07$02.00/0.
3 1987 Optical Society of America.
power, as it usually will be, all the fluorescent mole-cules along the waveguide see the same excitation pow-er.' In conjunction with the fact that the fluorescencetunneling into bound modes of the fiber is efficientlytransmitted to the fiber face for detection, this resultsin higher brightness of the observed fluorescence andin the observed signal being directly proportional tothe length of fiber used. Also, as discussed by Hirsch-feld and Block,- 3 9collecting fluorescence at the proxi-mal end of the fiber, into which the excitation is cou-pled, greatly reduces the background compared todetecting fluorescence at the distal end of the fiber, asdiscussed by Sutherland et al. 6 In addition, the fibergeometry, in conjunction with a capillary, lends itselfnicely to an immunoassay format with no volume mea-surement steps.2 3 The last advantage may prove par-ticularly important since it removes the last skill inten-sive step from the fluorescent immunoassay.
The purpose of this paper is to describe in detail theimportance of numerical aperture, or maximum opti-cal cone size, in both the collection and excitationoptics of an instrument designed for using fibers orrods as evanescent fluorosensors. The theory present-ed extends earlier unpublished work by the late TomasHirschfeld to include nonmeridional rays.
II. Theory
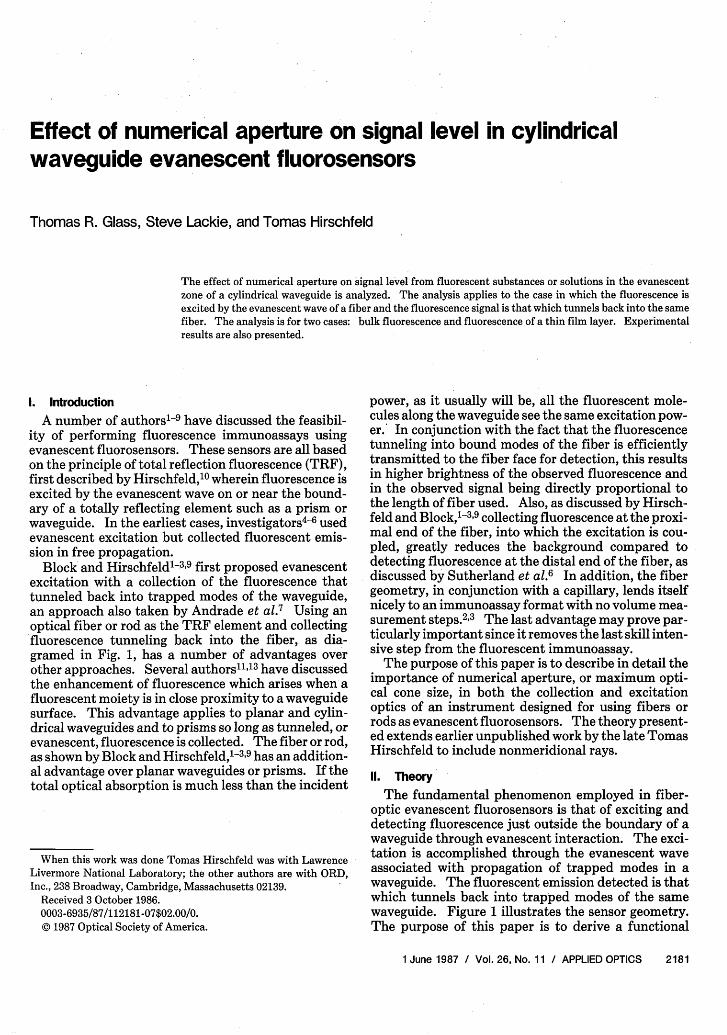
The fundamental phenomenon employed in fiber-optic evanescent fluorosensors is that of exciting anddetecting fluorescence just outside the boundary of awaveguide through evanescent interaction. The exci-tation is accomplished through the evanescent waveassociated with propagation of trapped modes in awaveguide. The fluorescent emission detected is thatwhich tunnels back into trapped modes of the samewaveguide. Figure 1 illustrates the sensor geometry.The purpose of this paper is to derive a functional
* V *- FluoreseorFig. 1. Fiber-optic evanescent fluorosensor geometry. Thefluorescor is excited by the evanescent wave associated with the totalinternal reflection of the exciting ray (heavy line). A fraction of thefluorescence (light line) tunnels back into the fiber and is available
for detection.
relationship between fluorescent signal level and thenumerical aperture (N.A.) of the optical system.
The evanescent fluorosensor considered here con-sists of an optical quality fiber or rod surrounded bythe sample to be probed. A requirement for operationis that the sample refractive index be less than therefractive index of the fiber or rod. The relative indi-ces of the fiber and sample then set an upper limit onthe N.A. at which the sensor may be used. The analy-sis that follows applies to the case in which the N.A. islimited by the optical system used to excite and readthe fluorosensor and is less than or equal to the maxi-mum N.A. for the sensor. The analysis is performedfor two cases. The first assumes that the fluorescentsubstance to be measured is bound in a thin layer onthe fiber (layer thickness much less than a wavelengthof light). The second case assumes that the sample ismany wavelengths thick. In both cases the analysiswill be performed using ray optics and makes predic-tions only for evanescent fluorosensors using multi-mode fibers.
Harrick14 has shown that the electric-field ampli-tude and optical absorption in the evanescent zonenear a waveguide depend on the angle of incidence ofthe totally reflected ray. Carniglia et al.'2 and Lee etal." have shown that the modal intensity of the fluo-rescence tunneling into a waveguide is proportional tothe evanescent electric-field intensity produced byeach mode. Our approach is to calculate the evanes-cent absorption based on a weighted integral over allangles of incidence where the weighting factor is theoptical power. We then calculate the fraction of fluo-rescent power collected as an integral over the samerange of angles. By multiplying these two integrals
I', ,I'
'<' 2
I I
I I
a >
I''~~~~~~~~~~~~~~~a
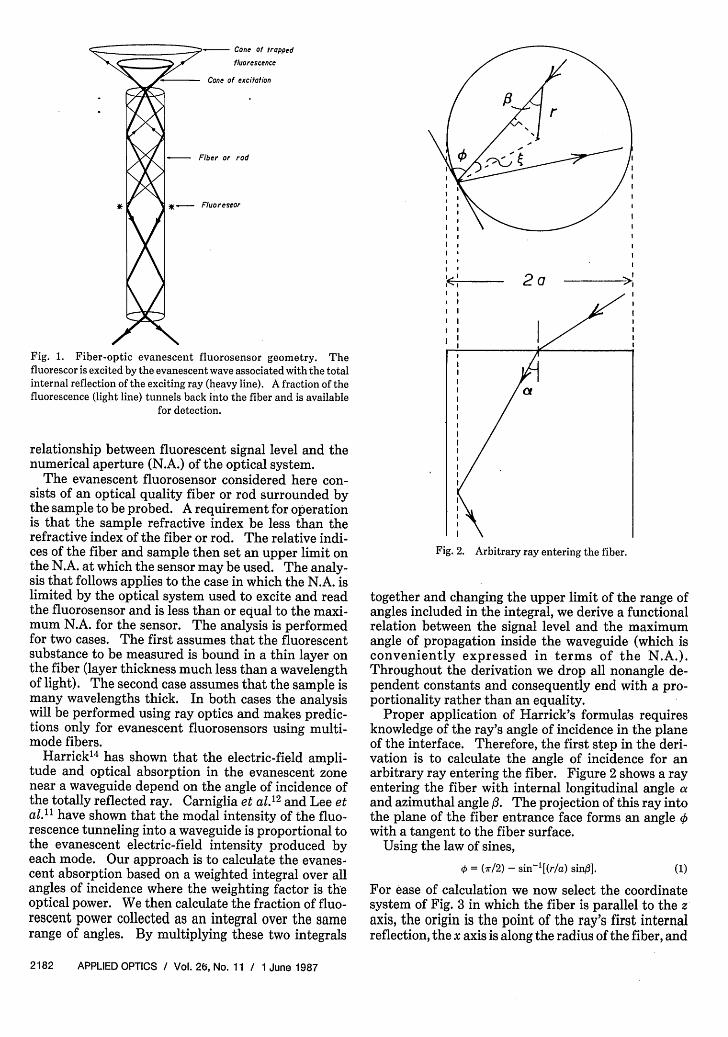
Fig. 2. Arbitrary ray entering the fiber.
together and changing the upper limit of the range ofangles included in the integral, we derive a functionalrelation between the signal level and the maximumangle of propagation inside the waveguide (which isconveniently expressed in terms of the N.A.).Throughout the derivation we drop all nonangle de-pendent constants and consequently end with a pro-portionality rather than an equality.
Proper application of Harrick's formulas requiresknowledge of the ray's angle of incidence in the planeof the interface. Therefore, the first step in the deri-vation is to calculate the angle of incidence for anarbitrary ray entering the fiber. Figure 2 shows a rayentering the fiber with internal longitudinal angle aand azimuthal angle fi. The projection of this ray intothe plane of the fiber entrance face forms an angle 0with a tangent to the fiber surface.
Using the law of sines,
0 = (r/2) - sin-'[(r/a) sink]. (1)
For ease of calculation we now select the coordinatesystem of Fig. 3 in which the fiber is parallel to the zaxis, the origin is the point of the ray's first internalreflection, the x axis is along the radius of the fiber, and
Fig.'3. Arbitrary ray impinging on a reflection point 0 on the fibersurface. The fiber axis is parallel to the z axis, the x axis is normal to
the fiber surface, and the y axis is tangential to the fiber surface.
the y axis is tangential to the fiber surface. Referringto Fig. 3,
sin77 = cos(ir/2 - a) sino = sina sino, (2)
where 0 and a are as defined in Fig. 2, and q is the anglethe ray makes with the plane tangent to the fiberinterface. For any particular ray the angle X is thesame for each reflection.
Another result which is needed is the number ofreflections an arbitrary ray makes in traversing a fixedlength of fiber. Consider a ray with longitudinal anglea. Unfolding this ray, as in Fig. 4, shows that the raylength inside the fiber is dependent only on a and thelength of fiber p and is given by
d = p/cos(a). (3)
Since the angle a does not change as the ray propagatesthrough the fiber, in either the meridional or nonmeri-dional case, Eq. (3) holds in either case.
The number of reflections the ray experiences isgiven by the total ray length divided by the distancebetween reflections. The distance between reflectionsis given by the cord length of the rays projection into aplane parallel to the fiber face divided by the sin(a).For a meridional ray the cord length is simply the fiberdiameter. Referring again to Fig. 2 the cord length cfor a nonmeridional ray is
c = 2a cos(Q) = 2a1 - (r/a)2 sin2'. (4)
We can now write the expression for m, the number ofreflections of an arbitrary ray, as
p tan(a) (5)
2a 1-(rna)2 sin2f
which in the special case of f = 0 (meridional ray)reduces to the commonly known result
m = (p/2a) tana. (6)
We expect the signal level in an evanescent fluorosen-sor to be proportional to the absorbed optical powerand to the fraction of the emitted fluorescence that isdetected. Based on this we can write a general expres-sion for the signal from an evanescent fluorosensor as
S = kA6 c, (7)
p d
Fig. 4. Path length of a ray in a fiber may be easily calculated fromthe ray longitudinal angle a and fiber length p.
where S = signal,AO = evanescent absorption,E = fraction of emitted fluorescence reaching
detector (collection efficiency),k = a proportionality constant incorporating
such nonangle dependent factors as the flu-orescent concentration, fluorescent quan-tum efficiency, and the optics spectraltransmission.
We now calculate each of the terms E,, and AO, asintegrals over the longitudinal angle a. Then, bykeeping the upper limit on a, amax, as a variable, wefind the signal level as a function of N.A. (N.A. = n,sinamax)-
The evanescent absorption Ao is different in the twocases of a thin layer and a bulk sample. Consideringfirst the case of a thin layer, Harrick14 has shown thatthe optical absorption for a single reflection can beexpressed as an increased effective thickness of thelayer, the effective thickness being the thickness thatabsorbs the same optical power in normal propagationas is absorbed evanescently. The factor of increase forthe thickness of a thin layer is given by
n2 = index of layer or film,n3 = index of surrounding media, and
f(O) [1 + (n3/n2)4] sin2O - (n3/nl) 2
[1 + (n3/nl) 2 ] sin2 0 - (n3/n 1)2 (10)
In the case of randomly polarized light (which resultsfrom a few successive skew reflections in any case), wecan average to get
(dav/d) =2n 2n1 [1 + f(O)] cosO
nl-nChoosing the particular case of a quartz fiber in anaqueous solution, the function [1 + f(O)] is monotonicand changes by <1.0% over the full range of numericalapertures (from 0.0 to 0.63, the maximum for quartz inwater). It is, therefore, acceptable to replace the term[1 + f(O)] with its average value [1 + f(0)], which greatlysimplifies subsequent calculation. Substituting for 0and [1 + f(0)] in Eq. (11) we can express the enhance-ment in film thickness as a function of longitudinalangle a, azimuthal angle Al, and entrance position radi-us r.
Before using the thickness enhancement [Eq. (11)]to calculate the evanescent absorption for a thin layer(AeL), we must account for the effect of multiple re-flections and the angular distribution of the incidentpower. If we assume a Lambertian source imaged ontothe fiber face by a well-corrected (aplanatic) opticalsystem, from basic radiometry [see, for example,Boyd15], the power entering the fiber is given by
Pi j I I 27rr sina cosadrda
7ra2 (nl/no) 2 sin2 am., (12)
where nj = index of fiber core (1.47 for quartz),no = index between last element and fiber (usu-
ally 1),amax = maximum half-aperture angle of beam with-
in fiber, anda = radius of fiber. (Using a as the limit on the
r integration assumes the image fills thefiber face.)
We can now multiply the film thickness from Eq. 11by the incident power as a function of a and r from Eq.(8) and by the number of reflections [Eq. (5)]. Averag-ing the product over all possible entrance conditions(radius, longitudinal angle a, and azimuthal angle )gives the average evanescent absorption for a thinlayer. Dropping all nonangle dependent constants(including d, the layer thickness), the average evanes-cent absorption for a thin layer on a waveguide (AeL) isgiven by
A0L I J I 27rr sina cosa davmdadfldr. (13)
The integral runs over the full range of fi and r (assum-ing the entire fiber face is illuminated) and leaves amax(N.A. = ni sinamax) as a variable. Substituting for dayfrom Eq. (11) and for m from Eq. (5) gives
A0L JJ I f 2irr sin 3adado3dr (14)
or
AL ( + cosam + cosamax). (15)
After calculating the collection efficiency, or fractionof fluorescence detected E,, we multiply it by AeL toget the signal level as a function of amax or by substitu-tion N.A.. Before proceeding with this, however, wedigress briefly to consider the evanescent absorption inthe case of a bulk sample.
In the case of a bulk sample, Harrick14 again showsthat the absorption can be related to a penetrationdepth or effective thickness. As before, the effectivethickness is the thickness that absorbs the same opti-cal power in normal propagation as is absorbed evanes-cently. For a bulk sample Harrick gives the effectivepenetration depth as
de = n3nX cos0[1 + g(0)] (16)
2 3r(nl - n) sin2- (n3 /n1)2
where we have again averaged over the two polariza-tions and
g() =2n2 sin2
0 -n2
(nl + n2) sin2o -n
The variation in [1 + g(O)] over the full range of 0 (forthe specific case of a quartz fiber in an aqueous solu-tion) is <2%, somewhat larger than that of [1 + f(0)]but still small enough to allow approximation with itsaverage value 1 + g(0)]. In analogy with Eq. (13) wecan now write the following proportionality for theaverage evanescent absorption (AeB) in the bulk caseas
A0 B : I:I J 2irr sina cosa demdadfldr. (18)
Substituting for de, Eq. (16), and m, Eq. (5), and againdropping all nonangle dependent constants, we have
A B K fa 2ams r sin3adadfldr * (19)
° °: ° -- (n3/n )2 - -(r/a) 2 sin2t31 sin2a
Integrating Eq. (19) with respect to r leads to42,r Cma [ [1 - (n3/n 1)
2 ] sin2a - sin 4 a sin 4a 1/2
Jo Jo L sin4fl sin2/ J
(2- f.n F [1 - (n/n 1)2] sin2a - sin4 a 1/2
o ° l sin43 I dad3.
dad:
(20)
We now have the average optical absorption for thecase of both a thin layer (AeL) and a bulk sample (AeB)and are ready to consider the fraction of fluorescentemission detected E. The angular dependence of thecollection efficiency is independent of the details ofexcitation and will be the same in both cases. Carnig-lia et al.'
2 and Lee et al.1 have shown that the modalintensity of evanescent fluorescence (the fluorescencethat tunnels into bound modes of the waveguide) isreciprocal to the angular efficiency of excitation.
That is, the angular intensity of the trapped fluores-cence is the same as the angular dependence of theevanescent electric-field intensity in the rarer media.These authors"", 2 derived this result theoretically us-ing a wave representation of the fields rather than raysand confirmed it experimentally. Our approach is toapply their result using the ray representation expres-sion for the electric field derived by Harrick.'4
Harrick14 using rays derived the following expres-sion for the electric-field intensity:
(Eav/E)2 = 2 cos 2o [1 + f(0)]1 - nn12 (21)
where Eav applies in the case of randomly polarizedlight and f(O) is the same as in Eq. (10). Using theresult of Carniglia and Lee, this expression gives therelative intensity of fluorescence tunneling into thewaveguide as a function of angle. A complete descrip-tion of the angular intensity of the fluorescence mustalso include the effect of multiple reflections, sinceeach reflection point results in added fluorescent pow-er. The total fluorescent power is given by the fluores-cent intensity from an arbitrary reflection point, Eq.(21), multiplied by the number of such reflectionpoints, Eq. (5). The fraction of the total fluorescencedetected will be proportional to the integral of theproduct over the range of angles accepted and the sizeof the field imaged by the optical system. Assuminglight is collected from the entire fiber face,
ECJJ Ja 2 _ (Eav/E)2 mdadfldr, (22)
substituting from Eqs. (21) and (5), and integratingwith respect to a give
-sin2 amax-lncsm) (2)EC cc C2 L 2 -l(cosamIx)] (23)
where C2 is given by
C2 = JA J 1 - (/a) 2 sin2 3dIdr
and is independent of a. The remaining integrationsin a and r can be done numerically but do not affect thea dependence of EC. It is worth noting that the com-plete collection efficiency includes several additionalnonangle dependent terms including an exponentialdecrease in efficiency with distance from the fibersurface. (This arises from the reciprocity already,cited and from the well-known exponential nature ofthe evanescent electric field.)
We can now write expressions for the signal in thetwo cases of a thin layer or a bulk sample. For a thinlayer the signal SF is given by
SF K (n- )2 3 -cosamax) EC, (24)
where E is given by Eq. (23). In the case of a bulksolution the signal SB is given by
SB (AeB)Ec, (25'
DETECTOR
f= 12A SPHERE
1 _ -SHUTTER
QUARTZ 530130HALOGEN 485120 iooou
5/0 LP
f:/2 ~ ~ f f2/ f 21
ASPHERE _1
ZEISS 40 0.65
FIBER
CAPILLARY
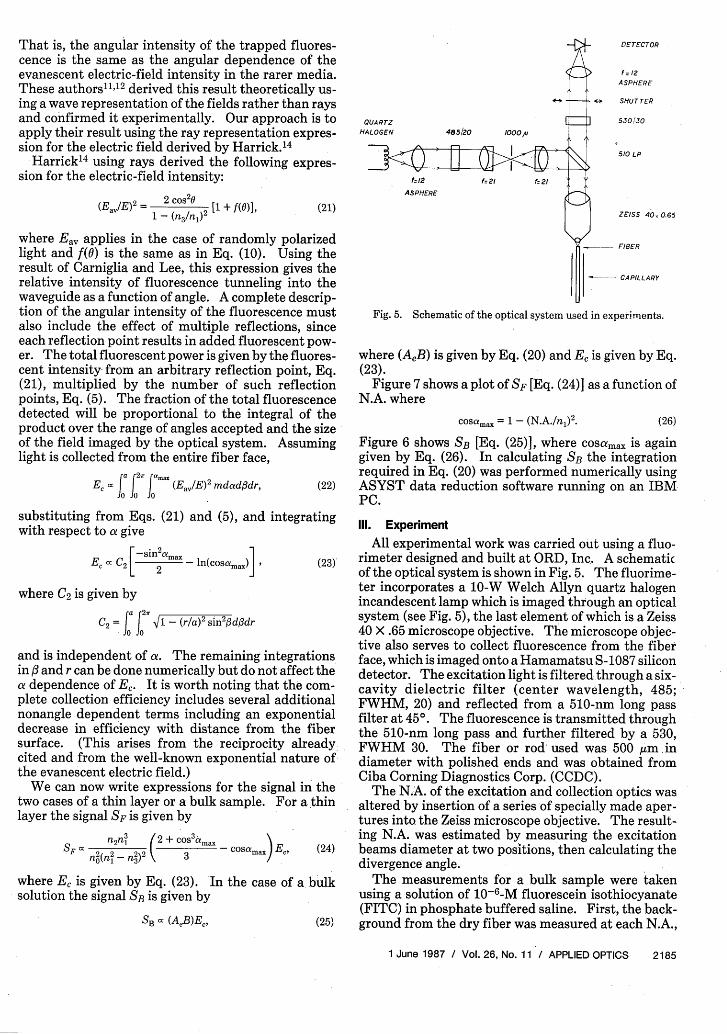
Fig. 5. Schematic of the optical system used in experiments.
where (AeB) is given by Eq. (20) and EC is given by Eq.(23).
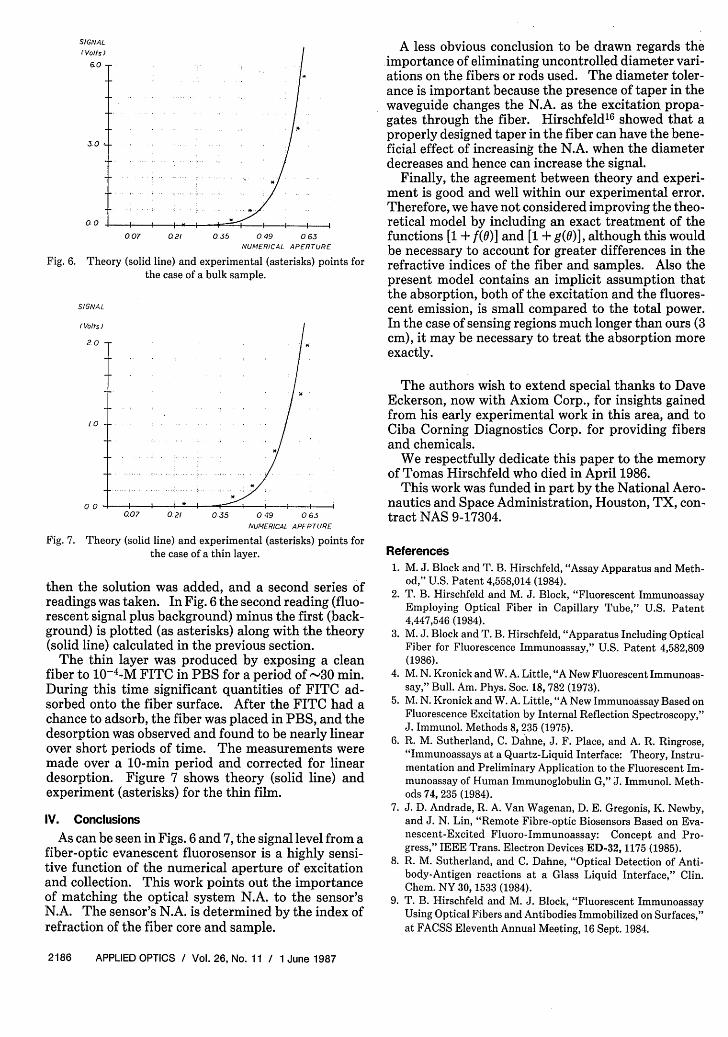
Figure 7 shows a plot of SF [Eq. (24)] as a function ofN.A. where
cosamax = 1- (N.A./n1)2. (26)
Figure 6 shows SB [Eq. (25)], where cosamax is againgiven by Eq. (26). In calculating SB the integrationrequired in Eq. (20) was performed numerically usingASYST data reduction software running on an IBMPC.
III. Experiment
All experimental work was carried out using a fluo-rimeter designed and built at ORD, Inc. A schematicof the optical system is shown in Fig. 5. The fluorime-ter incorporates a 10-W Welch Allyn quartz halogenincandescent lamp which is imaged through an opticalsystem (see Fig. 5), the last element of which is a Zeiss40 X .65 microscope objective. The microscope objec-tive also serves to collect fluorescence from the fiberface, which is imaged onto a Hamamatsu S-1087 silicondetector. The excitation light is filtered through a six-cavity dielectric filter (center wavelength, 485;FWHM, 20) and reflected from a 510-nm long passfilter at 45. The fluorescence is transmitted throughthe 510-nm long pass and further filtered by a 530,FWHM 30. The fiber or rod used was 500 um ,indiameter with polished ends and was obtained fromCiba Corning Diagnostics Corp. (CCDC).
The N.A. of the excitation and collection optics wasaltered by insertion of a series of specially made aper-tures into the Zeiss microscope objective. The result-ing N.A. was estimated by measuring the excitationbeams diameter at two positions, then calculating thedivergence angle.
The measurements for a bulk sample were takenusing a solution of 10-6-M fluorescein isothiocyanate(FITC) in phosphate buffered saline. First, the back-ground from the dry fiber was measured at each N.A.,
Fig. 6. Theory (solid line) and experimental (asterisks) points forthe case of a bulk sample.
SIGNAL
(Volts)
2.0 -
I 0
0 0.�1
007 021 035 049 063NUMERICAL APFPTURE
Fig. 7. Theory (solid line) and experimental (asterisks) points forthe case of a thin layer.
then the solution was added, and a second series ofreadings was taken. In Fig. 6 the second reading (fluo-rescent signal plus background) minus the first (back-ground) is plotted (as asterisks) along with the theory(solid line) calculated in the previous section.
The thin layer was produced by exposing a cleanfiber to 10-4-M FITC in PBS for a period of -30 min.During this time significant quantities of FITC ad-sorbed onto the fiber surface. After the FITC had achance to adsorb, the fiber was placed in PBS, and thedesorption was observed and found to be nearly linearover short periods of time. The measurements weremade over a 10-min period and corrected for lineardesorption. Figure 7 shows theory (solid line) andexperiment (asterisks) for the thin film.
IV. Conclusions
As can be seen in Figs. 6 and 7, the signal level from afiber-optic evanescent fluorosensor is a highly sensi-tive function of the numerical aperture of excitationand collection. This work points out the importanceof matching the optical system N.A. to the sensor'sN.A. The sensor's N.A. is determined by the index ofrefraction of the fiber core and sample.
A less obvious conclusion to be drawn regards theimportance of eliminating uncontrolled diameter vari-ations on the fibers or rods used. The diameter toler-ance is important because the presence of taper in thewaveguide changes the N.A. as the excitation propa-gates through the fiber. Hirschfeld16 showed that aproperly designed taper in the fiber can have the bene-ficial effect of increasing the N.A. when the diameterdecreases and hence can increase the signal.
Finally, the agreement between theory and experi-ment is good and well within our experimental error.Therefore, we have not considered improving the theo-retical model by including an exact treatment of thefunctions [1 + f(0)] and [1 + g(O)], although this wouldbe necessary to account for greater differences in therefractive indices of the fiber and samples. Also thepresent model contains an implicit assumption thatthe absorption, both of the excitation and the fluores-cent emission, is small compared to the total power.In the case of sensing regions much longer than ours (3cm), it may be necessary to treat the absorption moreexactly.
The authors wish to extend special thanks to DaveEckerson, now with Axiom Corp., for insights gainedfrom his early experimental work in this area, and toCiba Corning Diagnostics Corp. for providing fibersand chemicals.
We respectfully dedicate this paper to the memoryof Tomas Hirschfeld who died in April 1986.
This work was funded in part by the National Aero-nautics and Space Administration, Houston, TX, con-tract NAS 9-17304.
References
1. M. J. Block and T. B. Hirschfeld, "Assay Apparatus and Meth-od," U.S. Patent 4,558,014 (1984).
2. T. B. Hirschfeld and M. J. Block, "Fluorescent ImmunoassayEmploying Optical Fiber in Capillary Tube," U.S. Patent4,447,546 (1984).
3. M. J. Block and T. B. Hirschfeld, "Apparatus Including OpticalFiber for Fluorescence Immunoassay," U.S. Patent 4,582,809(1986).
4. M. N. Kronick and W. A. Little, "A New Fluorescent Immunoas-say," Bull. Am. Phys. Soc. 18, 782 (1973).
5. M. N. Kronick and W. A. Little, "A New Immunoassay Based onFluorescence Excitation by Internal Reflection Spectroscopy,"J. Immunol. Methods 8, 235 (1975).
6. R. M. Sutherland, C. Dahne, J. F. Place, and A. R. Ringrose,"Immunoassays at a Quartz-Liquid Interface: Theory, Instru-mentation and Preliminary Application to the Fluorescent Im-munoassay of Human Immunoglobulin G," J. Immunol. Meth-ods 74, 235 (1984).
7. J. D. Andrade, R. A. Van Wagenan, D. E. Gregonis, K. Newby,and J. N. Lin, "Remote Fibre-optic Biosensors Based on Eva-nescent-Excited Fluoro-Immunoassay: Concept and Pro-gress," IEEE Trans. Electron Devices ED-32, 1175 (1985).
8. R. M. Sutherland, and C. Dahne, "Optical Detection of Anti-body-Antigen reactions at a Glass Liquid Interface," Clin.Chem. NY 30, 1533 (1984).
9. T. B. Hirschfeld and M. J. Block, "Fluorescent ImmunoassayUsing Optical Fibers and Antibodies Immobilized on Surfaces,"at FACSS Eleventh Annual Meeting, 16 Sept. 1984.
10. T. B. Hirschfeld, "Total Reflection Fluorescence," J. Can. Spec-trosc. 126 (Nov. 1965).
11. E. H. Lee, R. E. Benner, J. B. Fenn, and R. K. Chang, "AngularDistribution of Fluorescence from Liquids and MonodispersedSpheres by Evanescent Wave Excitation," Appl. Opt. 18, 862(1976).
12. C. K. Carniglia, L. Mandel, and H. Drexhage, "Absorption andEmission of Evanescent Photons," J. Opt. Soc. Am. 62, 479(1972).
13. W. R. Holland and D. G. Hall, "Waveguide Mode Enhancementof Molecular Fluroescence," Opt. Lett. 10, 414 (1985).
14. N. J. Harrick, Internal Reflection Spectroscopy (Interscience,New York, 1967), Chap. 2.
15. R. W. Boyd, Radiometry and the Detection of Optical Radia-tion (Wiley, New York, 1983), Chap. 5.
16. T. B. Hirschfeld, "Apparatus for Improving the Numerical Ap-erture at the Input of A Fiber Optics Device" U.S. Patent4,654,532 (1987).
Patents continued from page 2180
4,643,575 17 Feb. 1987 (Cl. 356-351)Fizeau interferometer.M. B. HAZELTINE and W. M. LIPCHAK, Jr. Assigned to Rayth-eon Co. Filed 4 Sept. 1984.
This patent describes a laser Doppler velocimeter (LDV) based on a Fizeauinterferometer. A Brewster plate is used as a polarization beam splitter toproduce a p-polarized transmitted beam. A beam splitter with 0.001 reflec-tance provides the local oscillator (LO) beam for the LDV. Quarter wave-plates are used to convert both the LO beam and the returned beam into s-polarization so that they are reflected by the Brewster plate to the detector.One of the quarter waveplates is adjusted to control the intensity of the LObeam at the detector. W.-H.L.
225
--40
EECTOR
24IOTI CATION
DEVIC
4,643,576 17 Feb. 1987 (Cl. 356-353)Fringe scanning shearing interferometer.T. KANOH and T. KOUCHIWA. Assigned to Ricoh Co., Ltd.Filed 18 Apr. 1985 (in Japan 19 Apr. 1984).
This patent describes a heterodyne shearing interferometer. The lateralshear is produced by translating one of the corner cube prisms along theoptical axis. The heterodyning or fringe scanning is done by using a pie2oelec-tric device to vibrate the prism. W.-H.L.
11
I. a 20
14 1316-
}12
11< 21
"tJ LS~~~~~~~22
4,643,033 17 Feb. 1987 (Cl. 73-864.91)Sample cup for use in X-ray spectroscopy.M. J. SOLAZZI. Assigned to Chemplex Industries, Inc. Filed 20Sept. 1985. See U.S. Patents D238,693, 3 Feb. 1976; 4,409,854, 18Oct. 1983.
Claims in this patent read on the specific construction shown in the figure.For an undisclosed reason the figure is shown upside down in the patent, thebottom element of the figure being the top of the sample cup. The structure of
this device seems to'be of obvious simplicity; the only dimensional claimrelates to the thickness of the film covering the top. J.J.J.S.
1 34
40' 3\) 236
4,643,515 17 Feb. 1987 (Cl. 350-3.67)Method and apparatus for recording and displaying edge-illu-minated holograms.J. UPATNIEKS. Assigned to Environmental Research Institute ofMichigan. Filed 1 Apr. 1985.
This patent describes a method of recording total internal reflection holo-grams for image display. A reference beam is introduced through the side ofthe recording plate so that it is totally internal reflected by the emulsion to airinterface. Three different embodiments for introducing the reference beamto the emulsion are shown. W.-H.L.
ele
Beg S;T
44,645,302 24 Feb. 1987 (Cl. 350-173)Light beam splitter.J. E. AUGHTON. Assigned to Crosfield Electronics, Ltd. Filed 13Dec. 1983.
A method of producing a multiplicity of parallel light beams from a singleinput beam is described.' A triangular prism having one face coated with apartially transmitting film and the other two fully reflective gives rise to amultiplicity of parallel beams from a laser source. Application to laser half-tone printing is discussed. J.B.