Civil & Environmental Engineering and Construction Faculty Publications Civil & Environmental Engineering and Construction Engineering 6-19-2019 Effect of Overburden Height on Hydraulic Fracturing of Concrete- Effect of Overburden Height on Hydraulic Fracturing of Concrete- Lined Pressure Tunnels Excavated in Intact Rock: A Numerical Lined Pressure Tunnels Excavated in Intact Rock: A Numerical Study Study Moses Karakouzian University of Nevada, Las Vegas, [email protected]Mohammad Nazari-Sharabian University of Nevada, Las Vegas, [email protected]Mehrdad Karami Isfahan University Follow this and additional works at: https://digitalscholarship.unlv.edu/fac_articles Part of the Hydraulic Engineering Commons Repository Citation Repository Citation Karakouzian, M., Nazari-Sharabian, M., Karami, M. (2019). Effect of Overburden Height on Hydraulic Fracturing of Concrete-Lined Pressure Tunnels Excavated in Intact Rock: A Numerical Study. Fluids, 4 99-112. MDPI. http://dx.doi.org/10.3390/fluids4020112 This Article is protected by copyright and/or related rights. It has been brought to you by Digital Scholarship@UNLV with permission from the rights-holder(s). You are free to use this Article in any way that is permitted by the copyright and related rights legislation that applies to your use. For other uses you need to obtain permission from the rights-holder(s) directly, unless additional rights are indicated by a Creative Commons license in the record and/ or on the work itself. This Article has been accepted for inclusion in Civil & Environmental Engineering and Construction Faculty Publications by an authorized administrator of Digital Scholarship@UNLV. For more information, please contact [email protected].
Transcript
Civil & Environmental Engineering and Construction Faculty Publications
Civil & Environmental Engineering and Construction Engineering
6-19-2019
Effect of Overburden Height on Hydraulic Fracturing of Concrete-Effect of Overburden Height on Hydraulic Fracturing of Concrete-
Lined Pressure Tunnels Excavated in Intact Rock: A Numerical Lined Pressure Tunnels Excavated in Intact Rock: A Numerical
Study Study
Moses Karakouzian University of Nevada, Las Vegas, [email protected]
Mohammad Nazari-Sharabian University of Nevada, Las Vegas, [email protected]
Mehrdad Karami Isfahan University
Follow this and additional works at: https://digitalscholarship.unlv.edu/fac_articles
Part of the Hydraulic Engineering Commons
Repository Citation Repository Citation Karakouzian, M., Nazari-Sharabian, M., Karami, M. (2019). Effect of Overburden Height on Hydraulic Fracturing of Concrete-Lined Pressure Tunnels Excavated in Intact Rock: A Numerical Study. Fluids, 4 99-112. MDPI. http://dx.doi.org/10.3390/fluids4020112
This Article is protected by copyright and/or related rights. It has been brought to you by Digital Scholarship@UNLV with permission from the rights-holder(s). You are free to use this Article in any way that is permitted by the copyright and related rights legislation that applies to your use. For other uses you need to obtain permission from the rights-holder(s) directly, unless additional rights are indicated by a Creative Commons license in the record and/or on the work itself. This Article has been accepted for inclusion in Civil & Environmental Engineering and Construction Faculty Publications by an authorized administrator of Digital Scholarship@UNLV. For more information, please contact [email protected].
Received: 2 June 2019; Accepted: 17 June 2019; Published: 19 June 2019�����������������
Abstract: This study investigated the impact of overburden height on the hydraulic fracturing ofa concrete-lined pressure tunnel, excavated in intact rock, under steady-state and transient-stateconditions. Moreover, the Norwegian design criterion that only suggests increasing the overburdenheight as a countermeasure against hydraulic fracturing was evaluated. The Mohr–Coulomb failurecriterion was implemented to investigate failure in the rock elements adjacent to the lining. A pressuretunnel with an inner diameter of 3.6 m was modeled in Abaqus Finite Element Analysis (FEA), usingthe finite element method (FEM). It was assumed that transient pressures occur inside the tunnel dueto control gate closure in a hydroelectric power plant, downstream of the tunnel, in three differentclosure modes: fast (14 s), normal (18 s), and slow (26 s). For steady-state conditions, the resultsindicated that resistance to the fracturing of the rock increased with increasing the rock friction angle,as well as the overburden height. However, the influence of the friction angle on the resistance torock fracture was much larger than that of the overburden height. For transient-state conditions,the results showed that, in fast, normal, and slow control gate closure modes, the required overburdenheights to failure were respectively 1.07, 0.8, and 0.67 times the static head of water in the tunnelunder a steady-state condition. It was concluded that increasing the height of overburden should notbe the absolute solution to prevent hydraulic fracturing in pressure tunnels.
Keywords: pressure tunnel; hydraulic fracturing; transient flow; finite element method (FEM);Abaqus Finite Element Analysis (FEA)
1. Introduction
High-pressure water tunnels, usually excavated in rock, convey water from the upstream reservoirtoward the turbines in hydropower plants, and turn the energy of the flowing water into electricity.These tunnels can be either steel-lined or concrete-lined; steel-lined pressure tunnels are safer, butmore costly to construct. Concrete-lined pressure tunnels are faced with serious challenges in designand construction. In these tunnels, due to the lining permeability in areas where the rock is jointed,water seeps into the joints and expands the cracks. In cases where the rock is intact and not jointed,high internal pressure can fracture the rock. This phenomenon is called hydraulic fracturing, whichmakes the rock mass on the tunnel unstable.
Researchers studied various aspects of hydraulic fracturing in pressure tunnels, some of whichare mentioned below. In 1986, Schleiss investigated leakage from pressure tunnels in the presence ofgroundwater, and presented the leakage relationships under two conditions: cracked and non-cracked
concrete linings. The author concluded that dynamic pressure caused by various factors, such as awater hammer or earthquake, had a significant impact on the rate of leakage and expansion of rockjoints [1]. Fernández and Alvarez (1994) used the finite element method (FEM) to study water leakagefrom a tunnel and effective stresses in the surrounding rock. The authors considered the ratio of totalstress to effective stress in the rock as a safety factor against hydraulic fracturing [2]. Furthermore,using the FEM and a closed-form analytical solution, Bobet and Nam (2007) studied effective stressesaround pressure tunnels under steady-state operation. The authors assumed there was no groundwaterpresence around the tunnel, and presented a new analytical solution for stresses and displacementsin the surrounding rock and the lining. Their solution considered the interaction between the lining,surrounding rock, and pore pressure in the rock environment, as a result of leakage through thelining [3]. Moreover, Hachem and Schleiss (2010) evaluated pressure wave velocities in steel-linedpressure tunnels, with and without considering the fluid–structure interactions. The authors showedchanges in pressure wave velocity, due to the characteristics of the surrounding rock, the thickness ofthe lining, and wave frequency [4].
Using the FEM, and in order to optimize the thickness of the concrete lining, Olumide and Marence(2012) simulated a pressure tunnel in a two-dimensional elasto-plastic space in order to study theeffects of seepage on the tunnel’s concrete lining. The authors investigated cracks in the lining bycoupling in situ stresses in the rock with the stresses caused by leakage, and validated their numericalmodel by the analytical method proposed by Schleiss (1986) [5]. Furthermore, Simanjuntak et al. (2014)studied displacements and stresses in the concrete lining and rock mass using the FEM, consideringnon-uniform in situ stresses around a pressure tunnel [6]. The authors showed that, in non-uniformstress conditions around the tunnel, when the coefficient of lateral rock pressure (k0) is ≤1, cracks formin the crown of the tunnel due to high internal pressure. In 2015, Zhou et al. considered the interactionsbetween fluid and the concrete lining in pressure tunnels in order to study stresses in a tunnel lining.The authors considered the hydro-mechanical behavior of the surrounding rock and the tunnel liningby simulating the fluid inside rock joints and cracks in the concrete lining [7]. More recently, Pachoudand Schleiss (2016) investigated the impacts of the transient pressure wave in pressure tunnels dueto water hammer. The authors presented analytical formulas for stresses and displacements in theenvironment around the tunnel [8]. In 2018, Zareifard presented an analytical solution for the designof pressure tunnels, considering seepage from a tunnel [9]. It should be noted that, in addition to thenegative impacts of hydraulic fracturing in water resources and related structures, it is widely used inthe oil and gas industry as a novel method for the exploitation of underground reservoirs [10].
Based on the literature review, many researchers investigated cracking in the rock or tunnelconcrete lining in steady-state conditions with constant overburden, yet they did not consider theinteractive effects of overburden height and transient pressures on hydraulic fracturing in the rockenvironment surrounding a tunnel. In the present study, in order to fill this gap in knowledge,the impact of overburden height on the bearing capacity of a tunnel in a steady-state condition wasstudied. For the next step, the effect of transient pressure caused by rapid gate operations on hydraulicfracturing in a tunnel in critical conditions (e.g., load rejection of the powerhouse) was investigated.The Mohr–Coulomb failure criterion was used to investigate the rock failure both in steady-state andtransient-state conditions.
2. Materials and Methods
Using the FEM and considering the environment around the tunnel as an intact rock withelasto-plastic behavior, stresses around a tunnel were studied using the Abaqus Finite ElementAnalysis (FEA) software [11]. Because cracks were not explicitly modeled in the numerical model,principal stresses were used as indicators of potential fracturing. Since this solution involves thehydraulics of water flow in the tunnel and the impacts of internal pressures on the surroundingrock, the Hammer software and Abaqus FEA were linked for modeling and analyzing the system.The Hammer software [12], which works based on the method of characteristics (MOC), was employed
Fluids 2019, 4, 112 3 of 18
to analyze the changes in the internal pressure inside the tunnel, as a function of time. The hydraulicanalysis results, from the Hammer software in transient-state conditions, were transferred to theAbaqus FEA in order to analyze stresses in the surrounding rock. It was assumed that, at first,the internal pressure was in the steady-state condition. Afterward, because of sudden gate closure,transient pressures built up in the tunnel. The flowchart below summarizes the main steps in thisstudy (Figure 1).
Fluids 2019, 4, x FOR PEER REVIEW 3 of 18
results, from the Hammer software in transient-state conditions, were transferred to the Abaqus FEA
in order to analyze stresses in the surrounding rock. It was assumed that, at first, the internal pressure
was in the steady-state condition. Afterward, because of sudden gate closure, transient pressures
built up in the tunnel. The flowchart below summarizes the main steps in this study (Figure 1).
Figure 1. The flowchart of this study.
2.1. Governing Equations
Using the general Navier–Stokes equation (Equation (1)) and simplifying assumptions—(a) fluid
inside the tunnel is non-viscous, (b) fluid velocity fluctuations are ignored, and (c) water has linear
compressibility—the hydrodynamic pressure inside the tunnel can be obtained using Equations (1)
and (2) [13].
� �∂�
��+ �. ∇� � = −∇� + �∇�� + �, (1)
�
�
���
∂��= ∇��, (2)
where v is the flow velocity (m/s), μ is the fluid viscosity (Pa·s), B is the vector of body forces (N), p is
the fluid hydrodynamic pressure in the tunnel (Pa), K is the bulk modulus (Pa), t is time (s), and ρ is
the water density (kg/m3). The only boundary condition governing the fluid inside the tunnel is the
boundary between the water and the lining. This boundary condition is defined as in Equation (3)
[13].
��
��= −����
, (3)
where n is a perpendicular vector to the shared surface between the water and the lining, and us is
the second derivative of the lining elements’ displacements in contact with the fluid (m/s2). The above
equation is based on the assumption that the radial displacements of the fluid and lining are similar
at the contact surfaces. The connection between the hydrodynamic pressures inside the tunnel {p}
and forces applied to the model caused by the hydrodynamic pressure {f} are linked by matrix [Q]
(Equation (4)) [14].
[�]{�} = {�}. (4)
Figure 1. The flowchart of this study.
2.1. Governing Equations
Using the general Navier–Stokes equation (Equation (1)) and simplifying assumptions—(a) fluidinside the tunnel is non-viscous, (b) fluid velocity fluctuations are ignored, and (c) water has linearcompressibility—the hydrodynamic pressure inside the tunnel can be obtained using Equations (1)and (2) [13].
ρ
(∂v∂t
+ v.∇v)= −∇p + µ∇2v + B, (1)
ρ
K∂2p∂t2 = ∇2p, (2)
where v is the flow velocity (m/s), µ is the fluid viscosity (Pa·s), B is the vector of body forces (N), p isthe fluid hydrodynamic pressure in the tunnel (Pa), K is the bulk modulus (Pa), t is time (s), and ρ isthe water density (kg/m3). The only boundary condition governing the fluid inside the tunnel is theboundary between the water and the lining. This boundary condition is defined as in Equation (3) [13].
∂p∂n
= −ρ..usn , (3)
where n is a perpendicular vector to the shared surface between the water and the lining, and..us is the
second derivative of the lining elements’ displacements in contact with the fluid (m/s2). The aboveequation is based on the assumption that the radial displacements of the fluid and lining are similarat the contact surfaces. The connection between the hydrodynamic pressures inside the tunnel {p}
Fluids 2019, 4, 112 4 of 18
and forces applied to the model caused by the hydrodynamic pressure {f } are linked by matrix [Q](Equation (4)) [14].
[Q]{p}=
{f}. (4)
The coupling matrix [Q] links the hydrodynamic pressures due to gate closure, with forcesgenerated in the concrete lining. This equation is solved by the Abaqus FEA, by applying the boundaryand initial conditions. Finally, the displacements and stresses in the rock due to hydrodynamicpressures are calculated. The forces in the concrete lining due to water pressure are transferred to thesurrounding rock. As a result, the equilibrium equation in the surrounding rock is as follows [14]:
[M]{ ..ur
}+ [C]
{ .ur
}+ [K]{ur} = {Rr}, (5)
{Rr} = {f } − {fs}, (6)
where M, C, and K are mass, damping, and hardness matrices, respectively; Rr is the vector of externalforces on the rock;
..ur and
.ur are the second and first derivatives of the rock elements, respectively; and
ur is the displacement of the rock elements. Equation (6) shows that part of the hydrodynamic force isresisted by the concrete lining (f s). Therefore, the relationship between hydrodynamic pressure anddisplacements in the surrounding rock is obtained by linking Equations (4) and (5).
2.2. FEM and Effective Parameters
In the FEM modeling, the following factors were considered in the simulations:
• A circular tunnel was excavated in intact rock by a tunnel boring machine (TBM);• Water pore pressure was considered in the concrete lining and in the rock;• The Mohr–Coulomb failure criterion was implemented in order to study stresses in the rock;• A damage plasticity behavior was considered in the concrete lining.
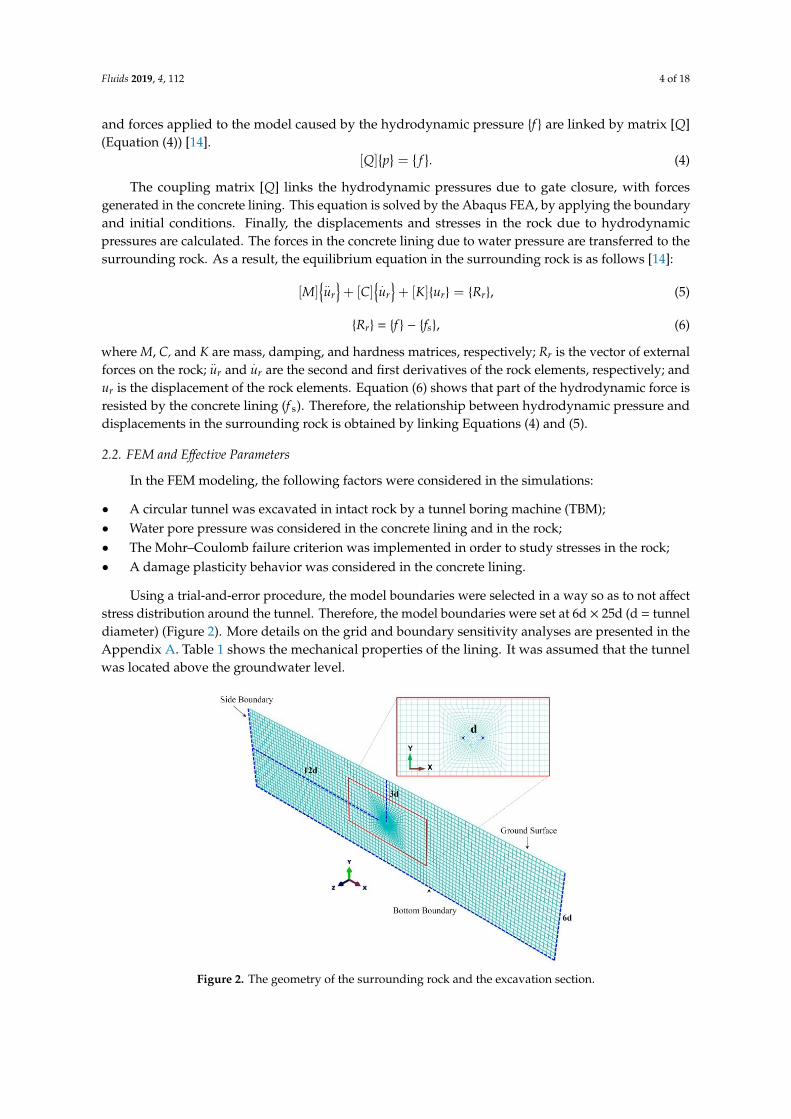
Using a trial-and-error procedure, the model boundaries were selected in a way so as to not affectstress distribution around the tunnel. Therefore, the model boundaries were set at 6d × 25d (d = tunneldiameter) (Figure 2). More details on the grid and boundary sensitivity analyses are presented in theAppendix A. Table 1 shows the mechanical properties of the lining. It was assumed that the tunnelwas located above the groundwater level.
Fluids 2019, 4, x FOR PEER REVIEW 4 of 18
The coupling matrix [Q] links the hydrodynamic pressures due to gate closure, with forces
generated in the concrete lining. This equation is solved by the Abaqus FEA, by applying the
boundary and initial conditions. Finally, the displacements and stresses in the rock due to
hydrodynamic pressures are calculated. The forces in the concrete lining due to water pressure are
transferred to the surrounding rock. As a result, the equilibrium equation in the surrounding rock is
as follows [14]:
[�]{��} + [�]{��} + [�]{��} = {��}, (5)
{Rr} = {f} − {fs}, (6)
where M, C, and K are mass, damping, and hardness matrices, respectively; Rr is the vector of external
forces on the rock; ur and ur are the second and first derivatives of the rock elements, respectively;
and ur is the displacement of the rock elements. Equation (6) shows that part of the hydrodynamic
force is resisted by the concrete lining (fs). Therefore, the relationship between hydrodynamic
pressure and displacements in the surrounding rock is obtained by linking Equations (4) and (5).
2.2. FEM and Effective Parameters
In the FEM modeling, the following factors were considered in the simulations:
A circular tunnel was excavated in intact rock by a tunnel boring machine (TBM);
Water pore pressure was considered in the concrete lining and in the rock;
The Mohr–Coulomb failure criterion was implemented in order to study stresses in the
rock;
A damage plasticity behavior was considered in the concrete lining.
Using a trial-and-error procedure, the model boundaries were selected in a way so as to not
affect stress distribution around the tunnel. Therefore, the model boundaries were set at 6d × 25d (d
= tunnel diameter) (Figure 2). More details on the grid and boundary sensitivity analyses are
presented in the appendix. Table 1 shows the mechanical properties of the lining. It was assumed
that the tunnel was located above the groundwater level.
Figure 2. The geometry of the surrounding rock and the excavation section.
Table 1. Mechanical properties of the lining [15,16].
Parameter Value
Elasticity (GPa) 25
Tensile strength (MPa) 3
Cohesion (MPa) 4.5
Figure 2. The geometry of the surrounding rock and the excavation section.
Fluids 2019, 4, 112 5 of 18
Table 1. Mechanical properties of the lining [15,16].
The only degree of freedom inside a water pressure tunnel is pressure in the fluid nodes. In AbaqusFEA, acoustic elements possess this feature and are appropriate for simulating the fluid movementinside a tunnel. Since acoustic environments are elastic, shear stresses do not exist in these environmentsand pressure is proportional to volume strain. In addition, the effects of inertia and compressibility areconsidered in acoustic elements [17].
In this study, the interactions between the fluid, lining, and surrounding rock were considered,and the fluid density was set at 1000 kg/m3, with a bulk modulus of 2.07 GPa. Taking into account theinteraction between the fluid and lining, the structure surfaces and fluid that are in contact were tiedtogether in Abaqus FEA. Applying the same reasoning, the external nodes of the lining were tied withthe nodes of the surrounding rock due to structure–rock interactions.
The environment around the tunnel has in situ stresses. By defining the height, specific weight,and the lateral stress coefficients of the rock, equilibrium conditions between the horizontal and verticalstresses were achieved, which resulted in zero ground settlement before tunnel excavation.
Since the transient pressure inside the tunnel depends on factors such as gate operations,this pressure was applied to the model as a quasi-static load (by gradually increasing the loading,so that the impacts of inertia became negligible). This means that, at different times, different pressureswere applied to the lining. In order to apply the time-variable pressure to all of the nodes in the acousticenvironment, the amplitude function in Abaqus FEA was used.
The plane strain elements with linear interpolation function were employed to mesh thesurrounding rock and concrete lining. In Abaqus FEA, these types of elements are called CPE4R(continuum plain strain element 4-node reduced integration). Meshing was such that, by approachingthe tunnel section, the mesh size decreased to achieve more precise results. Moreover, plane stressfamily elements were used for meshing the lining. In Abaqus FEA, these elements are called CPS4R(continuum plain stress element 4-node reduced integration). Furthermore, in the lining and rockelements, the reduced integration method was implemented, and AC2D4 elements (acoustic continuum2-dimension 4-node) were used to simulate water transient pressure inside the tunnel [11,18].
The first step in this research study was simulating in situ stresses. In order to have zero ground-surfacesettlement before tunnel excavation, these stresses should satisfy Equations (7) and (8) [19].
σv = γrh, (7)
σh = γrhk0, (8)
where γr is the specific weight of the rock, h is the height of the overburden rock, and k0 is the coefficientof lateral rock pressure. In the next step, the tunnel excavation was simulated. It was assumed that thetunnel was excavated by a tunnel boring machine. At this stage, the release of stress and displacementsoccurred in the rock. After the tunnel cross-section, the concrete lining was simulated. In this step,a concrete lining with the specifications presented in Table 1 was modeled. Interaction betweenthe rock and the lining was considered using tangential and normal stiffnesses. The final step wasapplying steady-state conditions and hydrodynamic water pressure to the lining. It was assumed
Fluids 2019, 4, 112 6 of 18
that the transient pressure inside the tunnel would occur due to the turbine gate closure in a typicalhydropower plant (Figure 3).Fluids 2019, 4, x FOR PEER REVIEW 6 of 18
Figure 3. Simplified hydropower plan.
Using the Hammer software, hydraulic analyses were performed in steady-state and transient-
state conditions, by defining the characteristics of the duct (water tunnel), reservoir, and gate closure
schedule. The parameters used for these analyses and their values are presented in Tables 2 and 3.
Water velocity was considered to be 6 m/s, according to the recommended value by the United States
Bureau of Reclamation [20]. Moreover, in order to create critical conditions in the tunnel to determine
its bearing capacity, it was assumed that the surge tank was disabled. The maximum flow rate was
considered to be 60 m3/s, and, according to the gate closure time in typical water tunnels, the gate
closure times were considered to be 14 s (fast), 18 s (normal), and 26 s (slow). Furthermore, based on
the duct characteristics, the pressure wave velocity according to the characteristics of the duct was
determined by Equation (9), where D is the inner diameter of the tunnel, E is the elastic concrete
modulus, and tc is the lining thickness [21].
� = �
1
��(�1
��� + �
�����
�). (9)
It was assumed that the lining could expand in the longitudinal direction, which results in a λ
(confinement coefficient) value of 1 [21].
Table 2. Geometric and hydraulic characteristics of the duct.
Inner
Diameter
(m)
Thickness
(mm)
Hazen
Williams
Coefficient (-)
Initial
Discharge
(m3/s)
Pressure
Wave
Velocity
(m/s)
Upstream
Head (m)
Initial
Flow
Velocity
(m/s)
3.6 200 100 60 911 80 6
Figure 3. Simplified hydropower plan.
Using the Hammer software, hydraulic analyses were performed in steady-state and transient-stateconditions, by defining the characteristics of the duct (water tunnel), reservoir, and gate closure schedule.The parameters used for these analyses and their values are presented in Tables 2 and 3. Water velocitywas considered to be 6 m/s, according to the recommended value by the United States Bureau ofReclamation [20]. Moreover, in order to create critical conditions in the tunnel to determine its bearingcapacity, it was assumed that the surge tank was disabled. The maximum flow rate was consideredto be 60 m3/s, and, according to the gate closure time in typical water tunnels, the gate closure timeswere considered to be 14 s (fast), 18 s (normal), and 26 s (slow). Furthermore, based on the ductcharacteristics, the pressure wave velocity according to the characteristics of the duct was determinedby Equation (9), where D is the inner diameter of the tunnel, E is the elastic concrete modulus, and tc isthe lining thickness [21].
a =
√1
ρw((
1Kw
)+
(DλEtc
))
. (9)
Table 2. Geometric and hydraulic characteristics of the duct.
InnerDiameter
(m)
Thickness(mm)
HazenWilliams
Coefficient (-)
InitialDischarge
(m3/s)
Pressure WaveVelocity (m/s)
UpstreamHead (m)
Initial FlowVelocity
(m/s)
3.6 200 100 60 911 80 6
It was assumed that the lining could expand in the longitudinal direction, which results in a λ
(confinement coefficient) value of 1 [21].The location for investigating stresses in the rock was considered to be near the penstock (Node C)
in the tunnel path. Finally, the pressure values at this point, obtained by the Hammer software, wereinput to the Abaqus FEA, under hydrodynamic pressure loadings.
Fluids 2019, 4, 112 7 of 18
Table 3. Node elevations and properties of node E (turbine).
Elevations (m) Node Properties of Node E (Turbine)
The diameter of the spherical valve (m) 1.5A (inlet) 2305 Efficiency (%) 90
B 2263.1 Moment of inertia (N·m2) 107
C 2262.62 Speed (rpm) 580D 1753.5 Specific speed 115E 1714.9
In this study, the bearing capacity of the pressure tunnel under a steady-state condition wasinvestigated. The bearing capacity of a concrete-lined pressure tunnel is dependent either on the tensilestrength of the surrounding rock only, or both the concrete and the rock. Generally, in pressure tunnelsthat are excavated in intact rock, the concrete lining does not contribute to the stability of the tunnelduring excavation and only provides an appropriate bed for water to be conveyed toward the turbine.
Crack formation in the surrounding rock (hydraulic fracturing), due to high internal pressure,shows that the pressure tunnel reached its ultimate capacity; therefore, a parametric study wasperformed to investigate the impact of overburden height on the ultimate bearing capacity of thepressure tunnel in a steady-state condition. Figure 4 shows the effective parameters in the bearingcapacity of a tunnel. Pe(pi) is the water pressure on the outer surface of the concrete lining due toseepage. According to Equation (10), this parameter is dependent on internal pressure, and it wascalculated using the FEM in the present study [22].
Pe( pi) =pi
1 +
krln(
reri
)kcln( R
re )
, (10)
where t (thickness of the lining), k0, kr (hydraulic conductivity of the rock), and γr (specific weight ofthe rock) were considered constant for all analyses, and their values are presented in Table 4. Moreover,the values for Er, C, ϕ, and h are presented in Table 5.
Fluids 2019, 4, x FOR PEER REVIEW 8 of 18
In each analysis, the bearing capacity of the tunnel was determined by increasing the internal
pressure (pi) to the point at which the first crack was formed in the surrounding rock. In this situation,
the corresponding pi was considered as the failure threshold, which indicates the ultimate bearing
capacity of the tunnel.
Figure 4. Effective parameters in the parametric study.
2.4. Verification of the FEM
Tunsakul et al. (2014) investigated fracture propagation in a rock mass surrounding a tunnel,
under high internal pressure, in an experimental model [26]. In order to verify the numerical model
developed in the present study, an experiment with k0 = 0.5 was considered. Other assumptions based
on the experimental model were as follows: no concrete lining exists (t = 0); the surrounding rock is
impermeable (Pe(pi) = 0). According to Tunsakul et al. (2014), the cracking location depends on the
coefficient of lateral rock pressure (k0). When k0 < 1, cracking occurs in the crown of the tunnel, and,
for k0 ≥ 1, cracks form at the sides of the tunnel. The FEM results were in agreement with the findings
of Tunsakul et al. (2014), since cracks formed in the crown of the tunnel (Figure 5).
Figure 5. Comparing the formation and location of cracks in the numerical model (a) vs. the
experimental model by Tunsakul et al. (2014) (b).
3. Results and Discussion
3.1. Changes in Pore Pressure
Figure 4. Effective parameters in the parametric study.
Fluids 2019, 4, 112 8 of 18
Table 4. Constant values in present study.
Parameter Value
t (cm) 20k0 (-) 0.5
kr (m/s) 1 × 10⁻⁷
γr (kN) 28
Table 5. Parameters and their values in parametric analyses [23–25].
Parameter Range
Er (GPa) 2–10C (MPa) 0.635–1ϕ (◦) 27.57–35.47h (m) 10–40
In each analysis, the bearing capacity of the tunnel was determined by increasing the internalpressure (pi) to the point at which the first crack was formed in the surrounding rock. In this situation,the corresponding pi was considered as the failure threshold, which indicates the ultimate bearingcapacity of the tunnel.
2.4. Verification of the FEM
Tunsakul et al. (2014) investigated fracture propagation in a rock mass surrounding a tunnel,under high internal pressure, in an experimental model [26]. In order to verify the numerical modeldeveloped in the present study, an experiment with k0 = 0.5 was considered. Other assumptions basedon the experimental model were as follows: no concrete lining exists (t = 0); the surrounding rock isimpermeable (Pe(pi) = 0). According to Tunsakul et al. (2014), the cracking location depends on thecoefficient of lateral rock pressure (k0). When k0 < 1, cracking occurs in the crown of the tunnel, and,for k0 ≥ 1, cracks form at the sides of the tunnel. The FEM results were in agreement with the findingsof Tunsakul et al. (2014), since cracks formed in the crown of the tunnel (Figure 5).
Fluids 2019, 4, x FOR PEER REVIEW 8 of 18
In each analysis, the bearing capacity of the tunnel was determined by increasing the internal
pressure (pi) to the point at which the first crack was formed in the surrounding rock. In this situation,
the corresponding pi was considered as the failure threshold, which indicates the ultimate bearing
capacity of the tunnel.
Figure 4. Effective parameters in the parametric study.
2.4. Verification of the FEM
Tunsakul et al. (2014) investigated fracture propagation in a rock mass surrounding a tunnel,
under high internal pressure, in an experimental model [26]. In order to verify the numerical model
developed in the present study, an experiment with k0 = 0.5 was considered. Other assumptions based
on the experimental model were as follows: no concrete lining exists (t = 0); the surrounding rock is
impermeable (Pe(pi) = 0). According to Tunsakul et al. (2014), the cracking location depends on the
coefficient of lateral rock pressure (k0). When k0 < 1, cracking occurs in the crown of the tunnel, and,
for k0 ≥ 1, cracks form at the sides of the tunnel. The FEM results were in agreement with the findings
of Tunsakul et al. (2014), since cracks formed in the crown of the tunnel (Figure 5).
Figure 5. Comparing the formation and location of cracks in the numerical model (a) vs. the
experimental model by Tunsakul et al. (2014) (b).
3. Results and Discussion
3.1. Changes in Pore Pressure
Figure 5. Comparing the formation and location of cracks in the numerical model (a) vs. theexperimental model by Tunsakul et al. (2014) (b).
3. Results and Discussion
3.1. Changes in Pore Pressure
Since concrete is not completely impermeable, water passing through the pores penetrates into thesurrounding rock. The permeability of rock varies between 1 (completely permeable) and 10−12 m/s
Fluids 2019, 4, 112 9 of 18
(almost impermeable). Figure 6 shows a comparison between the pore pressures obtained fromthe numerical model and the value obtained from Bouvard’s and Pinto’s (1969) analytical solutions(Equation (10)) [22]. According to Figure 6, the pore pressure obtained using the analytical solution isgreater than the value obtained from the numerical solution.
Fluids 2019, 4, x FOR PEER REVIEW 9 of 18
Since concrete is not completely impermeable, water passing through the pores penetrates into
the surrounding rock. The permeability of rock varies between 1 (completely permeable) and 10−12
m/s (almost impermeable). Figure 6 shows a comparison between the pore pressures obtained from
the numerical model and the value obtained from Bouvard’s and Pinto’s (1969) analytical solutions
(Equation (10)) [22]. According to Figure 6, the pore pressure obtained using the analytical solution
is greater than the value obtained from the numerical solution.
The hydro-mechanical interaction is caused by jointing in rocks due to water pressure. As a
result, water penetration toward the rock increases, which consequently leads to more leakage from
the tunnel, and increases the pore pressure inside the rock joints. In analyses performed by Bouvard
and Pinto, it was assumed that the rock was a porous medium, without effective stresses due to
overburden rock. However, in the present numerical modeling, effective stresses due to overburden
rock, which reduce the pore pressure in the rock, were considered as important factors in the
simulation.
Figure 6. Numerical vs. analytical results for pore pressures in the rock.
3.2. Bearing Capacity of the Tunnel in Normal Operating Conditions (Steady-State Conditions)
Based on the mechanical characteristics of the rock, and using the Mohr–Coulomb failure
criterion, the failure of elements in the rock environment surrounding the tunnel was investigated.
In this regard, maximum and minimum principal stresses were calculated and are presented in
Figure 7. Since the problem was symmetric, half of the rock elements surrounding the tunnel were
investigated.
0
10
20
30
40
50
2 2.5 3 3.5 4 4.5
Po
re P
ress
ure
(k
Pa
)
Distance from the Center of the Tunnel (m)
Present Numerical Model
Analytical
0
0.5
1
1.5
2
2.5
3
-0.8 -0.6 -0.4 -0.2 0 0.2 0.4
Min
imu
m P
rin
cip
al S
tres
s (M
Pa
)
Minimum Principal Stress (MPa)
C = 0.635 MPa
Er = 2 GPa
φ = 27.57°
h = 10 m
Figure 6. Numerical vs. analytical results for pore pressures in the rock.
The hydro-mechanical interaction is caused by jointing in rocks due to water pressure. As a result,water penetration toward the rock increases, which consequently leads to more leakage from the tunnel,and increases the pore pressure inside the rock joints. In analyses performed by Bouvard and Pinto,it was assumed that the rock was a porous medium, without effective stresses due to overburden rock.However, in the present numerical modeling, effective stresses due to overburden rock, which reducethe pore pressure in the rock, were considered as important factors in the simulation.
3.2. Bearing Capacity of the Tunnel in Normal Operating Conditions (Steady-State Conditions)
Based on the mechanical characteristics of the rock, and using the Mohr–Coulomb failure criterion,the failure of elements in the rock environment surrounding the tunnel was investigated. In this regard,maximum and minimum principal stresses were calculated and are presented in Figure 7. Since theproblem was symmetric, half of the rock elements surrounding the tunnel were investigated.
In the Mohr–Coulomb failure criterion, the critical line divides the two-dimensional (2D) principalstresses into the safe zone (below the critical line), and the area where stresses cause failure in theelement (above the critical line). Due to water pressure on the lining, and the transmission of part ofthis pressure to the rock, tensile stresses appear around the tunnel. Figure 7 shows that the combinedstresses in elements surrounding the tunnel are located below the critical line, indicating that theseelements do not fail. In Figure 7, the elements located near the critical line are considered as criticalelements, which means higher water pressures will cause these elements to fail. Therefore, this internalpressure is the ultimate value that the rock can endure.
Fluids 2019, 4, 112 10 of 18
Fluids 2019, 4, x FOR PEER REVIEW 9 of 18
Since concrete is not completely impermeable, water passing through the pores penetrates into
the surrounding rock. The permeability of rock varies between 1 (completely permeable) and 10−12
m/s (almost impermeable). Figure 6 shows a comparison between the pore pressures obtained from
the numerical model and the value obtained from Bouvard’s and Pinto’s (1969) analytical solutions
(Equation (10)) [22]. According to Figure 6, the pore pressure obtained using the analytical solution
is greater than the value obtained from the numerical solution.
The hydro-mechanical interaction is caused by jointing in rocks due to water pressure. As a
result, water penetration toward the rock increases, which consequently leads to more leakage from
the tunnel, and increases the pore pressure inside the rock joints. In analyses performed by Bouvard
and Pinto, it was assumed that the rock was a porous medium, without effective stresses due to
overburden rock. However, in the present numerical modeling, effective stresses due to overburden
rock, which reduce the pore pressure in the rock, were considered as important factors in the
simulation.
Figure 6. Numerical vs. analytical results for pore pressures in the rock.
3.2. Bearing Capacity of the Tunnel in Normal Operating Conditions (Steady-State Conditions)
Based on the mechanical characteristics of the rock, and using the Mohr–Coulomb failure
criterion, the failure of elements in the rock environment surrounding the tunnel was investigated.
In this regard, maximum and minimum principal stresses were calculated and are presented in
Figure 7. Since the problem was symmetric, half of the rock elements surrounding the tunnel were
investigated.
0
10
20
30
40
50
2 2.5 3 3.5 4 4.5
Po
re P
ress
ure
(k
Pa
)
Distance from the Center of the Tunnel (m)
Present Numerical Model
Analytical
0
0.5
1
1.5
2
2.5
3
-0.8 -0.6 -0.4 -0.2 0 0.2 0.4
Min
imu
m P
rin
cip
al
Str
ess
(M
Pa
)
Minimum Principal Stress (MPa)
C = 0.635 MPa
Er = 2 GPa
φ = 27.57°
h = 10 m
Figure 7. The principal stresses in elements surrounding the tunnel, and their locations relative to thecritical line.
Considering the ultimate bearing capacity (PiU) obtained from the FEM, the Norwegian design
criterion (NC) was evaluated to determine the overburden required to prevent hydraulic fracturing,due to the internal static head in the pressure tunnel (Equation (11)).
h >γw·Hγr· cos β
, (11)
where h is the minimum overburden height to prevent hydraulic fracturing, H is the static water heightin the tunnel, β is the slope of the valley that is equal to zero in this study, and γw and γr are the specificgravities of water and rock, respectively. The NC estimated the ultimate bearing capacity of the tunnelas 28 m water (for γw = 10 kN, γr = 28 kN, and h = 10 m).
Figure 8 shows (a) the ultimate bearing capacity of the tunnel under a steady-state condition basedon the FEM results and the NC, (b) stress distribution in the rock, and (c) vertical displacements in therock. According to the FEM results, the internal pressure equal to 8.7 bar (87 m water) is the maximumbearing capacity of the tunnel. According to Figure 8d, at first, the concrete lining cracks, and thencracking occurs in the surrounding rock. Afterward, a parametric study was performed and the effectof overburden height on the bearing capacity of the tunnel was investigated (Figure 9 and Table 6).
Fluids 2019, 4, x FOR PEER REVIEW 10 of 18
Figure 7. The principal stresses in elements surrounding the tunnel, and their locations relative to the
critical line.
In the Mohr–Coulomb failure criterion, the critical line divides the two-dimensional (2D)
principal stresses into the safe zone (below the critical line), and the area where stresses cause failure
in the element (above the critical line). Due to water pressure on the lining, and the transmission of
part of this pressure to the rock, tensile stresses appear around the tunnel. Figure 7 shows that the
combined stresses in elements surrounding the tunnel are located below the critical line, indicating
that these elements do not fail. In Figure 7, the elements located near the critical line are considered
as critical elements, which means higher water pressures will cause these elements to fail. Therefore,
this internal pressure is the ultimate value that the rock can endure.
Considering the ultimate bearing capacity (PiU) obtained from the FEM, the Norwegian design
criterion (NC) was evaluated to determine the overburden required to prevent hydraulic fracturing,
due to the internal static head in the pressure tunnel (Equation (11)).
ℎ >��. �
��. cos�, (11)
where h is the minimum overburden height to prevent hydraulic fracturing, H is the static water
height in the tunnel, β is the slope of the valley that is equal to zero in this study, and γw and γr are
the specific gravities of water and rock, respectively. The NC estimated the ultimate bearing capacity
of the tunnel as 28 m water (for γw = 10 kN, γr = 28 kN, and h = 10 m).
Figure 8 shows (a) the ultimate bearing capacity of the tunnel under a steady-state condition
based on the FEM results and the NC, (b) stress distribution in the rock, and (c) vertical displacements
in the rock. According to the FEM results, the internal pressure equal to 8.7 bar (87 m water) is the
maximum bearing capacity of the tunnel. According to Figure 8d, at first, the concrete lining cracks,
and then cracking occurs in the surrounding rock. Afterward, a parametric study was performed and
the effect of overburden height on the bearing capacity of the tunnel was investigated (Figure 9 and
Table 6).
For validation of the results, an actual pressure tunnel project (Herlansfoss, Norway) was
considered. In this project, the rock surrounding the tunnel is made of non-cracked schist with a
friction angle equal to 30°. At chainages 150–200 m of the tunnel path, the tunnel is horizontal, with
overburden height and an internal pressure of 45 m and 136 m water, respectively. In this range, no
failure of the rock due to the internal pressure is observed [23]. The PiU values based on the FEM
results (Figure 9), the NC, and in the actual project, are equal to 138, 126, and 136 m water,
respectively, indicating that the FEM results are reliable. According to Table 6 and Figure 9, changes
in PiU with increasing the overburden height are more dependent on φ than E and C.
0
20
40
60
80
100
120
-0.4 -0.2 0 0.2 0.4 0.6
Inte
rnal
Pre
ssu
re (
m w
ate
r)
Maximum Principal Stress (MPa)
(a)
���= 87 m water (the FEM)
PiU = 28 m water
(the NC)
Figure 8. Cont.
Fluids 2019, 4, 112 11 of 18
Fluids 2019, 4, x FOR PEER REVIEW 11 of 18
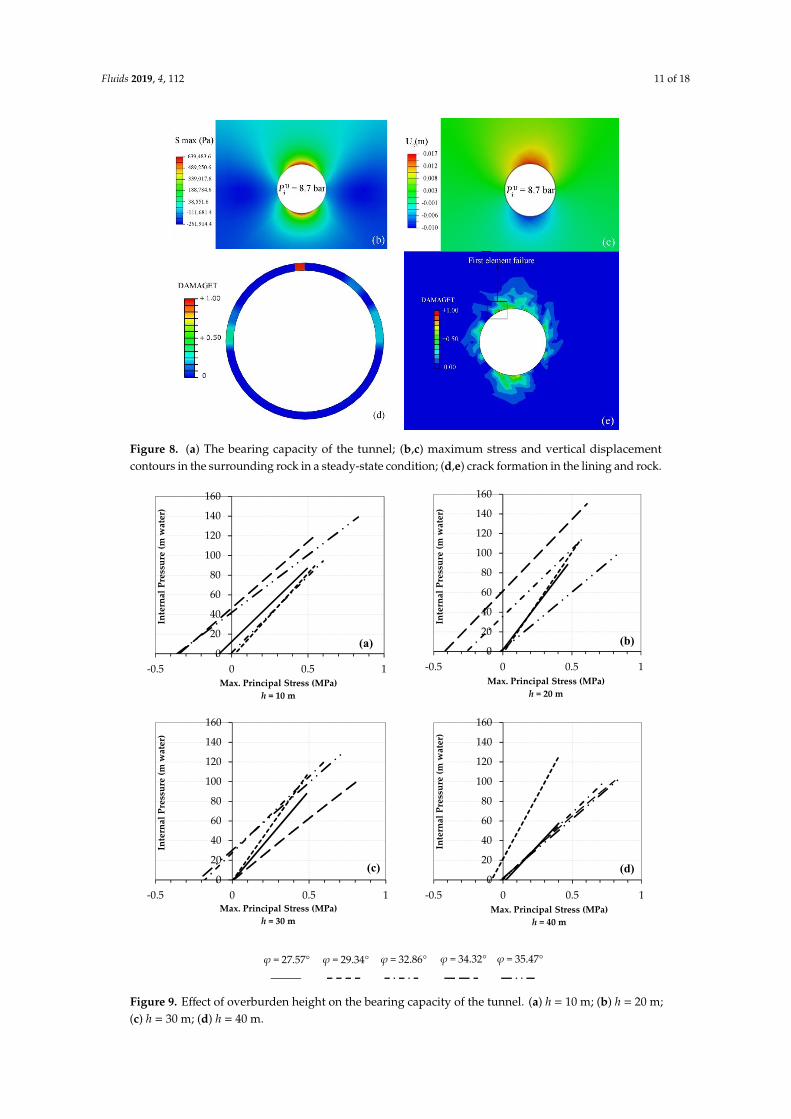
Figure 8. (a) The bearing capacity of the tunnel; (b,c) maximum stress and vertical displacement
contours in the surrounding rock in a steady-state condition; (d,e) crack formation in the lining and
rock.
Figure 9. Effect of overburden height on the bearing capacity of the tunnel. (a) h = 10 m; (b) h = 20 m;
Figure 8. (a) The bearing capacity of the tunnel; (b,c) maximum stress and vertical displacementcontours in the surrounding rock in a steady-state condition; (d,e) crack formation in the lining and rock.
Fluids 2019, 4, x FOR PEER REVIEW 11 of 18
Figure 8. (a) The bearing capacity of the tunnel; (b,c) maximum stress and vertical displacement
contours in the surrounding rock in a steady-state condition; (d,e) crack formation in the lining and
rock.
Figure 9. Effect of overburden height on the bearing capacity of the tunnel. (a) h = 10 m; (b) h = 20 m;
For validation of the results, an actual pressure tunnel project (Herlansfoss, Norway) wasconsidered. In this project, the rock surrounding the tunnel is made of non-cracked schist with a frictionangle equal to 30◦. At chainages 150–200 m of the tunnel path, the tunnel is horizontal, with overburdenheight and an internal pressure of 45 m and 136 m water, respectively. In this range, no failure of therock due to the internal pressure is observed [23]. The Pi
U values based on the FEM results (Figure 9),the NC, and in the actual project, are equal to 138, 126, and 136 m water, respectively, indicating thatthe FEM results are reliable. According to Table 6 and Figure 9, changes in Pi
U with increasing theoverburden height are more dependent on ϕ than E and C.
In this study, the NC estimated the ultimate bearing capacity of the concrete-lined tunnel with20 cm of the lining thickness and 3.6 m of diameter in intact rock, less than the value obtained from thenumerical model in most cases (Figure 10). According to Figure 10, for all friction angles, up to 30 mof overburden height, the NC estimated Pi
U less than the FEM. By increasing the overburden heightto values greater than 30 m, for all quantities of friction angles, Pi
U obtained from the FEM resultsapproached the value obtained from the NC. Therefore, the NC overestimates the overburden requiredto prevent hydraulic fracturing in pressure tunnels located near the ground surface (h ≤ 30 m).
Fluids 2019, 4, x FOR PEER REVIEW 12 of 18
Table 6. The ultimate bearing capacity of the tunnel (���), under different scenarios. FEM—finite
element model.
Scenario No. Er (MPa) h (m) C (MPa) φ (°) ��� (m) Based on the FEM
M-1 2177.94
10
0.635 27.57 87.3373
M-2 3076.42 0.701 29.34 87.2097
M-3 6138.26 0.851 32.86 93.5221
M-4 8185.51 0.929 34.32 120.7
M-5 10,304.94 1.003 35.47 138.62
M-6 2177.94
20
0.635 27.57 83.0878
M-7 3076.42 0.701 29.34 116.1696
M-8 6138.26 0.851 32.86 118.795
M-9 8185.51 0.929 34.32 114.442
M-10 10,304.94 1.003 35.47 100.166
M-11 3076.42
30
0.701 29.34 89.491
M-12 2177.94 0.635 27.57 110.301
M-13 6138.26 0.851 32.86 120.613
M-14 8185.51 0.929 34.32 100.115
M-15 10,304.94 1.003 35.47 119.295
M-16 2177.94
40
0.635 27.57 58.334
M-17 3076.42 0.701 29.34 126.234
M-18 6138.26 0.851 32.86 98.698
M-19 8185.51 0.929 34.32 100.362
M-20 10,304.94 1.003 35.47 101.633
In this study, the NC estimated the ultimate bearing capacity of the concrete-lined tunnel with
20 cm of the lining thickness and 3.6 m of diameter in intact rock, less than the value obtained from
the numerical model in most cases (Figure 10). According to Figure 10, for all friction angles, up to
30 m of overburden height, the NC estimated PiU less than the FEM. By increasing the overburden height to values greater than 30 m, for all quantities of friction angles, PiU obtained from the FEM
results approached the value obtained from the NC. Therefore, the NC overestimates the overburden
required to prevent hydraulic fracturing in pressure tunnels located near the ground surface (h ≤ 30
m).
Figure 10. Comparing PiU based on the finite element model (FEM) results, the Norwegian design
criterion (NC), and an actual pressure tunnel project, under steady-state conditions.
3.3. Applying Pressure Fluctuations in Transient-State Conditions
While the gate is being closed, the velocity upstream of the gate decreases, which results in a
pressure build-up in the tunnel. The maximum pressure occurs when the gate is fully closed. Figure
Figure 10. Comparing PiU based on the finite element model (FEM) results, the Norwegian design
criterion (NC), and an actual pressure tunnel project, under steady-state conditions.
Fluids 2019, 4, 112 13 of 18
3.3. Applying Pressure Fluctuations in Transient-State Conditions
While the gate is being closed, the velocity upstream of the gate decreases, which results in apressure build-up in the tunnel. The maximum pressure occurs when the gate is fully closed. Figure 11shows the pressure fluctuations upstream of the gate during the total time of hydraulic analysis. In thisstudy, it was assumed that the gate closure was done at a constant rate. Under sudden load rejection,which happens when the gate is closed quickly at a constant rate, critical conditions occur in thehydropower tunnel. This often occurs in special situations, such as a turbine generator shut downdue to an earthquake. If the gate is closed in several stages, with different closure rates, the maximumtransient pressure and the consequent damage to the lining will decrease.
Fluids 2019, 4, x FOR PEER REVIEW 13 of 18
11 shows the pressure fluctuations upstream of the gate during the total time of hydraulic analysis.
In this study, it was assumed that the gate closure was done at a constant rate. Under sudden load
rejection, which happens when the gate is closed quickly at a constant rate, critical conditions occur
in the hydropower tunnel. This often occurs in special situations, such as a turbine generator shut
down due to an earthquake. If the gate is closed in several stages, with different closure rates, the
maximum transient pressure and the consequent damage to the lining will decrease.
In this study, the maximum pressure that was reached after complete gate closure was
considered as the hydrodynamic load in the simulations; therefore, the rock resisted maximum water
pressure, and the probability of hydraulic fracturing increased. The pressure–time curves at three
different gate closure times are presented in Figure 12.
Figure 11. Pressure fluctuations upstream of the gate during the hydraulic analysis.
Figure 12. Changes in pressure upstream of the gate, in different scenarios: 14 s, 18 s, and 26 s.
Figure 12 shows that the curves have a rising trend. According to Figure 12, by increasing the
gate closure time, the maximum hydrodynamic pressure was reduced; during the first few seconds,
kinetic energy converts into pressure energy at a faster rate; during the last seconds of gate closure,
as water upstream of the gate reaches a steady-state condition, the pressure energy decreases.
Transferring these loads to the Abaqus FEA and employing the Mohr–Coulomb failure criterion, the
stresses in the rock elements surrounding the tunnel were calculated for different gate closure times,
and are presented in Figure 13. According to Figure 13, the stress in almost all of the elements is above
the critical line, which indicates that these elements failed. When the gate closes in 14 seconds,
hydrodynamic pressures impose greater forces on the surrounding rock. Increasing the gate closure
time decreases the pressures resulting from the transient-state condition. Figure 13c shows that some
elements are in the safe zone, which demonstrates that increasing the gate closure time decreases the
possibility of hydraulic fracturing in the rock.
75
80
85
90
95
100
0 2 4 6 8 10 12 14 16 18 20 22 24 26
Inte
rnal
Pre
ssu
re (
m w
ater
)
Closure Time (s)
Slow closure (26 s)
Normal closure (18 s)
Fast closure (14 s)
Figure 11. Pressure fluctuations upstream of the gate during the hydraulic analysis.
In this study, the maximum pressure that was reached after complete gate closure was consideredas the hydrodynamic load in the simulations; therefore, the rock resisted maximum water pressure,and the probability of hydraulic fracturing increased. The pressure–time curves at three different gateclosure times are presented in Figure 12.
Fluids 2019, 4, x FOR PEER REVIEW 13 of 18
11 shows the pressure fluctuations upstream of the gate during the total time of hydraulic analysis.
In this study, it was assumed that the gate closure was done at a constant rate. Under sudden load
rejection, which happens when the gate is closed quickly at a constant rate, critical conditions occur
in the hydropower tunnel. This often occurs in special situations, such as a turbine generator shut
down due to an earthquake. If the gate is closed in several stages, with different closure rates, the
maximum transient pressure and the consequent damage to the lining will decrease.
In this study, the maximum pressure that was reached after complete gate closure was
considered as the hydrodynamic load in the simulations; therefore, the rock resisted maximum water
pressure, and the probability of hydraulic fracturing increased. The pressure–time curves at three
different gate closure times are presented in Figure 12.
Figure 11. Pressure fluctuations upstream of the gate during the hydraulic analysis.
Figure 12. Changes in pressure upstream of the gate, in different scenarios: 14 s, 18 s, and 26 s.
Figure 12 shows that the curves have a rising trend. According to Figure 12, by increasing the
gate closure time, the maximum hydrodynamic pressure was reduced; during the first few seconds,
kinetic energy converts into pressure energy at a faster rate; during the last seconds of gate closure,
as water upstream of the gate reaches a steady-state condition, the pressure energy decreases.
Transferring these loads to the Abaqus FEA and employing the Mohr–Coulomb failure criterion, the
stresses in the rock elements surrounding the tunnel were calculated for different gate closure times,
and are presented in Figure 13. According to Figure 13, the stress in almost all of the elements is above
the critical line, which indicates that these elements failed. When the gate closes in 14 seconds,
hydrodynamic pressures impose greater forces on the surrounding rock. Increasing the gate closure
time decreases the pressures resulting from the transient-state condition. Figure 13c shows that some
elements are in the safe zone, which demonstrates that increasing the gate closure time decreases the
possibility of hydraulic fracturing in the rock.
75
80
85
90
95
100
0 2 4 6 8 10 12 14 16 18 20 22 24 26
Inte
rnal
Pre
ssu
re (
m w
ater
)
Closure Time (s)
Slow closure (26 s)
Normal closure (18 s)
Fast closure (14 s)
Figure 12. Changes in pressure upstream of the gate, in different scenarios: 14 s, 18 s, and 26 s.
Figure 12 shows that the curves have a rising trend. According to Figure 12, by increasingthe gate closure time, the maximum hydrodynamic pressure was reduced; during the first fewseconds, kinetic energy converts into pressure energy at a faster rate; during the last seconds of gateclosure, as water upstream of the gate reaches a steady-state condition, the pressure energy decreases.Transferring these loads to the Abaqus FEA and employing the Mohr–Coulomb failure criterion,the stresses in the rock elements surrounding the tunnel were calculated for different gate closuretimes, and are presented in Figure 13. According to Figure 13, the stress in almost all of the elements is
Fluids 2019, 4, 112 14 of 18
above the critical line, which indicates that these elements failed. When the gate closes in 14 seconds,hydrodynamic pressures impose greater forces on the surrounding rock. Increasing the gate closuretime decreases the pressures resulting from the transient-state condition. Figure 13c shows that someelements are in the safe zone, which demonstrates that increasing the gate closure time decreases thepossibility of hydraulic fracturing in the rock.Fluids 2019, 4, x FOR PEER REVIEW 14 of 18
Figure 13. Stress in the elements by closing the gate in (a) 14 s, (b) 18 s, and (c) 26 s.
3.3.1. The Effect of Increasing the Overburden Height on Preventing Hydraulic Fracturing
In order to investigate the impact of the overburden rock on hydraulic fracturing, the critical
gate closure time of 14 s was considered. In this regard, the failure of the elements in the rock around
the lining was investigated by considering the overburden height as 10, 20, 40, and 70 m. Figure 14
shows the stresses in these elements, with respect to the critical line, under different overburdens.
According to Figure 14, by increasing the overburden from 0.13H to 0.26H, stresses in some
elements are higher than the critical value; therefore, these elements are located above the critical
line. On the other hand, in some elements, stresses are less than the critical value, and they are located
below the critical line. By increasing the overburden to 0.26H, as expected, the risk of hydraulic
fracturing decreased as more elements appeared below the critical line. By increasing the overburden
to 0.53H, more elements appeared below the critical line, but a number of elements were still above
the critical line. For the case of an overburden equal to 0.93H, all elements appeared in the safe zone
below the critical line, since the elements on the sides of the tunnel section are under the influence of
stress concentration. As a result, they appear in the safe zone earlier than the other elements, due to
an increase in the overburden.
1
1.5
2
2.5
3
-0.6 -0.5 -0.4 -0.3 -0.2 -0.1 0 0.1 0.2 0.3 0.4
Min
imu
m P
rin
cip
al
Str
ess
(M
Pa
)
Minimum Principal Stress (MPa)
(b)
1
1.5
2
2.5
3
-0.6 -0.5 -0.4 -0.3 -0.2 -0.1 0 0.1 0.2 0.3 0.4
Min
imu
m P
rin
cip
al
Str
ess
(M
Pa
)
Minimum Principal Stress (MPa)
(a)
1
1.5
2
2.5
3
-0.6 -0.5 -0.4 -0.3 -0.2 -0.1 0 0.1 0.2 0.3 0.4
Min
imu
m P
rin
cip
al
Str
ess
(M
Pa
)
Minimum Principal Stress (MPa)
(c)
Figure 13. Stress in the elements by closing the gate in (a) 14 s, (b) 18 s, and (c) 26 s.
The Effect of Increasing the Overburden Height on Preventing Hydraulic Fracturing
In order to investigate the impact of the overburden rock on hydraulic fracturing, the critical gateclosure time of 14 s was considered. In this regard, the failure of the elements in the rock around thelining was investigated by considering the overburden height as 10, 20, 40, and 70 m. Figure 14 showsthe stresses in these elements, with respect to the critical line, under different overburdens.
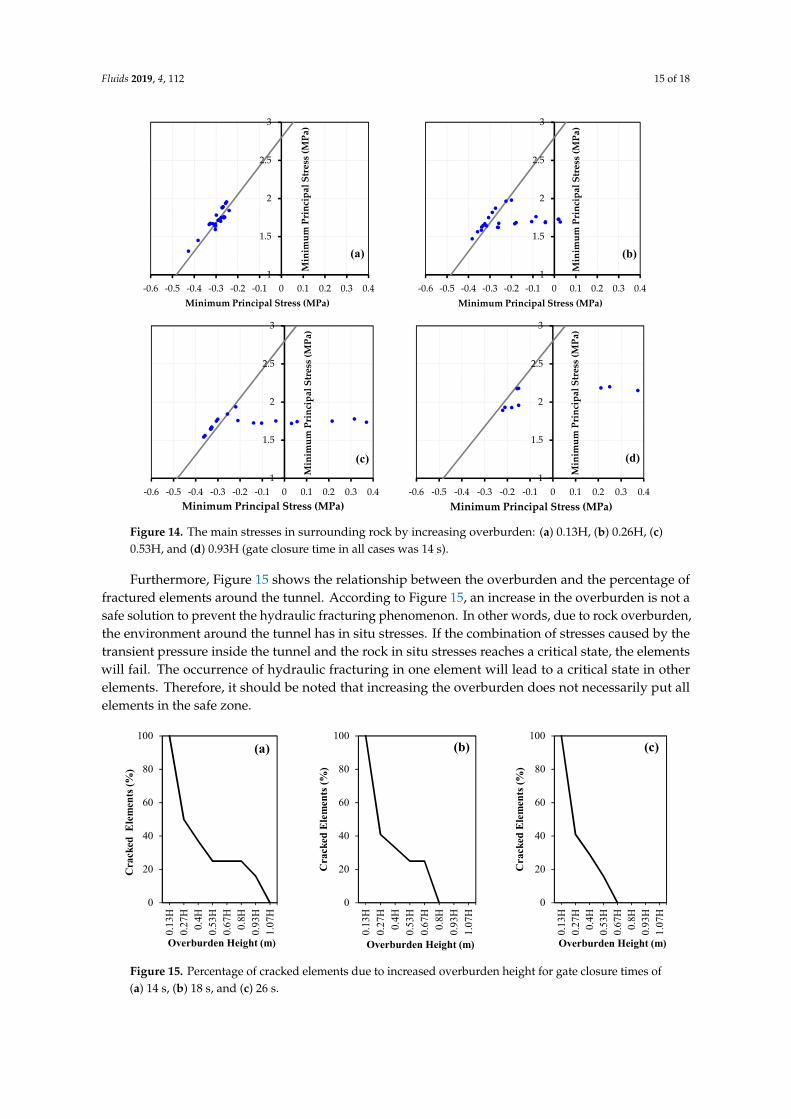
According to Figure 14, by increasing the overburden from 0.13H to 0.26H, stresses in someelements are higher than the critical value; therefore, these elements are located above the critical line.On the other hand, in some elements, stresses are less than the critical value, and they are located belowthe critical line. By increasing the overburden to 0.26H, as expected, the risk of hydraulic fracturingdecreased as more elements appeared below the critical line. By increasing the overburden to 0.53H,more elements appeared below the critical line, but a number of elements were still above the criticalline. For the case of an overburden equal to 0.93H, all elements appeared in the safe zone below thecritical line, since the elements on the sides of the tunnel section are under the influence of stressconcentration. As a result, they appear in the safe zone earlier than the other elements, due to anincrease in the overburden.
Fluids 2019, 4, 112 15 of 18
Fluids 2019, 4, x FOR PEER REVIEW 15 of 18
Figure 14. The main stresses in surrounding rock by increasing overburden: (a) 0.13H, (b) 0.26H, (c)
0.53H, and (d) 0.93H (gate closure time in all cases was 14 s).
Furthermore, Figure 15 shows the relationship between the overburden and the percentage of
fractured elements around the tunnel. According to Figure 15, an increase in the overburden is not a
safe solution to prevent the hydraulic fracturing phenomenon. In other words, due to rock
overburden, the environment around the tunnel has in situ stresses. If the combination of stresses
caused by the transient pressure inside the tunnel and the rock in situ stresses reaches a critical state,
the elements will fail. The occurrence of hydraulic fracturing in one element will lead to a critical state
in other elements. Therefore, it should be noted that increasing the overburden does not necessarily
put all elements in the safe zone.
Figure 15. Percentage of cracked elements due to increased overburden height for gate closure times
of (a) 14 s, (b) 18 s, and (c) 26 s.
1
1.5
2
2.5
3
-0.6 -0.5 -0.4 -0.3 -0.2 -0.1 0 0.1 0.2 0.3 0.4
Min
imu
m P
rin
cip
al
Str
ess
(M
Pa
)Minimum Principal Stress (MPa)
(a)
1
1.5
2
2.5
3
-0.6 -0.5 -0.4 -0.3 -0.2 -0.1 0 0.1 0.2 0.3 0.4
Min
imu
m P
rin
cip
al S
tre
ss (
MP
a)
Minimum Principal Stress (MPa)
(b)
1
1.5
2
2.5
3
-0.6 -0.5 -0.4 -0.3 -0.2 -0.1 0 0.1 0.2 0.3 0.4
Min
imu
m P
rin
cip
al
Str
ess
(M
Pa
)
Minimum Principal Stress (MPa)
(c)
1
1.5
2
2.5
3
-0.6 -0.5 -0.4 -0.3 -0.2 -0.1 0 0.1 0.2 0.3 0.4
Min
imu
m P
rin
cip
al
Str
ess
(M
Pa
)
Minimum Principal Stress (MPa)
(d)
0
20
40
60
80
100
0.13H
0.27
H
0.4H
0.53
H
0.67
H
0.8H
0.93
H
1.07
H
Cra
cked
Ele
men
ts (
%)
Overburden Height (m)
(a)
0
20
40
60
80
100
0.13
H
0.27
H
0.4H
0.53
H
0.67
H
0.8H
0.93
H
1.07
H
Cra
cked
Ele
men
ts (
%)
Overburden Height (m)
(b)
0
20
40
60
80
100
0.13
H
0.27
H
0.4H
0.53
H
0.67
H
0.8H
0.93
H
1.07
H
Cra
cked
Ele
men
ts (
%)
Overburden Height (m)
(c)
Figure 14. The main stresses in surrounding rock by increasing overburden: (a) 0.13H, (b) 0.26H, (c)0.53H, and (d) 0.93H (gate closure time in all cases was 14 s).
Furthermore, Figure 15 shows the relationship between the overburden and the percentage offractured elements around the tunnel. According to Figure 15, an increase in the overburden is not asafe solution to prevent the hydraulic fracturing phenomenon. In other words, due to rock overburden,the environment around the tunnel has in situ stresses. If the combination of stresses caused by thetransient pressure inside the tunnel and the rock in situ stresses reaches a critical state, the elementswill fail. The occurrence of hydraulic fracturing in one element will lead to a critical state in otherelements. Therefore, it should be noted that increasing the overburden does not necessarily put allelements in the safe zone.
Fluids 2019, 4, x FOR PEER REVIEW 15 of 18
Figure 14. The main stresses in surrounding rock by increasing overburden: (a) 0.13H, (b) 0.26H, (c)
0.53H, and (d) 0.93H (gate closure time in all cases was 14 s).
Furthermore, Figure 15 shows the relationship between the overburden and the percentage of
fractured elements around the tunnel. According to Figure 15, an increase in the overburden is not a
safe solution to prevent the hydraulic fracturing phenomenon. In other words, due to rock
overburden, the environment around the tunnel has in situ stresses. If the combination of stresses
caused by the transient pressure inside the tunnel and the rock in situ stresses reaches a critical state,
the elements will fail. The occurrence of hydraulic fracturing in one element will lead to a critical state
in other elements. Therefore, it should be noted that increasing the overburden does not necessarily
put all elements in the safe zone.
Figure 15. Percentage of cracked elements due to increased overburden height for gate closure times
of (a) 14 s, (b) 18 s, and (c) 26 s.
1
1.5
2
2.5
3
-0.6 -0.5 -0.4 -0.3 -0.2 -0.1 0 0.1 0.2 0.3 0.4
Min
imu
m P
rin
cip
al
Str
ess
(M
Pa
)
Minimum Principal Stress (MPa)
(a)
1
1.5
2
2.5
3
-0.6 -0.5 -0.4 -0.3 -0.2 -0.1 0 0.1 0.2 0.3 0.4
Min
imu
m P
rin
cip
al
Str
ess
(M
Pa
)
Minimum Principal Stress (MPa)
(b)
1
1.5
2
2.5
3
-0.6 -0.5 -0.4 -0.3 -0.2 -0.1 0 0.1 0.2 0.3 0.4
Min
imu
m P
rin
cip
al
Str
ess
(M
Pa
)
Minimum Principal Stress (MPa)
(c)
1
1.5
2
2.5
3
-0.6 -0.5 -0.4 -0.3 -0.2 -0.1 0 0.1 0.2 0.3 0.4
Min
imu
m P
rin
cip
al
Str
ess
(M
Pa
)
Minimum Principal Stress (MPa)
(d)
0
20
40
60
80
100
0.13
H
0.27
H
0.4H
0.53
H
0.67
H
0.8H
0.93
H
1.07
H
Cra
cked
Ele
men
ts (
%)
Overburden Height (m)
(a)
0
20
40
60
80
100
0.13
H
0.27
H
0.4H
0.53
H
0.67
H
0.8H
0.93
H
1.07
H
Cra
cked
Ele
men
ts (
%)
Overburden Height (m)
(b)
0
20
40
60
80
100
0.13
H
0.27
H
0.4H
0.53
H
0.67
H
0.8H
0.93
H
1.07
H
Cra
cked
Ele
men
ts (
%)
Overburden Height (m)
(c)
Figure 15. Percentage of cracked elements due to increased overburden height for gate closure times of(a) 14 s, (b) 18 s, and (c) 26 s.
Fluids 2019, 4, 112 16 of 18
4. Conclusions
Different aspects of hydraulic fracturing in pressure tunnels were investigated in previous studies,and various strategies were proposed to prevent this serious issue. One strategy is to increase theheight of overburden rock. In the present study, using the FEM, and considering the fluid–structureinteractions, a pressure tunnel with an inner diameter of 3.6 m was modeled in intact elasto-plastic rock,and the Mohr–Coulomb failure criterion was employed to investigate failure in the rock environmentsurrounding the tunnel. A parametric study was performed to evaluate the bearing capacity of thetunnel, and the effect of transient pressure on the failure of the rock elements around the tunnel wasinvestigated. Moreover, the applicability of the Norwegian design criterion was evaluated. Hydraulicanalyses in transient hydraulic states were performed using Hammer software. The output of this software,including pressure–time values, were used in Abaqus FEA in order to analyze stresses in the rock.
The results showed the following:
• Firstly, the concrete lining cracked, and then the elements in the surrounding rock failed;• Initial cracks were formed in the crown of the tunnel;• Increasing the overburden height had a less significant impact than a higher friction angle of the
rock, on preventing the hydraulic fracturing of the rock elements;• The Norwegian design criterion is not an appropriate measure to prevent hydraulic fracturing in
pressure tunnels with a typical diameter of about 3 m in intact rock with an approximate specificweight of 28 kN, and low overburden height (h ≤ 30 m);
• The rate of gate closure is a significant factor causing damage to the tunnel’s structure;• Increasing the gate closure time caused the maximum hydrodynamic pressure to decrease upstream
of the gate, which resulted in a fewer number of failed elements in the rock around the tunnel;• Maximum transient pressures occurred in the early stages of gate closure and, consequently,
hydraulic fracturing occurred during that time;• Analyses of the effects of different overburden heights indicated that increasing the overburden
height would not always decrease the fracturing of rock elements;• Based on the Mohr–Coulomb failure criterion results, by increasing the overburden height, fewer
elements in the rock environment surrounding the tunnel failed, which can be attributed to thecombination of principal stresses.
In order to prevent hydraulic fracturing in the rock, construction of a grouted zone around thepressure tunnel, along with increasing the overburden height, is recommended. The grout integratesthe rock, in case any cracks exist, and improves its mechanical properties. In addition, the groutedzone results in decreased pore pressure in the rock, and reduces the possibility of hydraulic fracturing.
Author Contributions: Conceptualization, M.K. (Karakouzian), M.K. (Karami) and M.N.-S.; methodology, M.K.(Karakouzian), M.K. (Karami) and M.N.-S.; software, M.K. (Karami) and M.N.-S.; validation, M.K. (Karami) andM.N.-S.; writing—original draft preparation, M.N.-S. and M.K. (Karami); writing—review and editing, M.N.-S.;supervision, M.K. (Karakouzian).
Funding: This research received no external funding.
Conflicts of Interest: The authors declare no conflicts of interest.
Appendix A
Grid and Boundary Sensitivity Analyses
Based on a trial-and-error procedure, a grid sensitivity analysis was performed in the model,in order to ensure convergence of the finite element equations, and the optimum pattern of meshingwas determined. The mesh sizes used near the tunnel cross-section were smaller than those near themodel boundaries (Figure 2).
Fluids 2019, 4, 112 17 of 18
Moreover, a sensitivity analysis was performed on the side boundaries of the model. According toFigure A1, for x ≥ 6D (D is the tunnel diameter) the side boundaries do not affect stresses in the rockenvironment surrounding the tunnel. In order to ensure preventing errors in the model calculations,this distance was considered twice the value obtained from grid sensitivity analysis (Figure 2).
Fluids 2019, 4, x FOR PEER REVIEW 17 of 18
Moreover, a sensitivity analysis was performed on the side boundaries of the model. According
to Figure A1, for x ≥ 6D (D is the tunnel diameter) the side boundaries do not affect stresses in the
rock environment surrounding the tunnel. In order to ensure preventing errors in the model
calculations, this distance was considered twice the value obtained from grid sensitivity analysis
(Figure 2).
Figure A1. Sensitivity analysis on the model boundaries: (a) changes in stress in the rock environment,
vertically; (b) changes in stress in the rock environment, horizontally; x is the distance from the tunnel
lining, σH is the horizontal stress in the rock, σV is the vertical stress in the rock, PH is the initial
horizontal stress in the rock, and PV is the initial vertical stress in the rock.
References
1. Schleiss, A.J. Design of pervious pressure tunnels. Int. Water Power Dam Constr. 1986, 38, 21–26.
2. Fernández, G.; Alvarez, T.A., Jr. Seepage-induced effective stresses and water pressures around pressure
tunnels. J. Geotech.Eng. 1994, 120, 108–128, doi:10.1061/(ASCE)0733-9410(1994)120:1(108).
3. Bobet, A.; Nam, S.W. Stresses around pressure tunnels with semi-permeable liners. Rock Mech. Rock Eng.
2007, 40, 287–315, doi:10.1007/s00603-006-0123-6.
4. Hachem, F.E.; Schleiss, A.J. A review of wave celerity in frictionless and axisymmetrical steel-lined pressure
tunnels. J. Fluids Struct. 2011, 27, 311–328, doi:10.1016/j.jfluidstructs.2010.11.009.
5. Olumide, B.A.; Marence, M. Finite element model for optimum design of plain concrete pressure tunnels
under high internal pressure. Int. J. Sci. Technol. 2012, 1, 216–223.
6. Simanjuntak, T.D.Y.F.; Marence, M.; Mynett, A.E.; Schleiss, A.J. Pressure tunnels in non-uniform in situ
stress conditions. Tunnell. Undergr. Space Technol. 2014, 42, 227–236, doi:10.1016/j.tust.2014.03.006.
7. Zhou, Y.; Su, K.; Wu, H. Hydro-mechanical interaction analysis of high pressure hydraulic tunnel. Tunnell.
Undergr. Space Technol. 2015, 47, 28–34, doi:10.1016/j.tust.2014.12.004.
8. Pachoud, A.J.; Schleiss, A.J. Stresses and displacements in steel-lined pressure tunnels and shafts in
anisotropic rock under quasi-static internal water pressure. Rock Mech. Rock Eng. 2016, 49, 1263–1287,
doi:10.1007/s00603-015-0813-z.
9. Zareifard, M.R. An analytical solution for design of pressure tunnels considering seepage loads. Appl. Math.
14. Chopra, A. Dynamic of Structures, 4th ed.; Pearson Prentice Hall: Upper Saddle River, NJ, USA, 2012.
15. Uchida, Y.; Kurihara, N.; Rokugo, K.; Koyanagi, W. Determination of tension softening diagrams of various
kinds of concrete by means of numerical analysis. Fract. Mech. Concr. Struct. 1995, 1, 17–30.
Figure A1. Sensitivity analysis on the model boundaries: (a) changes in stress in the rock environment,vertically; (b) changes in stress in the rock environment, horizontally; x is the distance from the tunnellining, σH is the horizontal stress in the rock, σV is the vertical stress in the rock, PH is the initialhorizontal stress in the rock, and PV is the initial vertical stress in the rock.
References
1. Schleiss, A.J. Design of pervious pressure tunnels. Int. Water Power Dam Constr. 1986, 38, 21–26.2. Fernández, G.; Alvarez, T.A., Jr. Seepage-induced effective stresses and water pressures around pressure
tunnels. J. Geotech. Eng. 1994, 120, 108–128. [CrossRef]3. Bobet, A.; Nam, S.W. Stresses around pressure tunnels with semi-permeable liners. Rock Mech. Rock Eng.
2007, 40, 287–315. [CrossRef]4. Hachem, F.E.; Schleiss, A.J. A review of wave celerity in frictionless and axisymmetrical steel-lined pressure
tunnels. J. Fluids Struct. 2011, 27, 311–328. [CrossRef]5. Olumide, B.A.; Marence, M. Finite element model for optimum design of plain concrete pressure tunnels
under high internal pressure. Int. J. Sci. Technol. 2012, 1, 216–223.6. Simanjuntak, T.D.Y.F.; Marence, M.; Mynett, A.E.; Schleiss, A.J. Pressure tunnels in non-uniform in situ stress
conditions. Tunnell. Undergr. Space Technol. 2014, 42, 227–236. [CrossRef]7. Zhou, Y.; Su, K.; Wu, H. Hydro-mechanical interaction analysis of high pressure hydraulic tunnel.
Tunnell. Undergr. Space Technol. 2015, 47, 28–34. [CrossRef]8. Pachoud, A.J.; Schleiss, A.J. Stresses and displacements in steel-lined pressure tunnels and shafts in anisotropic
rock under quasi-static internal water pressure. Rock Mech. Rock Eng. 2016, 49, 1263–1287. [CrossRef]9. Zareifard, M.R. An analytical solution for design of pressure tunnels considering seepage loads. Appl. Math.
Model. 2018, 62, 62–85. [CrossRef]10. Jia, B.; Tsau, J.S.; Barati, R. A review of the current progress of CO2 injection EOR and carbon storage in shale
oil reservoirs. Fuel 2019, 236, 404–427. [CrossRef]11. Simulia. ABAQUS Theory Manual; Dassault Systèmes: Providence, RI, USA, 2012.12. Bentley Systems. HAMMER V8i User’s Guide. Available online: https://www.bentley.com/en/products/
product-line/hydraulics-and-hydrology-software/hammer (accessed on 15 January 2019).13. Gasch, T.; Facciolo, L.; Eriksson, D.; Rydell, C.; Malm, R. Seismic Analyses of Nuclear Facilities With Interaction
Between Structure and Water: Comparison between Methods to Account for Fluid-Structure-Interaction (FSI); Elforsk:Frederiksberg, Denmark, 2013.
14. Chopra, A. Dynamic of Structures, 4th ed.; Pearson Prentice Hall: Upper Saddle River, NJ, USA, 2012.15. Uchida, Y.; Kurihara, N.; Rokugo, K.; Koyanagi, W. Determination of tension softening diagrams of various
kinds of concrete by means of numerical analysis. Fract. Mech. Concr. Struct. 1995, 1, 17–30.16. Lee, J.; Fenves, G.L. Plastic-damage model for cyclic loading of concrete structures. J. Eng. Mech. 1998, 124, 892–900.
17. Karami, M.; Kabiri-Samani, A.; Nazari-Sharabian, M.; Karakouzian, M. Investigating the effects of transientflow in concrete-lined pressure tunnels, and developing a new analytical formula for pressure wave velocity.Tunnell. Undergr. Space Technol. 2019, 91, 102992. [CrossRef]
18. Karakouzian, M.; Karami, M.; Nazari-Sharabian, M.; Ahmad, S. Flow-induced stresses and displacements injointed concrete pipes installed by pipe jacking method. Fluids 2019, 4, 34. [CrossRef]
19. Jaeger, J.C.; Cook, N.G.W.; Zimmerman, R.W. Fundamentals of Rock Mechanics, 4th ed.; Blackwell Publishing:Hoboken, NJ, USA, 2007.
20. Williams, O. Engineering and Design—Tunnels and Shafts in Rock; US Army Corps of Engineers: Washington,DC, USA, 1997.
21. Halliwell, A.R. Velocity of a water-hammer wave in an elastic pipe. J. Hydraul. Div. 1963, 89, 121.22. Bouvard, M.; Pinto, N. Aménagement Capivari-Cachoeira étude du puits en charge. La Houille Blanche
1969, 7, 747–760. [CrossRef]23. Brekke, T.L.; Ripley, B.D. Design of pressu.re tunnels and shafts. Anal. Design Methods 1995, 349–369.
[CrossRef]24. Hoek, E.; Carranza-Torres, C.; Corkum, B. Hoek-Brown failure criterion—2002 edition. Proc. NARMS-Tac
2002, 1, 267–273.25. RocLab, Rocscience Inc. Available online: https://www.rocscience.com/ (accessed on 15 January 2019).26. Tunsakul, J.; Jongpradist, P.; Soparat, P.; Kongkitkul, W.; Nanakorn, P. Analysis of fracture propagation
in a rock mass surrounding a tunnel under high internal pressure by the element-free Galerkin method.Comp. Geotechnol. 2014, 55, 78–90. [CrossRef]