NASA TECHNICAL NOTE CO C NASA TN D-7293 EFFECT OF PRIMARY-ZONE WATER INJECTION ON POLLUTANTS FROM A COMBUSTOR BURNING LIQUID ASTM A-l AND VAPORIZED PROPANE FUELS by Robert D. Ingebo and Carl T. Norgren Lewis Research Center Cleveland, Ohio 44135 NATIONAL AERONAUTICS AND SPACE ADMINISTRATION • WASHINGTON, D. C. • MAY 1973 https://ntrs.nasa.gov/search.jsp?R=19730015216 2018-07-05T11:56:03+00:00Z
Transcript
NASA TECHNICAL NOTE
CO
C
NASA TN D-7293
EFFECT OF PRIMARY-ZONEWATER INJECTION ON POLLUTANTSFROM A COMBUSTOR BURNING LIQUIDASTM A-l AND VAPORIZED PROPANE FUELS
by Robert D. Ingebo and Carl T. Norgren
Lewis Research Center
Cleveland, Ohio 44135
NATIONAL AERONAUTICS AND SPACE ADMINISTRATION • WASHINGTON, D. C. • MAY 1973
NASA TN D-72934. Title and Subtitle EFFECT OF PRIMARY-ZONE WATER
INJECTION ON POLLUTANTS FROM A COMBUSTOR BURNINGLIQUID ASTM A-l AND VAPORIZED PROPANE FUELS
7. Author(s)
Robert D. Ingebo and Carl T. Norgren
9. Performing Organization Name and Address
Lewis Research CenterNational Aeronautics and Space AdministrationCleveland, Ohio 44135
12. Sponsoring Agency Name and Address
National Aeronautics and Space AdministrationWashington, D. C. 20546
3. Recipient's Catalog No.
5. Report DateMay 1973
6. Performing Organization Code
8. Performing Organization Report No.
E-735510. Work Unit No.
501-2411. Contract or Grant No.
13. Type of Report and Period Covered
Technical Note14. Sponsoring Agency Code
15. Supplementary Notes
16. Abstract
A combustor segment 0. 457 meter (18 in. ) long with a maximum cross section of 0. 153 by0. 305 meter (6 by 12 in. ) was operated at inlet-air temperatures of 590 and 700 K (1060° and1260° R), inlet-air pressures of 4 and 10 atmospheres, and fuel-air ratios of 0. 014 and 0. 018to determine the effect of primary- zone water injection on pollutants from burning eitherpropane or ASTM A-l fuel. At a simulated takeoff condition of 10 atmospheres and 700 K .(1260° R), multiple-orifice nozzles used to inject water at 1 percent of the airflow rate reducednitrogen oxides 75 percent with propane and 65 percent with ASTM A-l fuel. Although carbonmonoxide and unburned hydrocarbons increased with water injection, they remained relativelylow; and smoke numbers were well below the visibility limit.
17. Key Words (Suggested by Author(s)) 18. Distribution Statement
19. Security Classif. (of this report) 20. Security Classif. (of this page)
Unclassified Unclassified21. No. of Pages 22. Price*
18 $3.00
' For sale by the National Technical Information Service, Springfield, Virginia 22151
. EFFECT OF PRIMARY-ZONE WATER INJECTION ON POLLUTANTS
FROM A COMBUSTOR BURNING LIQUID ASTM A-l AND
VAPORIZED PROPANE FUELS
by Robert D. Ingebo and Carl T. Norgren
Lewis Research Center
SUMMARY
To determine the effect of primary-zone water injection on pollutant emissions, acombustor segment was operated with vaporized propane and ASTM A-l fuels for com-parison. The rectangular combustor segment was 0.457 meter (18 in.) in length includ-ing the diffuser, with a maximum combustor cross section of 0.153 by 0.305 meter (6by 12 in.). A snout area of 40 percent of the combustor open area was used to admit airinto the combustor primary zone.
Test conditions included fuel-air ratios of 0. 014 and 0.018, inlet-air temperaturesof 590 and 700 K (1060° and 1260° R), and inlet-air pressures of 4 and 10 atmospheres.Without water injection, combustion efficiency varied from 96 percent to near 100 per-cent with either vaporized propane or liquid ASTM A-l fuel. The effect of primary-zonewater injection on combustion efficiency was relatively small as determined from gasanalysis data.
With primary-zone water injection at a rate of 1 percent of the airflow rate, agreater effect on pollutant emissions was obtained with vaporized propane than withliquid ASTM A-1 fuel. In both cases, nitrogen oxides markedly decreased, whereascarbon monoxide and unburned hydrocarbons increased. The NCL. emission index,
X
g NOgAg fuel, decreased from 16. 6 to 4.4 (or 75 percent) with vaporized propane andfrom 18.0 to 6. 0 (or 65 percent) with liquid ASTM A-l fuel, at an inlet-air temperatureof 700 K (1260° R) and a pressure of 10 atmospheres. Although appreciable changes incarbon monoxide, unburned hydrocarbons, and smoke number occurred, initial valueswithout water injection were quite low. Thus, the values obtained with primary-zonewater injection remained relatively low.
Primary-zone water injection proved more effective in decreasing NOX emissionwhen inlet-air temperature was increased from 590 to 700 K (1060° to 1260° R): 8 and13 percent more effective with vapor and liquid fuels, respectively. However, the effectof primary-zone water injection on NCL. emission with liquid ASTM A-l fuel did not ap-
X
preciably change when inlet-air pressure was increased from 4 to 10 atmospheres.
INTRODUCTION
The effect'of primary-zone water injection on pollutant emissions from a combustorsegment was investigated by injecting water through a multiple-orifice fuel nozzle di-rectly into the primary zone. Water injection tests were made by burning vaporizedpropane and liquid ASTM A-1 fuels.
The present trend in developing advanced turbojet engines is to increase compres-sor pressure ratio, which correspondingly increases the combustor inlet-air tempera-ture and pressure (ref. 1). Increasing the combustor inlet-air temperature causes theprimary-zone flame temperature to rise, which increases the rate of formation ofnitrogen oxides (NO ). Also, there is an additional increase in the formation of nitrogen
X.
oxides with increasing combustor pressure, particularly when the equivalence ratio isnear unity in the primary zone (ref. 2). Thus, there is an urgent need to developmethods of markedly reducing the formation of nitrogen oxides at their point of origin inthe primary zone of the combustor.
Various techniques have been used to reduce the formation of nitrogen oxides in theprimary zone. In reference 3, specially designed air-atomizing fuel nozzles weretested and, combustor pollutant emissions were compared with those obtained when con-ventional pressure-atomizing fuel nozzles were used. A splash-cone air-atomizing fuelnozzle gave approximately 30 percent less nitric oxide than the pressure-atomizingnozzle, at a combustor pressure of 20 atmospheres and an inlet-air temperature of590 K (1060° R). Also, preliminary studies with air-atomizing fuel nozzles in swirl-cancombustor modules have shown considerable promise in reducing the formation of nitro-gen oxides at 4 atmospheres pressure and high inlet-air temperature (ref. 4).
Methods have been recently proposed to reduce the flame temperature and therebydecrease nitrogen oxides by either adding steam to the compressor discharge air orinjecting water directly into the combustor primary zone. In reference 5, it was foundthat a primary-zone water injection rate of 2 percent of the airflow reduced nitrogenoxides by approximately 75 percent, whereas the same rate of steam addition to thecompressor discharge air reduced nitrogen oxides by approximately 50 percent. Thus,primary-zone water injection was found to be considerably more effective in reducingnitrogen oxides than upstream steam addition, which causes a considerable portion ofthe water vapor to enter the secondary zone. A similar result was obtained in refer-ence 6. Also, it was found that both primary-zone water injection and upstream steamaddition tended to increase the rate of formation of carbon monoxide (CO) and unburnedhydrocarbons.
To evaluate the effect of primary-zone water injection on pollutant emissions, acombustor segment 0.457 meter (18 in.) long with a maximum cross section of 0.153 by0.305 meter (6 by 12 in.) was operated at inlet-air conditions of 590 and 700 K (1060°
and 1260° R), inlet-air pressures of 4 and 10 atmospheres, fuel-air ratios of 0.014and 0.018, and a reference velocity of 21.3 meter per second (70 ft/sec). The followingpollutants were determined with and without water injection: exhaust smoke number andemission indices for nitrogen oxides, carbon monoxide, and unburned hydrocarbons.Both ASTM A-l and propane fuels were used. However, the results were not directlycomparable since different techniques of water injection were used with the two fuels.Also, combustion efficiency data were obtained without water injection, and combustioninefficiency was calculated with and without water injection from gas analysis data.
APPARATUS AND PROCEDURE
The test facility is schematically shown in figure 1 and is described in detail inreference 7. Combustion air containing 0.03 percent water vapor by weight was drawnfrom the laboratory high-pressure supply system and indirectly heated to 700 K(1260° R) in a counterflow U-tube heat exchanger. The combustor inlet-air temperaturewas automatically controlled by mixing the heated air with varying amounts of bypassedair. Airflow rates and inlet-air pressure were regulated with the remote-controlvalves.
Test Section
The counterflow high-pressure test section shown in figure 1 was designed to pre-vent an accumulation of fuel in the housing as a safety precaution in the event of a fuelleak. Combustion air flowing through the outer annular passage and reversing directionthrough the inner annular passage was deflected by the dome into the bellmouth, whichprovided uniform airflow distribution at the diffuser inlet.
Test Combustor
The rectangular combustor segment shown in figure 2 simulated an annular com-bustor design with an overall length of 0. 457 meter (18 in.), consisting of a diffuserlength of 0.140 meter (5. 5 in.) and a burner length of 0.317 meter (12.5 in.). The com-bustor cross section was 0. 053 by 0.305 meter (2.1 by 12 in.) at the diffuser inlet,0.153 by 0.305 meter (6 by 12 in.) at the midsection, and 0. 051 by 0.305 meter (2 by12 in.) at the exit. The open area of the diffuser snout was 40 percent of the combustorinlet area. In reference 7, airflow in the combustor primary and secondary mixing
zones is described in detail for the configuration used in this investigation.The liquid jet fuel conforming to ASTM A-l specifications and the vaporized propane
had average hydrogen-carbon ratios of 0.161 and 0. 220, respectively, and lower heatingvalues of 43 000 and 46 200 joules per gram (18 600 and 19 927 Btu/lb), respectively.Ignition was obtained with a capacitor ignitor with a maximum energy of 12 joules.
Multiple-orifice atomizers. - The specially designed multiple-orifice nozzle con-figuration shown in figure 3, with an attached flow distributor and air swirler, was usedto inject fuel and water into the combustor primary zone. In liquid fuel tests, as shownin figure 2, ASTM A-l fuel injected through the pressure-atomizing nozzle in the centerof the atomizer was surrounded by eight water jets, which were broken up by the swirl-ing airstream. In the propane tests, water atomized by the pressure-atomizing nozzlewas surrounded by eight jets of vaporized propane. The spray angle of the pressure-atomizing nozzle was approximately 90°. Variation in flow rate with pressure drop isgiven in table I for the two fuels and water.
Instrumentation and Data Acquisition
Combustor instrumentation stations are shown schematically in figure 2, and de-tailed locations are given in reference 7. Inlet-air total temperature and pressure weremeasured at station 1 in the diffuser inlet with four stationary rakes consisting of twoChromel-Alumel thermocouples and three total-pressure tubes, respectively, in eachrake. Wall static-pressure taps were centrally located in the top and bottom of the dif-fuser inlet. Combustor exhaust temperature and pressure measurements and smokesamples were obtained with the probe by traversing the combustor exit at station 2. Asshown in figure 4, the probe consisted of 12 elements: five aspirating platinum/platinum-13-percent-rhodium thermocouples, five total-pressure tubes, and two wedge-shaped static-pressure tubes. Smoke samples were withdrawn through the aspiratingthermocouple lines. Incremental travel and dwell time of the probe were automaticallycontrolled. Combustor exit temperature and pressure data were recorded every1.27 centimeters (0.5 in.) of travel at 23 locations across the combustor exhaust.
Sharp-edged orifices installed according to ASME specifications were used to meas-ure airflow rates. ASTM A-l, liquid propane, and water flow rates were measuredwith pairs of turbine flowmeters connected in series to crosscheck their accuracy.Three pairs of flowmeters were required to cover the flow range of each liquid. Theliquid propane was passed through a steam-heated vaporizer before it entered the flowdivider. All data were recorded on a punched paper tape and processed by the Lewisdata processing system.
Smoke Measurement
Exhaust smoke samples were withdrawn through the exhaust probe while jt tra-versed the combustor exit. Smoke samples were passed through the smoke meter shownin figure 5, and smoke numbers were determined in accordance with SAE AerospaceRecommended Practice (ARP 1179, ref. 8). The sample-gas flow rate at standard con-ditions was 2.36*10 cubic meter per second (0.5 ft /min); and four smoke sampleswere obtained at each test condition with time durations of 12, 22, 36, and 72 seconds,respectively. Thus, average smoke numbers based on 1. 623 grams of gas per square
ocentimeter of filter (0.023 Ib of gas/in, of filter) were determined by plotting thesmoke number against the weight of the gas sample per unit area of filter.
Pollutant Emission Measurement
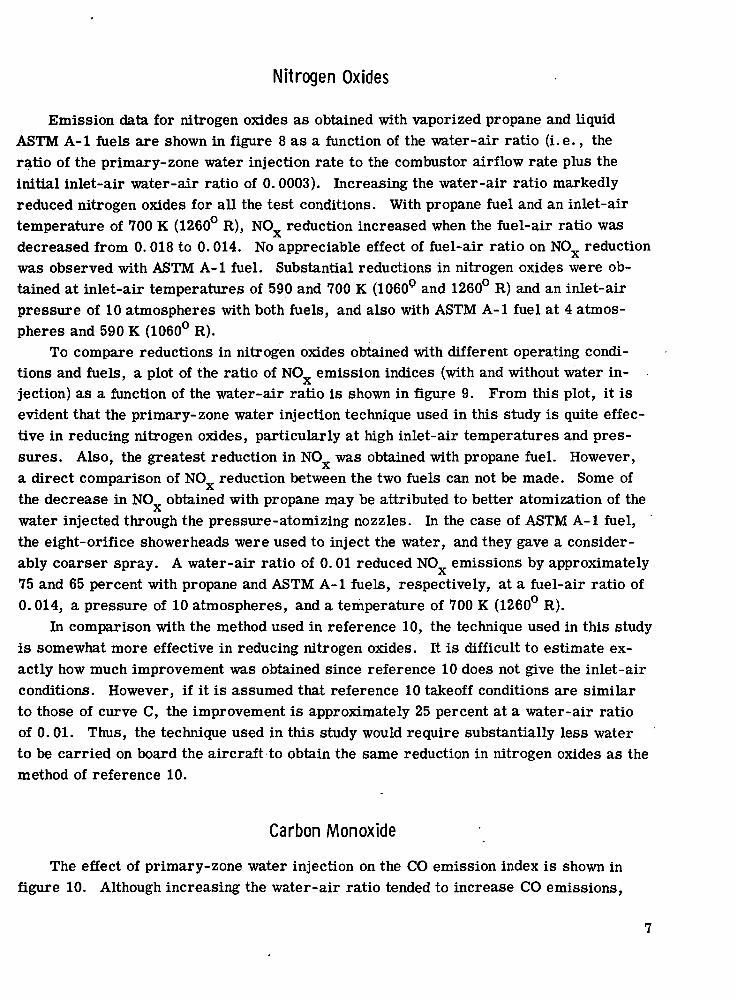
Exhaust gas samples were withdrawn through the air-cooled stationary samplingprobe shown in figure 6, which was mounted approximately 0.92 meter (3 ft) downstreamof the traversing probe and in the center of the exhaust gas stream, as shown in fig-ure 1. Exhaust pollutant concentrations of nitrogen oxides, carbon monoxide, and un-burned hydrocarbons were determined with the gas-analysis equipment shown in figure 7in accordance with Aerospace Recommended Practice (ARP 1256, ref. 9). The gassample temperature was maintained at approximately 423 K (760° R) in the electricallyheated sampling line. Most of the gas sample entered the analyzer oven, while excessflow was bypassed to the exhaust system. To prevent fuel accumulation in the sampleline, a nitrogen purge was used just before and during combustor ignition.
After it passed through the analyzer oven, the gas sample was divided into threeparts and analyzed accordingly. Concentrations of nitrogen oxides, carbon monoxide,and unburned hydrocarbons were measured by the chemiluminescence, nondispersed-infrared, and flame-ionization methods, respectively. Gas samples used to determinenitrogen oxides and carbon monoxide were passed through a refrigerated dryer andanalyzed on a dry basis. Thus, readings for nitrogen oxides and carbon monoxide werecorrected and reported on a wet basis, which was the same as that used for unburnedhydrocarbons. Nitrogen oxide emission indices are expressed as grams of NO« perkilogram of fuel.
Calculations
The U.S. customary system of units was used in primary measurements. Conver-sion to SI units (Systems International d'Unites) were made for reporting purposes, only.
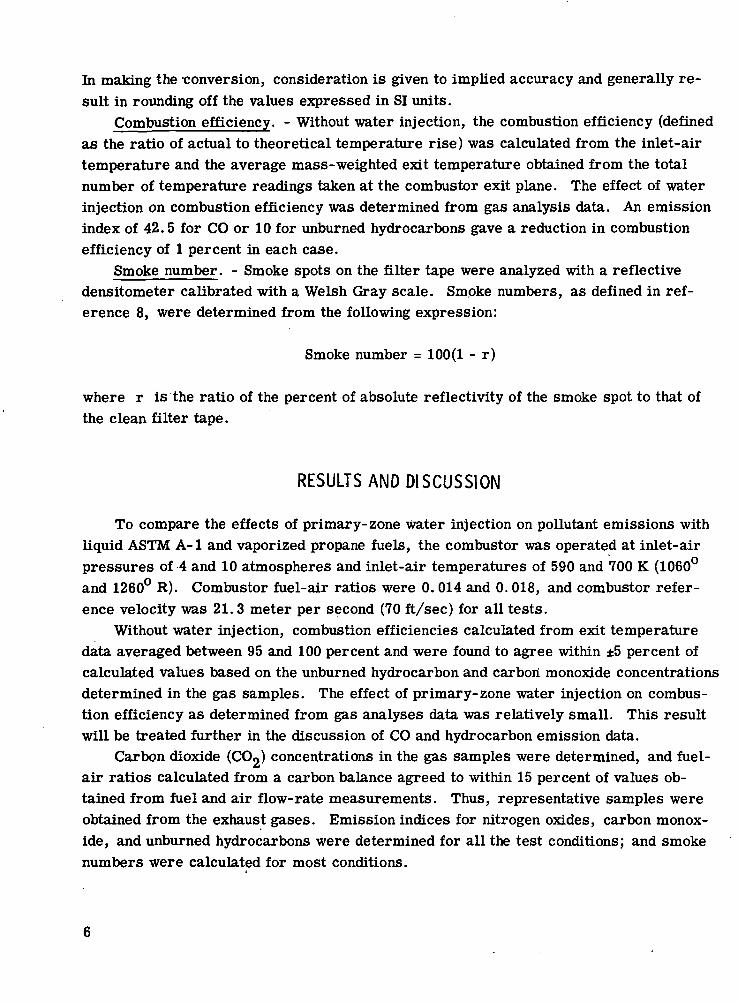
In making the -conversion, consideration is given to implied accuracy and generally re-sult in rounding off the values expressed in SI units.
Combustion efficiency. - Without water injection, the combustion efficiency (definedas the ratio of actual to theoretical temperature rise) was calculated from the inlet-airtemperature and the average mass-weighted exit temperature obtained from the totalnumber of temperature readings taken at the combustor exit plane. The effect of waterinjection on combustion efficiency was determined from gas analysis data. An emissionindex of 42.5 for CO or 10 for unburned hydrocarbons gave a reduction in combustionefficiency of 1 percent in each case.
Smoke number. - Smoke spots on the filter tape were analyzed with a reflectivedensitometer calibrated with a Welsh Gray scale. Smoke numbers, as defined in ref-erence 8, were determined from the following expression:
Smoke number = 100(1 - r)
where r is the ratio of the percent of absolute reflectivity of the smoke spot to that ofthe clean filter tape.
RESULTS AND DISCUSSION
To compare the effects of primary-zone water injection on pollutant emissions withliquid ASTM A-l and vaporized propane fuels, the combustor was operated at inlet-airpressures of 4 and 10 atmospheres and inlet-air temperatures of 590 and 700 K (1060°and 1260° R). Combustor fuel-air ratios were 0. 014 and 0.018, and combustor refer-ence velocity was 21.3 meter per second (70 ft/sec) for all tests.
Without water injection, combustion efficiencies calculated from exit temperaturedata averaged between 95 and 100 percent and were found to agree within ±5 percent ofcalculated values based on the unburned hydrocarbon and carbon monoxide concentrationsdetermined in the gas samples. The effect of primary-zone water injection on combus-tion efficiency as determined from gas analyses data was relatively small. This resultwill be treated further in the discussion of CO and hydrocarbon emission data.
Carbon dioxide (CO«) concentrations in the gas samples were determined, and fuel-air ratios calculated from a carbon balance agreed to within 15 percent of values ob-tained from fuel and air flow-rate measurements. Thus, representative samples wereobtained from the exhaust gases. Emission indices for nitrogen oxides, carbon monox-ide, and unburned hydrocarbons were determined for all the test conditions; and smokenumbers were calculated for most conditions.
Nitrogen Oxides
Emission data for nitrogen oxides as obtained with vaporized propane and liquidASTM A-l fuels are shown in figure 8 as a function of the water-air ratio (i.e., theratio of the primary-zone water injection rate to the combustor airflow rate plus theinitial inlet-air water-air ratio of 0.0003). Increasing the water-air ratio markedlyreduced nitrogen oxides for all the test conditions. With propane fuel and an inlet-airtemperature of 700 K (1260° R), NOX reduction increased when the fuel-air ratio wasdecreased from 0. 018 to 0.014. No appreciable effect of fuel-air ratio on NO_ reduction
X
was observed with ASTM A-l fuel. Substantial reductions in nitrogen oxides were ob-tained at inlet-air temperatures of 590 and 700 K (1060° and 1260° R) and an inlet-airpressure of 10 atmospheres with both fuels, and also with ASTM A-l fuel at 4 atmos-pheres and 590 K (1060° R).
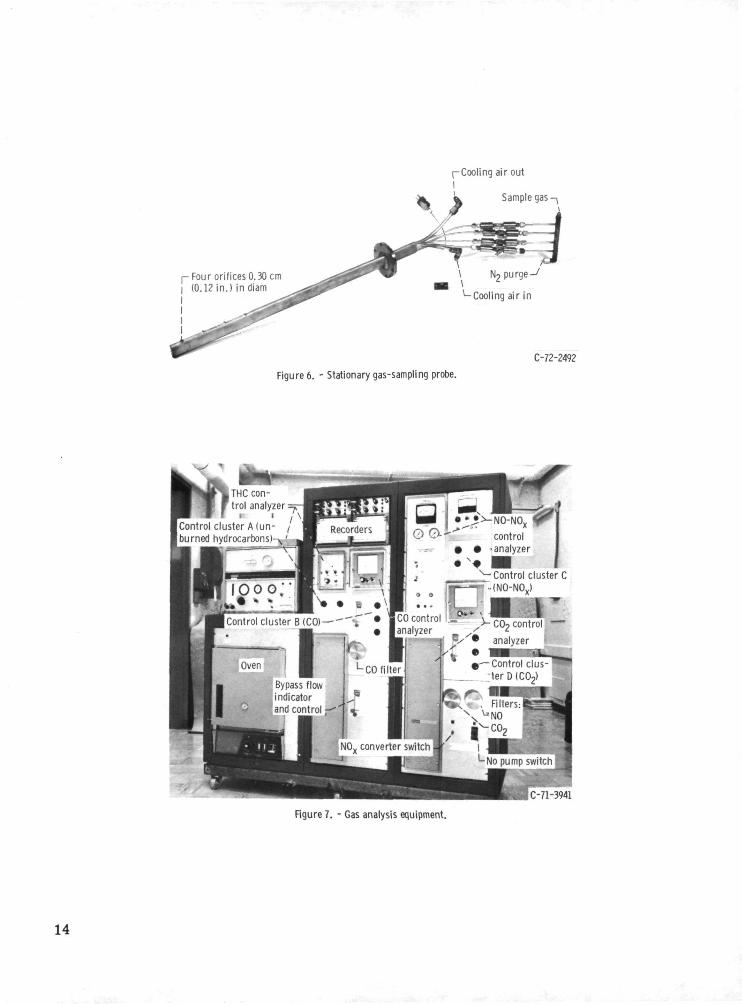
To compare reductions in nitrogen oxides obtained with different operating condi-tions and fuels, a plot of the ratio of NO emission indices (with and without water in-
A,
jection) as a function of the water-air ratio is shown in figure 9. From this plot, it isevident that the primary-zone water injection technique used in this study is quite effec-tive in reducing nitrogen oxides, particularly at high inlet-air temperatures and pres-sures. Also, the greatest reduction in NO was obtained with propane fuel. However,
X
a direct comparison of NO reduction between the two fuels can not be made. Some of2i
the decrease in NO obtained with propane may be attributed to better atomization of theA
water injected through the pressure-atomizing nozzles. In the case of ASTM A-l fuel,the eight-orifice showerheads were used to inject the water, and they gave a consider-ably coarser spray. A water-air ratio of 0.01 reduced NO emissions by approximately
A
75 and 65 percent with propane and ASTM A-l fuels, respectively, at a fuel-air ratio of0.014, a pressure of 10 atmospheres, and a temperature of 700 K (1260° R).
In comparison with the method used in reference 10, the technique used in this studyis somewhat more effective in reducing nitrogen oxides. It is difficult to estimate ex-actly how much improvement was obtained since reference 10 does not give the inlet-airconditions. However, if it is assumed that reference 10 takeoff conditions are similarto those of curve C, the improvement is approximately 25 percent at a water-air ratioof 0.01. Thus, the technique used in this study would require substantially less waterto be carried on board the aircraft to obtain the same reduction in nitrogen oxides as themethod of reference 10.
Carbon Monoxide
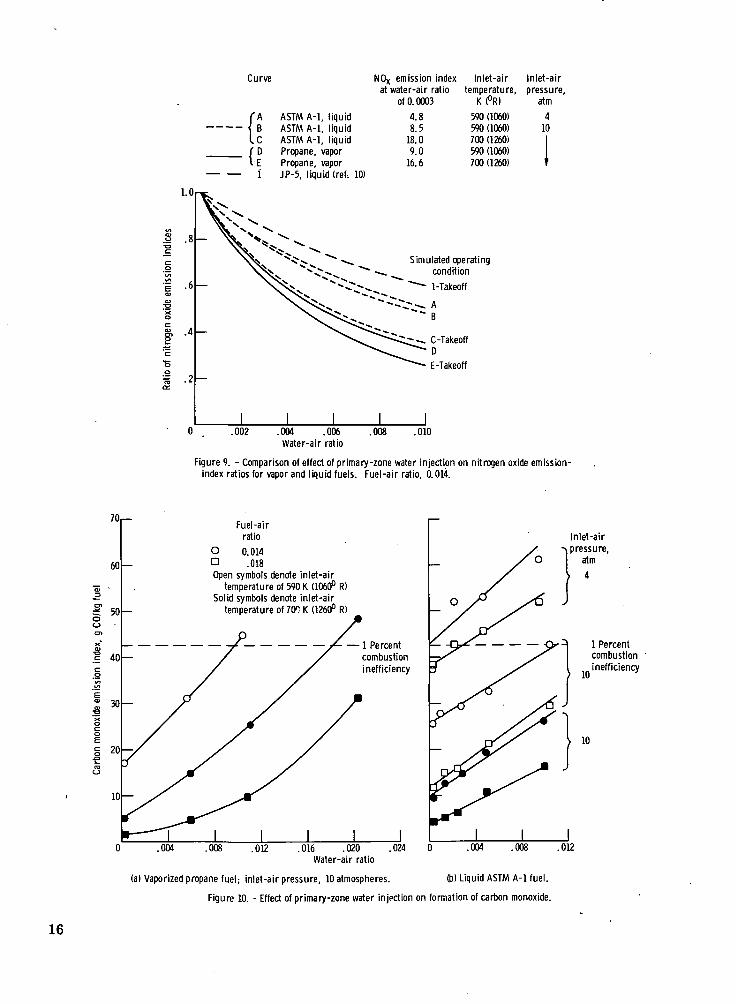
The effect of primary-zone water injection on the CO emission index is shown infigure 10. Although increasing the water-air ratio tended to increase CO emissions,
initial values without water injection were quite low and decreased with increasing fuel-air ratio, inlet-air temperature, and pressure. With propane and ASTM A-l fuels at590 K (1060° R) and 10 atmospheres, a water-air ratio of 0. 01 gave CO emission indicesnear 42. 5, which corresponds to a 1 percent decrease in combustion efficiency. Waterinjection increased combustion inefficiency based on CO emissions from approximately1/2 up to 1 percent, or in other words decreased combustion efficiency by only 1/2 per-cent. Also, at 4 atmospheres with ASTM A-l fuel, a water-air ratio of 0.01 decreasedcombustion efficiency by approximately 1/2 percent as a result of increased CO emis-sions. Primary-zone water injection at a water-air ratio of 0. 01 did not cause COemissions to become prohibitively large.
Unburned Hydrocarbons
The effect of primary-zone water injection on the unburned hydrocarbon emissionindex is shown in figure 11. As expected, it responded in a manner similar to that ofthe CO emission index. Initial values without water injection were quite low and de-creased with increasing fuel-air ratio and inlet-air temperature and pressure. Awater-air ratio of 0.01 gave unburned hydrocarbon emission indices of approximately5, which corresponds to a 1/2 percent decrease in combustion efficiency caused byunburned hydrocarbons. Water injection decreased combustion efficiency by approxi-mately 1/2 percent as a result of the increase in unburned hydrocarbons.
Smoke Number
The effect of primary-zone water injection on smoke number is shown in figure 12.Initial values without water injection were considerably below the visible limit (i.e., asmoke number of 25±5) and remained well below that value even though water injectionwith propane tended to increase smoke number. With ASTM A-l, no apparent trendappeared when the water-air ratio was increased. The scatter in the data was attrib-uted to the relatively poor atomization of water obtained by using the eight-orificeshowerhead injectors. However, smoke numbers were always below the visible limit.
SUMMARY OF RESULTS
Effects of primary-zone water injection on pollutant emissions from a combustorsegment were compared by burning liquid ASTM A-l and vaporized propane fuels. Ex-
8
haust smoke number and emission indices for nitrogen oxides (NO ), carbon monoxideH
(CO), and unburned hydrocarbons were determined. Gas analysis data were used toshow the effects of water injection on combustion efficiency. Test conditions consistedof fuel-air ratios of 0. 014 and 0.018, inlet-air temperatures of 590 and 700 K (1060°and 1260° R), and inlet-air pressures of 4 and 10 atmospheres. The following resultswere obtained with primary-zone water injection at 1 percent of the airflow rate:
1. Primary-zone water injection reduced the NO emission index from 16.6 to 4.4X.
(or 75 percent) with vaporized propane and from 18. 0 to 6.0 (or 65 percent) with liquidASTM A-l fuel, at an inlet-air temperature of 700 K (1260° R) and an inlet-air pressureof 10 atmospheres. Although carbon monoxide and unburned hydrocarbons increasedwith water injection, they remained relatively low; and smoke numbers were consider-ably below the visible limit.
2. Primary-zone water injection proved more effective in decreasing NO emissionwhen inlet-air temperature was increased from 590 to 700 K (1060° to 1260° R): 8 and13 percent more effective with vapor and liquid fuels, respectively. However, the ef-fect of primary-zone water injection on NO_ emission with liquid fuel did not appreciably
A.
change when inlet-air pressure was increased from 4 to 10 atmospheres.3. Combustion efficiency was slightly lower with primary-zone water injection, as
determined from CO and unburned hydrocarbon emission indices. The net decrease incombustion efficiency was approximately 1/2 percent from increased CO emissions and1/2 percent from increased unburned hydrocarbon emissions.
Lewis Research Center,National Aeronautics and Space Administration,
Cleveland, Ohio, March 9, 1973,501-24.
REFERENCES
1. Roudebush, William H.: State of the Art in Short Combustors. Paper 68-22, ICAS,Sept. 1968.
2. Edelman, Raymond; and Economos, Constantino: A Mathematical Model for JetEngine Combustor Pollutant Emissions. Paper 71-714, AIAA, June 1971.
s3. Ingebo, Robert D.; and Norgren, Carl T.: High-Pressure Combustor Exhaust
Emissions with Improved Air-Atomizing and Conventional Pressure-AtomizingFuel Nozzles. NASA TN D-7154, 1973.
4. Grobman, Jack: Review of Jet Engine Emissions. NASA TM X-68064, 1972.
5. Singh, P. P.; Young, W. E.; and Ambrose, J. J.: Formation and Control ofOxides of Nitrogen Emissions from Gas Turbine Combustion Systems. Paper72-GT-22, ASME, Mar. 1972.
6. Nicholls, J. E.; El-Messiri, I. A.; and Newhall, H. K.: Inlet Manifold Water In-jection for Control of Nitrogen Oxides, Theory and Experiment. Paper 690018,SAE, Jan. 1969.
7. Ingebo, Robert D.; Doskocil, Albert J.; and Norgren, Carl T.: High-PressurePerformance of Combustor Segments Utilizing Pressure-Atomizing Fuel Nozzlesand Air Swirlers for Primary-Zone Mixing. NASA TN D-6491, 1971.
9. Anon.: Procedure for the Continuous Sampling and Measurement of GaseousEmissions from Aircraft Turbine Engines. Aerospace Recommended Practice1256, SAE, Oct. 1971.
10. Cornelius, Walter; and Agnew, William G., eds.: Emissions from ContinuousCombustion Systems. General Motors Research Laboratory, 1972, p. 369.
10
TABLE I. - MULTIPLE-ORIFICE-ATOMIZER FLOW-RATE VARIATION
WITH PRESSURE DROP
Fluid
Propane, vapor
Water, liquid
Flow
kg/hr
91 fi
90
21.6
90
21.690
rate
Ib/hr
An (•
198
47.6
198
47.6
198
Pressure-atomizing nozzle
Pressure drop, z
O f n
3.30
0.13
2.25
Eight-orifice
showerhead
itm
840
0.04
.72
Preheaterexhaust
nExhaust gases from fourJ-47 combustor cans
r0.
7- Airflow control valve
\ r Air orifice\ I
Indirect-firedheat exchanger
KAir bypass line
Automaticair-temperaturecontrol valve
Pressureshell
Laboratoryair supply
Atmospheric oraltitude exhaust
Stationary gasBellmouth sampling probe ^
- Exhaustcontrolvalve
Dome airdeflector
CD-11036-28
combustorLTraversjng
temperatu9re>
pressure, andsmoke probe
Figure 1. - Test facility and auxiliary equipment.
11
Instrumentationstation: Kdiffuser inlet)
ASTMA-lfuel |
2(combustor exhaust)
Snout(40-percentopen area)
Figured -Test combustor.
Eight orifices 0.94 cm (0.037 in.)drilled at 30° angle outward and1.75cm (0.69 in.) from nozzlecenterline-x
\Air swirler
Flow distributor
^-Pressure-atomizing nozzle
Figure 3. - Multiple-orifice nozzle assembly.
0/2-4011
12
Wedge-type static- /pressure pickups-C
j- Aspirating portsI with internal
. I thermocouples (5)
-Total-pressuretubes (5)
C-68-3450
Figure 4. - Exhaust rake at station 2 (see fig. 2).
Figure 9. - Comparison of effect of primary-zone water injection on nitrogen oxide emission-index ratios for vapor and liquid fuels. Fuel-air ratio, 0.014.
Fuel-airratio
O 0.014O .018
Open symbols denote inlet-airtemperature of 590 K (1060° R)
Solid symbols denote inlet-airtemperature of 700 K (1260° R)
PENALTY FOR PRIVATE USE $3OO SPECIAL FOURTH-CLASS RATEBOOK
POSTAGE AND FEES PAIDNATIONAL AERONAUTICS AND
SPACE ADMINISTRATION451
POSTMASTER : If Undeliverable (Section 158Postal Manual) Do Not Return
"The aeronautical and space activities of the United States shall beconducted so as to contribute . . . to the expansion of human knowl-edge of phenomena in the atmosphere and space. The Administrationshall provide for the widest practicable and appropriate disseminationof information concerning its activities and the results thereof."
—NATIONAL AERONAUTICS AND SPACE ACT OF 1958
NASA SCIENTIFIC AND TECHNICAL PUBLICATIONSTECHNICAL REPORTS: Scientific andtechnical information considered important,complete, and a lasting contribution to existingknowledge.
TECHNICAL NOTES: Information less broadin scope but nevertheless of importance as acontribution to existing knowledge.
TECHNICAL MEMORANDUMS:Information receiving limited distributionbecause of preliminary data, security classifica-tion, or other reasons. Also includes conferenceproceedings with either limited or unlimiteddistribution.
CONTRACTOR REPORTS: Scientific andtechnical information generated under a NASAcontract or grant and considered an importantcontribution to existing knowledge.
TECHNICAL TRANSLATIONS: Informationpublished in a foreign language consideredto merit NASA distribution in English.
SPECIAL PUBLICATIONS: Informationderived from or of value to NASA activities.Publications include final reports of major-,projects, monographs, data compilations,handbooks, sourcebooks, and specialbibliographies.
TECHNOLOGY UTILIZATIONPUBLICATIONS: Information on technologyused by NASA that may be of particularinterest in commercial and other non-aerospaceapplications. Publications include Tech Briefs,Technology Utilization Reports andTechnology Surveys.
Defails on the availability of these publications may be obtained from:
SCIENTIFIC AND TECHNICAL INFORMATION OFFICE
N A T I O N A L A E R O N A U T I C S A N D S P A C E A D M I N I S T R A T I O N