+ All Categories
Home > Documents > Effect of Processing Conditions and Material Properties on the ...

Effect of Processing Conditions and Material Properties on the ...

Date post: 02-Jan-2017
Category:
Upload: dokhanh
View: 217 times
Download: 2 times
Share this document with a friend
20
* Corresponding author. Mailing address: 103 Chappie James Center, Tuskegee University, Tuskegee, AL 36088. E-mail: [email protected]. Phone: 334-727-8985. Fax: 334-724-4224 D. Srinivasagupta and B. Joseph are now with the Department of Chemical Engineering, University of South Florida, 4202 E. Fowler Ave ENB 118, Tampa, FL 33620. Effect of Processing Conditions and Material Properties on the Debond Fracture Toughness of Foam-Core Sandwich Composites: Experimental Optimization Prasun Majumdar 1 , Deepak Srinivasagupta 2 , Hassan Mahfuz 1* , Babu Joseph 2 , Matthew M. Thomas 3 , and Stephen Christensen 4 1 Tuskegee University’s Center for Advanced Materials (T-CAM), Tuskegee, AL 36088 2 Department of Chemical Engineering, Washington University, Saint Louis, MO 63130 3 The Boeing Company, St. Louis, MO 63166 4 The Boeing Company, Seattle, WA 98124 Keywords: Resin Transfer Molding (E), Debonding (B), Fracture Toughness (B), Tilted Sandwich Debond Test (MS # CMA/02/031b/SGA) Accepted for publication in Composites Part A: Applied Science and Manufacturing
Transcript

*Corresponding author. Mailing address: 103 Chappie James Center, Tuskegee University, Tuskegee, AL 36088. E-mail: [email protected]. Phone: 334-727-8985. Fax: 334-724-4224 D. Srinivasagupta and B. Joseph are now with the Department of Chemical Engineering, University of South Florida, 4202 E. Fowler Ave ENB 118, Tampa, FL 33620.

Effect of Processing Conditions and Material Properties

on the Debond Fracture Toughness of Foam-Core

Sandwich Composites: Experimental Optimization

Prasun Majumdar1, Deepak Srinivasagupta2, Hassan Mahfuz1*,

Babu Joseph2, Matthew M. Thomas3, and Stephen Christensen4

1Tuskegee University’s Center for Advanced Materials (T-CAM), Tuskegee, AL 36088

2Department of Chemical Engineering, Washington University, Saint Louis, MO 63130

3The Boeing Company, St. Louis, MO 63166

4The Boeing Company, Seattle, WA 98124

Keywords: Resin Transfer Molding (E), Debonding (B), Fracture Toughness (B), Tilted

Sandwich Debond Test

(MS # CMA/02/031b/SGA)

Accepted for publication in Composites Part A: Applied Science and Manufacturing

1

Abstract

The structural performance and reliability of the foam-core sandwich composites are

known to be dependent on the strength of the core-skin bonding. Mechanical tests have

repeatedly demonstrated that the failure modes for the sandwich during flexural,

compression, and tension loading are first triggered by the failure of the interface or the

sub-interface zones between the core and the skin. Once this failure mode sets in, core

shear and delamination progress rapidly, leading to the final failure of the sandwich

construction. The strength of the core-skin bonding depends on the chemical reactions

taking place during the cure process. The effect of processing parameters and material

properties on the core-skin bonding strength were investigated experimentally. The skin-

core debond fracture toughness was measured using Tilted Sandwich Debond specimens.

Verifying the heuristics developed in the previous part of this paper [1], we achieved a

78% increase in debond fracture toughness with elevated temperature processing, and

observed reduced variability with higher suction pressures. We also saw increase in

debond fracture toughness with foam density, validating the assumption that interfacial

bonding controls the debond fracture toughness. An increase in resin uptake with foam

density was an interesting observation from these experiments.

2

1 Introduction

Traditional joining methods for metals such as welding are unsuitable for polymeric

composites. Bolted joints or rivets are not efficient for composites because drilling the

fastener holes also cuts the reinforcing fibers in the composite. Adhesively bonded joints

do not damage the adherends, but the conventional joint designs that have been developed

for adhesion bonding are generally suitable for flat structural parts only. Besides flat

structures, there are tubular and sandwich constructions where joining becomes a critical

issue. For example, lightweight composite armor consists of several layers of different

composite materials, which provide ballistic protection, structural reinforcement, and fire,

smoke and toxicity barriers, all in a single structure [2]. The current methods of preparing

each layer separately and joining them is not cost effective and can introduce a number of

defects. For example, in a sandwich T-joint, joining two sandwich panels at right angle to

each other with continuous fiber reinforcement at the corners is considerably difficult [3-

10]. Continuous fiber reinforcement facilitates efficient load transfer between the two

composite parts and increases the joint strength substantially. Manufacture of continuous

fiber T-joints is still evolving, and a significant amount of research is necessary to perfect

the process. An overview of structural sandwiches is available in reference [11].

The structural performance of these sandwiches is dependent on the strength of inter-layer

bonding. Mechanical testing has repeatedly shown that the failure modes for the sandwich

during flexural, compression, and tension loading are first triggered by the failure of the

interface or the sub-interface zones between the core and the skin. Once this failure mode

sets in, there is rapid progression of core shear and delamination, eventually leading to the

failure of the sandwich construction.

In the previous part of this paper [1], we developed 3-D and 1-D models of the CIRTM

process used to manufacture these sandwich composites, and proposed model-based

heuristics to relate the processing conditions and material properties to the final product

3

quality parameters. In this part of the paper, we validate these heuristics qualitatively

through experimental parametric studies to optimize the process.

2 Experimental Procedures

2.1 Parametric Studies

Accurate, direct validation of the process model by verifying the flow-front position and

the degree of cure (in a distributed sense) has been difficult due to (i) limited resolution of

the model, and (ii) availability of real-time flow-front or cure sensors. Some promising

work in this area using SMARTweave has been done by Mathur [12]. In any case, the

focus of our study is on optimizing application-related measures of the sandwich

composites. The typical application-relevant variables to be optimized include measures

of fracture toughness or the strength: weight ratio. In this study, we use the skin-core

debond fracture toughness ( cG ) determined from the Tilted Sandwich Debond (TSD) test

as described in reference [13]. Based on the model developed previously, we had

proposed a few heuristics for experimental validation: (i) an elevated processing

temperature, well below the glass transition temperature of PVC foam (88 °C), will

increase the debond-toughness, and (ii) using cure-inhibitors and larger driving forces for

resin flow, (e.g. higher vacuum and/or infusion pressures) will reduce dry-spots and thus

reduce variability in the debond toughness.

To validate these processing model heuristics and to optimize the important parameters in

sandwich manufacture, a series of parametric studies were performed as described below.

1. Two different processing temperatures: ambT = 20 °C (room temperature) and, ambT =

65 °C. Divinycell foams can be processed at temperatures of up to 80 °C without

significant dimensional changes.

4

2. Two different resin infusion pressures: resin infusion under 70.83 kPa absolute (9 in.

Hg), and 0.00004 kPa absolute (759.8 mm Hg), vacuum suction pressures.

3. Two different formulations of Derakane 411-350 vinyl ester resin: with and without

inhibitor. We used a small amount of 4-Methoxyphenol inhibitor (0.1 wt%) to

achieve better curing.

4. Two different foam densities: Klegcell foams R-75 and R-300. The number in the

foam specification denotes the density in kg/m3.

5. Two different resin types: we compared the fracture toughness performance from the

vinyl-ester resin to that from an epoxy resin (SC-15).

The skin-core debond fracture toughness was measured for each sample using the Tilted

Sandwich Debond (TSD) tests as described in the following section. This is a recently

developed test method [13] and is not a part of the ASTM standards.

2.2 Debond Fracture Toughness Test

A sandwich structure provides very high stiffness per unit weight due to the combination

of two stiff face sheets separated by a low-density core. If a debond is introduced in such

structure, its structural stiffness may be substantially reduced because of the loss of shear

and tension transfer between face and core.

The face sheet over a locally debonded region under compression may undergo buckling

which may lead to further propagation of the debond. If the sandwich is loaded in shear, a

core crack may initiate at the tip of the bond and propagate through the entire core

between the face sheets. Consequently, face/core debond may pose a substantial threat to

the integrity of a sandwich structure [14].

5

Therefore, the determination of debond fracture toughness of a sandwich is a critical

criterion for its structural integrity. As stated earlier, there is no standard ASTM

procedure for such determination; however, extensive test methods have been described

in reference [13]. This particular method is widely known as Tilted Sandwich Debond

(TSD) test which is very similar to standard Double Cantilever Beam (DCB) test except

that the specimen is tilted to allow the crack to propagate along the interface.

The principle of the TSD specimen is shown in Figure 1 below:

Figure 1. Schematic of TSD test for Debond Fracture Toughness

The specimen has an initial crack introduced at the interface between the top face and

core. A vertical load is applied at the end of the debonded top face until the crack

propagates. The specimen is tilted with respect to the horizontal by an angle θ, i.e. the

“tilt angle.” The purpose of the tilt is to promote continued growth of crack at face/core

interface of the artificially introduced debond. By tilting the TSD specimen, a tensile load

component acts on the debond face sheet which would promote a state of stress at the

crack tip less favorable for kinking [14].

The debond fracture toughness is then computed as shown the following equation [13].

6

2

2

P CcrGC W a∂= ⋅∂ (1)

Here, CG is the debond fracture toughness in kJ/m2, Pcr is the critical load at the initiation

of debond propagation, W = width of the specimen in mm, and Ca

∂∂

is the slope of

compliance vs. crack length curve.

The sandwich specimen tested in our case was 254 mm in length and 38.1 mm in width,

and consisted of 3.6 mm thick S2-glass/Vinyl ester or S2-glass/epoxy composite face

sheet over 25.4 mm thick PVC foam core. The specimen was tested in a MTS machine

using TSD test fixture with a tilt angle (θ) of 10 degrees and an initial crack length (a0) of

50 mm. The actual test set-up is shown in Figure 2.

Figure 2. Debond Fracture Toughness test using TSD test fixture

The experiment began with the recording of load vs. deflection data using MTS data

acquisition system while the crack propagation was also monitored simultaneously. The

initial load was applied for a period until the crack propagated by about 12-15 mm and

7

this was termed as crack increment (ai). The specimen was then unloaded completely. In

the next step, the specimen was again loaded until the crack propagated to another 12-15

mm length which was then followed by another unloading. This procedure of loading and

unloading continued until the total crack length extended to about 170 mm, which was

about two-third of the length of the specimen. This generated a series of load-

displacement curves. A representative number of the load-deflection curves are shown in

Figure 3. Curves for Figure 3 are for S2-Glass/ SC-15 Epoxy sandwich specimen using

H-130 foam as core material.

0

50

100

150

200

250

300

350

0 2 4 6 8 10 12 14 16

Temperature:RoomVacuum: 759.8 mm (Hg)

a= 97 mm

a= 153 mm

a= 64 mm

a= 50 mm

Compliance,C=∆δ/∆P

∆P/∆δ

Displacement [mm]

Load

[N]

Figure 3. Load-Displacement data for various initial crack lengths

It is to be noted here that the test procedure begins with an initial crack length (a0). After

the first loading, the crack extends by ai as stated earlier. Therefore, the initial crack

length for the second loading is the initial crack length for the first loading i.e. a0 plus the

incremented crack length (ai).

8

The load vs. displacement curves as shown in Figure 3 provide two critical pieces of

information such as peak load and stiffness for each initial crack length. This peak load is

known as critical load and stiffness in essence is the initial slope of the curve. The

inverses of these slopes of are indeed the compliances (C).

40 50 60 70 80 90 100 110 120 130 140 150 160 170 1800

50

100

150

200

250

300

350

400

450

500

550

600

650Temperature: RoomVacuum : 759.8 mm Hg

Crit

ical

Loa

d, P

c

Initial crack length, a [mm]

Figure 4. Critical load vs. initial crack length for Glass/SC-15 epoxy

A plot of critical load with respect to initial crack length is shown in Figure 4. This shows

that as the crack length increases the peak load decreases exponentially leading towards a

stable crack growth almost without any application of load. This is what is usually

expected in a debond fracture toughness test. The critical load (Pcr) as shown in Figure 4

corresponding to each initial crack length is then used in equation (1).

Another plot is necessary to determine aC

∂∂ to be used in equation (1). A plot of

Compliance (C) vs. initial crack length is shown in Figure 5 for various initial crack

9

lengths. This plot shows that slope aC

∂∂ increases as the initial crack length increases.

aC

∂∂

for each crack length as shown in Figure 5 is now utilized in equation (1) to determine Gc.

0 20 40 60 80 100 120 140 160 1800.00

0.05

0.10

0.15

0.20Temperature : RoomVacuum: 759.8 mm (Hg)

δC/δa

δC/δa

δC/δa

Com

plia

nce,

C [m

m/N

]

Initial crack Length,a [mm]

Figure 5. Compliance vs. initial crack length for Glass/SC-15 epoxy

It is to be mentioned here that for each test conditions (1-5) as specified in section 2.1, at

least two specimens were tested. Moreover, each test specimen provides about 6-8 sets of

Gc measurements corresponding to the number of initial crack lengths. One such plot of

Gc’s for various initial crack lengths is shown in Figure 6. Although Figure 6 shows slight

variation of Gc with initial crack length, it can be stated that debond fracture toughness is

nearly independent of the initial crack length.

10

40 60 80 100 120 140 160 1800.00.10.20.30.40.50.60.70.80.91.01.11.21.31.41.51.61.71.81.92.0

Temperature :RoomVacuum: 759.8 mm (Hg)

Deb

ond

Frac

ture

Tou

ghne

ss, G

c[KJ/

m2 ]

Initial Crack Length,a [mm]

Figure 6. Debond fracture toughness vs. initial crack length for Glass/SC-15 epoxy

Hence an average value for debond fracture toughness can be calculated as shown in

Table 1.

Table 1: Debond Fracture toughness values for H-130 foam with SC-15 epoxy resin

(Temp: Room, Pressure: 0.00004 kPa absolute)

Initial Crack Length, mm Fracture toughness, kJ/m2

64 0.64

75 0.55

86 0.47

97 0.52

110 0.62

123 0.59

139 0.67

153 0.67

Average Fracture Toughness 0.59 kJ/m2 ±±±± 0.073 ( 7ν = )

11

The average debond fracture toughness for the Glass/Epoxy with H-130 foam is found to

be 0.59 kJ/m2 as shown in Table 1. It is to be mentioned here that this value of debond

fracture toughness is much higher than that achieved using the vinyl-ester resin shown in

Table 4 ( cG = 0.27 kJ/m2).

The effect of processing temperature on debond fracture toughness was also investigated.

Debond fracture toughness value was found to be 0.48 kJ/m2 for sandwich manufactured

using glass/vinyl ester resin at an elevated temperature of 65 oC. This is about 78% higher

than the fracture toughness value ( cG = 0.27 kJ/m2) achieved with room temperature

processing of sandwich.

We also observed a significant rise in the average debond fracture toughness with

increase in foam density. Tables 2 and 3 show cG values for sandwiches made from R-75

and R-300 foams respectively, using the glass fiber/vinyl-ester resin combination.

Table 2. Debond Fracture Toughness for R-75 Foam with Derakane 411-350 Resin

(Temp: Room, Pressure: 0.00004 kPa absolute)

Initial Crack Length, mm Critical Load, N Fracture toughness, kJ/m2

50 267.18 0.19

65 222.43 0.22

79 158.68 0.37

99 118.88 0.21

118 91.22 0.15

130 89.38 0.23

Average fracture toughness 0.23 kJ/m2 ±±±± 0.075 ( 5ν = )

12

Table 3. Debond Fracture Toughness for R-300 Foam with Derakane 411-350 Resin

(Temp: Room, Pressure: 0.00004 kPa absolute)

Initial Crack Length, mm Critical Load, N Fracture toughness, kJ/m2

53 518.89 0.75

64 369.11 0.61

74 268.11 0.56

88 223.96 0.55

101 178.28 0.58

125 134.14 0.43

Average fracture toughness 0.65 kJ/m2 ±±±± 0.104 ( 5ν = )

The average values ( cG ) for the other cases with the respective standard deviations are

shown on Table 4 (ν is number of degrees of freedom). On account of the primarily

closed-cell nature of the foam, we did not observe significant rise in the debond

toughness with suction pressure, but we found reduced variability in the debond fracture

toughness, for the same processing temperature, thus validating one of the model-based

heuristics.

Table 4. Experimental Debond Toughness (using Derakane 411-350 vinyl ester resin and H-130

foam)

Test No. Temperature Resin Type Suction Pressure cG ±±±±

cGs (kJ/ m2)

1 20 °C Uninhibited 70.83 kPa (abs.) 0.257 ± 0.088 ( 4ν = )

2 20 °C Uninhibited 0.00004 kPa (abs.) 0.270 ± 0.041 ( 3ν = )

3 20 °C Inhibited 0.00004 kPa (abs.) 0.254 ± 0.048 ( 5ν = )

4 65 °C Uninhibited 0.00004 kPa (abs.) 0.484 ± 0.184 ( 4ν = )

13

3 Crack Propagation at the Interface

It was observed during the various debond fracture toughness tests that crack propagates

in two distinct ways in low and high density foams. In low density foams, the crack

begins to propagate at a region slightly underneath (1-2 mm) the interface. This region

can be defined as a sub-interface zone which exists between the soaked cell at the top and

dry cell underneath. We believe that the strength of this sub-interface will depend on the

strength of dry cell materials. For lower density foams the depth of this sub-interface zone

is higher because of the relatively larger cell sizes and is distinctly below the actual

interface. We have noticed that crack propagates through this sub-interface in all cases of

lower density foams as shown in Figure 7 (a).

(a) Crack propagation through sub-interface (b) Crack propagation at the face /core interface

Figure 7. Optical Micrographs of (a) R-75 foam and (b) R-300 foam core sandwich

However, in case of higher density foams (130 kg/m3 and above), the crack propagation is

somewhat different. It seems to propagate right along the core-skin interface as shown in

Figure 7(b). We believe that the reason for this type of propagation is that the strength the

sub-interface is higher than the actual strength of the skin-core interface bonding. In case

of higher density foams, the cell sizes are smaller and correspondingly the strength of cell

14

walls and cell edges are higher which in turn contributes to the higher sub-interface

strength.

4 Experimental Analysis

4.1 Effect of Foam Density on Fracture Toughness

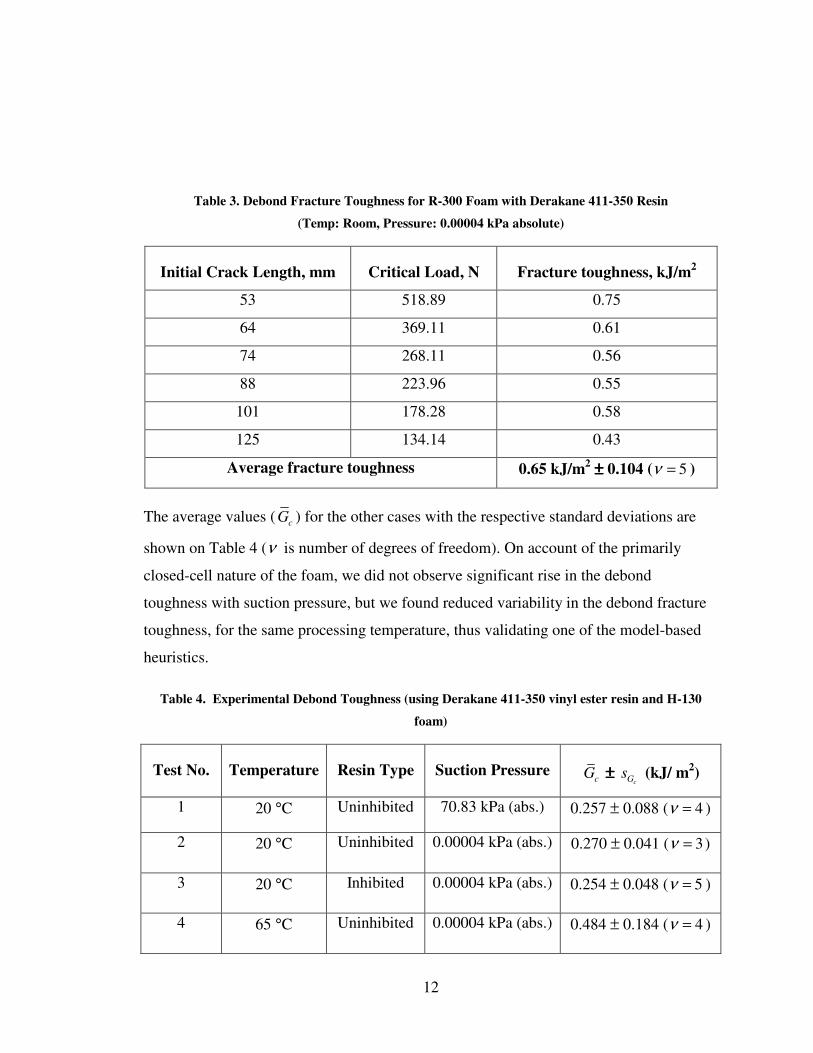
It was observed from the test data that debond fracture toughness value has increased

substantially with increase in foam density. This phenomenon can be explained

considering the fact that with higher density foams there are more solid surfaces

available in the structure (in the form of cell walls and cell edges) than the lower density

foams. Therefore, larger amount of resin soaks and bonds at the interface for higher

density foams. In order to verify this notion, tests were conducted to determine the actual

resin uptake for PVC foams with various densities. To measure resin uptake by foams

with various densities, 25.4 mm thick foam panels (203 mm x 203 mm size) were

weighted and set-up in VARTM without the fabrics. Resin was then infused under 759.8

mm (Hg) vacuum pressure for various lengths of time such as 15, 30, 45, and 60 minutes.

After complete cure and demolding, the foam panels were weighted again. The difference

in weight was taken as the resin uptake which was then divided by the total volume of the

panel. For each category of foam, three such panels were infused and the average values

were calculated. The results from these tests are shown in Figure 8.

15

10 20 30 40 50 600.019

0.020

0.021

0.022

0.023

0.024

0.025

0.026

0.027

0.028

0.029

R-75

H-130R-260

resi

n pe

netra

tion,

gm

/cm

3

Time,min

Figure 8. Normalized Resin Uptake by Foam of Varying Densities

It is evident from Figure 8 that for a given period of resin suction, the amount of resin

soaked into the closed-cell foam increases with density. With increased resin uptake into

the higher density foams, the cells at the interface actually become more stiff and an

increased energy is therefore required to allow for the debond to propagate. Consequently,

debond fracture toughness is higher with the increase in core density of the sandwich

specimens.

4.2 Effect of Resin Type on Debond Fracture Toughness

Interfacial adhesion is also affected by the amount of shrinkage that occurs in a resin. As

epoxies cure with low shrinkage, the various surface contacts set up between the liquid

resin and the adherends are not disturbed during the cure and it shows better adhesion.

Also, epoxy resin curing reaction produces less volatile by-products compared to vinyl-

ester resin during cure and this eventually leads to more degree of cross-linking. As a

result, fracture toughness value is considerably high for epoxy.

16

4.3 Increase in Debond Fracture Toughness with Temperature

The higher processing temperature of 65 °C lowers the initial viscosity of the resin and

ensures that the resin wets the face-sheet fabrics better. The higher temperature also

accelerates the curing reaction thus reducing the batch cycle time, and also increases the

maximum final cure maxα , thus resulting in better cross-linking. An additional benefit is

the reduction in voids. So, the increase in fracture toughness with processing at elevated

temperature (below the glass-transition temperature of the PVC foam, gT ~88 °C) is quite

significant.

4.4 Variation in Debond Fracture Toughness with Suction Pressure

The vacuum pressure provides the driving force to eliminate voids and ensure uniform

distribution of resin. At the lower vacuum pressure (70.83 kPa absolute), we found much

greater variability in debond toughness with initial crack length, possibly due to regions

of resin starvation inside the sandwich construction that bring down the local value of

debond fracture toughness. These result in areas of poor bonding at the interface and also

through the laminate.

4.5 Effect of Inhibitor on Debond Fracture Toughness

Based on the 1-D model, it was also believed that the addition of the inhibitor would

reduce the dry spots in a similar manner, thus reducing the variability in the measured

debond toughness values. However we did not see this happen with the small amount of

inhibitor that we used. The 1-D model is primarily meant to track resin cure and viscosity,

and is applicable at regions far away from the distributing media where it was believed

17

that the flow would be mainly in the transverse direction. It is possible that even in the

absence of the inhibitor there was good resin penetration into the interface at all locations.

In such cases, using the inhibitor is not expected to reduce the variability or increase the

mean debond toughness.

5 Summary

The following are the summary of the above investigations:

• From the experimental optimization studies, it was found that sandwiches

manufactured at elevated temperature (65 °C) provided a higher fracture

toughness value comparable to that of sandwiches cured at ambient conditions

with the same core material and resin system.

• A higher suction pressure reduced the variability in debond fracture toughness

values.

• Epoxy resin (SC-15) gives higher debond fracture toughness compared to the

vinyl ester resin.

• Fracture toughness was also found to increase with the increase in core

density.

• Also, density of the foam had an effect on the propagation of the initial crack.

With lower density foams (75 kg/m3), it was observed that initial interface

crack kinked into the core and propagated as a sub-interface crack (1-2 mm

below the interface). However, for higher core densities (130 kg/m3 and

above) the crack propagation was along the interface.

• It was observed that use of small percentage (0.1 % wt) of inhibitor did not

have any significant effect on debond fracture toughness values. VARTM-type

18

processes provides sufficient wetting of fiber and degree of cure so that it is

not necessary to use cure inhibitor.

Acknowledgements

The authors thank the Boeing Company, St. Louis, MO (Contract number WS-PW-1437),

the Boeing McDonnell Foundation, and the National Science Foundation (Grant DMII:

96-22482) for funding this research. We also acknowledge the anonymous reviewers for

their insightful comments which helped improve the quality of the manuscript.

References

1. Srinivasagupta D, Joseph B, Majumdar P, Mahfuz H. Effect of Processing Conditions and Material Properties on the Debond Fracture Toughness of Foam-Core Sandwich Composites: Process Model Development. Accepted for publication in Composites Part A: Applied Science and Manufacturing.

2. Gillio EF, Advani SG, Gillespie Jr. JW, Fink BK. Investigation of the role of transverse flow in co-injection resin transfer molding. Polym Compos 1998;19(6):738-746.

3. Hicks IA, Read PJCL, Shenoi RA. Tensile Compressive and Flexural Characteristics of Tee-Joints in Foam-Cored Sandwich Structures. Sandwich Construction 3 (1996);v1:579-590.

4. Rispler AR, Steven GP, Tong L. Failure Analysis of Composite T-joints Including Inserts. J of Reinforced Plastics and Compos 1997;16(18):1642-1658.

5. Shenoi RA, Read PJCL, Jackson CL. Influence of Joint Geometry and Load Ratings on Sandwich Tee Joint Behavior. J of Reinforced Plastics and Compos 1998;17(8):725-740.

6. Theotokoglou EE, Moan T. Experimental and Numerical Study of Composite T-Joints. J of Composite Materials 1996;30(2):190-209.

19

7. Theotokoglou EE. Study of the Numerical Fracture Mechanics Analysis of Composite T-joints. Journal of Reinforced Plastics and Composites 1999;18(3): 215-223.

8. Theotokoglou EE. Strength of composite T-joints under pull-out loads. Journal of Reinforced Plastics and Composites 1997;16(6):503-518

9. Sun CT, Turaga UVRS. Compressive and Tensile Characteristics of Sandwich T-joints. Proceedings of the 5th International Conference on Sandwich Construction, Zurich, Switzerland, Sept. 5-7, 2000.

10. Gillespie JW, Pipes RB. Behaviour of Integral Composite Joint-Finite Element and Experimental Evaluation. Journal of Composite Materials 1978;v12:408-421.

11. Karlsson KF, Astrom BT. Manufacturing and applications of structural sandwich components. Composites, Part A: Applied Science and Manufacturing 1997;28A(2):97-111.

12. Mathur R, Heider D, Hoffmann C, Gillespie Jr. JW; Advani SG, Fink BK. Flow front measurements and model validation in the vacuum assisted resin transfer molding process. Polymer Composites 2001:22(4);477-490.

13. Li X, Carlsson LA. The tilted sandwich debond (TSD) specimen for face/core interface fracture characterization. J Sandwich Struct Mater 1999;1(1):60-75.

14. Carlsson LA. On Debond Failure of Foam Core Sandwich. In: Gdoutos EE and Daniel IM, editors. Recent Advances in Experimental Mechanics. Dordrecht: Kluwer, 2002.


Recommended