6 Effect of Product Form, Compaction, Vibration and Comminution on Energywood Bulk Density Timothy P. McDonald Bryce J. Stokes Research Engineer Project Leader USDA Forest Service Southern Forest Experiment Station Auburn, Alabama 36849, USA and Joseph F. McNeel Research Engineer USDA Forest Service Pacific Northwest Experiment Station Seattle, Washington 98 105, USA ABSTRACT A study was performed to examine the changes in density of stacked roundwood, chips, and chunks as affected by various compaction treatments. Density of stacked roundwood bolts was tested for the effect of stacking orientation, binding of the stack ends, and species. Stacked bolt wood occupied less than 50 percent of the total rack space for all species, giving final dry bulk densities, based on total rack volume, of 159 to 293 kg/m3. Alternating butt ends in the rack increased final bulk densities by an average of approximately 40 percent. The effect was greatest for mixed, small hardwood stems. Vibration and compaction of chipped material (pine, mixed hardwood, and sycamore) resulted in final dry bulk densities of from 170 to 273 kg/m3. Vibration increased dry bulk density by an average of 20 percent, whereas compaction increased dry bulk density by about 30 percent, vibration of sycamore chunks produced a 17 percent increase. INTRODUCTION In a high-volume/low-unit-value operation such as energywood production, optimization of the transport system, as well as harvesting, is crucial for its economic success. Decisions must be made concerning the product form to transport, and the mode of transport. The interaction between the transport system and operations must be considered. These factors are further complicated by customer requirements, such as seasonal fluctuations in demand, fuel storage capacity, and restrictions on moisture content of boiler feedstock. Biomass material suitable for energy production is highly heterogeneous in origin and form, making decisions regarding transport methods difficult to implement. In paiiicular,
Transcript
6
Effect of Product Form, Compaction, Vibration and Comminutionon Energywood Bulk Density
Timothy P. McDonald Bryce J. StokesResearch Engineer Project Leader
USDA Forest ServiceSouthern Forest Experiment Station
Auburn, Alabama 36849, USAand
Joseph F. McNeel
Research EngineerUSDA Forest Service
Pacific Northwest Experiment StationSeattle, Washington 98 105, USA
ABSTRACT
A study was performed to examine the changes in density of stacked roundwood, chips, andchunks as affected by various compaction treatments. Density of stacked roundwood bolts wastested for the effect of stacking orientation, binding of the stack ends, and species. Stacked boltwood occupied less than 50 percent of the total rack space for all species, giving final dry bulkdensities, based on total rack volume, of 159 to 293 kg/m3. Alternating butt ends in the rackincreased final bulk densities by an average of approximately 40 percent. The effect wasgreatest for mixed, small hardwood stems. Vibration and compaction of chipped material (pine,mixed hardwood, and sycamore) resulted in final dry bulk densities of from 170 to 273 kg/m3.Vibration increased dry bulk density by an average of 20 percent, whereas compaction increaseddry bulk density by about 30 percent, vibration of sycamore chunks produced a 17 percentincrease.
INTRODUCTION
In a high-volume/low-unit-value operation such as energywood production, optimizationof the transport system, as well as harvesting, is crucial for its economic success. Decisionsmust be made concerning the product form to transport, and the mode of transport. Theinteraction between the transport system and operations must be considered. These factors arefurther complicated by customer requirements, such as seasonal fluctuations in demand, fuelstorage capacity, and restrictions on moisture content of boiler feedstock.
Biomass material suitable for energy production is highly heterogeneous in origin andform, making decisions regarding transport methods difficult to implement. In paiiicular,
7
optimizing transport of energywood generally requires carrying the greatest possible amount of
material per load within legal restrictions. Many factors influence which form is best to use intransporting biomass material. This study, partially supported by IEA/BA Task IX, Activity 6,was performed to examine energywood transport alternatives and the relative advantages ofeach. Specific objectives of the study were to: (1) review and summarize literature concernedwith transportation methods and economics, and improvements in hauling efficiency, and (2)
identify and evaluate methods of increasing the mass per unit volume (density) of materialstransported for use as fuel through comminution, densification, or drying.
LITERATURE REVIEW
Trucking is the most common method of transporting forest products, includingenergywood. State trucking regulations in the Southern U.S. limit gross vehicle weight toapproximately 36 tonnes. Trailer-size limits vary from State to State, but assuming a 12.2 by 2.6by 2.7 m trailer with a maximum allowable payload of 24.5 tonnes (40’ by 102” by 9’, 27 tons),the material being hauled would need a green bulk density of about 286 kg/m3 (17.6 Ib/ft3) tomake maximum legal gross vehicle weight and trakport function most efficiently. Tree-lengthstacked pulp roundwood generally meets this criterion (see Table l), having a green bulk densityof 500 kg/m3, assuring 50 percent moisture content (MC), (Danielsson 1983), although log taperand tree species can cause significant variation from this value (Larsson and Carlsson 1982).Utilization of logging residuals for energy has received much attention in the literature (Curtinand others 1980; Danielsson 1983; Hartsough and Nakamura 1990; Miller and others 1987;Puttock 1987; Stuart and others 198 1). However, smaller trees and residues, although. importantpotential sources of energy biomass that account for up to 50 percent of standing biomass(Watson and others 1987), are inefficient to transport in untreated form because of their lowerbulk density. Some form of densification of these materials is therefore required to minimize thecost of supplying biomass for fuel.
Chipping is by far the most common method for processing unmerchantable trees.Chippers are expensive and difficult to maintain, and they require extra van capacity forcontinuous operation (Schiess and Yonaka 1982). On the positive side, they can be used toproduce energy or pulp chips, allowing maximum utilization of standing biomass.
Table 1. Biomass densities.
Product
RoundwoodTree sectionSmall trees (pet)Logging slashChips
Bulk density of green chips varies with species. Hassan (1976) reported a density of 265kg/m3 for green pine chips. Guimier (1985) listed bulk densities of green loblolly pine chips at245 kg/m3 and whole-tree hardwood chips (yellow poplar and oak) at 384 kg/m3. The bulkdensity of green pine chips is generally below the minimum for full legal payload. Because ofthis, chip compression has been proposed as a means of both densifying the load and, givenenough compression, decreasing the moisture content. Hassan (1976) reported that a pressure of0.3 MPa (40 psi) was sufficient to compress green pine chips (47-percent MC, wet basis) to halftheir original volume. This resulted in a final green bulk density of 530 kg/m3, with pressuremaintained. Haygreen (198 1) found in laboratory tests on loblolly pine, yellow poplar, and oakthat moisture content could be reduced through compression to about 35 percent wet basis,resulting in ratios of increased heat value to input energy of from 67 to 240. This requiredpressures, however, of about 100 MPa (15,000 psi). He concluded that a 50-percent reduction inboth solid volume and moisture content were possible with compression, although no indicationof final bulk density of the material was given.
Slash is another siguifkant energy-rich logging midual that is diffkult to utilize becauseof its low bulk density. A number of methods have been proposed to both collect and densifythis material. Slash piled in a central location can be hogged for fuel, and several studies haveexamined the performance and economics of tub grinders for this purpose. Hog grinders areadvantageous for densification of slash because they are not as susceptible to damage fromforeign material (Johnson 1985). Forrester (1993) summarizes features and costs of severalcommercially available grinders suitable for slash.
Arthur and others (1982) reported final dry bulk densities of from 146 to 23 1 kg/m3 forslash hogged using a 300 kW grinder. Productivity of the grinder was related to the size of thescreen holes in the tub, with a 76-mm-diameter hole having productivity about 5 times that of a19-mm hole. Input energy was less than one-fourth for the larger screen-hole size. Final bulkdensity increased with decreasing hole size, with the density for the 19-mm hole about 17percent greater than for the 76-mm hole. Moisture content of the material affected mostperformance parameters. Dry slash (1 l-percent MC, wet basis) required comparable amounts ofinput energy to grind, but productivity was reduced by about 15 percent compared to the greenmaterial for the 76-mm screen-hole size. For the smaller screen sizes, productivity wasmarginally higher for the dry material. Final bulk density averaged 24 percent higher for the dryslash.
Chipped and hogged biomass materials tend to contain a large proportion of finematerial, which can limit airflow through storage piles. This results in biological heating, whichdegrades the heat value of the chips, hastens dry-matter loss, and can even cause spontaneouscombustion. Fractioning into coarser pieces, or chunkwood, can reduce these problems. Mattsonand Karsky (1985) reported on the development of a chunking system. Tests run using severalhardwood and softwood species at approximately 50-percent MC (wet basis) resulted in final
9
bulk densities that averaged 350 kg/m3. Danielsson (1990) reported the physical and combustioncharacteristics of chunkwood. It was concluded that chunkwood required less energy to producethan chips, had lower air resistance, slightly lower dry-matter losses over time, and twice thecomplete burnout time. Studies indicated that, properly sized, chunkwood could be burned inmany types of conventional boilers. In addition, combustion tests indicated lower ash contentand lower temperatures in flue gases when burning chunkwood versus chips. Somedisadvantages in materials handling were noted mainly in the likelihood of bridging.
An alternative method of reducing the potential loss from biological heating is topostpone comminution of the material until near the time of combustion. Implementing thisapproach requires the development of a residue compaction system to increase transportefficiency.
Guimier (1985) presents an excellent comprehensive review of biomass compactiontechnologies, mainly North American and Scandinavian. His review identified four classes ofequipment currently available for compaction: (1) balers, (2) compaction into containers, (3)truck-mounted compactors, and (4) bundling. Parts of his review are summarized here.
Danielsson and others (1977) investigated the compaction of green and dry pine slash.Materials were compacted in a box using a hydraulic ram that produced pressures exceeding1000 kPa (150 psi). Curves of the change in volume, normalized to initial volume (volumereduction ratio or VRR) as a function of ram pressure, were developed. The curves indicated thata 50-percent decrease in green slash volume was possible with relatively low compressive force,but further compaction required exponential increases in pressure. VRR curves for dry slashshowed an exponential increase in pressure above approximately 75 percent. The pressurenecessary to achieve 50-percent reduction in VRR was significantly lower for dry slash, 200 kPavs 10 kPa (32 psi vs 1.5 psi). Final bulk densities after 50-percent reduction in VRR were 4 12kg/m3 for green material (54-percent MC, wet basis) and 272 kg/m3 for dry slash (20-percentMC, wet basis).
Baling is a common practice in many industries and several machines are available forthis purpose. Early tests using a slightly modified agricultural forage round baler (Fridley andBurkhardt 198 1) showed that it was possible to use standard equipment for biomass compaction,although the torque necessary to bend and break the residues into a round bale was about twicethat normally encountered when baling hay. Significant problems were also encountered whenstarting new bales. The baler was capable of conforming material up to 10 mm in diameter intothe bales. Green bulk density of bales made in this fashion ranged from 142 to 338 kg/m3 withhigher values for pine than hardwood species. Roll crushing and splitting of biomass prior tobaling to reduce moisture content and increase the maximum conformable size of material wasinvestigated by Bamett and others (1986). They determined the energy requirements for crushingthe small stems typical of those found on utility right-of-ways and found that it was feasible tocrush stems up to about 13 cm in diameter to achieve adequate moisture loss. Later work by
1 0
Sirois and others (I 99 1) indicated that the drop in moisture content of the crushed material washighly influenced by weather conditions
Square balers have also been developed and applied in compacting biomass. Guimier(1985) reported on a study that used scrap metal and paper balers to compact orchard prunings.Results indicated that material up to 10 cm in diameter could be formed into bales that retainedtheir shape after ejection, although some expansion was noted over time. Bales in excess of 400kg/m3 were made.
A prototype square baler designed specifically for biomass was developed at VirginiaPolytechnic Institute (Walbridge and Stuart 1979). In tests both at VP1 and in the PacificNorthwest (Schiess and Yonaka 1982), the machine was found capable of forming 1 m3 baleswith green bulk densities ranging from 522 to 658 kg/m3.
Jenkins (1983) reported on another agricultural machine adapted for biomasscompaction, the cotton moduler. The moduler was equipped with heavier gauge steel sides andlarger hydraulic cylinders to boost compaction pressure to 143 kPa (21 psi). The system wastested on prunings from almond trees and produced modules with bulk density averaging 102kg/m3. In tests using green logging residue, Miles (1981) reported the moduler could compactbales to about 190 kg/m3 wet basis. Miles and Miller (1982), however, found that tub grinding ofchaparral residues prior to compaction in the modular resulted in final bulk densities of over 400kg/m3.
Truck-mounted compactors have been developed mainly in Scandinavia. As reported inGuimier (1985), results of tests indicated that an increase in bulk density of green logging slashof about 30 percent could be achieved by using devices that vertically load trailers ofuncompacted material. Larsson and Carlsson (1982) provide an economic summary of severalScandinavian tests using truck- or trailer-mounted compactors.
The single most important factor influencing the transport costs of wood residues islength of haul (Adler 1985). Costs are generally assumed to be linearly proportional to hauldistance (Puttock 1987, Hartsough 1990). Adler (1985), however, reported that costs-per-unitdistance decrease with increasing distance up to about 160 km, after which they level off. Thedecrease likely reflects more efficient utilization of equipment.
Curtin and others (1980) determined hauling cost estimates for fuelwood as part of anoverall harvest system. Transport was the most highly variable component of the overall supplycost. Puttock (1987) found that fuel chips were competitive economically, on a cost-per-unit-energy basis with natural gas when hauled less than 80 km and competitive with fuel oil for hauldistances less than 200 km. Ames (1980) studied the costs of various phases of wood energyutilization and reported an average haul distance of wood residues of 92 km for the State ofGeorgia. Eza and others (1984) reported methods for determinin g the maximum distance that
1 1
energy wood could be hauled economically. They found that for conditions at the time, hauldistances of about 80 km were feasible.
Most wood products in the Southeast are hauled by truck (74 percent in 199 1) (Howell1993), SO most research has focused on truck transport of energy biomass. Types andconfigurations of trucks used in North America to haul biomass have been summarized (FERIC1990). Shipment by rail and barge, although infeasible in most locations in the U.S., has beenconsidered in some research. Adler (1985) reported that rail tariff rates were about 35 percentlower than truck rates for haul lengths of about 130 km. Rail rates tend to decrease withincreasing haul distance (Hyde and Corder 1971). Howell (1993) reported delivered prices ofpulpwood were about I3 percent lower for products shipped by rail. Hyde and Corder (197 1)also reported rates for barge haulage.
There are several problems associated with high moisture content m woody materialused for fuel including: (I) reduced fuel value, (2) degradation, (3) freezing, (4) higher handlingand transportation costs on a dry-unit basis, and (5) pricing and trade values. If wood chips areto become a substantial source of energy for residential, institutional, and commercial users,these problems have to be resolved. The benefits of drying woody biomass fuels are evident, butthe economics require careful assessment and continued development of alternative methods.The extent and techniques of drying are myriad; they range from simple, transpirational drying toelaborate, high-temperature precombustion drying. While natural drying occurs, it can beenhanced at one or several points along the supply chain. Some of the wood-drying options arereviewed in Stokes and others (in press) with an emphasis on transpirational drying of wholetrees and air-drying of chips.
METHODS
This study was designed to determine haul densities for some common energywoodproducts and to evaluate various methods of increasing densities. Treatments includedcompression of boltwood and vibration and compression of chips, chunks, and slash. The effectof species and the stacking arrangement of bolt wood were also investigated. Speciesdifferences and dryness of material were examined as covariates in the vibration and compactiontests.
MaterialsSpecies used in the study included sycamore (Platurzus occident&is L.), mixed southern pines(Pinus spp.), and mixed southern hardwoods (Caya spp., Liquidarnbar sty-acijh-a L., Quercusmbru L., Q. albn L.). Sycamore bolts were obtained from a short rotation plantation in southAlabama. The pine and mixed hardwood stems were selectively hand felled from stands nearAuburn, Alabama. Sycamore bolts were 4.3 m in length and 6.6 cm in diameter at the midpoint
of the stem. The pine and mixed hardwood stems were 6.1 m long. Average bolt diameterswere 7.0 cm for the pine, and 7.2 cm for the hardwood, both measured 1.5 m from the butt end.
12
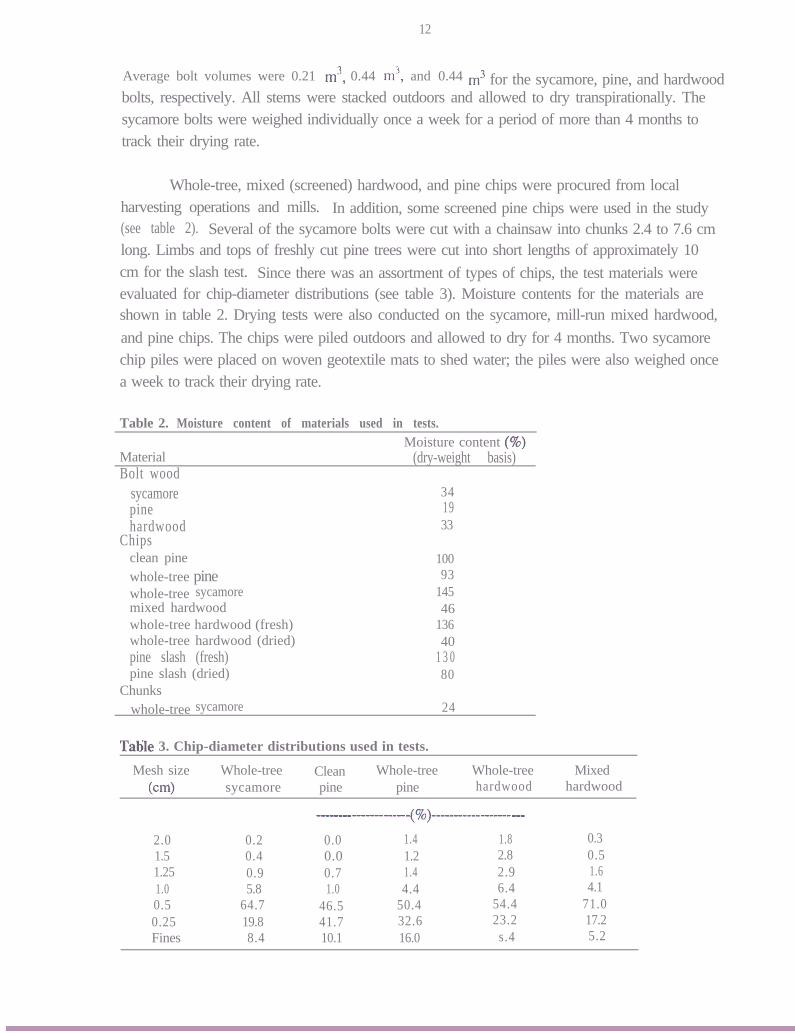
Average bolt volumes were 0.21 m7, 0.44 m’, and 0.44 m3 for the sycamore, pine, and hardwoodbolts, respectively. All stems were stacked outdoors and allowed to dry transpirationally. Thesycamore bolts were weighed individually once a week for a period of more than 4 months totrack their drying rate.
Whole-tree, mixed (screened) hardwood, and pine chips were procured from localharvesting operations and mills. In addition, some screened pine chips were used in the study(see table 2). Several of the sycamore bolts were cut with a chainsaw into chunks 2.4 to 7.6 cmlong. Limbs and tops of freshly cut pine trees were cut into short lengths of approximately 10cm for the slash test. Since there was an assortment of types of chips, the test materials wereevaluated for chip-diameter distributions (see table 3). Moisture contents for the materials areshown in table 2. Drying tests were also conducted on the sycamore, mill-run mixed hardwood,and pine chips. The chips were piled outdoors and allowed to dry for 4 months. Two sycamorechip piles were placed on woven geotextile mats to shed water; the piles were also weighed oncea week to track their drying rate.
Table 2. Moisture content of materials used in tests.Moisture content (%)
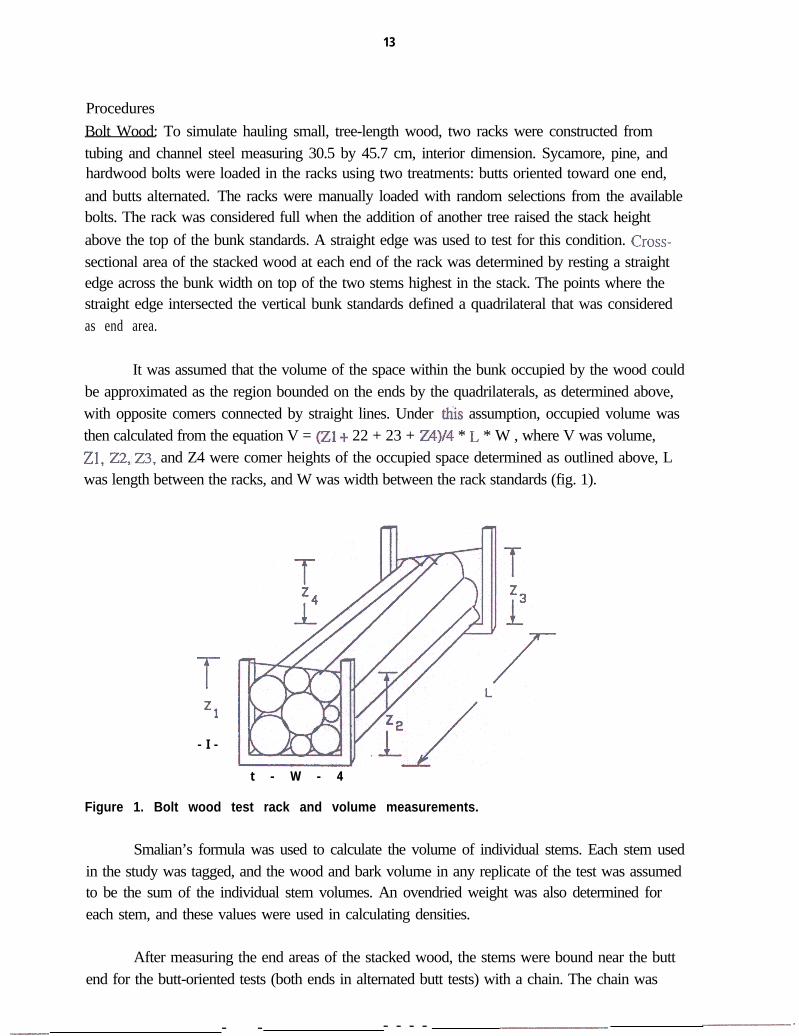
ProceduresBolt Wood: To simulate hauling small, tree-length wood, two racks were constructed fromtubing and channel steel measuring 30.5 by 45.7 cm, interior dimension. Sycamore, pine, andhardwood bolts were loaded in the racks using two treatments: butts oriented toward one end,and butts alternated. The racks were manually loaded with random selections from the availablebolts. The rack was considered full when the addition of another tree raised the stack heightabove the top of the bunk standards. A straight edge was used to test for this condition. Cross-sectional area of the stacked wood at each end of the rack was determined by resting a straightedge across the bunk width on top of the two stems highest in the stack. The points where thestraight edge intersected the vertical bunk standards defined a quadrilateral that was consideredas end area.
It was assumed that the volume of the space within the bunk occupied by the wood couldbe approximated as the region bounded on the ends by the quadrilaterals, as determined above,with opposite comers connected by straight lines. Under this assumption, occupied volume wasthen calculated from the equation V = (21 + 22 + 23 + 24)/4 * L * W , where V was volume,Zl, Z2,23, and Z4 were comer heights of the occupied space determined as outlined above, Lwas length between the racks, and W was width between the rack standards (fig. 1).
-r
z1
- I -
t - W - 4
Figure 1. Bolt wood test rack and volume measurements.
Smalian’s formula was used to calculate the volume of individual stems. Each stem usedin the study was tagged, and the wood and bark volume in any replicate of the test was assumedto be the sum of the individual stem volumes. An ovendried weight was also determined foreach stem, and these values were used in calculating densities.
After measuring the end areas of the stacked wood, the stems were bound near the buttend for the butt-oriented tests (both ends in alternated butt tests) with a chain. The chain was
^I_-.______-. -..------- - - - - - - _-___--_I--
1 4
tightened using a come-along until reaching a tensile load of approximately 8,900N. End areaswere then remeasured and a new occupied volume calculated. This procedure was uniform forall species tests except for the pine-oriented butt test. In that case, both ends of the stems werebound with a chain.
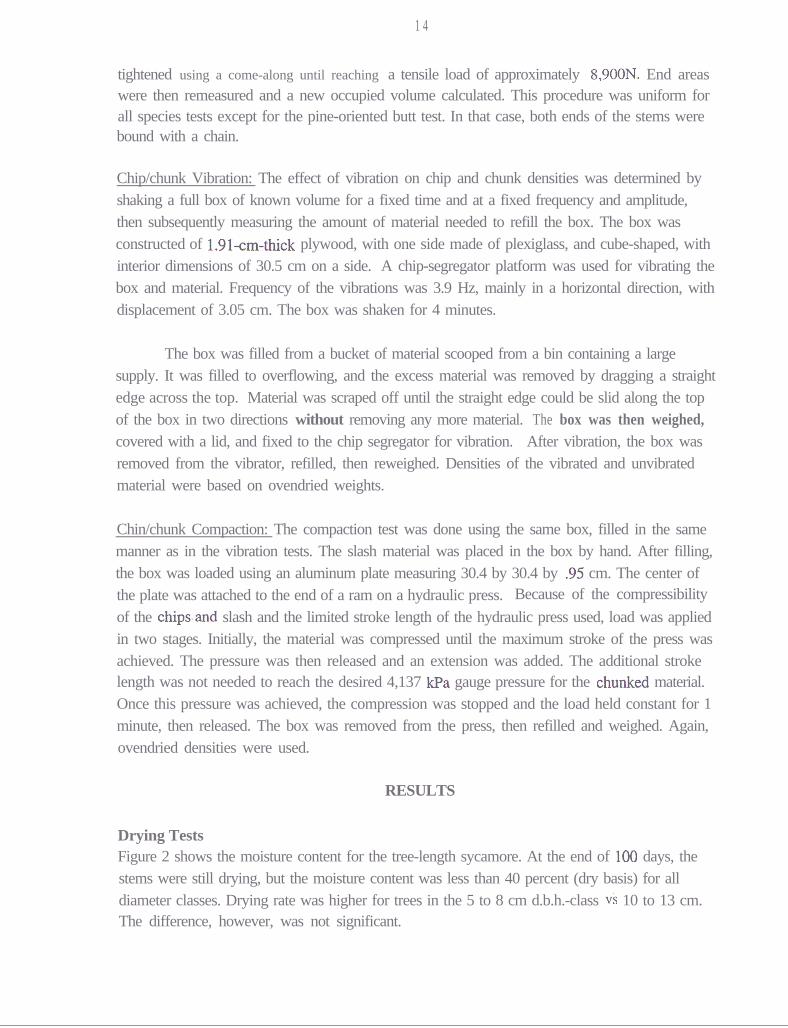
Chip/chunk Vibration: The effect of vibration on chip and chunk densities was determined byshaking a full box of known volume for a fixed time and at a fixed frequency and amplitude,then subsequently measuring the amount of material needed to refill the box. The box wasconstructed of 1.91-cm-thick plywood, with one side made of plexiglass, and cube-shaped, withinterior dimensions of 30.5 cm on a side. A chip-segregator platform was used for vibrating thebox and material. Frequency of the vibrations was 3.9 Hz, mainly in a horizontal direction, withdisplacement of 3.05 cm. The box was shaken for 4 minutes.
The box was filled from a bucket of material scooped from a bin containing a largesupply. It was filled to overflowing, and the excess material was removed by dragging a straightedge across the top. Material was scraped off until the straight edge could be slid along the topof the box in two directions without removing any more material. The box was then weighed,covered with a lid, and fixed to the chip segregator for vibration. After vibration, the box wasremoved from the vibrator, refilled, then reweighed. Densities of the vibrated and unvibratedmaterial were based on ovendried weights.
Chin/chunk Compaction: The compaction test was done using the same box, filled in the samemanner as in the vibration tests. The slash material was placed in the box by hand. After filling,the box was loaded using an aluminum plate measuring 30.4 by 30.4 by .95 cm. The center ofthe plate was attached to the end of a ram on a hydraulic press. Because of the compressibilityof the chips.and slash and the limited stroke length of the hydraulic press used, load was appliedin two stages. Initially, the material was compressed until the maximum stroke of the press wasachieved. The pressure was then released and an extension was added. The additional strokelength was not needed to reach the desired 4,137 kPa gauge pressure for the chunked material.Once this pressure was achieved, the compression was stopped and the load held constant for 1minute, then released. The box was removed from the press, then refilled and weighed. Again,ovendried densities were used.
RESULTS
Drying TestsFigure 2 shows the moisture content for the tree-length sycamore. At the end of 100 days, thestems were still drying, but the moisture content was less than 40 percent (dry basis) for alldiameter classes. Drying rate was higher for trees in the 5 to 8 cm d.b.h.-class vs 10 to 13 cm.The difference, however, was not significant.
/ ..J . . . . . . . . . /...:I
: ’
: : Occupied. . . . ..a
0 Wood & Bark
Figure 2. Bolt wood space/volume aermltlons tor test rack.
However, chips are very sensitive to rainfall as shown in figure 3. In addition to thesycamore chips discussed, drying tests were also completed on some mill-run mixed hardwoodand pine chips for comparison. In all cases, the chips dried to about 40- to 45- percent moisture(dry basis), and were very sensitive to rainfall.
0 20 40 60 80 100 =
TimeC&Y s>D.B.H.
1 3 10 8 5-cm-- - c m - - c m - -as -
Figure 3. Moisture loss for winter/spring air-drying of sycamore bolts.
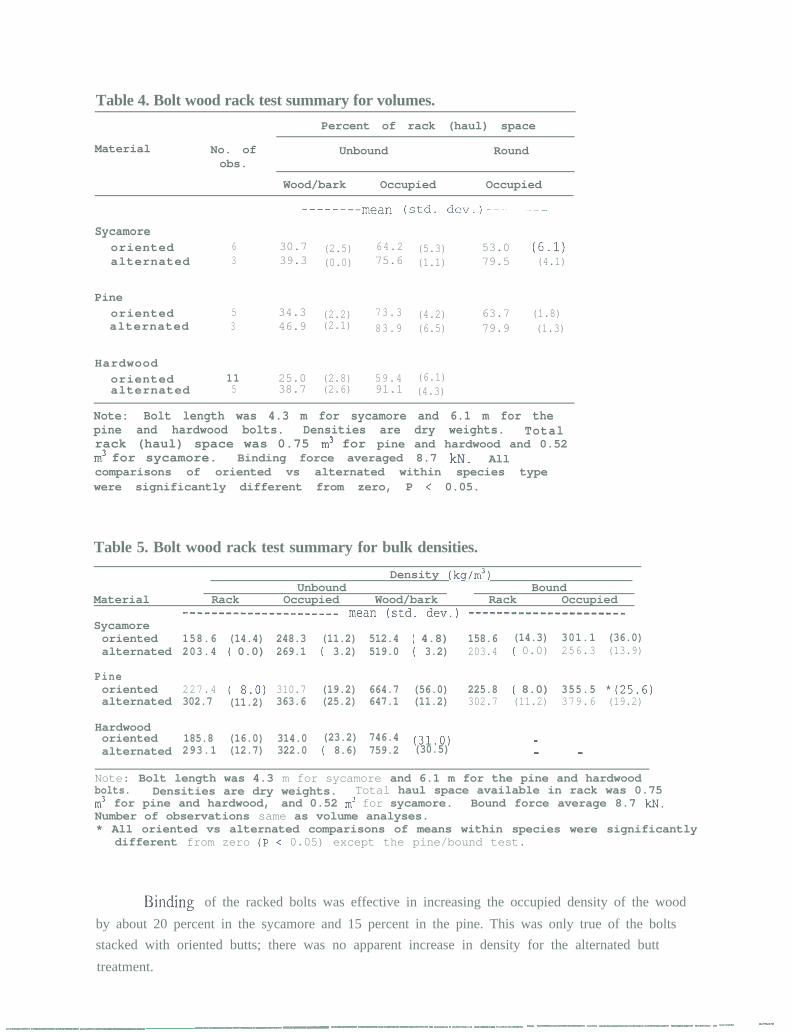
Bolt WoodIn the following discussion, hauling density refers to the amount of space within the total rackvolume actually occupied by wood and bark. The term “occupied density” is used for the densityof the space bounded by the convex hull of the region within the rack actually containing wood(fig. 4). Tables 4 and 5 summarize the volumetric and bulk density test results, respectively.None of the treatments could achieve better than 50-percent utilization of available space aswood and bark. In fact, only the pine/alternated butt treatment achieved better than 40-percentutilization of space as wood and bark. Bolt-wood densities of the rack space hauling densityranged from 159 to 227 kg/m3 for oriented butts and 203 to 293 kg/m3 for alternated butts.These densities are sufficient for maximum payload if these test results are scaleable to full-trucksizes.
120.Eiin 1 0 020$ 8 02E9 6 0zg 40
a2 0
00 10 3 0 4 0
Time (days)
Figure 4. Moisture loss for winter/spring air-drying of several species of chips.
Alternating the butts of the trees significantly increased the density of wood in the rack(P < 0.05, n = 8). Magnitude of the increases was dependent on a number of factors, mainlyspecies. Alternation seemed to have its greatest beneficial effect for the mixed hardwood bolts,with a 58-percent increase in hauling density. This was probably due to the form of thehardwood bolts. The increases in occupied density because of alternating butts were much lower-- less than 10 percent in the hardwood species. This indicated that alternating butt ends onlymarginally increased the efficiency of the stacking. The benefit of alternating was due to theincreased rack volume that could be filled with additional wood.
Note: Bolt length was 4.3 m for sycamore and 6.1 m for thepine and hardwood bolts. Densities are dry weights. Totalrack (haul) space was 0.75 m3 for pine and hardwood and 0.52m3 for sycamore. Binding force averaged 8.7 IcN. Allcomparisons of oriented vs alternated within species typewere significantly different from zero, P < 0.05.
Table 5. Bolt wood rack test summary for bulk densities.
Density (kg/m3)Unbound Bound
Material Rack Occupied Wood/bark Rack Occupied-----~-~--__~~~----___ mean (std. dev.) ~~------_____~__~-____
Note: Bolt length was 4.3 m for sycamore and 6.1 m for the pine and hardwoodbolts. Densities are dry weights.m' for pine and hardwood,
Total haul space available in rack was 0.75and 0.52 m' for sycamore. Bound force average 8.7 kN.
Number of observations same as volume analyses.* All oriented vs alternated comparisons of means within species were significantly
different from zero (P i 0.05) except the pine/bound test.
Binding of the racked bolts was effective in increasing the occupied density of the wood
by about 20 percent in the sycamore and 15 percent in the pine. This was only true of the boltsstacked with oriented butts; there was no apparent increase in density for the alternated butt
VibrationAll tested materials showed a significant increase in dry bulk density in response to vibration
(table 6) (P < 0.05, n = 8). The increase was remarkably uniform -- about 20 percent in all cases.It would be interesting to test whether or not the increase, and its uniformity, were related to
frequency or amplitude of vibration.
Table 6. Before and after vibration (dry) densities.
Variable No. of Mean Std. Min. Max.obs. Dev.
_____--__-- kg/m’----------
Clean pine chipsunvibratedafter refill
Whole-tree pine chipsunvibratedafter refill
Whole-tree sycamore chipsunvibratedafter refill
Whole-tree sycamore chunksunvibratedafter refill
Mixed-hardwood chipsunvibratedafter refill
Whole-tree hardwood chipsunvibratedafter refill
Whole-tree hardwood chipsafter 7 days of dryingunvibratedafter refill
Pine slashunvibratedafter refill
Pine slashafter 7 days of dryingunvibratedafter refill
5 171.0 2.5 167.5 173.35 209.8 4.5 202.7 214.5
55
6 139.8 3.5 134.6 144.26 169.8 2.5 165.8 173.0
5 210.7 0 210.7 210.75 246.3 5.3 238.8 252.9
5 153.7 2.2 150.6 156.75 185.0 4.6 178.2 190.5
5 206.0 6.1 200.4 216.45 247.7 5.2 244.5 256.5
5 203.9 9.6 191.1 215.65 252.9 9.6 240.1 264.6
5 74.6 10.6 64.5 89.75 93.6 8.6 84.1 103.7
5 59.9 9.7 47.8 73.35 73.9 7.3 63.7 82.8
152.2 1.7 151.0 154.0182.4 2.7 181.2 187.3
Note: All densities are ovendried weights.
Final bulk densities varied with species and type of material. The highest densities werefound in the whole-tree hardwood chips, with the air-dried chips showing a slightly higher final
density. Clean and whole-tree pine chips had intermediate densities, and sycamore chips, the
19
lowest among all chipped materials. Sycamore chunks, however, had a density comparable tothe mixed hardwood chips. Density of pine slash after vibration was about one-third to one-halfthat of the other materials. It was not known why the dry slash had a final dry density nearly 30percent lower than the green slash; it may be that moisture content affects settling or compactingcharacteristics.
Compaction
Increases in final dry density after compaction were more variable, but again all materials testedshowed a significant increase (table 7) (P < 0.05, n = 8). With the exception of the sycamorechunks, the increase in final density was comparable to, or greater than, the increase due tovibration. Final densities of the compacted material were also higher, again with the exception ofthe sycamore chunks.
Table 7. Before and after compaction (dry) densities.
Variable No. of Meanobs.
Std.Dev.
Min. Max
Clean pine chipsunvibratedafter refill
Whole-tree pine chipsunvibratedafter refill
Whole-tree sycamore chipsunvibratedafter refill
Whole-tree sycamore chunksunvibratedafter refill
Mixed-hardwood chipsunvibratedafter refill
Whole-tree hardwood chipsunvibratedafter refill
Pine slash (fresh)unvibratedafter refill
Pine slashafter 7 days of dryingunvibratedafter refill
5 156.4 3.1 153.4 159.55 201.2 2.7 196.3 202.4
5 138.0 2.7 134.6 139.45 175.9 3.1 173.0 177.8
5 220.1 4.7 215.4 224.85 230.4 3.9 224.3 234.2
5 156.7 2.2 153.7 159.85 193.0 2.6 190.5 196.7
5 211.2 6.7 203.9 220.25 273.2 5.8 269.2 281.4
5 74.9 9.6 63.3 87.65 107.0 7.7 97.3 116.8
5 62.4 7.7 54.1 73.35 95.6 7.5 86.0 101.9
176.3 3.6 173.3 182.2214.5 2.1 211.5 217.4
--kgfm3---
Note: Densities are dry weight.
2 0
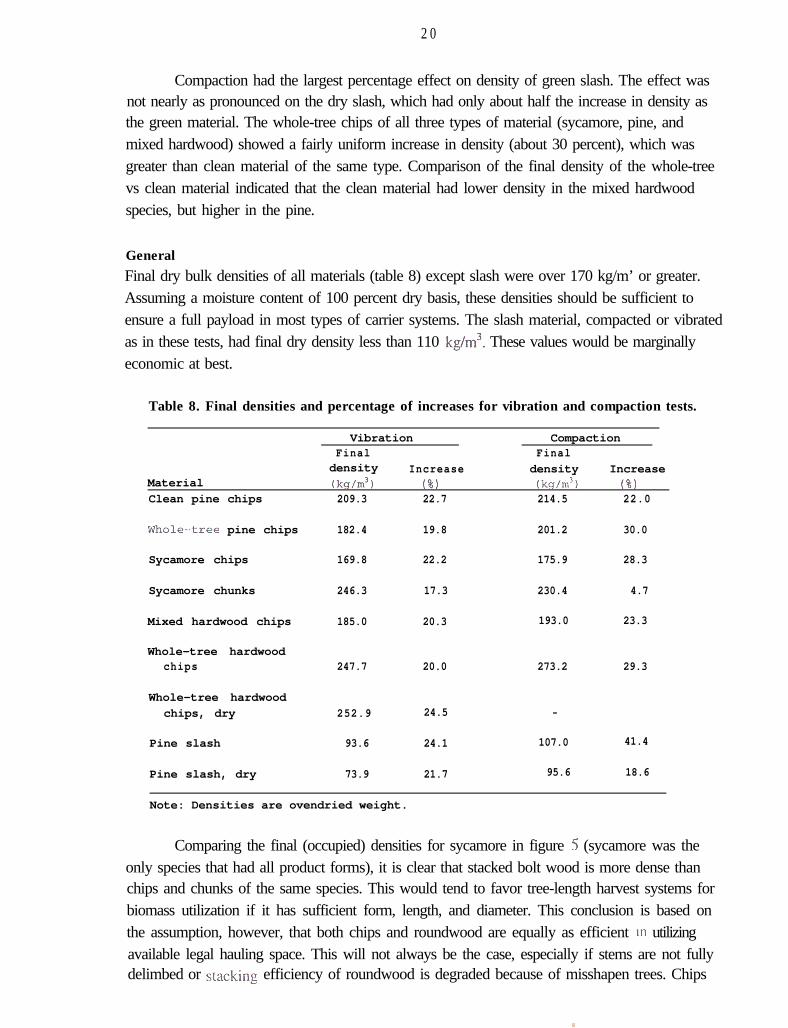
Compaction had the largest percentage effect on density of green slash. The effect wasnot nearly as pronounced on the dry slash, which had only about half the increase in density asthe green material. The whole-tree chips of all three types of material (sycamore, pine, andmixed hardwood) showed a fairly uniform increase in density (about 30 percent), which wasgreater than clean material of the same type. Comparison of the final density of the whole-treevs clean material indicated that the clean material had lower density in the mixed hardwoodspecies, but higher in the pine.
GeneralFinal dry bulk densities of all materials (table 8) except slash were over 170 kg/m’ or greater.Assuming a moisture content of 100 percent dry basis, these densities should be sufficient toensure a full payload in most types of carrier systems. The slash material, compacted or vibratedas in these tests, had final dry density less than 110 kg/m3. These values would be marginallyeconomic at best.
Table 8. Final densities and percentage of increases for vibration and compaction tests.
Comparing the final (occupied) densities for sycamore in figure 5 (sycamore was theonly species that had all product forms), it is clear that stacked bolt wood is more dense thanchips and chunks of the same species. This would tend to favor tree-length harvest systems forbiomass utilization if it has sufficient form, length, and diameter. This conclusion is based onthe assumption, however, that both chips and roundwood are equally as efficient m utilizingavailable legal hauling space. This will not always be the case, especially if stems are not fullydelimbed or stacking efficiency of roundwood is degraded because of misshapen trees. Chips
2 1
offer the advantages of a greater degree of utilization of standing biomass and a more consistentload size. The other species had the same general trends.
Figure 5. Product bulk densities for sycamore.
CONCLUSIONS
Transport of small-sized wood products or residues is generally not economical unlesssome method of densification is employed. Bolt lengths of small trees have higher density ofoccupied space than either chipped or chunked material of the same species composition.Overall density of bolt wood stacked uniformly (butts oriented), including haul rack space notfilled, was somewhat lower than that for the same material chipped. Alternating the butt endsincreased the overall density, but did not increase the density of occupied space. Vibration ofchipped or chunked materials increased bulk density by about 20 percent for the species typestested. Compaction of chipped or chunked material also resulted in bulk density increases, butthe magnitude was dependent on species and form of the material (chunks were only marginallycompacted).
REFERENCES
Adler, T.J. 1985. An analysis of wood transport systems: costs and external impacts, Hanover,NH: Thayer School of Engineering, Dartmouth College. 39 p. In cooperation with: U.S.Department of Agriculture, Forest Service, Northeastern Forest Experiment Station,Burlington, VT.
Ames. Glenn. 1980. Wood fuel costs. In: Proceedings of the symposium Wood EnergyEconomics, 1980 April 30, Atlanta, GA. Atlanta, GA: Georgia Institute of TechnologyEngineering Experiment Station: 44-66.
2 2
Arthur, J-F; Kepner, R-A.; Dobie, J.B.; Milier, G.E.; Parsons, P.S. 1982. Tub grinderperformance with crop and forest residues. Transaction of the ASAE. 25(6): 1,488- 1,494.
Bamett, Paul E-; Sirois, Donald L.; Ashmore, Cohn. 1986. Reduction of biomass moisture bycrushing/splitting - a concept. In: Rockwood, Donald L. ed. Proceedings of the 1985 SouthernForest Biomass Workshop, 1985 June 1 I- 14;Gainesville, FL: University of Florida Press :13-16.
Curtin, D.T.; Brooks, R.T.; Forrester, W.R.; Paul, J.G. 1980. Biomass harvesting system testand demonstration. Tech. Note B40. Norris, TN: Tennessee Valley Authority. 43 p.
Danielsson, Bengt-Olof. 1983. Harvesting and transportation of small whole trees in Sweden.ASAE paper no. 83-1599. ASAE 2950 Niles Road, St. Joseph, MI. 17 p.
Danielsson, Bengt-Olof. 1990. Chunkwood as wood fuel. Biomass. 22: 21 l-228.Danielsson, Bengt-Olaf; Marks, Jorgen; Sall, Hans-Olof. 1977. Compressing small trees and
tree components. Report no. 119-1977. Department of Operational Efficiency, Royal Collegeof Forestry, Garpenberg, Sweden.
Em., D.A.; McMinn, J.W.; Dress, P.E. 1984. Cost-effective trucking distances for woodybiomass fuels. Gen. Tech. Rep. SE-326. Asheville, NC: U.S. Department of Agriculture,Forest Service, Southeastern Forest Experiment Station. 3 p.
FERIC. 1990. A databank of transportation equipment for small trees and forest residues.Published by IEA/BEA Task VI Activity 3: Available from: USDA Forest Service, DeVallDrive, Auburn University, AL 36849: 47 p.
For-rester, Patrick D. 1993. Portable hogs and grinders for processing woodwaste. FERlC FieldNote no.: General-30. FERIC, 2601 East Mall, Vancouver, B.C., Canada V6T 124: 2 p.
Fridley, J.; Burkhardt, T.H. 198 1. Densifying forest biomass into large round bales. ASAE PaperNo. 8 1-1599. St. Joseph, MI: American Society of Agricultural Engineers. 21 p.
Guimier, D.Y. 1985. Evaluation of forest biomass compaction systems. Spec. Rep. SR-30.Pointe Claire, Quebec, Canada: Forest Engineering Research Institute of Canada. 64 p.
Hartsough, B.R. 1990. Product/harvesting options for agroforestry plantations in the San JoaquinValley, California. ASAE Paper No. 90-7546. St. Joseph, MI: American Society ofAgricultural Engineers. 19 p.
Hartsough, B.R.; Nakamura, G. 1990. Harvesting eucalyptus for fuel chips. CaliforniaAgriculture. 44( 1): 7-8.
Hassan, Awatif El-Domiaty. 1976. Compaction of wood chips - energy cost. ASAE paper no.76-1568. ASAE, 2950 Niles Road, St. Joseph, M149085. 17 p.
Haygreen, John G. 198 1. Potential for compression drying of green wood chip fuel- ForestProducts Journal. 3 I(8): 43-54.
Howell, Michael. 1993. Pulpwood prices in the Southeast, 1991. Forest Service Research NoteSE-366. U.S. Department of Agriculture, Forest Service, Southeastern Forest ExperimentStation, Asheville, NC. 6 p. .’
Hyde, P.E.; Corder, S.E. 197 1. Transportation costs in Oregon for wood and bark residues.Forest Products Journal. 21( 10): 17-25.
-- --
2 3
Jenkins, B-M. 1983. Module systems applied to biomass. ASAE Paper No. 83-3553. St. Joseph,MI: American Society of Agricultural Engineers. 20 p.
Johnson. Vem. 1985. m-woods shredding of logging residues at roadside. IX Comminution ofWood and Bark, Proceedings no. 7336; 1984 October 1-3; Chicago. Madison, WI. ForestProducts Research Society. 137- 138.
Larsson, M.; Carlsson, T. 1982. Trucking of logging residues and tree sections. In: Proceedingsof the 6th international FPRS industrial wood energy forum ‘82; Vol. 1; 1982 March 8-10;Washington, DC. Madison, WI: Forest Products Research Society 137- 148.
Mattson, J.A.; Karsky, R. 1985. Developments in wood chunking technology. In: Proceedings ofan FPRS conference; Comminution of wood and bark; 1984 October l-3; Chicago, IL.Madison, WI: Forest Products Research Society 169- 180.
Miles, J.A. 198 1. A new method to recover logging residues for energy. Report to U.C.Appropriate Technology. University of California, Berkeley, CA 94720. 5 p.
Miles, J.A.; Miller, G.E. 1982. New approaches to harvesting chaparral for energy. In:Proceedings of the symposium on dynamics and management of Mediterranean-typeecosystems, 198 1 June 22-26, San Diego CA. Albany CA: USDA Forest Service Gen. Tech.Rep. PSW-58. Pacific Southwest Experiment Station. 620.
Puttock, G.D. 1987. The economics of collecting and processing whole-tree chips and loggingresidues for energy. Forest Products Journal. 37(6): 15-20.
Schiess, P.; Yonaka, K. 1982. Evaluation of new concepts in biomass fiber field processing andtransportation. New York: Academic Press, Inc. 3 1 p.
Sirois, Donald L.; Rawlins, Cynthia L.; Stokes, Bryce J. 1991. Evaluation of moisture reductionin small diameter trees after crushing. Bioresource Technology. 37:53-60.
Stokes, B.J.; McDonald, T.P.; Kelley, T. (In press). Transpirational Drying and Costs forTransporting Woody Biomass - A Preliminary Review. In: Proceedings of IEA Task IX,Activity 6 Meeting; 1993 May 16-22; Fredericton, N.B. Canada.
Stuart, William B.; Porter, Carl D.; Walbridge, Thomas A.; Oderwald, Richard G. 198 1.Economics of modifying harvesting systems to recover energy wood. Forest ProductsJournal. 3 1(8):37-42.
Walbridge, T.A.; Stuart, W.B. 1979. A new approach to harvesting, transportation, and storinglogging residues. In: An integrated investigation of procurement, harvesting, drying,transportation and storage of woody biomass; Blacksburg, VA: Virginia Polytechnic Instituteand State University 15 p.
Watson, W.F.; Ragan, J.R.; Straka, T.J.; Stokes, B.J. 1987. Economic analysis of potentialfuelwood sources. In: Proceedings of the 1986 Society of American Foresters NationalConvention, Forests, the World and the Profession; 1986 October 5-8; Birmingham, AL.Bethesda, MD: Society of American Foresters: 339-342.