Page 1
Article
Effect of Protonation State and N-Acetylation of Chitosan on Its Interaction with Xanthan Gum: A Molecular Dynamics Simulation Study
Suha M. Dadou 1, Musa I. El-Barghouthi 2, Samer K. Alabdallah 2, Adnan A. Badwan 3,*, Milan D.
Antonijevic 1, and Babur Z. Chowdhry 1
1 Department of Pharmaceutical, Chemical and Environmental Science, Faculty of Engineering and Science,
University of Greenwich, Medway Campus, Chatham Maritime, Kent ME44TB, UK;
[email protected] (S.M.D.); [email protected] (M.D.A.);
[email protected] (B.Z.C.) 2 Department of Chemistry, The Hashemite University, P.O. Box 150459, Zarqa 13115, Jordan;
[email protected] (M.I.E.-B.); [email protected] (S.K.A.) 3 The Jordanian Pharmaceutical Manufacturing Company (PLC), Research and Innovation Centre, P.O. Box
94, Naor 11710, Jordan
* Correspondence: [email protected] ; Tel.: +962-6-5727-207; Fax: +962-6-5727-641
Received: 17 August 2017; Accepted: 20 September 2017; Published: date
Abstract: Hydrophilic matrices composed of chitosan (CS) and xanthan gum (XG) complexes are of
pharmaceutical interest in relation to drug delivery due to their ability to control the release of active
ingredients. Molecular dynamics simulations (MDs) have been performed in order to obtain
information pertaining to the effect of the state of protonation and degree of N-acetylation (DA) on
the molecular conformation of chitosan and its ability to interact with xanthan gum in aqueous
solutions. The conformational flexibility of CS was found to be highly dependent on its state of
protonation. Upon complexation with XG, a substantial restriction in free rotation around the
glycosidic bond was noticed in protonated CS dimers regardless of their DA, whereas deprotonated
molecules preserved their free mobility. Calculated values for the free energy of binding between
CS and XG revealed the dominant contribution of electrostatic forces on the formation of complexes
and that the most stable complexes were formed when CS was at least half-protonated and the DA
was ≤50%. The results obtained provide an insight into the main factors governing the interaction
between CS and XG, such that they can be manipulated accordingly to produce complexes with the
desired controlled-release effect.
Keywords: chitosan; xanthan gum; reducing/non-reducing residues; electrostatic interactions;
docking; molecular dynamics simulation
1. Introduction
Over the past three decades, hydrophilic polysaccharides have gained wide scientific interest in
relation to drug delivery systems. This is due, in part, to the fact that they are naturally occurring
polymers of low toxicity, exhibit high stability, are biocompatible/biodegradable, and show
mucoadhesion properties [1,2]. In addition, the structure of polysaccharides can be relatively easily
modified in order to synthesize derivatives with desirable characteristics for drug delivery [3].
Chitosan (CS) is a hydrophilic, linear polysaccharide composed of repeated β-(1-4) linked units
of either 2-amino-2-deoxy-β-D-glucopyranose (glucosamine) or 2-acetamido-2-deoxy-β-D-
glucopyranose (glucosacetamide), depending on the degree of N-acetylation (DA) (Figure 1a) [4]. CS
is prepared by the deacetylation of chitin, which is mainly found in crustaceans, fungi, and insects
[5]. Following its preparation, various numbers of acetamide groups (C2H5NO) can be found randomly
Page 2
Mar. Drugs 2017, 15, x 2 of 18
distributed at the C2 atoms along the CS chain [6]. This may result from the harsh alkaline conditions
used to produce CS from chitin [7]. The physicochemical properties of CS, namely solubility and
conformational flexibility, are highly affected by the DA [8]. Moreover, the distribution of the acetyl
groups along the CS chain affects its behavior in solution [9]. The primary amine groups of glucosamine
are responsible for the cationic nature and net positive charge of CS under acidic and neutral conditions,
allowing it to interact with negatively charged poly-anionic molecules via electrostatic forces [10]. In
contrast, CS is uncharged and insoluble under neutral-alkaline conditions [11]. The threshold between
the soluble and insoluble states of CS lies between pH 6.2 and 6.5, which correlates with the pKa of CS
in aqueous solutions [12]. It can be concluded that the solubility and complexation properties of CS are
governed mainly by the degree of N-acetylation and pH of solution [13,14].
(a)
(b)
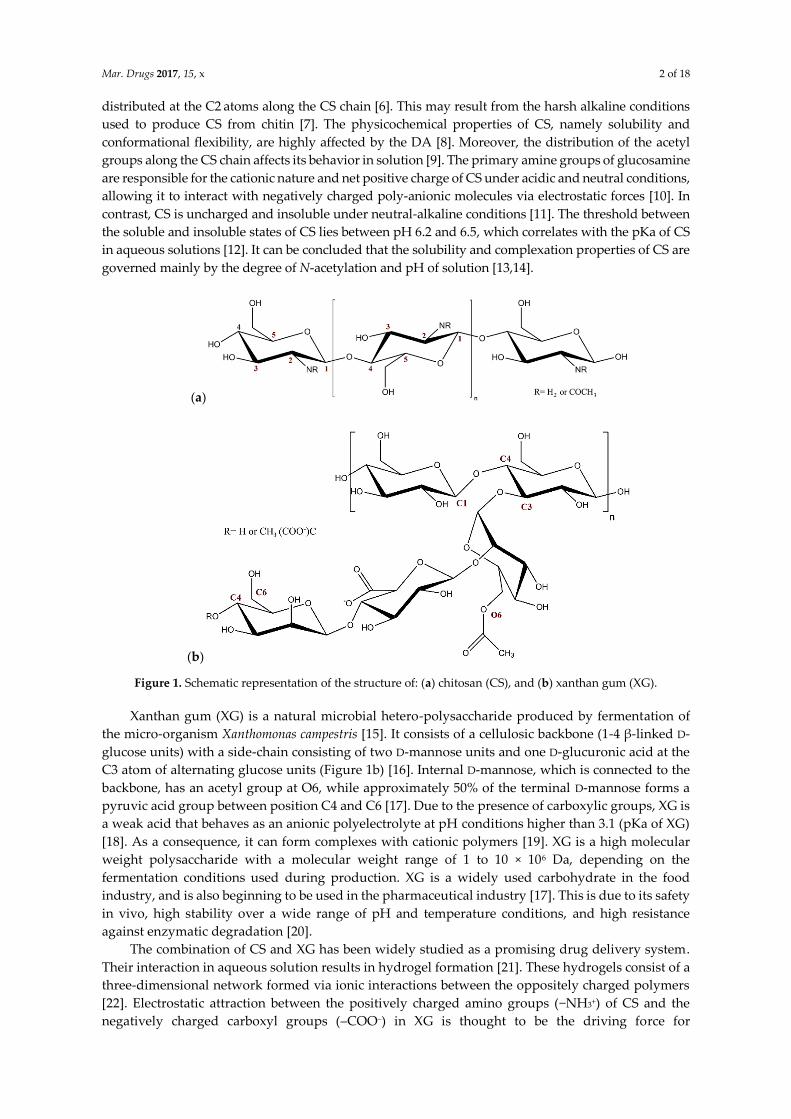
Figure 1. Schematic representation of the structure of: (a) chitosan (CS), and (b) xanthan gum (XG).
Xanthan gum (XG) is a natural microbial hetero-polysaccharide produced by fermentation of
the micro-organism Xanthomonas campestris [15]. It consists of a cellulosic backbone (1-4 β-linked D-
glucose units) with a side-chain consisting of two D-mannose units and one D-glucuronic acid at the
C3 atom of alternating glucose units (Figure 1b) [16]. Internal D-mannose, which is connected to the
backbone, has an acetyl group at O6, while approximately 50% of the terminal D-mannose forms a
pyruvic acid group between position C4 and C6 [17]. Due to the presence of carboxylic groups, XG is
a weak acid that behaves as an anionic polyelectrolyte at pH conditions higher than 3.1 (pKa of XG)
[18]. As a consequence, it can form complexes with cationic polymers [19]. XG is a high molecular
weight polysaccharide with a molecular weight range of 1 to 10 × 106 Da, depending on the
fermentation conditions used during production. XG is a widely used carbohydrate in the food
industry, and is also beginning to be used in the pharmaceutical industry [17]. This is due to its safety
in vivo, high stability over a wide range of pH and temperature conditions, and high resistance
against enzymatic degradation [20].
The combination of CS and XG has been widely studied as a promising drug delivery system.
Their interaction in aqueous solution results in hydrogel formation [21]. These hydrogels consist of a
three-dimensional network formed via ionic interactions between the oppositely charged polymers
[22]. Electrostatic attraction between the positively charged amino groups (−NH3+) of CS and the
negatively charged carboxyl groups (–COO−) in XG is thought to be the driving force for
Page 3
Mar. Drugs 2017, 15, x 3 of 18
polyelectrolyte complex formation [23,24]. The properties of the resultant complex can be altered by
changing the electrostatic behavior of each polymer [25]. This can be achieved by changing either the
DA of CS or the pH of aqueous solutions [26]. In addition, changing the mixing conditions (in
particular the reaction time and ratio of each component) has been hypothesized to play an important
role in governing the physicochemical properties and stability of the resulting complexes [26,27].
Several studies have examined the structural dynamics of chitosan utilizing molecular dynamic
simulations (MDs). Prathab and Tejraj used molecular dynamics studies to determine the physical
and mechanical properties of CS, chitin, and cellulose [28]. Calculations of the solubility parameter
() showed that CS has the highest aqueous solubility of the polymers examined. Conformational
changes of CS dimers at various DA values using both molecular dynamics and Monte Carlo
simulations have also been reported [29]. It was found that the most conformationally flexible
disaccharide unit is the 50% acetylated form of CS, and that the intramolecular hydrogen bond
between atom OH3 from one sugar unit and atom O5 from the succeeding unit is responsible for the
stabilization of this conformation. Franca et al. reported that the flexibility of the polysaccharide chain
is inversely related to the stability of the aforementioned intramolecular hydrogen bond [30].
Moreover, NH3+ groups seem to increase water exchange around the O3 atom, destabilizing the HO3-
O5 hydrogen bond which is responsible for reducing its conformational flexibility and locking the
polymer conformation into a twofold helix. In other work, Franca et al. considered the conformational
flexibility and ability of CS to form nanoparticles as a function of the degree and distribution of N-
acetyl groups [31]. It was noted that the flexibility of the CS chain is inversely proportional to its
degree of acetylation. In addition, their results suggested that the block distribution of acetyl groups
caused more nanoparticle aggregation than uniform distribution. The effect of water on the
complexation between CS and the drug gemcitabine has been reported [32]. The loading efficiency of
the drug was enhanced when water was added to the system, whereas shorter distances between CS
molecules and gemcitabine were reported in the absence of water. Furthermore, MDs have been
utilized to study the mechanism of nanoparticle formation between CS and tripolyphosphate (TPP)
[33]. It was found that the charge properties of TPP and the coordination number of CS are the main
factors in determining the energy of interaction between them.
MDs of a single chain of XG in aqueous solution showed that the side-chain direction was
toward the periphery, thus shielding the XG backbone from direct contact with adjacent chains [34].
Moreover, the results revealed that the most stable conformation of XG in solution is very close to its
ordered conformation in the solid state. Levy et al. examined the effect of pyruvate and acetate groups
on the conformational changes of XG in aqueous solution using three XG models; wild form,
acetylated, and non-acetylated modified forms [35]. GEGOP software and Metropolis Monte Carlo
dynamic simulations were utilized. They concluded that the wild-type XG shows higher viscosity in
solution and that its side-chains are more flexible than the acetylated and non-acetylated forms.
Although there is a substantial amount of scientific literature relating to CS and XG complexes,
the intermolecular binding mechanism and conformational changes which occur at the molecular
scale are still unclear. Furthermore, MDs have not, to the best of our knowledge, been utilized to
elucidate the interaction between the two polymers. In addition, there are controversial findings in
the literature regarding the effect of CS DA on its properties. The aim of the work reported herein is
to study the behavior, from a molecular perspective, of CS in aqueous solution as a function of its
protonation and the degree and position of N-acetylation, as well as how the foregoing factors affect
the interaction of CS with XG.
2. Results and Discussion
2.1. Free CS Dimers
It is known that the degree of acetylation and protonation play a major role in defining the
physicochemical characteristic of CS; namely its conformation, solubility, and its ability to complex
with other molecular entities [23,36,37]. Therefore, nine dimers with various degrees of acetylation
Page 4
Mar. Drugs 2017, 15, x 4 of 18
and protonation, either on the reducing or the non-reducing end, were considered for study (Figure
2). Subsequently, a 100 ns MD simulation was carried out for each dimer.
H0A0
H0A1n
H1nA0
H1A1n
H1rA0
H0A1r
H2A0
H1A1r
H0A2
Figure 2. Schematic representation of chitosan (CS) dimers used in this study: (H0A0) neutral CS 0%
degree of acetylation (DA); (H1nA0) CS 0% DA, 50% protonated at the non-reducing end; (H1rA0) CS
0% DA, 50% protonated at the reducing end; (H2A0) CS 0% DA, 100% protonated; (H0A1n) CS 50%
DA at the non-reducing end, 0% protonated; (H1A1n) CS 50% DA at the non-reducing end, 50%
protonated; (H0A1r) CS 50% DA, at the reducing end, 0% protonated; (H1A1r) CS 50% DA at the
reducing end, 50% protonated; and (H0A2) CS 100% DA (chitin).
In order to obtain a clear image regarding the conformations that CS may adopt in aqueous
solution, distribution plots of the dihedral angles, ϕ and ψ, of the glycosidic bond were generated
from the last 60 ns of each trajectory (Figure 3). Amongst all CS dimers, it is obvious that the mono-
protonated, deacetylated CS dimer (H1nA0) exhibits the broadest distribution of ϕ and ψ values. Four
main clusters can be noticed in the plot. Representative snapshots extracted from the MD simulation
for each cluster are shown in the data in Figure 4. The most populated distributions of ϕ and ψ (A
and B) show that the protonated amine is interacting with the primary hydroxyl group on the adjacent
unit, while the two-amine groups are opposite each other. For the less populated distributions (C and
Page 5
Mar. Drugs 2017, 15, x 5 of 18
D), it seems that the glucose units rotate to enhance the interaction of the uncharged amine with the
charged one via ion–dipole interactions. It is clear that, when the protonation is on the reducing end of
the sugar (H1rA0), a narrower distribution of ϕ and ψ values are obtained with only two clusters adopted,
which are close to the A and B conformations (Figure 4). This conformational behavior is in accord with
the work of Mazeau et al., who found that the molecular flexibility of CS is more affected when the
substitution at C2 is on the non-reducing end, whereas a less-pronounced effect is achieved when the
substituent is located on the reducing end [38].
Dihedral angle results were further confirmed by measuring the root mean square fluctuation
(RMSF) of CS dimers (Figure 5a). The high average fluctuation of heavy atoms of H1nA0, which is
accompanied by a high standard error value, verifies the high conformational flexibility of this dimer.
Moreover, a high fluctuation in the distance between nitrogen atoms (N-N distance), starting from a
distance as low as 4 Å and reaching double the distance in parts of the 100 ns simulation, can be
observed (Figure 5c).
Increasing the number of protonated amines (H2A0) resulted in a decrease in conformational
flexibility and a slight variation in both ϕ and ψ values. This was further confirmed by the low average
fluctuation of H2A0 atoms, which displayed movements one third of the movement of mono-
protonated H1nA0 dimers (Figure 5a). Repulsion forces between the two charged amine groups might
be the reason for the reduction in both the freedom of movement and the number of possible
conformations adopted by H2A0. The long distance between charged N atoms, as well as the narrow
fluctuation, confirms the foregoing suggestion (Figure 5b).
On the other hand, it seems that increasing the DA to 50% or 100% does not alter the
conformational distribution of the CS dimer, where two main clusters can still be detected, although
a reduction in average fluctuation can be detected. The reduction is, again, more pronounced when
the acetamide group is at the non-reducing end. The bulkiness of the acetamide group, together with
the absence of ion–dipole interactions between protonated and deprotonated amine groups, resulted
in the observed increase in rigidity compared to neutral CS (H0A0) [30,38]. However, no meaningful
difference in movement restriction was detected between the half-protonated, half-acetylated, and
the fully acetylated dimers, except for the H1nA0 dimer.
To further elucidate the behavior of CS in aqueous solution, and considering the major role it
plays in the stabilization of the twofold helix rigid structure of chitin and β-(1-4) polysaccharides in
general, intra-molecular hydrogen bonds (HB) between the O5 from one glucosamine residue with
the HO3 found in the adjacent residue were studied [39]. It is thought that acetyl groups present in
the structure of CS are the main contributors to the formation and stabilization of the OH3-O5
hydrogen bond [40]. In order to test this suggestion, the average distance between atoms O5 (n + 1)
and H3 (n) together with the average angle formed between O3 (n)-H3 (n)-O5 (n + 1) have been
calculated (Table 1).
It was found that the neutral CS dimer (H0A0) forms the weakest intramolecular hydrogen bonds
with an average distance greater than 3.2 Å, an angle for O3 (n)-H3 (n)-O5 (n + 1) lower than 120°,
and an occurrence, from the trajectory time, of 46%. This is in agreement with the work of Franca et
al., who reported a 48% occurrence of the HO3 (n)-O5 (n + 1) HB in neutral CS [30]. It is clear that the
two atoms (O3 and O5) get closer for a longer period of time when the protonation of CS is increased,
forming the strongest intramolecular HB interaction with H2A0 (89%). This explains the low molecular
flexibility and low RMSF values displayed by the fully protonated CS. The results obtained are in
good agreement with those of Skovstrup et al., who studied the conformational flexibility of CS using
MDs [29]. They found that an increasing protonation of CS resulted in a higher formation of
intramolecular HBs, reaching 99% in fully protonated CS.
Page 6
Mar. Drugs 2017, 15, x 7 of 18
Figure 3. Distribution plot (x, y) for the dihedral angles (ϕ, ψ) of CS before and after complexation with XG.
Page 7
Mar. Drugs 2017, 15, x 7 of 18
Figure 4. Representative snapshots from each population of H1nA0. Dihedral angles (ϕ, ψ) associated
with each conformation are: A (−135°, 80°), B (−70°, 100°), C (−95°, −60°), and D (55°, 110°).
(a)
Figure 5. (a) Calculated average root mean square fluctuation (RMSF) values for the heavy atoms of
each CS dimer. Error bars represent standard errors, (b) distance between nitrogen atoms (N-N
distance) of H2A0, and (c) N-N distance of H1nA0.
Table 1. Average HO3 (n)-O5 (n + 1) distances and O3 (n)-H3 (n)-O5 (n + 1) angles for CS dimers
before and after complexation with XG. a
Free CS CS–XG Complex
Distance (Å) Angle (⁰) %Occupancy Distance (Å) Angle (⁰) %Occupancy
H0A0 3.25 (1.19) 94.601 (54.9) 46.72 3.10 (1.17) 99.703 (54.6) 53.37
H1nA0 3.05 (1.30) 127.16 (51.6) 60.58 1.90 (0.32) 152.26 (19.9) 98.67
H1rA0 2.47 (0.90) 132.74 (35.2) 72.87 1.85 (0.19) 157.57 (11.8) 99.86
H2A0 2.62 (0.56) 134.09 (26.8) 89.21 1.95 (0.28) 151.32 (18.1) 99.32
H0A1n 2.38 (0.93) 129.65 (45.9) 80.84 2.17 (0.73) 139.34 (40.3) 88.76
H0A1r 2.33 (0.88) 137.83 (38.3) 80.94 2.52 (1.02) 131.80 (42.6) 78.33
H1A1n 2.13 (0.52) 145.88 (24.2) 84.76 1.88 (0.28) 152.56 (16.9) 99.63
H1A1r 2.29 (0.93) 131.09 (43.0) 82.40 1.93 (0.29) 150.74 (19.6) 98.66
H0A2 2.12 (0.76) 144.68 (33.9) 89.61 2.20 (0.79) 140.78 (36.5) 85.39
a Numbers in parentheses represent standard deviations of the results.
Increasing the degree of N-acetylation of CS resulted in a decrease in the distance, reaching
almost 2 Å in the fully N-acetylated dimer (H0A2). Meanwhile, the angle for O5-H3-O3 increased,
0 0.4 0.8 1.2 1.6
H0A0
H1nA0
H1rA0
H2A0
H0A1n
H0A1r
H1A1n
H1A1r
H0A2
Average RMSF (Å)
4
6
8
40 60 80 100N
-N d
ista
nce
(Å
)
Time (ns)
(b)
4
6
8
40 60 80 100
N-N
dis
tan
ce (
Å)
Time (ns)
(c)
Page 8
Mar. Drugs 2017, 15, x 8 of 18
which reflects the occurrence of a more stable HB which lasts >80% of the whole trajectory time;
therefore, a more rigid structure is formed. These outcomes correlate well with the RMSF results, and
confirm the suggestion of a direct proportional relationship between the DA and rigidity of CS chains
[40].
2.2. CS–XG Complexes
The initial geometries of the 1:1 CS–XG complexes were obtained using AutoDock Vina tools
[41]. The top-scored structure for each complex was considered for the subsequent MDs. Initial
structures derived from docking showed that the CS is located parallel to glucose residues 3 and 4 in
the backbone of XG between side-chain 1 and chain 2. The initial structure of H1nA0 is shown in
(Figure 6a) as a representative dimer. It was noticed that this binding site scored top for all of the CS
dimers modelled, regardless of their DA or state of protonation. In order to justify the chosen initial
structures, another possibility for the H1nA0 dimer was considered in which CS is located between
chains 3 and 4 of XG (Figure 6b). The results of MDs using the latter structure showed that CS moves
from its initial position, reaching a position more or less close to the top-scored structure (a) after
about 40 ns. Therefore, in the present study, 100 ns MDs were carried out and only the last 60 ns of
each trajectory was analyzed, allowing adequate time for the CS and XG molecules to sample
different geometries until reaching equilibrium.
(a)
(b)
Figure 6. Molecular representation of the initial structure of a representative CS dimer (H1nA0) at: (a)
the top-scored geometry produced from docking studies; and (b) the other possible initial structure.
The computed average structures of each CS–XG 1:1 complex derived from the last 60 ns of the
corresponding trajectories are shown in Figure 7.
It can be noticed from the snapshots of the uncharged CS dimer (H0A0) that it possesses a low
degree of contact with XG, while more exposure to the surrounding water occurs with time. An
examination of H0A0 snapshots (Figure 8) showed that CS kept moving along the XG chains during
the simulation time to find the most favorable site of interaction, ending by being surrounded by
more water molecules than the XG molecule. This behavior is predictable, since the amine groups
present in the structure of CS are uncharged, minimizing their electrostatic interaction with the
negatively charged carboxylic groups of XG.
Root mean square fluctuation (RMSF) of the heavy atoms in CS have been computed and are
presented in Figure 9. The data clearly shows that the free mobility of the H0A0 dimer in the presence
of XG reaches an RMSF value of about 14 Å. The average ensemble structures of the complexes of the
mono-protonated dimers (H1nA0 and H1rA0) show the formation of more favorable complexes
compared to H0A0 with an increase in the surface area of CS being exposed to XG (Figure 7). When
the free amine group at the non-reducing end is protonated (H1nA0), CS shows a better contact with
XG compared to when the reducing end is protonated (H1rA0). The structure at the end of the MD
simulation time shows a noteworthy deviation of XG side-chains from their initial orientation in the
H1nA0 complex, while the deviation is minor in the H1rA0 complex. An examination of the
corresponding average structure of the fully protonated form (H2A0) reveals that CS favors
interaction with XG. Also, it is interesting to note that H2A0 moves from its initial position after 40 ns
Page 9
Mar. Drugs 2017, 15, x 9 of 18
to reach almost the middle of the XG, probably in order to interact with the anionic pyruvate groups
in chains 2 and 3 in XG. The N-deacetylated mono- and di-protonated CS dimers show much lower
RMSF values compared to the uncharged N-deacetylated CS (Figure 9), indicating more stable
complexes.
N-acetylation appears to increase the mobility of uncharged CS molecules, especially in the fully
N-acetylated dimer. This raises questions regarding the role of acetyl groups in the formation and
stabilization of CS complexes. Fully N-acetylated CS shows a fluctuation from the initial structures
in the range of 5–6 Å, which might suggest the capability of fully acetylated CS in forming stable
complexes with XG more than neutral CS moieties. The behavior of complexes when XG is
protonated was also considered. It is noteworthy that the interaction between CS and protonated XG
is much less favored compared to the interaction with anionic XG (Figure 10).
Conformational changes of CS upon complexation with XG were evaluated and are presented
in Figure 3. Interestingly, all protonated CS dimers in CS–XG complexes (whether acetylated or not)
tend to be less flexible, compared to CS alone, with one population being mainly visited (the one close
to A in Figure 4). The effect is much less pronounced for uncharged acetylated or deacetylated dimers
of CS. It appears that the presence of a strong interaction of the protonated amine with anionic XG
restricts rotation around the glycosidic linkage in the protonated dimers. Similar observations were
noticed for the effect of complexation on the strength of intramolecular hydrogen bonding HO3 (n)-
O5 (n + 1). Here, also, only protonated guest (CS) molecules, regardless of acetylation, show an
increase in the strength of intramolecular HBs. A dramatic increase in the percentage occupancy of
the intramolecular HBs was observed, reaching values >98%, while deprotonated and acetylated
dimers showed a variation in HB occupancy of no more than 10%. The effect of protonation on the
strength of HO3 (n)-O5 (n + 1) correlates well with the dihedral angles results (Table 1).
Since the driving force of interaction between XG and CS is thought to be electrostatic, the
distances between amine groups in CS and the carboxyl groups in the adjacent side-chains of XG
were calculated. Data obtained (Table 2) clearly show that the carboxylate groups on chain 2 of XG
are generally closer to the protonated amine groups than to the free amine, with a lower standard
deviation. Free amine groups in the uncharged dimer H0A0 are located a far distance from both
carboxylic groups, with high fluctuation and standard deviation, reaching up to 9 Å. However,
introducing acetamide groups considerably lowers the standard deviation values. N-acetylated CS
dimers showed distance values in between protonated and deprotonated dimers, with a maximum
deviation of 5 Å, which may indicate the occurrence of van der Waals interactions between acetamide
groups and carboxylate groups.
The data for the intermolecular hydrogen bonds (HBs), which exist between each CS dimer, are
presented in Table 3. Likewise, guest-host (CS–XG) intermolecular hydrogen bonds were monitored.
Free guest dimer molecules form several HBs with the surrounding water molecules. A strong
reduction was observed in the number of water-guest HBs for chitosan upon complexation, resulting
in a less flexible and more packed conformation (Figure 3). The reduction was more evident in
protonated CS molecules. This indicates that protonated CS dimers, regardless of their DA, are less
exposed to the surrounding water. It seems that CS molecules are forming HBs with XG. Hence, they
are more buried in the XG bulk structure. N-deacetylated, uncharged CS dimers form the minimum
number of intermolecular HBs with XG (Table 3).
Page 10
Mar. Drugs 2017, 15, x FOR PEER REVIEW 10 of 18
H0A0 H1nA0 H1rA0
H2A0 H0A2 H0A1n
H0A1r H1A1n H1A1r
Figure 7. Average structure of each CS–XG complex during molecular dynamic simulations (MDs). Hydrogen atoms are excluded for clarity.
Page 11
Mar. Drugs 2017, 15, x 11 of 18
Initial 40 ns 50 ns
60 ns 70 ns 80 ns
90 ns 100 ns
Figure 8. Snapshots of H0A0/XG complexes extracted from a 100 ns MD simulation.
Page 12
Mar. Drugs 2017, 15, x FOR PEER REVIEW 12 of 18
Figure 9. RMSF values for the heavy atoms of CS dimers obtained from the last 60 ns of the MDs of
their complexes with XG.
40 ns 60 ns 70ns
80 ns 90 ns 100ns
Figure 10. Snapshots of H2A0 complexed with neutral XG extracted from a 100 ns MD simulation.
Table 2. Average distances (Å) between carboxylic groups in chain 2 of XG, and nitrogen atoms in CS
for each complex.
Pyruvate COO− Glucoronate COO− N1 N2 N1 N2
H0A0 22.40 ± 9.09 21.26 ± 8.74 18.17 ± 9.25 17.63 ± 8.62
H1nA0 13.29 ± 0.96 18.99 ± 1.96 7.151 ± 0.74 13.88 ± 0.99
H1rA0 12.91 ± 0.93 19.64 ± 1.48 6.550 ± 1.23 13.73 ± 1.27
H2A0 11.50 ± 2.57 9.350 ± 3.45 6.942 ± 1.89 10.66 ± 2.31
H0A1n 27.21 ± 3.49 22.87 ± 2.75 19.67 ± 4.01 16.65 ± 2.91
H0A1r 17.95 ± 4.21 16.02 ± 4.12 16.88 ± 5.29 14.06 ± 3.81
H1A1n 15.87 ± 2.99 13.86 ± 1.18 12.90 ± 1.98 7.002 ± 1.12
H1A1r 15.37 ± 0.67 9.710 ± 1.01 7.998 ± 1.16 4.021 ± 0.75
H0A2 12.57 ± 5.14 14.80 ± 3.41 11.33 ± 3.48 9.052 ± 3.92
0
2
4
6
8
10
12
14
16
1 3 5 7 9 11 13 15 17 19 21 23 25 27 29
RM
SF
(Å
)
Atom Index
H0A0
H1nA0
H1rA0
H2A0
H0A1n
H0A1r
H1A1n
H1A1r
H0A2
Page 13
Mar. Drugs 2017, 15, x 13 of 18
Table 3. Water-guest (CS) and host (XG)-guest (CS) intermolecular hydrogen bond analysis a for free
CS and CS–XG complexes.
Free CS Complex
CS-H2O CS-H2O CS–XG b
H0A0 16.9 8.4 2.4
H1nA0 16.3 4.7 4.9
H1rA0 15.0 5.0 4.3
H2A0 15.8 2.0 4.5
H0A1n 16.9 9.5 3.7
H0A1r 16.9 8.5 2.4
H1A1n 16.5 5.4 4.3
H1A1r 16.3 5.4 4.4
H0A2 16.9 8.8 3.8
* The numbers in the Table represent the average number of hydrogen bonds formed during the
specified MMS time. b Number of hydrogen bonds between CS and XG in water.
2.3. MM-PBSA
The data in Table 4 lists the binding free energy (∆G) values together with other energy terms
that contribute to the free energy of the studied complexes computed using MM-PBSA. It is noticeable
that electrostatic interactions are vital contributors to the stability of CS–XG complexes. This becomes
more recognizable when raising the number of protonated amines in CS, being most favorable in the
fully protonated complex (H2A0/XG, ∆Eele = −419 kcal/mol). This is a reasonable assertion, since
introducing ammonium groups will increase the positive charge of CS. Accordingly, electrostatic
interactions between CS and XG will increase owing to the negatively charged carboxyl groups
present in XG. The data in Table 4 demonstrate that van der Waals forces contribute to the stability
of the CS–XG complex; van der Waals forces are least favorable under neutral conditions (H0A0),
attaining a value of ∆EvdW = −14.03 kcal/mol.
Non-polar forces, ΔGNP, are also favorable in all CS–XG complexes, showing values around −3
kcal/mol, indicating a positive contribution for the non-polar surface-accessible area on the stability of
the complexes formed, though to a much lower extent compared to the electrostatic and van der Waals
interactions. MM-PBSA calculations also indicate a reduction in electrostatic interactions between both
CS and XG with water molecules as a result of complexation, leading to a large, unfavorable electrostatic
solvation energy (ΔGPB is positive). This is more pronounced in the case of protonated dimers, reaching
a maximum of 416 kcal/mol in H2A0, due to the fact that the desolvation of the charged species requires
more energy than the neutral one. Similarly, it is noticeable that when amine groups are uncharged,
ΔGPB becomes less positive. Overall, the total solvation free energy (∆Gsolv) for both polar and non-polar
areas is positive for all complexes demonstrating the formation of insoluble polyelectrolyte complexes
between CS and XG; the insolubility of the resulting complexes increased with protonation. Data
acquired from the MD simulations show that the protonated amine at the reduced position still partially
interacted with the surrounding water molecules.
Normal mode analysis shows negative values of the configuration entropy (∆Sconf) for all
complexes examined, thus indicating a reduction in the conformational flexibility of both the guest
and host and freedom upon complexation. The trend for ∆Sconf values are in accord with the binding
free energy values (enthalpy-entropy compensation).
N-acetylated, non-protonated dimers form more stable complexes with XG than H0A0 by
approximately 4 kcal/mol. It is possible that the acetamide group is then able to penetrate between
the XG chains, leading to further interactions between CS and XG. The role of the acetamide group is
verified by the increase in contribution from van der Waals forces with an increasing number of acetyl
groups. Fully N-acetylated CS dimers formed the most favorable van der Waals interaction with XG,
∆EvdW = −25 kcal/mol. The total number of solute–substrate interactions (ΔE) is higher when the acetyl
group is introduced in the non-reduced position (H0A1n) compared to the reduced position (H0A1r).
Again, the effect of placing the acetamide or amine groups in the reduced or non-reduced position
affects the strength of intermolecular interactions as well as the geometries of the CS–XG complex.
Page 14
Mar. Drugs 2017, 15, x 14 of 18
The foregoing observation will be the subject of a future study, but modelled using longer CS chains
with more diverse possibilities in relation to the distribution of N-acetyl groups.
The results clearly show, as expected, that the value of ΔG becomes more negative as the number
of protonated groups increases (H0A0, H1A0, and H2A0 complexes), due to the interaction of the
protonated amine with the anionic chains of XG. However, the difference in ΔG value between H2A0
and H1A0 complexes is less than 2 kcal/mol, despite the increase in the value of ΔEele when moving
from the mono- to the di-protonated species. This increase in ΔEele is offset by the extent of the
unfavorable desolvation for the H2A0 complex compared to the H1A0 complex. The position of the
ammonium group has an impact on the strength of the electrostatic interactions (H1nA0 and H1rA0).
This is illustrated by the fact that the ΔEele value in half-protonated CS is more favorable when
protonation is at the non-reduced end of the glucosamine unit of CS, because the electrostatic force
is the most dominant force in this interaction. Again, the desolvation process counterbalances this
effect, and the difference in ∆G between H1nA0 and H1rA0 is ~1 kcal/mol.
The influence of the molecular weight of XG on the extent of the CS–XG interactions has been
addressed. MDs of H1nA0 with XG composed of two monomers (H1nA0/2XG) were performed. A
remarkable reduction in the binding free energy, ΔG, of around 7 kcal/mol compared to the four-
monomer XG complex with H1nA0 was observed. This finding may suggest a positive contribution of
other XG chains (chains 3 and 4) on complex stability.
Table 4. MM-PBSA results for the nine CS dimer complexes with the four-monomer XG molecule
examined (the values presented are in kcal/mol).
∆Eele ∆EvdW ∆GNP ∆GPB ∆Gsol ∆E T∆Sconf ∆G
H0A0 −21.29 −14.03 −2.59 24.47 21.89 −13.43 −12.52 −0.91
H1nA0 −227.53 −24.47 −3.71 226.49 222.77 −29.22 −18.36 −10.86
H1rA0 −208.76 −21.61 −3.45 205.63 202.18 −28.19 −17.45 −10.74
H2A0 −419.95 −23.27 −3.89 416.46 412.57 −30.65 −18.25 −12.4
H0A1n −41.82 −17.36 −3.07 41.09 38.02 −21.16 −15.93 −5.23
H0A1r −25.08 −21.12 −3.19 31.65 28.46 −17.74 −13.24 −4.50
H1rA1n −192.15 −23.13 −3.53 195.25 191.72 −23.56 −15.58 −7.98
H1nA1r −232.68 −23.96 −3.53 230.89 227.36 −29.28 −18.03 −11.25
H0A2 −25.07 −25.79 −3.63 33.78 30.15 −20.71 −16.00 −4.71
H1nA0-XG2 * −164.11 −11.16 −2.76 159.25 156.49 −18.78 −14.83 −3.95
* This complex represents the interaction between H1nA0 dimer and a two-monomer XG molecule.
3. Computational Methods
The initial structure of XG was obtained from PolySac3DB, a database of three-dimensional (3D)
polysaccharides structures, which was deduced from X-ray diffraction results and computer-aided
model building [42,43], whereas the CS structure was generated using HyperChem™ Professional
7.51 [44]. A total of nine CS dimers were built to cover a wide range of N-acetylation and protonation
states (Figure 2). Free amine groups present in the CS backbone were substituted by acetamide
groups (C2H5NO) in order to increase the degree of N-acetylation, whereas hydrogen atoms were
added to the existing free amine groups (−NH3+) to form protonated CS molecules [45]. A ligand
flexible docking study was performed to find the possible binding sites and binding affinities of CS
using AutoDock Vina [41], where XG was assigned as the host molecule and CS as the guest. The
simulation box used was sufficiently large to include both CS and XG.
MDs were performed using AMBER 11 software [46] employing the Parm99 force field, which
includes a developed parameter set for polysaccharides [47,48]. The atomic charges for the host and
guest molecules were obtained using AM1-BCC charge sets [49]. Each system, for both the free CS
species and their corresponding CS–XG complexes, was solvated in a periodic box of a TIP3P water
model [50]. Chloride and sodium ions were added, when needed, in order to maintain the neutrality
of the systems [51]. Periodic boundary conditions were adopted, and the Particle Mesh Ewald (PME)
method was used for the treatment of long-range electrostatic interactions [52]. The non-bonded
cutoff was set to 10.0 Å. Before starting the MDs simulations, each system was subjected to energy
minimization, then heated up to 298 K for 60 ps. A total of 100 ns MD simulation runs were carried
Page 15
Mar. Drugs 2017, 15, x 15 of 18
out. The system was coupled in the NPT ensemble to a Berendsen thermostat at 298 K and a barostat
at 1 atm. A 2-fs time step was used with structures being saved every 2 ps.
MDs analyses were performed using the PTRAJ module of the AMBER 11 tools [46].
Visualization of the outputs and MD calculations were undertaken using VMD 1.8.6 software [53]. In
order to obtain physically meaning average structures, the kclust tool was used from the MMTSB
package [54]. A large cut-off was set to include all snapshots extracted from the corresponding
trajectories in one cluster, and the structure that was nearest to the cluster center was considered the
average structure.
Conformational changes within the structure of CS before and after complexation were studied
by determining the torsional (dihedral) angles around the glycosidic bond. Phi (ϕ) and psi (ψ)
dihedral angles were defined by the planes formed via atoms O5-C1-O1-C4 and C1-O1-C4-C3,
respectively, as illustrated in Figure 11 [31].
Figure 11. Molecular representation of a CS dimer, 50% acetylated, with ϕ and ψ dihedral angles
defined by atoms O5-C1-O1-C4 and C1-O1-C4-C3, respectively. The dashed line represents the
intramolecular hydrogen bond OH3-O5.
For hydrogen bond evaluation, a hydrogen bond was defined as a donor–acceptor interaction
where the distance between the acceptor atom and the donor hydrogen atom is below 3 Å. The angle
between donor and acceptor was set to be greater than 120° [55].
The molecular mechanics/Poisson–Boltzmann surface area (MM-PBSA) was utilized to calculate
the binding free energy (∆G) for each complex as implemented in AMBER 11 tools [46]. Analytical
methods and equations utilized have been described in detail elsewhere [56,57]. A short description
of the equations is given here. The free energy of binding (∆G) was estimated according to the
following expression:
∆G = ∆Egas + ∆Gsolv (1)
where ∆Egas is the gas phase interaction energy between the guest and host, and is approximated by
the sum of the following energy changes upon complexation: the internal energy (∆EINT), the van der
Waals interaction energy (∆EvdW), and the electrostatic interaction energy (∆Eelec), as follows:
∆Egas = ∆Eelec + ∆EvdW + ∆EINT. (2))
The solvation free energy, ∆Gsolv, can be subdivided into electrostatic or polar (∆GPB) and non-
polar (∆GNP) components, as follows:
∆Gsolv = ∆GPB + ∆GNP. (3))
The free energy, ∆GPB, was computed in a continuum solvent using the MM-PBSA program in
AMBER 11, whereas ∆GNP was calculated from the solvent-accessible surface area (SASA) using the
following terms:
∆GNP = γ SASA + b (1)
where γ = 0.00542 kcal/(mol Å2), and b = 0.92 kcal/ mol.
Page 16
Mar. Drugs 2017, 15, x 16 of 18
4. Conclusions
The behavior of solvated CS together with its complexation with XG was addressed by means
of MDs and MM-PBSA studies. Three levels of acetylation and protonation states were chosen (0,
50%, and 100%) for CS. Complexes of CS–XG indicate the preference of CS to interact and penetrate
in between the chains of XG when protonation is increased. The average structures of CS–XG
complexes show close contact and more favorable interaction between the two polymers when CS is
50–100% protonated, whilst deprotonated CS interacts preferentially with bulk water molecules more
than XG.
MM-PBSA calculations revealed that electrostatic forces (polar interactions) were of major
importance for the stability of the formed CS–XG complexes, and that the strength of this interaction
is related to the protonation state of CS. The results also showed that not only does the protonation
state affect the binding free energy of complexes, but the position of the ammonium groups plays an
important role in the interaction between CS and XG as well. In addition to protonation, acetamide
groups in the structure of CS play a role in the formation and stabilization of its corresponding
complexes with XG.
It can be concluded that the pH of the aqueous solution (protonation state of CS) is the
predominant factor in determining the extent of interaction between XG and CS, and that the position
of ammonium and acetyl groups plays a major role in the stabilization of the complexes formed.
Acknowledgments: The authors would like to thank Khaleel Assaf for his help in running the molecular
dynamics simulation trajectories of free chitosan dimers.
Author Contributions: Suha M. Dadou and Musa I. El-Barghouthi designed the study, prepared the trajectories,
interpreted the data, and drafted the manuscript. Samer K. Alabdallah participated in trajectories running and
data acquisition. Adnan A. Badwan contributed to the conception and design of the study and approved the
final draft. Milan D. Antonijevic and Babur Z. Chowdhry participated in advising how the study should be
conducted, critically revised the manuscript, and approved the final draft.
Conflicts of Interest: The authors declare no conflicts of interest.
Abbreviations:
CS, chitosan; XG, xanthan gum; MDs, molecular dynamics simulations; DA, degree of N-
acetylation; MM-PBSA, molecular mechanics Poisson–Boltzmann surface area; HB(s), hydrogen
bond(s); (H0A0) neutral CS 0% DA; (H1nA0) CS 0% DA, 50% protonated at the non-reducing end;
(H1rA0) CS 0% DA, 50% protonated at the reducing end; (H2A0) CS 0% DA, 100% protonated; (H0A1n)
CS 50% DA at the non-reducing end, 0% protonated; (H1A1n) CS 50% DA at the non-reducing end,
50% protonated; (H0A1r) CS 50% DA, at the reducing end, 0% protonated; (H1A1r) CS 50% DA at the
reducing end, 50% protonated and (H0A2) CS 100% DA (chitin).
References
1. Alvarez-Lorenzo, C.; Blanco-Fernandez, B.; Puga, A.M.; Concheiro, A. Crosslinked ionic polysaccharides
for stimuli-sensitive drug delivery. Adv. Drug Deliv. Rev. 2013, 65, 1148–1171.
2. Tian, Y.; Shi, C.; Sun, Y.; Zhu, C.; Sun, C.C.; Mao, S. Designing micellar nanocarriers with improved drug
loading and stability based on solubility parameter. Mol. Pharm. 2015, 12, 816–825.
3. Racoviţă, S.; Vasiliu, S.; Popa, M.; Luca, C. Polysaccharides based on micro-and nanoparticles obtained by
ionic gelation and their applications as drug delivery systems. Rev. Roum. Chim. 2009, 54, 709–718.
4. Lu, B.; Wang, C.F.; Wu, D.Q.; Li, C.; Zhang, X.Z.; Zhuo, R.X. Chitosan based oligoamine polymers:
Synthesis, characterization, and gene delivery. J. Control. Release 2009, 137, 54–62.
5. Buschmann, M.D.; Merzouki, A.; Lavertu, M.; Thibault, M.; Jean, M.; Darras, V. Chitosans for delivery of
nucleic acids. Adv. Drug Deliv. Rev. 2013, 65, 1234–1270.
6. Chang, K.L.; Tsai, G.; Lee, J.; Fu, W.R. Heterogeneous N-deacetylation of chitin in alkaline solution.
Carbohydr. Res. 1997, 303, 327–332.
7. Younes, I.; Sellimi, S.; Rinaudo, M.; Jellouli, K.; Nasri, M. Influence of acetylation degree and molecular
weight of homogeneous chitosans on antibacterial and antifungal activities. Int. J. Food Microbiol. 2014, 185,
57–63.
Page 17
Mar. Drugs 2017, 15, x 17 of 18
8. Cho, Y.W.; Jang, J.; Park, C.R.; Ko, S.W. Preparation and solubility in acid and water of partially
deacetylated chitins. Biomacromolecules 2000, 1, 609–614.
9. Brugnerotto, J.; Desbrieres, J.; Heux, L.; Mazeau, K.; Rinaudo, M. Overview on structural characterization
of chitosan molecules in relation with their behaviour in solution. Macromol. Symp. 2001, 168, 1–20.
10. Amidi, M.; Mastrobattista, E.; Jiskoot, W.; Hennink, W.E. Chitosan-based delivery systems for protein
therapeutics and antigens. Adv. Drug Deliv. Rev. 2010, 62, 59–82.
11. Makhlof, A.; Tozuka, Y.; Takeuchi, H. Design and evaluation of novel pH-sensitive chitosan nanoparticles
for oral insulin delivery. Eur. J. Pharm. Sci. 2011, 42, 445–451.
12. Amoozgar, Z.; Park, J.; Lin, Q.; Yeo, Y. Low molecular-weight chitosan as a pH-sensitive stealth coating for
tumour-specific drug delivery. Mol. Pharm. 2012, 9, 1262–1270.
13. Moreno, P.M.; Santos, J.C.; Gomes, C.P.; Varela-Moreira, A.; Costa, A.; Leiro, V.; Peego, A.P. Delivery of
splice switching oligonucleotides by amphiphilic chitosan-based nanoparticles. Mol. Pharm. 2016, 13, 344–
356.
14. Kassai, M.R. Determination of the degree of N-acetylation for chitin and chitosan by various NMR
spectroscopy techniques: A review. Carbohydr. Polym. 2010, 79, 801–810.
15. Christensen, B.E.; Smidsrød, O. Hydrolysis of xanthan in dilute acid: Effects on chemical composition,
conformation, and intrinsic viscosity. Carbohydr. Res. 1991, 214, 55–69.
16. Arendt, O.; Kulicke, W. Determination of the viscoelastic properties of a homologous series of the
fermentation polymer xanthan gum. Angew. Makromol. Chem. 1998, 259, 61–67.
17. Garcia-Ochoa, F.; Santos, V.; Casas, J.; Gomez, E. Xanthan gum: Production, recovery, and properties.
Biotechnol. Adv. 2000, 18, 549–579.
18. Mikac, U.; Sepe, A.; Baumgartner, S.; Kristl, J. The influence of high drug loading in xanthan tablets and
media with different physiological pH and ionic strength on swelling and release. Mol. Pharm. 2016, 13,
1147–1157.
19. Bueno, B.V.; Petri, D. Xanthan hydrogel films, molecular conformation, charge density and protein carriers.
Carbohydr. Polym. 2014, 101, 897–904.
20. Phaechamud, T.; Ritthidej, G.C. Formulation variables influencing drug release from layered matrix system
comprising chitosan and xanthan gum. AAPS PharmSciTech 2008, 9, 870–877.
21. Chu, C.H.; Kumagai, H.; Nakamura, K. Application of polyelectrolyte complex gel composed of xanthan
and chitosan to the immobilization of corynebacterium glutamicum. J. Appl. Polym. Sci. 1996, 60, 1041–1047.
22. Martínez-Ruvalcaba, A.; Chornet, E.; Rodrigue, D. Viscoelastic properties of dispersed chitosan/xanthan
hydrogels. Carbohydr. Polym. 2007, 67, 586–595.
23. Luo, Y.; Wang, Q. Recent development of chitosan-based polyelectrolyte complexes with natural
polysaccharides for drug delivery. Int. J. Biol. Macromol. 2014, 64, 353–367.
24. Chu, C.H.; Sakiyama, T.; Yano, T. pH-sensitive swelling of a polyelectrolyte complex gel prepared from
xanthan and chitosan. Biosci. Biotechnol. Biochem. 1995, 59, 717–719.
25. Magnin, D.; Dumitriu, S.; Chornet, E. Immobilization of enzymes into a polyionic hydrogel: Chitoxan. J.
Bioact. Compat. Polym. 2003, 18, 355–373.
26. Argin-Soysal, S.; Kofinas, P.; Lo, Y.M. Effect of complexation conditions on xanthan–chitosan
polyelectrolyte complex gels. Food Hydrocoll. 2009, 23, 202–209.
27. Chellat, F.; Tabrizian, M.; Dumitriu, S.; Chornet, S.; Rivard, C.H.; Yahia, L. Study of biodegradation
behavior of chitosan–xanthan microspheres in simulated physiological media. J. Biomed. Mater. Res. 2000,
53, 592–599.
28. Prathab, B.; Tejraj, A.M. Molecular modelling study on surface, thermal, mechanical and gas diffusion
properties of chitosan. J. Polym. Sci. Part B Polym. Phys. 2006, 45, 1260–1270.
29. Skovstrup, S.; Hansen, S.G.; Skrydstrup, T.; Schiøtt, B. Conformational flexibility of chitosan: A molecular
modelling study. Biomacromolecules 2010, 11, 3196–3207.
30. Franca, E.F.; Lins, R.D.; Freitas, L.C.; Straatsma, T.P. Characterization of chitin and chitosan molecular
structure in aqueous solution. J. Chem. Theory Comput. 2008, 4, 2141–2149.
31. Franca, E.F.; Freitas, L.C.; Lins, R.D. Chitosan molecular structure as a function of N-acetylation. Biopolymers
2011, 95, 448–460.
32. Fariba, R.; Sepideh, A.-I.; Hamid, M. Molecular dynamics simulation study of chitosan and gemcitabine as
a drug delivery system. J. Mol. Model. 2015, 21, 165.
33. Koukaras, E.N.; Papadimitriou, S.A.; Bikiaris, D.N.; Froudakis, G.E. Insight on the formation of chitosan
nanoparticles through ionotropic gelation with tripolyphosphate. Mol. Pharm. 2012, 9, 2856–2862.
34. Pérez, S.; Vergelati, C. Molecular modelling of the xanthan chain conformations. Int. J. Biol. Macromol. 1987,
9, 211–218.
Page 18
Mar. Drugs 2017, 15, x 18 of 18
35. Levy, S.; Schuyler, S.C.; Maglothin, R.K.; Staehelin, L.A. Dynamic simulations of the molecular
conformations of wild type and mutant xanthan polymers suggest that conformational differences may
contribute to observed differences in viscosity. Biopolymers 1996, 38, 251–272.
36. Faria, R.R.; Guerra, R.F.; Netoa, L.R.; Motta, L.F.; Franca, E.D. Computational study of polymorphic
structures of α- and β- chitin and chitosan in aqueous solution. J. Mol. Graph. Model. 2016, 63, 78–84.
37. Ogawa, K.; Yui, T.; Okuyama, K. Three D structures of chitosan. Int. J. Biol. Macromol. 2004, 34, 1–8.
38. Mazeau, K.; Pérez, S.; Rinaudo, M. Predicted influence of N-acetyl group content on the conformational
extension of chitin and chitosan chains. J. Carbohydr. Chem. 2000, 19, 1269–1284.
39. Kawahara, M.; Yui, T.; Oka, K.; Zugenmaier, P.; Suzuki, S.; Kitamura, S.; Ogawa, K. Fourth 3d structure of
the chitosan molecule: conformation of chitosan in its salts with medical organic acids having a phenyl
group. Biosci. Biotechnol. Biochem. 2003, 67, 1545–1550.
40. Okuyama, K.; Noguchi, K.; Miyazawa, T.; Yui, T.; Ogawa, K. Molecular and crystal structure of hydrated
chitosan. Macromolecules 1997, 30, 5849–5855.
41. Trott, O.; Olson, A. J. AutoDock Vina: Improving the speed and accuracy of docking with a new scoring
function, efficient optimization, and multithreading. J. Comput. Chem. 2010, 31, 455–461.
42. Moorhouse, R.; Walkinshaw, M.D.; Arnott, S. Xanthan Gum—Molecular Conformation and Interactions.
Extracell. Microb. Polysacch. 1977, 45, 90–102.
43. Sarkar, A.; Pérez, S. PolySac3DB: An annotated data base of 3 dimensional structures of polysaccharides.
BMC Bioinform. 2012, 13, 302.
44. HyperChem(TM) Professional 7.51; Hypercube, Inc.: Gainesville, FL, USA, 2002.
45. McDonnell, M.; Greeley, D.; Kit, K.; Keffer, D. Molecular dynamics simulations of hydration effects on
solvation, diffusivity, and permeability in chitosan/chitin films. J. Phys. Chem. B 2016, 120, 8997–9010.
46. Case, D.A.; Darden, T.A.; Cheatham, T.E.; Simmerling, C.L.; Wang, J.; Duke, R.E.; Kollman, P.A. 2010.
AMBER 11, University of California, San Francisco.
47. Homans, S.W. A molecular mechanical force field for the conformational analysis of oligosaccharides:
Comparison of theoretical and crystal structures of Man alpha1–3 Man beta1–4 GlcNAc. Biochemistry 1990,
29, 9110–9118.
48. Wang, J.; Cieplak, P.; Kollman, P. How well does a restrained electrostatic potential (resp) model perform
in calculating conformational energies of organic and biological molecules. J. Comput. Chem. 2000, 21, 1049–
1074.
49. Jorgensen, W.L.; Chandrasekhar, J.; Madura, J.D.; Impey, R.W.; Klein, M.L. Comparison of simple potential
functions for simulating liquid water. J. Chem. Phys. 1983, 79, 926–935.
50. Jakalian, A.; Bush, B.L.; Jack, D.B.; Bayly, C.I. Fast, efficient generation of high quality atomic charges. AM1-
BCC model: I. Method. J. Comput. Chem. 2000, 21, 132–146.
51. El-Barghouthi, M.I.; Assaf, K.I.; Rawashdeh, A.M. Molecular dynamics of methyl viologen-cucurbit[n]uril
complexes in aqueous solution. J. Chem. Theory Comput. 2010, 6, 984–992.
52. Darden, T.; York, D.; Pederson, L. Particle mesh Ewald: An N⋅ log(N) method for Ewald sums in large
systems. J. Chem. Phys. 1993, 98, 10089–10092
53. Humphrey, W.; Dalke, A.; Schulten, K. “VMD - Visual Molecular Dynamics”. J. Mol. Graph. 1996, 14, 33–
38.
54. Feig, M.; Karanicolas, J.; Brooks, C.L. MMTSB tool set: Enhanced sampling and multiscale modelling
methods for applications in structural biology. J. Mol. Graph. Model. 2004, 22, 377–395.
55. Malhis, L.D.; Bodoor, K.; Assaf, K.I.; Al-Sakhen, N.A.; El-Barghouthi, M.I. Molecular dynamics simulation
of a cucurbituril based molecular switch triggered by pH changes. Comp. Theor. Chem. 2015, 1066, 104–112.
56. Honig, B.; Nicholls, A. Classical electrostatics in biology and chemistry. Science 1995, 268, 1144.
57. El-Barghouthi, M.I.; Abdel-Halim, H.M.; Haj-Ibrahim, F.J.; Bodoor, K.; Assaf, K.I. Molecular dynamics of
nor-seco-cucurbit[10]uril complexes. J. Incl. Phenom. Macrocycl. Chem. 2015, 82, 323–333.
© 2017 by the authors. Submitted for possible open access publication under the
terms and conditions of the Creative Commons Attribution (CC BY) license
(http://creativecommons.org/licenses/by/4.0/).