This is a manuscript version of an article published as Donner, Paul (2018). Effect of publication month on citation impact. Journal of Informetrics, 12(1), 330-343. https://doi.org/10.1016/j.joi.2018.01.012 Effect of publication month on citation impact Paul Donner Abstract A standard procedure in citation analysis is that all papers published in one year are assessed at the same later point in time, implicitly treating all publications as if they were published at the exact same date. This leads to systematic bias in favor of early-months publications and against late-months publications. This contribution analyses the size of this distortion on a large body of publications from all disciplines over citation windows of up to 15 years. It is found that early-month publications enjoy a substantial citation advantage, which arises from citations received in the first three years after publication. While the advantage is stronger for author self-citations as opposed to citations from others, it cannot be eliminated by excluding self-citations. The bias decreases only slowly over longer citation windows due to the continuing influence of the earlier years' citations. Because of the substantial extent and long persistence of the distortions, it would be useful to remove or control for this bias in research and evaluation studies which use citation data. It is demonstrated that this can be achieved by using the newly introduced concept of month-based citation windows. Keywords: citation impact; publication date; citation analysis; bias; bibliometric indicators; self- citations; control variable; systematic error; validity 1. Introduction Citation impact normalization is a central concept for the construction of advanced bibliometric indicators which eliminate the effects of different scientific discipline, type of document and date of publication (Waltman, 2016). By delineating sets of publications that are similar to each other in content and formal characteristics and by using these sets to compute reference values and by computing relative impact indicators based on these reference values, the heterogeneity in citation counts due to these factors is removed. The intention is to make possible fair comparisons, to compare like with like (Schubert and Braun, 1986). The basic formal characteristics, as opposed to the content (disciplinary area), that are taken into account are document type (such as research articles, review papers, letters, editorials etc.) and publication date. Further characteristics have also been demonstrated to co-vary with citation counts, for example differences between methodological, theoretical and empirical works (Peritz, 1983), clinical vs. basic research in medicine (van Eck et al., 2013) or clinical study level (e.g. Bandhara et al. 2007). One important component of normalization is controlling for publication date, as, ceteris paribus, the more time has passed since publication the more papers will be published whose authors had the opportunity to read and cite a given publication. The publication year is commonly used to operationalize publication date. This practice is based on the implicit assumption that, for the question of interest of a study, it makes no difference when exactly in a year a paper was published. The fact that, when citations are counted at some later date, documents published in January have
Transcript
This is a manuscript version of an article published as
Donner, Paul (2018). Effect of publication month on citation impact. Journal of Informetrics, 12(1), 330-343. https://doi.org/10.1016/j.joi.2018.01.012
Effect of publication month on citation impact
Paul Donner
AbstractA standard procedure in citation analysis is that all papers published in one year are assessed at the same later point in time, implicitly treating all publications as if they were published at the exact same date. This leads to systematic bias in favor of early-months publications and against late-monthspublications. This contribution analyses the size of this distortion on a large body of publications fromall disciplines over citation windows of up to 15 years. It is found that early-month publications enjoy a substantial citation advantage, which arises from citations received in the first three years after publication. While the advantage is stronger for author self-citations as opposed to citations from others, it cannot be eliminated by excluding self-citations. The bias decreases only slowly over longer citation windows due to the continuing influence of the earlier years' citations. Because of the substantial extent and long persistence of the distortions, it would be useful to remove or control for this bias in research and evaluation studies which use citation data. It is demonstrated that this can be achieved by using the newly introduced concept of month-based citation windows.
1. IntroductionCitation impact normalization is a central concept for the construction of advanced bibliometric indicators which eliminate the effects of different scientific discipline, type of document and date of publication (Waltman, 2016). By delineating sets of publications that are similar to each other in content and formal characteristics and by using these sets to compute reference values and by computing relative impact indicators based on these reference values, the heterogeneity in citation counts due to these factors is removed. The intention is to make possible fair comparisons, to compare like with like (Schubert and Braun, 1986). The basic formal characteristics, as opposed to thecontent (disciplinary area), that are taken into account are document type (such as research articles, review papers, letters, editorials etc.) and publication date. Further characteristics have also been demonstrated to co-vary with citation counts, for example differences between methodological, theoretical and empirical works (Peritz, 1983), clinical vs. basic research in medicine (van Eck et al., 2013) or clinical study level (e.g. Bandhara et al. 2007).
One important component of normalization is controlling for publication date, as, ceteris paribus, the more time has passed since publication the more papers will be published whose authors had the opportunity to read and cite a given publication. The publication year is commonly used to operationalize publication date. This practice is based on the implicit assumption that, for the question of interest of a study, it makes no difference when exactly in a year a paper was published. The fact that, when citations are counted at some later date, documents published in January have
eleven months more to be read and cited than works published in December of the same years raisesthe question if the above assumption is justified, and, if it is not, under which conditions and how a more precise publication date ought to be used in citation analysis.
The question of the influence of a more exact publication date is related to the problem of choosing adequate citation windows, the period in which citations to papers in a set of publications are counted. A citation window that is very short, say two years, would more obviously lead to bias against papers published towards the end of the investigation period compared to those published towards the beginning. Consider the following simple illustration. Citations are counted at the end of the year after publication (2-year citation window). Then papers from January had 24 months to be read and cited, assuming the case they were published on the first day of the month and citations counted after the last day of the citation window, while December papers had 11 months less, just 13months, which is 54 % of the time period of the January papers. This relative disadvantage becomes smaller as the citation window length is increased. In a five year citation window, for example, the December papers had 82 % of the citation duration of the January papers. Citations do not accumulate uniformly over time and one is not only concerned with January and December papers, so this reckoning does not say much about the actual size of the distortion. But it might serve as a first order approximation model. Just how big this ‘head-start’ effect is in reality and at what point in time it vanishes is the topic investigated in this paper.
The article is organized as follows. In the next section, previous work on the topic is briefly reviewed and some knowledge gaps are pointed out which this study addresses. Next, the data on which the study is based are presented. The major part of this contribution is comprised of the analysis of the results regarding the month effect from several points of view, including its size as reflected in basic citation scores and in regression analysis, also taking into consideration the online publication date, the change of the effect size over longer citation windows and its presence and patterns across disciplines. Furthermore, we introduce a method to eliminate the month bias and use the resulting corrected citation counts to demonstrate the bias on a simulated academic impact assessment of institutions under realistic conditions similar to currently employed research evaluation procedures. We finish with a discussion of the results and their implications for the field.
2. Related workThere have been a number of prior studies that have noted and investigated the month effect. They will be briefly reviewed in the following and their results used as a point of departure for this study.
Haslam et al. (2008) used publication month as a control variable throughout their regression analyses of influence factors of citation impact in a psychology sub-discipline. Their criterion was the natural logarithm of articles’ citations counted after ten years. In their results, the standardized regression coefficients for month are small, not statistically significant and of the expected negative direction in 3 out of 4 domain regressions and also negative in the final overall regression equation. The small number of publications studied (308) and long citation window might account for the inconclusive findings with regard to publication month influence.
Levitt and Thelwall (2011) proposed a new impact indicator based on a paper’s early citation count and the impact factor of its journal and investigated the compound indicator’s predictive validity. Oneof their research questions relates to the correlation between the proposed indicator and publication month and the correlation between raw citation counts and publication month. Their sample is comprised of UK articles in the Social Sciences Citation Index category ‘Economics’, published between 2001 and 2004 and they counted citations up to 2008. As an aside, the authors note that
“the notional publication date of an article does not necessarily reflect the true publication date; frequently a journal issue appears many months before or after its notional publication date” (ibid., p. 303). This applies to the present study as well and should be kept in mind as one of its limitations. The authors confirm the existence of the month bias of citation counts for their sample, finding advantages for early-month publications for up to 3 years after publication. The authors conclude that “it seems important to take into account month of publication when analyzing short citation windows” (ibid., p. 307).
In a study of citation window lengths, Wang (2013) considered publication month as one of several factors possibly influencing citation ageing. Due to the design of the study, papers uncited after 31 years are excluded from the analysis. Wang also introduces a method for the estimation of publication month when this data is missing. The present study adopts this method, as will be detailed further below. The Wang (2013) study finds no discernible difference in citation ageing across months based on the first and last year after publication in which half or more of the publications are cited. While there is no month difference in ageing according to this measure, there are differences between research fields, document types and papers of different final citation count tiers. Another measure, ‘Citation Speed’, is also applied, which is based on the cumulative citation counts throughout the observation years. ANOVA analysis of this measure’s results does indicate significant differences in citation aging by publication month, though the effect appears to be small.
Gai et al. (2015) study the month citation bias as such in one field, one specialty and one journal, respectively, for citation windows from 1 to 9 years. They exclude a few very highly cited papers. Theygroup publication months into six two-month periods. For papers in physical geography they find significant group differences for citation counts for up to five years after publication. The results are similar for papers on the topic of diabetes. For the Journal of Biological Chemistry, group differences are significant up to the seventh year after publication.
The present study is intended to improve upon the outlined results in a number of ways. As previous studies have been limited to specific disciplines we investigate if the effect is general to all disciplines (as far as covered in Web of Science). Neither uncited nor very highly cited publications are excluded from analysis. A range of disciplines with very different citation dynamics are investigated to provide insight into field differences. Field differences in publication month effect on citation counts can be hypothesized to mirror fields’ size in terms of number of papers, their citation density (average references per paper) and publication and citation speed. Details on the rate of decrease of the month effect in relation to the length of citation windows have not been studied yet, so this issue willbe given consideration. The present study takes into account citation windows of up to 15 years. The method for estimating missing month data proposed in Wang (2013) is validated. Month effects are measured for the two citation impact indicators average citations per paper and share of highly cited papers of single-months groups. The role of author self-citations as a specific factor of early-month citation bias is considered because self-citations generally occur earlier after publication than citations by others. The online publication date is tested for influence on citations in addition to that of the issue publication date. Finally, it is demonstrated how to eliminate publication month bias by constructing citation windows of equal length for month cohorts of papers.
3. Data and methods
3.1. Data setsData set A consists of all journal publications of document type ‘Article’ from the year 2000, obtained from Clarivate Analytics’ Web of Science1 (n = 767,959), for which publication month data was either available in the source data or could be estimated, as will be reported below. This year was chosen in order to be able to follow the development of the month bias over long citation windows. 6539 articles from 2000 had to be excluded from analysis because they had neither a publication date value nor enough contextual data to obtain estimates of publication month. The number of citations to the articles in each year were computed from citation link data constructed using the ’iFQ’ procedure, as described in Olensky, Schmidt & van Eck (2016), using references data from all journal publications of the period from the year 2000 to 2014. After a preliminary investigation of the possible effect of author self-citations it was decided not to remove them, as their influence on the sought after effect is very minor. This analysis can be found in the appendix. Disambiguated affiliationdata are used for all publications with authors working in Germany for data set A (Winterhager et al., 2014; Rimmert et al., 2017).
Data set B is comprised of articles contained in PubMed, based on 2016 base files. Publications of theprint publication year 2009 which had a DOI and online publication date available were selected and matched to WoS records based on the DOI. The records were restricted to the WoS document types ‘Article’ and ‘Review’. This results in 253,292 publications. Citation counts were computed by CWTS by their method which was also described in Olensky, Schmidt & van Eck (2016). Note that the two different reference matching procedures which were applied in the two data sets, give nearly the same results, while both improve upon the citation matching links supplied by the vendor (Olensky, Schmidt & van Eck, 2016). Self-citations are not removed. Data set B will be used to assess the combined influence of online and print publication months, for which more recent data containing both print and online publication dates is required.
3.2. Missing month dataPublication month data is not available for all items in data set A. A publication date containing a specific month was present in 82 % of the records. These were used directly. A publication date span of more than one month or a quarterly designation was present in 7 % of the articles. For the former cases the numerical values were averaged, which is also considered part of the estimation in the following. For a number of journals appearing quarterly the publication date in the source data is oneof spring, summer, fall or winter. By inspecting the order of issue numbers of quarterly journals with such seasonal publication dates it was found that a large percentage of titles does not follow the parallel issue order of 1 to 4 and Spring to Winter. On the basis of this inconsistency it was decided not to apply a simple uniform transformation of the season designation to numerical month values.
Thus for these quarterly journals and the remaining 11 % of the records without publication date information and it was attempted to estimate their month of publication on the level of journal issues.
One way to estimate the publication month is by utilizing the data available on the number and sequence of issues of the journal. The necessary assumptions are that volumes and issues are labeledsequentially in a year and issues are published in regular, equal intervals. These are simplifications as issues may appear simultaneously or in irregular intervals. The publication month estimation used for
1 The data infrastructure of the German Competence Centre for Bibliometrics was used for data set A, cf. http://www.forschungsinfo.de/Bibliometrie/en/index.php?id=home
this study follows closely the method of Wang (2013, p. 854). The integers from 1 to 12 are assigned to the months. Issues with a given publication date spanning more than one month are assigned the average numerical month, rounded to the whole number. For example, an issue with the publication date ‘OCT-DEC 2000’) is assigned the month value 11.
Publication months for issues without any publication date information or seasonal publication dates were estimated as follows. The number of issues of the journal in the year is counted. Issues are ordered by their volume and issue labels sequentially and assigned the resulting rank number. This rank is divided by the number of issues, multiplied by 12, and rounded to the nearest integer.
The accuracy of this estimation method was validated by (1) looking up the publication month(s) of the issue on the official publisher journal homepage. A random sample of issues without publication date information specific to a single month was drawn and the official publication date was looked upand recorded and subsequently compared with the estimated date. This includes quarterly publications, issues designated as spanning multiple months and issues without any publication date value. And moreover (2) by also applying the estimation method to issues for which the publication month was already available in the source data and comparing the source data, presumably correct, with the estimated data.
3.3. Indicators and statistical methodsDifferences in the values of month-cohorts of publications are investigated for two citation impact indicators: average citations per paper (CPP) and share of highly cited papers. In the case of the latter,the share of papers of each publication month among the 10 % most highly cited papers across all months is tested. We assess how the impact values for each month cohort are statistically associated with the order of issue publication months with the Pearson correlation coefficient. In the case of the association of the month variable with individual papers’ citation counts, the correlation is also computed for the log-transformed citation count in order to minimize the effect of the non-normality of the citation distribution. To assess the compound effects of issue and online publication month on individual publication citation counts, we perform linear regression with log-transformed citation counts as the dependent variable (Thelwall, 2016).
4. Results
4.1. Missing month data estimation and validationThe month estimation method outlined above was applied for data set A to all issue records without publication dates specific to a month, that is, those with no data, with a range of months and with a seasonal date (i.e. ‘SPR’, ‘SUM’, ‘FAL’, ‘WIN’). In order to validate the results, 339 issues were looked up on journal websites. For 199 of these issues the publication month(s) could be found. Issues spanning multiple months according to the official dates were transformed as described above. In theresulting data the estimated month correlates with the actual month of publication with a Pearson coefficient of r = 0.908 (CI: [0.88; 0.93]). There is an average difference of −0.44 months between estimated and true publication months, which means that the estimation results in a small underestimation; see Table 1 for the empirical error distribution. No pattern in the true publications months of the issues underestimated by one month could be detected. 94 % of the estimates in the sample had at most one month estimation error. This is accurate enough as a first-order approximation for the purposes of this study but can probably be improved.
Table 1 Error distribution of month estimation
error (actual month − estimated
month) −10 −7 −6 −4 −3 −1 0 1 2 10
frequency 1 2 2 2 1 65 112 11 1 3Note: N=199
Having established the validity of the estimation method with independently collected data we can furthermore use the already available publication date information for validation. To do so, we applied the estimation method to those issue records in data set A for which a specific single month is available in the original source data and calculated the correlation between actual and estimated values. We find for the 44,758 issue records a correlation of r = 0.928 (CI: [0.926; 0.929). An accuracy of ± 1 month was recorded for 83 % of the issues.
As a third method of validation we compare the distributions of publications over months between estimated dates and publication dates given in the original data. In both cases it can be assumed that there will be roughly equal numbers of publications in each month. That means that the theoretically expected distribution is a discrete uniform distribution with the values from 1 to 12 as the 12 events. This distribution would exhibit a mean of 6.5 and standard deviation (SD) of 3.45. The empirical figures for the articles with a single given publication month are: mean=6.55 (SD=3.45) and for those with estimated publication month: mean=6.33 (SD=3.45). Since the distribution of estimated months is in agreement with both the originally available data’s empirical distribution and the theoretically expected distribution, the validity of the estimation method is further supported. It is noted that these figures are computed over all publications, not over the sample of issues as above. We stress again that both the nominal given publication month and the algorithmically estimated one may not be close to actual point in time when the issue could be read in full due to idiosyncratic publishing practices (cf. Garfield, 1978).
With this data at hand, it is possible to use descriptive statistics to show the numbers of papers published each month and analyze the shares of citations and ratios of citations per paper from singleyears or ranges of years for each publication month.
In data set A, the average number of papers per month is approximately 65,000 (SD=4600), with a minimum of around 56,000 in July, and a maximum of around 72,000 in February. The minimum figure is about 78 % of the maximum. The number of publications per month is uncorrelated with month: r=0.02, (CI:[−0.56; 0.59]).
4.2 Effect of publication month on citations at the level of month-cohort groups of papersTo examine the effect of the publication date on citations to papers published within one year, publications published in each month are considered as groups. The average numbers of citations perpaper of all month groups are calculated in order to characterize the groups’ citation impact. For purposes of exposition we examine first the average CPP per month based on citations from single years for the first four years before moving on to citation windows of multiple years. The results of monthly CPP for single years are shown in Table 2 and Figure 1. For the first three years (2000, 2001, 2002) the earlier months’ publications receive on average more citations. For example, in the second year alone (the year following the publication year), January papers receive 2.08 citations while December papers receive 0.98 on average, or about half as much. In the publication year and the second year the relationship between publication month and CPP is strongly linear negative (both r <
−0.9). The association weakens in year three to r=−0.69 and for citations made in year 4 the effect is no longer present.
Table 2. Average CPP by month for individual years
Figure 1: Average CPP per month for the citations of the first three years
The strong negative correlations between publication month and average citations show that early-month publications enjoy a citation advantage for three years. Having established the effect for singlecitation years, we now move on to citation windows of multiple years. According to the above results,citation windows of two and three years after publication will necessarily exhibit the correlation. However, how long does it take for the effect of those early years to decrease so much to become negligible? In order to answer this question in the next step of analysis citations are counted cumulatively for subsequent years, which conforms to the most common practice in bibliometrics at present.
We consider selected citation windows of up to 15 years. The results presented in Table 3 indicate that the effect decreases rather slowly. For the five-year citation window, January papers outperform December papers by some 35 % in terms of average CPP. The correlation is as high as −0.75 after nineyears, −0.68 after eleven years and at the end of the observation period, after 15 years, it is down to −0.57.
It could be possible that the indicator CPP is affected more by publication month than other impact indicators because citation count distributions are very skewed and the mean of this distribution (CPP) is less robust than indicators based on other characteristics of the distribution. The averages of the citation counts of the month cohorts might be distorted in this way. To rule out such an effect, thepublication month bias is also assessed with another frequently used impact indicator, the share of
highly cited publications. We consider the share of each month’s publications among the approximately 10 % most highly cited publications. In a publication set not influenced by publication month bias in citations counts, approximately equal shares of highly cited publications are expected to be present in each month group. The issue of ties, publications having a citation count equal to thethreshold value, the 0.9-quantile in this case, is disregarded here, as it of no consequence with respect to the central issue of this analysis, the association of publication month and indicator values.The computed values for selected citation windows are presented in Table 4. In that table, the row labeled “actual share of publications >= threshold” shows the exact percentage of articles that have as much or more citations than the threshold value, which is given one row above it. In the absence of bias, each month’s percentage should be very close to that overall percentage, which is the expected value, and no pattern in the values should be discernible. For this indicator as well, the month bias can be seen very clearly. For example, in the column for year 1 to 8 (9-year citation window) in which the expected value is 10.31 %, 12.03 % of January papers reach or exceed the threshold citation count while only 9.46 % of December papers do so. For the 11-year citation window the correlation between publication month and the share of highly cited papers comes to −0.67. Evidently, citation impact as operationalized by this indicator is also affected by publication month bias, even up to very long citation windows, as is also indicated by the correlations.
Table 3. Average CPP by month for selected cumulative citation windows
citation window(years)
1 to 4 1 to 5 1 to 6 1 to 8 1 to 10 1 to 12 1 to 14
4.3. The size of the publication month effect in different disciplines and its relation to citation dynamics indicatorsThe analysis up to this point was concerned with all of articles from the year 2000 as a whole. However, scientific disciplines differ widely in their publication and citation patterns, of which the temporal dynamics patterns are most relevant to this study. Because of these particularities it cannot be readily assumed that the month effect found for the general case is necessarily present or of substantial size in all scientific disciplines. Hence we now proceed to study the possible field differences of the month effect. As it was shown that the month effect originates in the citations of the first three years, including the publication year, the analysis will be restricted to this three-year citation window, to maximize the bias relative to the total citations. For establishing the incidence of the effect, the correlation coefficient will be used as before and to quantify its relative magnitude the value of the December papers' CPP will be given as a percentage of the January papers' CPP. As for the relationships between the temporal citation dynamics of the disciplines and the month bias, the analysis will take into account the age of the references (cited half-life, i.e. fractional median of the age of the cited literature in years) and the immediacy index as an indicator of the quantity of citations in a short period after publication (average CPP in the publication year) and the ratio of the first year CPP to three-year CPP, here called relative immediacy, as an indicator of the relative concentration of citations in first year, or the skewness towards the beginning of the citation period. The latter indicator was considered because the immediacy index was almost perfectly correlated with 3-year citations. For a disciplinary classification, the OECD Fields of Science classification was used, for which Clarivate Analytics maintains a mapping to its WoS subject categories.
Of the 39 disciplines, the correlations between months and 3-year CPP are significant for all but five disciplines, all of which are social sciences or humanities disciplines with very low citation levels as reflected in 1-year and 5-year average CPP, see Table A2 in the appendix. The bias is largest in Law, Veterinary science, and Psychology. It is relatively small in Educational sciences, Mechanical engineering, and Industrial Biotechnology. For the calculation of the following correlations of the biassize with the other indicators, the values for those five fields where no bias could be detected were discarded.
Table 5: Correlations between month bias size and citation indicators across disciplines (n=34)
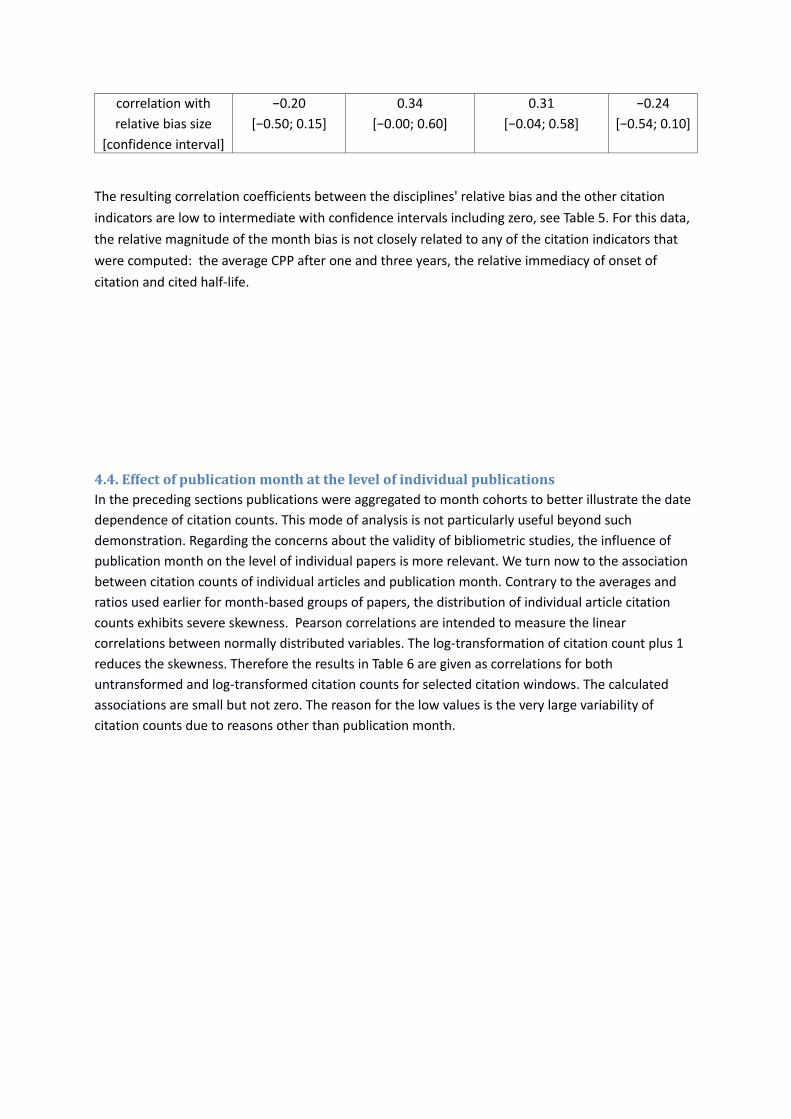
The resulting correlation coefficients between the disciplines' relative bias and the other citation indicators are low to intermediate with confidence intervals including zero, see Table 5. For this data, the relative magnitude of the month bias is not closely related to any of the citation indicators that were computed: the average CPP after one and three years, the relative immediacy of onset of citation and cited half-life.
4.4. Effect of publication month at the level of individual publicationsIn the preceding sections publications were aggregated to month cohorts to better illustrate the date dependence of citation counts. This mode of analysis is not particularly useful beyond such demonstration. Regarding the concerns about the validity of bibliometric studies, the influence of publication month on the level of individual papers is more relevant. We turn now to the association between citation counts of individual articles and publication month. Contrary to the averages and ratios used earlier for month-based groups of papers, the distribution of individual article citation counts exhibits severe skewness. Pearson correlations are intended to measure the linear correlations between normally distributed variables. The log-transformation of citation count plus 1 reduces the skewness. Therefore the results in Table 6 are given as correlations for both untransformed and log-transformed citation counts for selected citation windows. The calculated associations are small but not zero. The reason for the low values is the very large variability of citation counts due to reasons other than publication month.
Table 6. Correlation of publication month and individual article citations for selected citation windows
citation window and transformation
3y cits log(1+(3y cits)) 5y cits log(1+(5y cits)) 10y cits log(1+(10y cits))
Pearson r, entire data set[confidence interval]
−0.068[−0.070; −0.066]
−0.097[−0.099; −0.095]
−0.036[−0.038; −0.034]
−0.048[−0.051; −0.046]
−0.015[−0.017; −0.012]
−0.019[−0.021; −0.016]
“3/5/10y cits” is short for 3/5/10 year cumulative citation counts
4.5. Effect of online publication monthUp to this point, the publication month of the print issue has been studied. It was also mentioned that issues may be available a considerable length of time before or after the indicated month. Furthermore, individual articles might be published online, usually in advance, at a date quite different from the publication date of the issue. This raises the question if it might not be better to use the online publication date instead of the issue date to eliminate publication date bias. We now turn to data set B to study this issue.
We use linear regression to assess the unique and combined relationship of print and online publication months on papers’ three-year cumulative citation counts. The dependent variable is the natural logarithm of citations after three years plus one, in order to account for the heavy skewness of the citation distribution (variable cits3y), following the recommendation in Thelwall (2016). The transformation results in a variable with mean=1.79, SD=0.95 and skewness=0.13.
Print publication month and online publication month are counted as months since January of year 1 CE, so that for example January 2009 has the value 24109. The correlation between the two variables is 0.771 (CI: [0.770; 0.773]). This clearly shows that for papers published in the same month according to the print issue there is considerable variation in the online publication month. Knowing one of the dates only gives a rough indication of the value of the other. For example, for the print issue month publications of January 2009 (N=22582), only 4.6 % appeared online in the same month and a further 0.7 % appeared later. Most papers appeared online in the 5 months immediately beforeJanuary 2009 (79.5 %)
The Pearson correlation of print publication month and citation count on the article level for a three-year citation window for this data set is −0.081 (CI: [ −0.084; −0.077]) and the correlation of month and log(1+3y cits) it is −0.144 (CI: [−0.148; −0.140]), which confirms that the basic month effect is present in this data set as well. The correlation of online publication month and three-year citations is−0.007 (CI: [ −0.011; −0.003]) and that of online publication month and log-transformed citation count is −0.040 (CI: [ −0.043; −0.036]).
Four regression models for different specifications of the independent variables are used to investigate the individual and combined influence of publication month in print and online of papers from the same year on citation counts. The three independent variables are pub.month (print issue publication month), epub.month (online publication month) and abs.d (absolute value of the difference between pub.month and epub.month). The absolute value was taken to linearize the variable for the difference of publication dates as inspection of the scatterplot of the difference of pub.month and epub.month and the conditional average of cits3y showed that the average citation count is highest for papers with no online-to-print delay and that there are decreasing values for papers published both earlier and later online than in print, see Figure 2.
The results of specifications (1) and (2) in Table 7 confirm that both print issue month and online publication month are individually significant predictors of citations count, being responsible for a 4 %reduction and a 1 % reduction in 3-year citation count on the original scale per increase in one month. The overall predictive power of either variable is low, that of online publication month by itself is negligible.
In model (3) both month variables are entered, which increases their coefficients in absolute terms but changes the sign of epub.month. The total explained variation is also greater than the sum of those of models (1) and (2). The positive sign on epub.month shows that when print issue month is held constant, those papers with higher online publication month (being published online closer to being published in print) have higher citations on average.This is likely related to the low online-to-print delay in high-impact journals noted above and displayed in Figure 2.
Specification (4) includes the variable abs.d in addition to pub.month. This leads to an improvement in total predictive power over specification (1) comparable to (3). While their correlation is high, the two publication date variables are complementary to some degree Online publication month by itself only accounted for very little citation count variation compared to issue month, however this might be different in more recent data. It should be noted that because journal impact covaries with print-to-online publication lag specifications (3) and (4) may also capture citation count differences related to journal impact.
Table 7. Regression of 3-year citations on print and online publication months
dependent variable: log(1 + cits3y)
(1) (2) (3) (4)
pub.month(SE)
−0.040*(0.001)
−0.078*(0.001)
−0.039*(0.001)
epub.month(SE)
−0.009*(0.0004)
0.039*(0.001)
abs.d(SE)
−0.043*(0.001)
R² 0.021 0.002 0.034 0.036Note: 253,292 observations. Constants not shown. *: p < 0.01
Figure 2. Scatterplot of difference in print publication month to online publication month and conditional average of 3-year citations
4.6. Month level precision citation windowsIt has been shown that different month cohorts of publications in the same year have systematically different citation distributions. It was also found that the effect can be detected on the level of individual publications. The consequences for research using regression methods are as simple as including the publication month as a control variable. This approach is not possible in research using other methods and in bibliometrics-informed research assessment. However, instead of correcting or controlling for publication month bias after the data have been collected, it is possible to collect data in way so that the bias is not introduced in the first place.
One way to prevent introducing the distortion is to use month-based citation windows. This approachrequires publication month data for both the cited and the citing documents. With the term month-based citation windows we refer to the counting of the number of citations to papers within a specificnumber of months after publication; the length of this period being equal for all publications, as opposed to the conventional year-based citation windows, thus avoiding the month bias. For this, one does not need to alter the period of investigation; one can look at the same papers of, say, one specific year, as when using the conventional citation windows method. In other words, for the calculation of relative citation indicators using reference sets one is not limited to only publications ofthe same publication month, which would be another possible method of removing the month bias. While all month-based citation windows have the same duration, they do not cover the same period of the calendar, i.e. the citation window of the later publications months in a year encompasses later citation months as that of the earlier months of the same year.
To verify this proposal, the publication month data was constructed for all documents citing the articles in data set A. We used the method described above to estimate missing values of citing papers’ publication months. New citation counts based on month-based citation windows were calculated for 12, 36, 60 and 180 months. The citation windows for each month cohort are in this case of the same length, not of lengths differing up to 11 months. The month-based citation windowsare also longer then the corresponding year-based windows. Take for example the 3-year citation window and the 36-month citation window. The three year window ranges from 36 months (from January, year 1, to December, year 3) to 25 months (from December, year 1, to December, year 3). Of course all month-based citation windows are 36 months long. Table 8 shows the average citation counts for some selected citation windows which may be contrasted with the simple year-based method results which can be calculated from the figures in Tables 2 and 3. In the former case, there isno correlation between publication month and mean CPP. Figure 3 shows the differences in average citation counts of each month’s publications for the two citation window methods in the 3-year case. The proposed method fully corrects the bias implicitly contained in conventional citation windows.
Table 8: average CPP, month-based citation windows
citation window(months)
12 36 60 180
month 1 0.87 5.27 9.75 27.69
2 0.76 4.59 8.55 24.92
3 0.87 5.09 9.42 26.89
4 0.84 4.92 9.12 26.04
5 0.83 4.78 8.83 25.24
6 0.82 4.66 8.63 24.85
7 0.98 5.37 9.79 27.08
8 0.84 4.73 8.70 24.77
9 0.94 5.10 9.36 26.18
10 0.89 4.86 9.01 25.39
11 0.88 4.74 8.71 24.28
12 0.90 4.92 9.10 25.35
Pearson r[confidence interval]
0.50[−0.11; 0.83]
−0.14[−0.66; 0.47]
−0.21[−0.70; 0.42]
−0.51[−0.84; 0.09]
Figure 3: Comparison of average citation count of month cohorts using 3-year and 36-month citation windows
4.7. Publication month bias in citations in practice – the influence on institution impact scoresWe now turn to an assessment of the practical relevance of the publication month bias. For the purpose of illustration we look at the level of institutions, which are commonly the unit of analysis in bibliometrically informed research evaluation.
We can expect citation based scores to be affected from bias due to the month effect if and in so far as the distribution of publication months of some units deviates substantially from the expectation. As pointed out earlier, under the assumption of random publication months for a set of papers, the expected average month is 6.5. The first point of interest is then to assess if deviations in the average publication month of the publications of specific institutions can be observed. To get an overview, we calculate the average and the standard deviation of the publication month of all publications of each German institution, published in 2000 (data set A). Institutions with 20 or fewer publications are excluded, which leaves 279 institutions. There are 21 institutions in this data set that deviate by one month or more from the expected value in their average publication month. They are listed in Table 9. From those figures, institutions exhibiting a publication output with such a degree of early or late average publication month appear to be only those with a modest amount of output.
Table 9. German institutions with relatively low and high average publication months
10 5.44 3.29 32 company11 5.48 3.42 23 Fraunhofer institute
270 7.50 3.23 22 Leibniz institute271 7.50 3.37 30 hospital272 7.52 3.27 141 Max Planck institute273 7.52 3.70 23 university274 7.68 2.88 22 academy of sciences275 7.72 3.60 50 company (hospitals)276 8.08 3.34 56 company277 8.15 4.04 26 hospital278 8.70 3.84 57 Fraunhofer institute279 9.94 2.83 31 European research consortium
However, even if a unit's publications are distributed uniformly over the months of a year it does not necessarily mean that its citation scores will not be affected by month bias. This can occur if a unit's high-impact publications in a year are concentrated towards the beginning or towards the end of the year. Compared to other units its scores will appear higher or lower than an unbiased assessment would reveal. Consequently, only considering the average publication months is not enough to rule out distortions due to publication months. Nonetheless, all other things being equal, units exhibiting lower or higher than expected average publication months will have inflated or depressed scores, respectively.
Usually, the research performance of institutions is not assessed across the whole of all science at once but separately by disciplines, in accordance with institutions' disciplinary profile. This reduces the number of publications per institution that are subjected to citation analysis. To give one example, the most recent national scale assessment exercise of public higher education institutions' research in Australia, ERA 2015, used citation analysis in a number of fields (ARC, 2015). In this case, the minimum number of publications per institution and field was set at 50. Under these conditions, viz. assessments of institutions on the discipline level, can differences in the distributions of publication months between institutions cause significant differences in citations scores? A simple mock evaluation of the German institutions was conducted to uncover the potential distortions that are possible in such a scenario. In this exercise, as we are using data set A, only publications from the year 2000 are included. Each publication and its citations are counted fully for each institution namedin the affiliation information. We applied field-normalization at the Disciplines level of OECD Fields of
Science classification, using the concordance table of Web of Science categories provided by ClarivateAnalytics. Two versions of all German papers' mean field-normalize citation rate were calculated, one in the conventional way, using a 5-year citation window and one with observed and expected citations with month-based citation windows of length 60 months. The results are visualized in Figure4. In this figure, the lines connect the two data points corresponding to values of the mean field-normalized citation rate using year-based (Y) and month-based citation windows (M) for an institution in a discipline. A flat line indicates no score change (left side panels) or no rank change (right side panels) whereas sloped lines show such changes.
Figure 4: German research institutions' citation scores and ranks calculated using conventional andmonth-based methods
Notes: Each line connects the positions of the same institution in the year-based and month-based calculations.Crossed lines indicate changed positions. Panels a and b: institutions with more than 50 publications per discipline. Panels c and d: institutions with more than 100 publications per disciplineY: year-based citation window. M: months-based citation window. MFCR: mean field-normalized citation rate
We find that under the condition of a minimum of 50 papers per institution (panels a and b in Fig. 4) many institutions' citation scores are corrected, mostly to a small degree. These relatively small changes, however, lead to considerable changes in their rank order (crossed lines in panel b). Increasing the inclusion threshold to 100 papers and thereby selecting the larger institutions with ostensibly less volatile scores (panels c and d) does in fact somewhat dampen the observable score changes. Here, disciplines with fewer than 30 competing institutions have been discarded. Nevertheless, in all disciplines considered a number of rank changes can be found. Many of them are jumps of two or more ranks.
5. Discussion
5.1. LimitationsThe present study has some limitations. The study considered only the publication years 2000 and 2009. No temporal dynamics in publication month bias were investigated. The variable of interest wasthe point of publication of individual articles within a year which was approximated by using the recorded or estimated month of publication of an issue. The publication month was estimated in a portion of the data but the estimation method was shown to work well. Another limitation is that the official month of publication must not necessarily be close to the time when the article could firstbe read. In fact, individual article dates of online availability would be more accurate but were likely not complete and reliable for the first period studied. For more recent publications the exact date of online publishing would certainly be a better control variable than issue month. Furthermore, the entire subject of publication of works prior to journal publication in different format such as conference proceedings or preprints was beyond the scope of this study.
5.2. Discussion of findingsIt has been demonstrated that publications of early months have a citation advantage compared to publications of later months of the same publication year. This advantage is of considerable magnitude and cannot be eliminated by removing author self-citations (see appendix). The bias is present independent of the particular impact indicator chosen.
Supplementing missing publication month data can be accomplished relatively easily by estimating the publication month from issue sequence information, a method which was shown to have good accuracy. For the studied sample, the effect arises in citations from the first three years after publication but influences metrics using cumulative citation windows for up to 14 or 15 years, for CPPand share of highly-cited papers respectively. Using longer citation windows can reduce but not remove the distortions. These distortions were found for all of science in general and for most disciplines. While the distortions are most readily seen when comparing month cohorts of papers from one year they can also be detected at the level of citation counts of individual papers. In regression analyses which use citation counts as the dependent variable, print or online publication month should routinely be included as control variables, in order to account for otherwise unexplained variation, which will improve the estimation of coefficients of variables of substantive interest. Further results clearly indicate that considerable improvements in the accuracy of advanced citation scores are attainable with a minor change in how citation windows are defined, namely by using the month-based citation windows introduced in this paper instead of conventional year-based citation windows. The practical relevance of the findings was demonstrated using a realistic mock evaluation exercise for real research institutions and their real citation scores. The scores exhibited substantial correction effects when recalculated using month level precision citation windows. Month-based citation windows increase the validity of impact indicators which use citation counts by removing systematic error.
References
ARC (2015). Excellence in Research for Australia (ERA) 2015 Evaluation Handbook. <http://archive.arc.gov.au/archive_files/ERA/2015/Key%20Documents/ERA_2015_Evaluation_Handbook.pdf> last accessed 2017/08/17
Bhandari, M., Busse, J., Devereaux, P. J., Montori, V. M., Swiontowski, M., Tornetta III, P., Einhorn, T. A., Khera, V., & Schemitsch, E. H. (2007). Factors associated with citation rates in the orthopedic literature. Canadian Journal of Surgery, 50(2), 119-123. DOI: 10.1007/s12570-013-0174-6
Donner, P. (2016), Enhanced self-citation detection by fuzzy author name matching and complementary error estimates. Journal of the Association for Information Science and Technology, 67(39), 662–670. DOI: 10.1002/asi.23399
Gai, S. S., Liu, X. L., Zhang, S. L., & Liu, R. Y. (2015). The citation evolution law of papers published in the same year but different month. Learned Publishing, 28(2), 132-139. DOI: 10.1087/20150207
Garfield, E. (1978) False publication dates and other rip-offs. Current Contents, (20), 5-8
Glänzel, W., Thijs, B. (2004), Does co-authorship inflate the share of self-citations? Scientometrics, 61(3), 395–404. DOI: 10.1023/b:scie.0000045117.13348.b1
Haslam, N., Ban, L., Kaufmann, L., Loughnan, S., Peters, K., Whelan, J., & Wilson, S. (2008). What makes an article influential? Predicting impact in social and personality psychology. Scientometrics, 76(1), 169-185. DOI: 10.1007/s11192-007-1892-8
Levitt, J. M., & Thelwall, M. (2011). A combined bibliometric indicator to predict article impact. Information Processing & Management, 47(2), 300-308. DOI: 10.1016/j.ipm.2010.09.005
Olensky, M., Schmidt, M. & van Eck, N. J. (2016), Evaluation of the citation matching algorithms of CWTS and iFQ in comparison to the Web of Science. Journal of the Association for Information Science and Technology, 67(10), 2550-2564. DOI: 10.1002/asi.23590
Peritz, B. (1983). Are methodological papers more cited than theoretical or empirical ones? The case of sociology. Scientometrics, 5(4), 211-218. DOI: 10.1007/bf02019738
Rimmert, C., Schwechheimer, H., Winterhager, M., (2017) Disambiguation of author addresses in bibliometric databases - technical report. Bielefeld: Universität Bielefeld, Institute for InterdisciplinaryStudies of Science (I²SoS) https://pub.uni-bielefeld.de/publication/2914944
Schubert, A., & Braun, T. (1986). Relative indicators and relational charts for comparative assessment of publication output and citation impact. Scientometrics, 9(5-6), 281-291. DOI: 10.1007/BF02017249
Thelwall, M. (2016). The discretised lognormal and hooked power law distributions for complete citation data: Best options for modelling and regression. Journal of Informetrics, 10(2), 336-346. DOI: 10.1016/j.joi.2015.12.007
Van Eck, N. J., Waltman, L., van Raan, A. F., Klautz, R. J., & Peul, W. C. (2013). Citation analysis may severely underestimate the impact of clinical research as compared to basic research. PloS ONE, 8(4), e62395. DOI: 10.1371/journal.pone.0062395
Waltman, L. (2016). A review of the literature on citation impact indicators. Journal of Informetrics, 10(2), 365-391. DOI: 10.1016/j.joi.2016.02.007
Waltman, L., Van Eck, N. J., Van Leeuwen, T. N., Visser, M. S., & Van Raan, A. F. (2011). Towards a new crown indicator: An empirical analysis. Scientometrics, 87(3), 467-481. DOI: 10.1007/s11192-011-0354-5
Wang, J. (2013). Citation time window choice for research impact evaluation. Scientometrics, 94(3): 851–872. DOI: 10.1007/s11192-012-0775-9
Winterhager, M., Schwechheimer, H., & Rimmert, C. (2014). Institutionenkodierung als Grundlage für bibliometrische Indikatoren. Bibliometrie - Praxis und Forschung, 3, 1-22. DOI: 10.5283/bpf.209
Acknowledgements
The author thanks Nees Jan van Eck for providing data set B and for stimulating discussions which greatly improved this study. Part of the analysis was conducted using infrastructure funded through BMBF project 01PQ17001.
Appendix
Author self-citationIt is not immediately clear if author self-citations should be excluded in such an analysis or not. On the one hand, retaining them would lead to some degree of undesirable self-citation contamination in particular in the time immediately following publication because authors have advance knowledge of their own publications that are under review and in press. For the issue studied here, this would indicate that it might be advantageous to exclude self-citations in order to make sure that the association between self-citation and time does not influence the sought after relationship between publication month and citations in general. On the other hand, excluding all self-citations might bias against highly productive or collaborative authors and fields because, if author lists are long, the chances of overlap of author lists of the cited and citing work increase. However, the increase in self-citations is lower than the increase in foreign citations (Glänzel and Thijs, 2004). Using the fuzzy detection method from Donner (2016) all citations were analyzed and classified into first author/first author self-citations, other author self-citations and non-self-citations.
In order to assess the effects of self-citations on the distribution of citations over months we computed the ratio of the average citations per paper (CPP) of December papers to the average CPP of January papers in the year of publication and the next two years and all three years together, in each case using all citations, only self-citations or removing any self-citations. If there was no month bias at all, the ratio would be 1.0. The results are shown in Table A1.
Table A1. Ratio of mean CPP of December papers to mean CPP of January papers
(mean CPP of December papers) / (mean CPP of January papers)
set of citations counted year 1 year 2 year 3 years 1 through 3
all citations 0.078 0.470 0.838 0.568self-citations 0.114 0.704 1.064 0.680excluding all self-citations 0.058 0.398 0.786 0.534
In the “all citations” row it can be seen that the mean CPP for December papers is just 7.8 % of that ofJanuary papers in the first year, rising to 47 % and 83.8 % in the second and third year, respectively. The situation is quite different when considering self-citations only. By the third year, December papers are self-cited just as much as January papers. This confirms that authors, as citers of their ownpapers, are comparatively less responsible for any early month bias. However, as the fourth column shows, in the three-year aggregate, there is not a substantial difference between the ratios when calculating with or without author self-citation. The influence of self-citations is likely minor because they account for a small proportion of all citations. As author self-citations only slightly attenuate early months bias in citation counts, they are not excluded in the main analysis of data set A.
Month bias in different disciplinesTable A2: month bias and citation indicators for disciplines in the Fields of Science classification, data set A
discipline articles correlation of numerical month and month avg. CPP2


![Journal - jac.gov.my · 2018. 10. 22. · JOURNAL OF THE MALAYSIAN JUDICIARY MODE OF CITATION Month [Year] JMJ page ADMINISTRATIVE SERVICE Publication Secretary, Judicial Appointments](https://static.documents.pub/doc/80x56/5ff015b288de634cc92104b1/journal-jacgovmy-2018-10-22-journal-of-the-malaysian-judiciary-mode-of.jpg)


