Effect of Scenario on Perceptual Sensitivity to Errors in Animation Paul S. A. Reitsma * Carol O’Sullivan † Trinity College Dublin Abstract A deeper understanding of what makes animation perceptually plausible would benefit a number of applications, such as approx- imate collision detection and goal-directed animation. In a series of psychophysical experiments, we examine how measurements of perceptual sensitivity in realistic physical simulations compare to similar measurements done in more abstract settings. We find that participant tolerance for certain types of errors is significantly higher in a realistic snooker scenario than in the abstract test set- tings previously used to examine those errors. By contrast, we find there is no difference in tolerance vs. the abstract setting when those errors are displayed in a realistic but more neutral environment. Ad- ditionally, we examine the interaction of auditory and visual cues in determining participant sensitivity to spatiotemporal errors in rigid body collisions. We find that participants are predominantly af- fected by visual cues. Finally, we find that tolerance for spatial gaps during collision events is constant for a wide range of viewing angles if the effect of foreshortening and occlusion caused by the viewing angle is taken into account. CR Categories: I.3.7 [Computer Graphics]: Three-Dimensional Graphics and Realism—; Keywords: psychophysics, animation, perception 1 Introduction There are several reasons why an animation application might de- viate from physically-correct rigid body motion, such as computa- tional savings from approximate collision detection [O’Sullivan and Dingliana 2001] or achieving a particular animation result [Barzel et al. 1996]. Deviating too far from physical correctness, however, can lower the perceived naturalness of the animation [O’Sullivan et al. 2003; Reitsma and Pollard 2003]. Furthermore, it has been suggested that the increased realism of modern rendering tech- niques could additionally constrain the acceptable range of devi- ations, due to the increased sensitivity of users to more detailed displays [Stappers and Waller 1993] and mismatched quality levels between animation and rendering. In is unknown, however, whether people tend to be more or less sensitive to errors in more realistic environments. Can particular aspects of a scenario, such as audio or textures, be manipulated in order to raise or lower user tolerance to errors in the animation? Or, in contrast, do users typically notice errors in animation regardless of the context offered by a scene? * e-mail: [email protected]† e-mail: [email protected](a) (b) Figure 1: (a) Our snooker scenario. (b) The test scenario of O’Sullivan et al. We examine user sensitivity to angular and spatio-temporal errors applied to physically simulated rigid body dynamics in a realistic environment (Figure 1(a)). We compare our results to previous studies of similar errors conducted using abstract stimuli (Figure 1(b)), and examine potential causes for the observed differences. In addition, we examine the relative importance of visual and auditory cues for spatiotemporal errors during rigid body collisions. We find that the choice of scenario used for testing can significantly bias user sensitivity to angular distortions, but that the addition of a high-contrast texture to provide rotational information does not affect user sensitivity to such distortions. Sensitivity to brief delays in the animation at the time of collision appears to be invariant to scenario and to the timing of audio from that collision; indeed, we find no evidence that audio cues affect user sensitivity to any types of errors. Finally, we find that the overhead view used in many ex- periments results in equivalent or more conservative error tolerance thresholds than alternative viewing angles, and user sensitivity ap- pears to change slowly with modest deviations from the overhead angle. 2 Background A number of researchers have suggested techniques for exploit- ing approximate physics in animations, especially approximate collisions. O’Sullivan and Dingliana [2001] examined percep- tual thresholds for approximating collisions to reduce compu- tational complexity, while Barzel et al. [1996], Chenney and Forsyth [2000], Popovi´ c et al. [2000], and Twigg and James [2007] used approximate collisions to achieve plausible goal-directed an- imations. One of our aims is to provide guidance on perceptual sensitivity to various types of errors in order to allow tools such as these to be used more effectively. The interactions of a small number of simple objects have been studied for decades [Michotte 1963; Cohen 1964; Stappers and Waller 1993; Kaiser and Proffitt 1987; O’Sullivan and Dingliana 2001; O’Sullivan et al. 2003]. We draw on the experiments of Kaiser and Proffitt [1987] and O’Sullivan et al. [2003] as the start- ing point for our experiments. Kaiser and Proffitt examined user sensitivity to a variety of errors applied to the collision of two cir- cular bodies in an abstract 2D environment, and included a sim- ple model of friction (constant deceleration) in their experiments. O’Sullivan et al. extended the examination of these errors to an abstract 3D environment, but did not consider friction. We exam-
Transcript
Effect of Scenario on Perceptual Sensitivity to Errors in Animation
Paul S. A. Reitsma∗
Carol O’Sullivan†
Trinity College Dublin
Abstract
A deeper understanding of what makes animation perceptuallyplausible would benefit a number of applications, such as approx-imate collision detection and goal-directed animation. In a seriesof psychophysical experiments, we examine how measurementsof perceptual sensitivity in realistic physical simulations compareto similar measurements done in more abstract settings. We findthat participant tolerance for certain types of errors is significantlyhigher in a realistic snooker scenario than in the abstract test set-tings previously used to examine those errors. By contrast, we findthere is no difference in tolerance vs. the abstract setting when thoseerrors are displayed in a realistic but more neutral environment. Ad-ditionally, we examine the interaction of auditory and visual cues indetermining participant sensitivity to spatiotemporal errors in rigidbody collisions. We find that participants are predominantly af-fected by visual cues. Finally, we find that tolerance for spatialgaps during collision events is constant for a wide range of viewingangles if the effect of foreshortening and occlusion caused by theviewing angle is taken into account.
CR Categories: I.3.7 [Computer Graphics]: Three-DimensionalGraphics and Realism—;
Keywords: psychophysics, animation, perception
1 Introduction
There are several reasons why an animation application might de-viate from physically-correct rigid body motion, such as computa-tional savings from approximate collision detection [O’Sullivan andDingliana 2001] or achieving a particular animation result [Barzelet al. 1996]. Deviating too far from physical correctness, however,can lower the perceived naturalness of the animation [O’Sullivanet al. 2003; Reitsma and Pollard 2003]. Furthermore, it has beensuggested that the increased realism of modern rendering tech-niques could additionally constrain the acceptable range of devi-ations, due to the increased sensitivity of users to more detaileddisplays [Stappers and Waller 1993] and mismatched quality levelsbetween animation and rendering.
In is unknown, however, whether people tend to be more or lesssensitive to errors in more realistic environments. Can particularaspects of a scenario, such as audio or textures, be manipulated inorder to raise or lower user tolerance to errors in the animation? Or,in contrast, do users typically notice errors in animation regardlessof the context offered by a scene?
Figure 1: (a) Our snooker scenario. (b) The test scenario ofO’Sullivan et al.
We examine user sensitivity to angular and spatio-temporal errorsapplied to physically simulated rigid body dynamics in a realisticenvironment (Figure 1(a)). We compare our results to previousstudies of similar errors conducted using abstract stimuli (Figure1(b)), and examine potential causes for the observed differences. Inaddition, we examine the relative importance of visual and auditorycues for spatiotemporal errors during rigid body collisions.
We find that the choice of scenario used for testing can significantlybias user sensitivity to angular distortions, but that the addition ofa high-contrast texture to provide rotational information does notaffect user sensitivity to such distortions. Sensitivity to brief delaysin the animation at the time of collision appears to be invariant toscenario and to the timing of audio from that collision; indeed, wefind no evidence that audio cues affect user sensitivity to any typesof errors. Finally, we find that the overhead view used in many ex-periments results in equivalent or more conservative error tolerancethresholds than alternative viewing angles, and user sensitivity ap-pears to change slowly with modest deviations from the overheadangle.
2 Background
A number of researchers have suggested techniques for exploit-ing approximate physics in animations, especially approximatecollisions. O’Sullivan and Dingliana [2001] examined percep-tual thresholds for approximating collisions to reduce compu-tational complexity, while Barzel et al. [1996], Chenney andForsyth [2000], Popovic et al. [2000], and Twigg and James [2007]used approximate collisions to achieve plausible goal-directed an-imations. One of our aims is to provide guidance on perceptualsensitivity to various types of errors in order to allow tools such asthese to be used more effectively.
The interactions of a small number of simple objects have beenstudied for decades [Michotte 1963; Cohen 1964; Stappers andWaller 1993; Kaiser and Proffitt 1987; O’Sullivan and Dingliana2001; O’Sullivan et al. 2003]. We draw on the experiments ofKaiser and Proffitt [1987] and O’Sullivan et al. [2003] as the start-ing point for our experiments. Kaiser and Proffitt examined usersensitivity to a variety of errors applied to the collision of two cir-cular bodies in an abstract 2D environment, and included a sim-ple model of friction (constant deceleration) in their experiments.O’Sullivan et al. extended the examination of these errors to anabstract 3D environment, but did not consider friction. We exam-
ine sensitivity to these errors in a physical simulator, providing avisually realistic environment with physically-correct dynamics.
Research has demonstrated increased user sensitivity to motion dis-played on richer and more detailed models, including a fountainwith varying numbers of water droplets [Stappers and Waller 1993]and more or less realistic humanoid characters [Hodgins et al.1998]. Similarly, Oesker et al. [2000] reported more detailed andrealistic animation of humanoid football players resulted in moreaccurate user discrimination of relative skill. We examine whetherthere is a similar link between realism or detail and user sensitivityin the case of rigid body animation errors.
Recent multimodal perceptual research shows that visual and au-ditory motion cues can potentially interact. Alais and Burr [2004]report a small increase in sensitivity to bimodal motion (i.e., simul-taneous apparent motion of a sound source and visual stimulus), butno directional effect (i.e., visual and auditory motion in the samedirection is no more detectable than visual and auditory motionin opposite directions). Their results suggest that visual and au-ditory cues may be processed independently and then combined atthe participant’s decision stage. However, auditory and visual cuescan also interfere in some contexts. The Metzger illusion [Met-zger 1934] involves two dots, one moving left to right and the othermoving right to left along the same level. When the two dots meettheir interaction is ambiguous, as they could be perceived as eitherbouncing off or passing through each other; however, an auditorycue played at the moment the balls touch results in a consistent per-ception that the balls are bouncing off of each other[Sekular et al.1997]. McGurk and MacDonald [1976] found that given a video ofa person saying one phoneme which had been dubbed over with adifferent phoneme, participants perceived a third phoneme interme-diate between those presented by the two stimuli. Accordingly, weinvestigate whether a similar multimodal interference occurs in theperception of spatiotemporal errors in animated motion.
3 Experimental Setup
As the testbed for our experiments we use a physically-simulatedsnooker environment (Figure 2(a)). A full physical simulation wasused so as to correctly model factors such as sliding and rollingfriction; additionally, it offers the ability to cleanly and correctlymake changes to any aspect of the inertia tensors of the simulatedballs.
We selected snooker as the subject of the simulation primarily dueto its innate similarity to the abstract environments used in manyprevious experiments. Additionally, however, snooker has the ben-efit of being a familiar and easily-understood scenario, which wesurmised would help strengthen the sense of realism we wished toexamine.
For all experiments, ball placement was handled identically, withmost aspects randomized in order to prevent systematic bias. A tar-get pocket on the table was selected randomly, and the target ballwas placed 65cm from the pocket. Its precise position at that dis-tance was randomly chosen such that its eventual trajectory wouldtake it towards that pocket without being at too shallow an angle(20o) with respect to the sides of the table. Furthermore, the place-ment was determined such that there was a 50% chance each of theball sinking into the pocket or missing by a random angle up to 10o.The cueball was then placed 65cm from the target ball with its an-gle randomly chosen such that it would strike the target ball fromeither left or right (as chosen) at a 20—40o angle, and such thatthe target ball would follow its prescribed trajectory. (No effects oftarget pocket, left/right side of table, or top/bottom of table werefound for our experiments.)
The simulation started with both balls at rest. A short animation ofa cue (or other striking object in the non-snooker scenario) with-drawing and then contacting the cueball was followed by the cue-ball accelerating to a velocity of 1.8m/s, after which all furthermotion was physically simulated. Simulation was terminated 2s af-ter the first collision between the balls, at which point a responsescreen was overlaid.
The stimuli were shown on a 51cm by 32cm display. participantssat approximately 90cm from the screen, so the display occupiedapproximately 32o of their visual field. A regulation snooker table(3.6m plus sides) extended across the width of the screen, meaning1cm of screen distance corresponded to approximately 7.6 cm ofsimulation distance, and 12cm of simulation distance correspondedto approximately 1o of visual field. Each snooker ball had a diam-eter of 1.0 cm on the screen. Participants wore headphones, andwere instructed that in some instances the simulation included au-dio. Participants were instructed to take into account all informationfrom the simulation to determine whether the event was realistic orwhether an error was present. Responses were registered by usingthe left and right index finger triggers of a gamepad to select ”yes”or ”no” when prompted by on-screen cues.
4 Study 1: Effect of Scenario Realism onUser Sensitivity
Our first study examined user sensitivity to post-collision angulardistortions in our snooker simulator (Figure 2(a)). We examinedfour cases:
1. Expansion of target ball post-collision angle, clockwise.
2. Expansion of target ball post-collision angle, counterclock-wise.
3. Expansion of cueball post-collision angle, clockwise.
4. Expansion of cueball post-collision angle, counterclockwise.
Our hypothesis was that the results would not differ from those re-ported by O’Sullivan et al. [2003].
Each of these cases was evaluated using randomly-interleaved as-cending and descending staircases [Cornsweet 1962; Levitt 1971]with eight reversals. Staircase methods are adaptive tests whichrapidly home in on a participant’s perceptual threshold, which canimprove the efficiency of studies. In addition, combining ascend-ing and descending staircases helps to avoid misinterpreting resultsdue to guessing, as near-random responses will tend to result in theascending staircase converging to a substantially lower value thanthe descending staircase, indicating low reliability.
Alterations to the post-collision angle of the cueball and the targetball were presented in separate blocks, for a total of two blocksof four staircases each. A cumulative normal distribution function(ogive) was fitted to the responses of each participant for each ofthe four experimental conditions, allowing the participant’s Point ofSubjective Equality (PSE; the error magnitude at which they wouldbe 50% likely to consider a motion as having an error) and JustNoticeable Difference (JND; the difference between the error mag-nitudes required to elicit 50% and 75% rejection rates) to be com-puted. Added errors were capped at 120o in order to prevent wrap-ping around 360o or settling into local minima, and participantswho persistently responded that motions with maximum error wererealistic were assigned a value of 120o for that error condition.
There were 19 volunteers in this study: 14 male and 5 female staffand students, aged 13 to 46 (mean 27). All participants had normal
(a) (b) (c)
(d) (e) (f)
Figure 2: Test environments used in our experiments. (a) Base snooker scenario. Cueball is white, target ball is black. (b) The non-snookerenvironment used in experiment 2. (c) The neutral environment used in experiment 3. (d) The snooker environment seen from a 60o angle. (e)A closeup of the texture applied to the balls in experiment 2. (f) A closeup of the texture applied to the balls in experiment 3.
Ball Direction Mean PSE Mean JNDTarget Clockwise 46.7o ± 3.4o 16.9o ± 4.0o
Target CCW 46.4o ± 3.8o 17.4o ± 3.8o
Cueball Clockwise 82.8o ± 6.8o 57.7o ± 11.7o
Cueball CCW 88.1o ± 8.2o 58.0o ± 11.2o
Table 1: Results for our first study. Point of subjective equality(PSE) is the magnitude of error where a participant was 50% likelyto notice and remark on it. Just noticeable difference (JND) is theadditional magnitude of error required to change from 50% to 75%rejection threshold. Values are given as mean ± standard error ofthe mean (SEM).
or corrected-to-normal vision, were naive as to the types of errorsbeing examined, and were given the same set of instructions.
4.1 Results
The results of these experiments are shown in Table 1. Through-out, we applied t-tests for between-study comparisons and pairedt-tests for within-study comparisons. As in the simpler and less re-alistic scenario of O’Sullivan et al.[2003], no difference was foundbetween clockwise and counterclockwise expansion; however, par-ticipants were in general more tolerant of errors in our experiment.Our mean point of subjective equality (PSE) for the target ball was46.5o ± 2.5o as compared to 30o found by O’Sullivan et al.; simi-larly, our mean PSE for the cueball was 85.4o ± 5.3o, which againdiffers substantially from O’Sullivan et al.’s mean PSE for the strik-ing ball of 60o.
Insight into this difference can be gleaned from post-study re-sponses and from the pattern of results for which staircase con-vergence was poor. Some participants, typically those who ratedtheir familiarity with snooker as high on the post-study question-naire, reported that some of the collisions they saw were possible,but only with high levels of spin on the cueball; some even reportedthat they had been strongly influenced by their belief that they could
personally have made many of those shots.
Similarly, while most data was well-approximated by an ogive,there were two characteristic types of non-convergence. The firstis when the ascending and descending staircases for a particular er-ror condition converged to different values; the second is when aparticipant consistently answered ”realistic” to motions with max-imum error, and hence did not converge to a fixed value. While 6of 11 participants who reported low experience with snooker hadthe first type of non-convergence on one or both cueball error treat-ments, none of the 8 participants who reported high experience withsnooker converged to two different values in that manner. By con-trast, none of the 11 low-experience participants failed to convergein the second manner, whereas 3 of 8 high-experience participantshad type 2 non-convergence. This distribution is statistically signif-icant (χ2 = 12.0, P = 0.0025), suggesting that the context evokedby a realistic scenario can strongly affect the responses of a partici-pant, and that this effect might explain the lower sensitivity to errorsseen in our experiment as compared to O’Sullivan et al. However,other differences between the scenarios (ball size and velocity, pres-ence of friction, etc.) might also account for the difference.
5 Study 2: Effect of Scenario Context andAudio Cues
The goal of our second study was to explore the potential for a sce-nario to provide context that would bias a participant’s expectationsand hence their tolerance for errors. When examining the effectof scenario and realism, a natural question was what effect the ad-ditional information and verisimilitude provided by realistic audiocues would have. Our hypotheses were:
• Participants would be more tolerant of errors in a realisticsnooker scenario.
• Audio cues would lower participant tolerance of errors in gen-eral, but would raise tolerance if the audio and visual cuesconflicted.
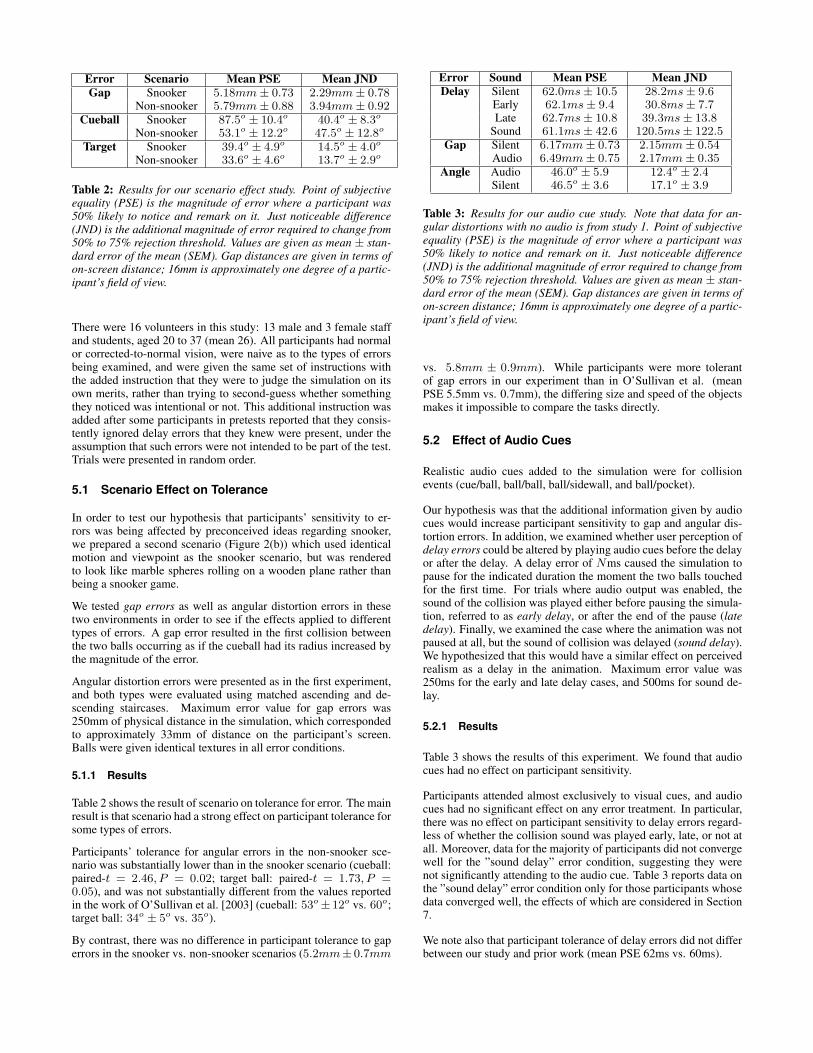
Error Scenario Mean PSE Mean JNDGap Snooker 5.18mm± 0.73 2.29mm± 0.78
Table 2: Results for our scenario effect study. Point of subjectiveequality (PSE) is the magnitude of error where a participant was50% likely to notice and remark on it. Just noticeable difference(JND) is the additional magnitude of error required to change from50% to 75% rejection threshold. Values are given as mean ± stan-dard error of the mean (SEM). Gap distances are given in terms ofon-screen distance; 16mm is approximately one degree of a partic-ipant’s field of view.
There were 16 volunteers in this study: 13 male and 3 female staffand students, aged 20 to 37 (mean 26). All participants had normalor corrected-to-normal vision, were naive as to the types of errorsbeing examined, and were given the same set of instructions withthe added instruction that they were to judge the simulation on itsown merits, rather than trying to second-guess whether somethingthey noticed was intentional or not. This additional instruction wasadded after some participants in pretests reported that they consis-tently ignored delay errors that they knew were present, under theassumption that such errors were not intended to be part of the test.Trials were presented in random order.
5.1 Scenario Effect on Tolerance
In order to test our hypothesis that participants’ sensitivity to er-rors was being affected by preconceived ideas regarding snooker,we prepared a second scenario (Figure 2(b)) which used identicalmotion and viewpoint as the snooker scenario, but was renderedto look like marble spheres rolling on a wooden plane rather thanbeing a snooker game.
We tested gap errors as well as angular distortion errors in thesetwo environments in order to see if the effects applied to differenttypes of errors. A gap error resulted in the first collision betweenthe two balls occurring as if the cueball had its radius increased bythe magnitude of the error.
Angular distortion errors were presented as in the first experiment,and both types were evaluated using matched ascending and de-scending staircases. Maximum error value for gap errors was250mm of physical distance in the simulation, which correspondedto approximately 33mm of distance on the participant’s screen.Balls were given identical textures in all error conditions.
5.1.1 Results
Table 2 shows the result of scenario on tolerance for error. The mainresult is that scenario had a strong effect on participant tolerance forsome types of errors.
Participants’ tolerance for angular errors in the non-snooker sce-nario was substantially lower than in the snooker scenario (cueball:paired-t = 2.46, P = 0.02; target ball: paired-t = 1.73, P =0.05), and was not substantially different from the values reportedin the work of O’Sullivan et al. [2003] (cueball: 53o± 12o vs. 60o;target ball: 34o ± 5o vs. 35o).
By contrast, there was no difference in participant tolerance to gaperrors in the snooker vs. non-snooker scenarios (5.2mm± 0.7mm
Error Sound Mean PSE Mean JNDDelay Silent 62.0ms± 10.5 28.2ms± 9.6
Early 62.1ms± 9.4 30.8ms± 7.7Late 62.7ms± 10.8 39.3ms± 13.8
Table 3: Results for our audio cue study. Note that data for an-gular distortions with no audio is from study 1. Point of subjectiveequality (PSE) is the magnitude of error where a participant was50% likely to notice and remark on it. Just noticeable difference(JND) is the additional magnitude of error required to change from50% to 75% rejection threshold. Values are given as mean ± stan-dard error of the mean (SEM). Gap distances are given in terms ofon-screen distance; 16mm is approximately one degree of a partic-ipant’s field of view.
vs. 5.8mm ± 0.9mm). While participants were more tolerantof gap errors in our experiment than in O’Sullivan et al. (meanPSE 5.5mm vs. 0.7mm), the differing size and speed of the objectsmakes it impossible to compare the tasks directly.
5.2 Effect of Audio Cues
Realistic audio cues added to the simulation were for collisionevents (cue/ball, ball/ball, ball/sidewall, and ball/pocket).
Our hypothesis was that the additional information given by audiocues would increase participant sensitivity to gap and angular dis-tortion errors. In addition, we examined whether user perception ofdelay errors could be altered by playing audio cues before the delayor after the delay. A delay error of Nms caused the simulation topause for the indicated duration the moment the two balls touchedfor the first time. For trials where audio output was enabled, thesound of the collision was played either before pausing the simula-tion, referred to as early delay, or after the end of the pause (latedelay). Finally, we examined the case where the animation was notpaused at all, but the sound of collision was delayed (sound delay).We hypothesized that this would have a similar effect on perceivedrealism as a delay in the animation. Maximum error value was250ms for the early and late delay cases, and 500ms for sound de-lay.
5.2.1 Results
Table 3 shows the results of this experiment. We found that audiocues had no effect on participant sensitivity.
Participants attended almost exclusively to visual cues, and audiocues had no significant effect on any error treatment. In particular,there was no effect on participant sensitivity to delay errors regard-less of whether the collision sound was played early, late, or not atall. Moreover, data for the majority of participants did not convergewell for the ”sound delay” error condition, suggesting they werenot significantly attending to the audio cue. Table 3 reports data onthe ”sound delay” error condition only for those participants whosedata converged well, the effects of which are considered in Section7.
We note also that participant tolerance of delay errors did not differbetween our study and prior work (mean PSE 62ms vs. 60ms).
6 Study 3: Characterizing User Sensitivity
Our goal for the third experiment was to examine the scenario ef-fect in greater detail by using a different study design. In particu-lar, we wanted to examine whether response bias played a role inthe observed differences in participant tolerance for errors betweenscenarios.
Additionally, prior work and pretests of our own had shown thatparticipant tolerance for gap errors increases as viewing angle fromthe vertical increases. For a fixed size of gap, however, the visiblegap, or apparent size of the physical gap, decreases with increasedviewing angle, both due to foreshortening and due to occlusion bythe nearer ball, and it would be useful to know whether this quantityaccurately predicts participant tolerance for gap errors.
Our hypotheses were:
• Participants would have lower sensitivity to errors in thesnooker environment than in a more abstract environment.
• Balls with high-contrast textures would lower participant tol-erance to angular distortions.
• Participant tolerance to gap errors at different viewing anglesis determined by the visible gap at that angle.
There were 15 volunteers in this study: 10 male and 5 female staffand students, aged 19 to 43 (mean 25). All participants had normalor corrected-to-normal vision, were naive as to the types of errorsbeing examined, and were given the same set of instructions as forthe previous experiments, including the instruction to not second-guess which observations were intended to be part of the experi-ment.
6.1 Scenario and Texture
Angular distortions to the target ball were tested in the snooker sce-nario (Figure 2(a)) and in a frictionless neutral scenario (Figure2(c)), with the neutral scenario appearing first in order to preventparticipants from associating it with snooker. Initial velocity in thefrictionless scenario was lowered in order to make post-collisionvelocities similar between the two scenarios.
In order to evaluate the scenarios for participant bias, we adopteda repeated measures design, which allowed a detection-theoreticanalysis to be performed. As noted by Reitsma and Pollard [2003],detection theory [Macmillan and Creelman 1991] can be used to de-rive a bias-independent measure of a user’s ability to detect errors inan animated motion. The method takes into account the differencebetween how frequently the subject correctly labelled a motion ascontaining an error (hit rate H) and how frequently the subject in-correctly labelled an unchanged motion as containing an error (falsealarm rate F ). A subject’s sensitivity (d) to errors iscomputed as:
d = z(H)− z(F ) (1)
where z is the inverse of the normal distribution function. For ex-ample, a hit rate of 50% and a false alarm rate of 16% correspondsto a sensitivity of 1.0, as does a hit rate of 30% coupled with a falsealarm rate of 6%. These two examples of how to obtain a sensitivityof 1.0 demonstrate the bias-independent nature of detection theory:as sensitivity is computed based on the relative distribution of theparticipant’s responses rather than on the raw distribution, factorswhich will systematically bias the responses, such as participant re-action to the level of realism with which the scenario is rendered,are automatically factored out.
Five levels of angular distortion (15o—75o) were added to colli-sions, with each error treatment being repeated three times. Iden-
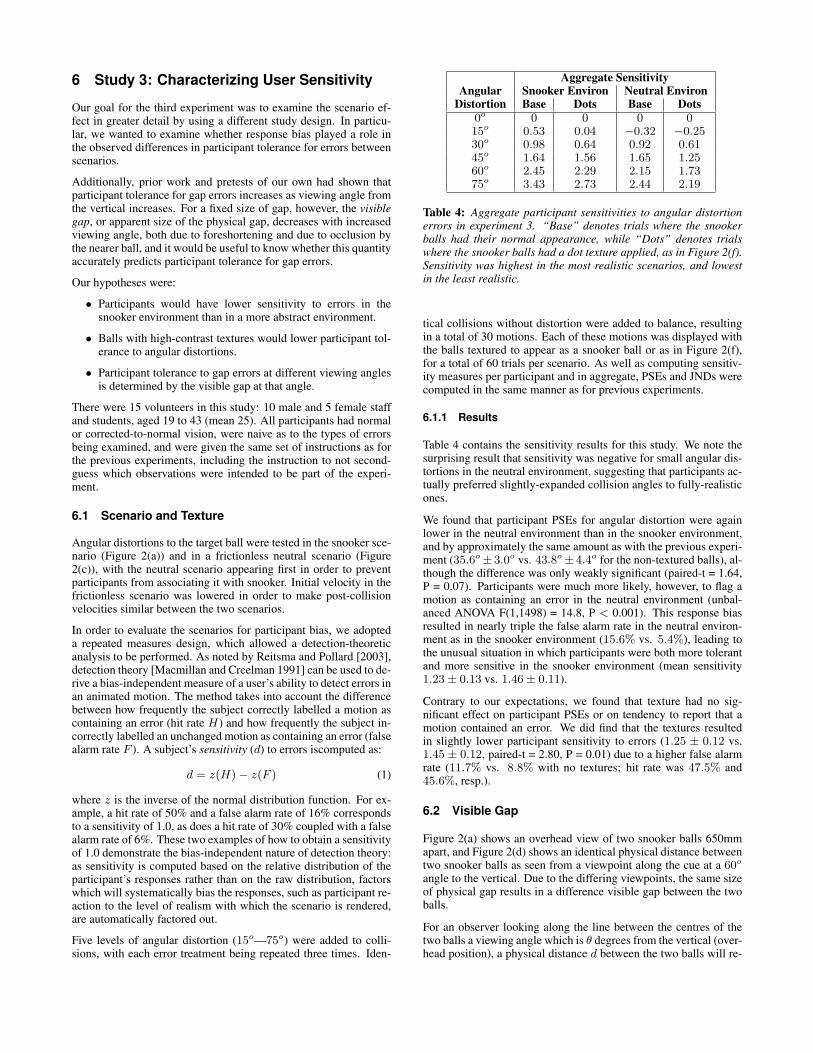
Aggregate SensitivityAngular Snooker Environ Neutral Environ
Table 4: Aggregate participant sensitivities to angular distortionerrors in experiment 3. “Base” denotes trials where the snookerballs had their normal appearance, while “Dots” denotes trialswhere the snooker balls had a dot texture applied, as in Figure 2(f).Sensitivity was highest in the most realistic scenarios, and lowestin the least realistic.
tical collisions without distortion were added to balance, resultingin a total of 30 motions. Each of these motions was displayed withthe balls textured to appear as a snooker ball or as in Figure 2(f),for a total of 60 trials per scenario. As well as computing sensitiv-ity measures per participant and in aggregate, PSEs and JNDs werecomputed in the same manner as for previous experiments.
6.1.1 Results
Table 4 contains the sensitivity results for this study. We note thesurprising result that sensitivity was negative for small angular dis-tortions in the neutral environment, suggesting that participants ac-tually preferred slightly-expanded collision angles to fully-realisticones.
We found that participant PSEs for angular distortion were againlower in the neutral environment than in the snooker environment,and by approximately the same amount as with the previous experi-ment (35.6o± 3.0o vs. 43.8o± 4.4o for the non-textured balls), al-though the difference was only weakly significant (paired-t = 1.64,P = 0.07). Participants were much more likely, however, to flag amotion as containing an error in the neutral environment (unbal-anced ANOVA F(1,1498) = 14.8, P < 0.001). This response biasresulted in nearly triple the false alarm rate in the neutral environ-ment as in the snooker environment (15.6% vs. 5.4%), leading tothe unusual situation in which participants were both more tolerantand more sensitive in the snooker environment (mean sensitivity1.23± 0.13 vs. 1.46± 0.11).
Contrary to our expectations, we found that texture had no sig-nificant effect on participant PSEs or on tendency to report that amotion contained an error. We did find that the textures resultedin slightly lower participant sensitivity to errors (1.25 ± 0.12 vs.1.45 ± 0.12, paired-t = 2.80, P = 0.01) due to a higher false alarmrate (11.7% vs. 8.8% with no textures; hit rate was 47.5% and45.6%, resp.).
6.2 Visible Gap
Figure 2(a) shows an overhead view of two snooker balls 650mmapart, and Figure 2(d) shows an identical physical distance betweentwo snooker balls as seen from a viewpoint along the cue at a 60o
angle to the vertical. Due to the differing viewpoints, the same sizeof physical gap results in a difference visible gap between the twoballs.
For an observer looking along the line between the centres of thetwo balls a viewing angle which is θ degrees from the vertical (over-head position), a physical distance d between the two balls will re-
Viewing PSE for Physical PSE for VisibleAngle Gap (mm) Gap (mm)
Table 5: Mean PSE values for detection of gap errors at differentviewing angles from the vertical, along with the amount of gap vis-ible at that angle. Values are given as mean ± standard error ofthe mean (SEM). Gap distances are given in terms of on-screen dis-tance; 16mm is approximately one degree of a participant’s field ofview.
sult in a visible gap between them of:
V = cos(θ) ∗ d− r ∗ (sin(θ)tan(θ)− 1 + cos(θ)) (2)
where r, the radius of the balls, is 26.25mm. At a 60o view-ing angle, a 650mm physical gap corresponds to a visible gap of298.75mm, a reduction of 54%. These distances in the simulationcorrespond to approximately 87mm and 40mm, resp., on the screenused to conduct the experiment. Note that this gives a slightly con-servative estimate for visible gap, as our viewpoints were alignedwith the cue, which was offset by approximately 1o from the linebetween the centres of the balls. For our experiment, the differencewas around 1%.
Five viewing angles were examined, from 0o (corresponding to thedefault overhead view; Figure 2(a)) to 80o (corresponding to a viewalong and just above the cue; Figure 2(d)). Distance from the pointof collision was the same for all viewing angles, and the PSE foreach viewing angle was estimated as the average of the last fourreversals of a descending staircase (out of eight).
6.2.1 Results
PSE for visible gap stayed nearly constant for moderate viewingangles (see Table 5), as the physical distance between balls corre-sponding to the mean PSE increased just fast enough to offset themanner in which increased viewing angle appears to reduce thatdistance. At steep viewing angles, however, participants detectedgap errors with much lower visible gaps.
7 Discussion
Our most directly-applicable finding is that the visible gap betweencolliding object appears to be an accurate predictor of user toleranceto gap errors for viewing angles up to about 40o. We note, however,that there appear to be multiple mechanisms by which participantsare able to detect the presence of gap errors. Direct observation ofgaps appears to dominate for low viewing angles, as participantsconverged to a mean PSE of about 6mm of visible gap regardlessof viewing angle. At steeper viewing angles, and in particular atthe 80o viewing angle where no gap was ever visible between thesnooker balls, participants appear to have used a different techniqueto detect collision gap errors.
We were surprised to find that audio cues had no significant ef-fect for any of the types of error, in contrast to findings that au-dio and visual cues can reinforce each other in tasks such as mo-tion detection [Alais and Burr 2004]. Indeed, we note that for thepurely audio error condition (”sound delay”), only 8 of 16 partic-ipants mentioned sound in their post-study questionnaire, and re-sponses were strongly bimodal, with 6 of 16 participants display-ing strong convergence (all PSEs under 150ms, mean 59ms) and the
other 10 participants displaying weak or no convergence (all PSEsover 400ms or not computable, as compared to a maximum errorvalue of 500ms). One possibility is that most participants consid-ered visual information to be of overriding importance, and largelydismissed audio cues, despite our explicit instruction to consider allinformation from the simulation. Indeed, in post-study questioning,one participant expressed surprise that the ”sound delay” error con-dition – i.e., where the animation is correct but the sound is delayed– even existed.
Similarly, neither texture we tried had a significant effect on partic-ipant tolerance for errors, and there was no significant difference inparticipant tolerance for gap errors between any of the three scenar-ios we tested.
By contrast, we found a significant effect of scenario realism on par-ticipant response to angular distortions. Participants’ tolerance forangular distortions did not differ significantly between the two non-snooker scenarios we examined, and tolerance in those environ-ments was very similar to that reported by O’Sullivan et al. [2003];tolerance in the realistic snooker environment, however, was sub-stantially higher. At least for the small set of scenarios we exam-ined, abstract or neutral scenarios appeared to offer a conservativeestimate of tolerance; however, it is possible that some scenarioswill bias participants to be less tolerant of certain errors.
While participant tolerance for errors was higher in the realisticsnooker environment, participant sensitivity to angular distortionswas also higher, a seemingly-contradictory result. The root causefor both of these differences appears to be a response bias whenreasoning about angular distortion errors; participants were sys-tematically more likely to report a trial in a less realistic scenarioas containing an error, regardless of whether or not any error wasactually present. Indeed, the most realistic-looking scenario (thebasic snooker setup) received the lowest false alarm rate (3.6%)and the least realistic scenario (textured balls in the neutral sce-nario) received the highest (16.7%). One possible explanation isthat unrealistic scenarios increase the amount of randomness andnoise in user responses; this would account for the lower sensitiv-ity for the unrealistic environment seen in Table 4. A second ex-planation is simply that participants were biased by the scenario,and had a greater tendency to view motions in realistic scenariosas being realistic, and conversely motions in unrealistic scenariosas being unrealistic. We note that this response bias appeared tocut across participant level of experience with physics or snooker.The exception is that participants reporting snooker experience dis-played equal sensitivity to angular distortions in both the snookerand non-snooker environments, whereas participants with no suchexperience displayed substantially higher sensitivity in the realisticsnooker environment; however, both groups displayed higher toler-ance for errors in the realistic environment.
We note that this tendency of more realistic portrayals to result inhigher participant sensitivity to some types of of error and not oth-ers has been seen for other types of motion (e.g., [Reitsma et al.2008], and wonder if there might be a consistent pattern to whichtypes of errors are affected. One intuitive, although speculative,possibility is that errors which are local in nature and detected bydirect observation (e.g., collision gaps or velocity spikes) wouldtend to be less affected than errors which are more global in nature,and are more commonly detected by inference from their effect onthe overall character of the motion than by direct observation (e.g.,angular distortions or changes to gravity). It is possible, however,that particular scenarios could bias other types of errors, even thosesuch as delay which have so far shown no change across scenariotypes. For example, deformable objects are known to have highlyinelastic collisions, and hence a short delay might potentially beconfused with object deformation. Finding such a pattern, if one
exists, could prove useful in determining to what extent results fromcertain types of psychophysical experiments can be generalized be-yond the scenarios in which the experiments were conducted.
8 Conclusions
In this paper we find that the choice of scenario can strongly influ-ence people’s decisions on some types of errors. Tolerance to manycommonly-measured errors appears to be consistent between a neu-tral environment and the type of abstract setup use for some psy-chophysical studies. We note, however, that choice of scenario cansystematically bias the decisions of users regarding certain types oferrors, and that different measures of how users are affected by er-rors may change in different ways due to such biases. Examiningboth tolerance and sensitivity to errors can help to uncover biasessuch as these.
We find that neither audio corresponding to the collision event northe addition of a texture which provided information on object ro-tation had a significant effect on participant tolerance of errors. Wenote, however, that in our experiments an unrealistic texture ap-peared to bias participants to respond more negatively to motions,as did an unrealistic environment. More research is needed to de-termine how pervasive this type of bias may be.
Finally, we find that visible distance can accurately predict partici-pant sensitivity to gap errors up to angles of 40o, potentially allow-ing greater flexibility in tasks such as approximate collision detec-tion.
Acknowledgements
The authors would like to thank Richard Lee for providing the codeto his snooker simulator.
References
ALAIS, D., AND BURR, D. 2004. No direction-specific bimodalfacilitation for audiovisual motion detection. Cognitive BrainResearch, 19(2), 185–194.
BARZEL, R., HUGHES, J. F., AND WOOD, D. N. 1996. Plau-sible motion simluations for computer graphics animation. InProc. Eurographics Workshop on Computer Animation and Sim-ulation.
CHENNEY, S., AND FORSYTH, D. A. 2000. Sampling plausiblesolutions to multi-body constraint problems. In Proceedings ofSIGGRAPH 2000, 219–228.
COHEN, R. L. 1964. Problems in motion perception. Uppsals,Sweden: Lundequistska.
CORNSWEET, T. 1962. The staircase method in psychophysics.American Journal of Psychology, 485–491.
HICHEUR, H., VIEILLEDENT, S., RICHARDSON, M., FLASH, T.,AND BERTHOZ, A. 2005. Velocity and curvature in human lo-comotion along complex curved paths: A comparison with handmovements. In Experimental Brain Research, no. 162, 145–154.
HODGINS, J. K., O’BRIEN, J. F., AND TUMBLIN, J. 1998. Per-ception of human motion with different geometric models. IEEETransactions on Visualization and Computer Graphics 4, 4 (Oc-tober), 307–316.
KAISER, M. K., AND PROFFITT, D. R. 1987. Observers’ sen-sitivity to dynamic anomalies in collisions. Perception & Psy-chophysics, 42(3), 275–280.
LEVITT, H. 1971. Transformed up-down methods in psychoacous-tics. Journal of the Acoustical Society of America, 467–477.
MACMILLAN, N. A., AND CREELMAN, C. D. 1991. Detec-tion Theory: A User’s Guide. Cambridge University Press, NewYork.
MCGURK, H., AND MACDONALD, J. 1976. Hearing lips andseeing voices. Nature 264 (Dec.), 746–748.
METZGER, W. 1934. Beobachtungen uber phanomenale identitat.Psychologische Forschung 19, 1–60.
MICHOTTE, A. 1963. The perception of causality. Metheun, Lon-don.
OESKER, M., HECHT, H., AND JUNG, B. 2000. Psychologi-cal evidence for unconscious processing of detail in real-timeanimation of multiple characters. Journal of Visualization andComputer Animation 11, 105–112.
O’SULLIVAN, C., AND DINGLIANA, J. 2001. Collisions and per-ception. ACM Transactions on Graphics 20, 3 (July), 151–168.
O’SULLIVAN, C., DINGLIANA, J., GIANG, T., AND KAISER,M. K. 2003. Evaluating the visual fidelity of physically basedanimations. In ACM Transactions on Graphics 2, 3, 527–536.
POPOVIC, Z. 2000. Controlling physics in realistic character ani-mation. Communications of the ACM 43, 7, 50–58.
REITSMA, P. S. A., AND POLLARD, N. S. 2003. Perceptual met-rics for character animation: Sensitivity to errors in ballistic mo-tion. ACM Transactions on Graphics 22, 3 (July), 537–542.
REITSMA, P. S. A., ANDREWS, J., AND POLLARD, N. S. 2008.Effect of character animacy and preparatory motion on percep-tual magnitude of errors in ballistic motion. In Computer Graph-ics Forum (Eurographics), vol. 27(2), 201–210.
SEKULAR, R., SEKULAR, A., AND LAU, R. 1997. Sound altersvisual motion perception. Nature, v.385, pp.308.
STAPPERS, P. J., AND WALLER, P. E. 1993. Using the free fall ofobjects under gravity for visual depth estimation. Bulletin of thePsychonomic Society 31, 2, 125–127.
TWIGG, C. D., AND JAMES, D. L. 2007. Many-worlds brows-ing for control of multibody dynamics. ACM Transactions onGraphics 26, 3.