Page 1
International Journal of Research and Scientific Innovation (IJRSI) | Volume IV, Issue X, October 2017 | ISSN 2321–2705
www.rsisinternational.org Page 61
Effect of Shear Wall on Sesmic Behavior of
Unsymmetrical Reinforced Concrete Structure Gaikwad Ujwala Vithal
Master of Engineering - Civil Engineering (Structures), SCOE, Pune, Maharashtra, India
Abstract: - Shear wall are used in tall buildings as supporting
element to resist earthquake loading. In order to enhance the
ductility of the structural system the walls are connected together
with lateral beams. Many researchers have investigated the
behavior of shear walls using different methods. Analytical
methods are one of the early techniques used in analysis of shear
walls. During an earthquake, damage to building is largely
caused by dynamic loads. Therefore, in order to design buildings
resistant to earthquake, dynamic characteristics of building must
be known.
Generally asymmetric tall buildings may consist of any
combination of structural forms, such as frames, shear walls,
structural cores, and coupled shear walls. Lateral forces caused
by wind, earthquake, and uneven settlement loads, in addition to
the weight of structure and people living; create torsion in
structure.
In this study Response Spectrum method is used to analyse
horizontally unsymmetrical structure. Aim of this study to
decrease torsion using shear wall in structure. ETABS is
computer software used to prove the point. Five different cases to
analyse the structure i.e. four concentric shear walls at lift, shear
wall parallel to X axis, shear wall parallel to Y axis, shear walls
placed at exterior corners and two shear wall placed parallel to X
axis and three parallel to Y axis. Different thicknesses of shear
wall i.e. 150mm, 200mm, 300mm, and 400mmare used in all
these cases. It has been observed that the torsion, drift and
displacement in structure decreased by using concentric shear
wall at corners. This study will be useful while positioning of
shear wall in structure.
Keywords-Torsion; Concentric shear wall; Drift; Displacement;
Positioning; Thickness.
I. INTRODUCTION
1.1 General
Reinforced concrete (RC) buildings often have vertical plate-
like RC walls called shear walls in addition to slabs, beams
and columns. These walls generally start at foundation level
and are continuous throughout the building height. Their
thickness can be as low as 150mm, or as high as 400mm in
high rise buildings. Shear walls are usually provided along
both length and width of buildings. Shear walls are like
vertically-oriented wide beams that carry earthquake loads
downwards to the foundation.
Shear walls are vertical elements of the horizontal force
resisting system. Shear walls are constructed to counter the
effects of lateral load acting on a structure. In residential
construction, shear walls are straight external walls that
typically form a box which provides all of the lateral support
for the building. In building construction, a rigid vertical
diaphragm capable of transferring lateral forces from exterior
walls, floors, and roofs to the ground foundation in a
direction parallel to their planes. Lateral forces caused by
wind, earthquake, and uneven settlement loads, in addition to
the weight of structure and people living; create powerful
torsion. Reinforcing a frame by attaching or placing a rigid wall
inside it maintains the shape of the frame and prevents
rotation at the joints. Shear walls are especially important in
high-rise buildings subjected to lateral wind and seismic
forces.
In the last few decades, shear walls became an important
part of mid and high-rise residential buildings. As part of an
earthquake resistant building design, these walls are placed in
building plans reducing lateral displacements under earthquake
loads. So shear-wall frame structures are obtained. Shear wall
buildings are usually regular in plan and in elevation.
1.2 Purpose of constructing shear walls
Shear walls designed for lateral loads of earthquakes and wind.
The walls are structurally connected with diaphragms and other
lateral walls at right angles, therefore gives stability to the
building structures. Shear wall structural systems are more
stable than RCC framed structures.
Walls have to resist the uplift forces caused by the pull of the
wind. Walls have to resist shear forces that try to push the walls
over. Walls have to resist the lateral force of e wind that tries to
push the walls in and pull them away from the building. These
walls will consume shear forces and will prevent changing
locations and positions of construction and consequently
destruction. Constructing the shear wall in tall, medium and
even short buildings will reinforce the structure significantly,
and either more economic than the bending frames.
1.3 Comparison of shear wall with construction of
conventional load bearing walls
Load bearing masonry is very brittle material. Due to different
kinds of stresses such as shear, tension, torsion, etc., caused
by the earthquakes, the conventional unreinforced brick
masonry collapses instantly during the unpredictable and
sudden earthquakes. The RCC framed structures are
slender, when compared to shear wall concept of box like
three-dimensional structures. Though it is possible to
Page 2
International Journal of Research and Scientific Innovation (IJRSI) | Volume IV, Issue X, October 2017 | ISSN 2321–2705
www.rsisinternational.org Page 62
design the earthquake resistant RCC frame, it requires
extraordinary skills at design, detailing and
construction levels, which cannot be anticipated in all types of
construction projects. On the other hand even moderately
designed shear wall structures not only more stable, but
also comparatively quite ductile. In safety terms it means that,
during very severe earthquakes they will not suddenly
collapse causing death of people. They give enough
indicative warnings such as widening structural cracks,
yielding rods, etc., offering most precious moments for people
to run out off structures, before they totally collapse.
For structural purposes we consider the exterior walls as
the shear-resisting walls. Forces from the ceiling and
roof diaphragms make their way to the outside along
assumed paths, enter the walls, and exit at the foundation.
1.4 Forces on shear walls
Shear walls resist two types of forces: shear forces and uplift
forces. Shear forces are generated in stationary buildings by
accelerations resulting from ground movement and by external
forces like wind and waves. This action creates shear forces
throughout the height of the wall between the top and bottom
shear wall connections. Uplift forces exist on shear walls
because the horizontal forces are applied to the top of the wall.
These uplift forces try to lift up one end of the wall and push
the other end down. In some cases, the uplift force is large
enough to tip the wall over. Uplift forces are greater on tall
short walls and less on low long walls. To form an effective box
structure, equal length shear walls should be placed
symmetrically on all four exterior walls of the building. Shear
walls should be added to the building interior when the exterior
walls cannot provide sufficient strength and stiffness. When
exterior shear walls do not provide sufficient strength, other
parts of the building will need additional strengthening.
Shear walls in high seismic regions require special detailing.
However, in past earthquakes, even buildings with sufficient
amount of walls that were not specially detailed for seismic
performance (but had enough well-distributed reinforcement)
were saved from collapse. Shear wall buildings are a popular
choice in many earthquake prone countries, like Chile, New
Zealand and USA. Shear walls are easy to construct, because
reinforcement detailing of walls is relatively straight-forward
and therefore easily implemented at site. Shear walls are
efficient, both in terms of construction cost and effectiveness
in minimizing earthquake damage in structural and non
structural elements (like glass windows and building
contents).
1.5 Architectural aspects of shear walls
Most RC buildings with shear walls also have columns; these
columns primarily carry gravity loads (i.e. those due to self-
weight and contents of building). Shear walls provide large
strength and stiffness to buildings in the direction of their
orientation, which significantly reduces lateral sway of the
building and thereby reduces damage to structure and its
contents. Since shear walls carry large horizontal earthquake
forces, the overturning effects on them are large. Thus, design
of their foundations requires special attention. Shear walls
should be provided along preferably both length and width.
However, if they are provided along only one direction, a
proper grid of beams and columns in the vertical plane (called
a moment-resistant frame) must be provided along the other
direction to resist strong earthquake effects. Door or window
openings can be provided in shear walls, but their size must be
small to ensure least interruption to force flow through walls.
Moreover, openings should be symmetrically located. Special
design checks are required to ensure that the net cross
sectional area of a wall at an opening is sufficient to carry the
horizontal earthquake force. Shear walls in buildings must be
symmetrically located in plan to reduce ill-effects of twist in
buildings. They could be placed symmetrically along one or
both directions in plan. Shear walls are more effective when
located along exterior perimeter of the building – such a
layout increases resistance of the building to twisting.
1.6 Methods of seismic analysis
Once the structural model is selected, it is necessary to
perform analysis to determine the seismically induced forces
in the structure. Lot of research is carried out in this area to
propose simplified methods that will predict results with
reasonable accuracy. So there are different methods of
analysis are invented which provide different degrees of
accuracy. The analysis process can be categorized on the basis
of three factors: the type of externally applied loads, the
behavior of structure or the structural materials and the type of
structural model selected.
Based on the type of external action and behavior of structure,
the analysis can be further classified as linear dynamic
analysis, nonlinear static analysis or non-linear dynamic
analysis as shown in following dig. Linear static analysis or
equivalent static analysis used only for regular structure with
limited height. Linear dynamic analysis considers the effect of
the higher mode of vibration and the actual distribution of
forces in the elastic range in a better way.
Fig.1 Flowchart for Seismic Analysis
Page 3
International Journal of Research and Scientific Innovation (IJRSI) | Volume IV, Issue X, October 2017 | ISSN 2321–2705
www.rsisinternational.org Page 63
This analysis can be performed in two ways either by mode
superposition method or response spectrum method and
elastic time history method.
1.7 Response Spectrum Method
In response spectrum method the peak response of structure
during an earthquake is obtain directly from the earthquake
response spectrum. This procedure gives an approximate peak
response, but this is quite accurate for structural design
applications. In this approach the multiple modes of response
of building to an earthquake are taken in account. For each
mode, a response is read from design spectrum, base on modal
frequency and modal mass. In this method the load vectors are
calculated corresponding to predefined number of modes.
These load vectors are applied at the design centre of mass to
calculate the respective modal responses. These modal
responses are then combined according to Square Root of
Sum of Squares (SRSS) or Complete Quadratic Combination
(CQC) rule to get the total response. From the response of the
structure fundamentals of dynamics it is quite clear that modal
response of the structure subjected to particular ground
motion, is estimated by combination of the results of static
analysis of the structures subjected to corresponding modal
load vector and dynamic analysis of the corresponding single
degree of freedom system subjected to same ground motion.
Static response of Multiple Degrees of Freedom (MDOF)
system is then multiplied with the spectral ordinate obtained
from dynamic analysis of Single Degree of Freedom (SDOF)
system to get that modal response. Same procedure is carried
out for other modes and the results are obtained through SRSS
or CQC rule.
In response spectrum analysis the spectral values are read
from the design spectrum which are directly multiplied with
the modal load vector and the static analysis is performed to
determine the corresponding modal peak responses. This
method is known as the Classical Modal Analysis.
The loads acting on the structure are contributed from slabs,
beams, columns, walls, ceilings and finishes. They are
calculated by conventional methods according to IS 456 -2000
and are applied as gravity loads along with live loads as per
IS: 875 [Part II) in the structural model. The lateral loads and
their vertical distribution on each floor level are determined as
per IS 1893 — 2002 and calculated. These loads are then
applied in response spectrum method.
1.8 Need of this study
Reinforced concrete wall, which include lift walls or shear
walls, are the usual requirements of multi storey building.
Design by coinciding centroid and center of mass of building
is the ideal for structure. However on many occasion the
design has to base on the off center posing of lift and stair
case walls with respect to the centre of mass. The design in
this case results into an excessive stresses in most of the
structural members, unwanted torsional moment and sways.
It is found that structure forces are found to increase on to the
eccentric position of shear wall away from the centroid of the
building. Twisting moments in members are observed to be
having increasing trend with enhancement in the eccentricity
between geometrical centroid of the building and shear wall
position. Stresses in shear wall elements have more
pronounced effect in elements parallel to displaced direction
of shear wall as compared to those in perpendicular direction.
The lateral loads acting on high-rise buildings, induced by
wind and earthquake, are generally resisted by shear walls.
1.9 Aim and objectives of project
Most of the designer adopts approximate methods for the
torsional analysis of building. However this may be an
inaccurate assessment. Several studies of structural damage
during the past earthquake reveal that torsion is the most
critical factor leading to major damage or complete collapse
of building. It is therefore, necessary that irregular buildings
should be analyzed for torsion. A three dimensional analysis
using Etabs is able to calculate the center of rigidity; by
getting these values we can perform torsional analysis.
The aim of the present analytical research work is to
investigate influence of positioning of shear wall on the
torsional value of building. The present study focused on to
find out how we can minimize torsion in building by using
concentric shear wall and eccentric shear wall. The literature
surveys carried out on the topic has not enabled me to trace
any research work carried out on the optimum value of torsion
for structure. Many times merely providing shear wall in
structure didn't solve problem. Proving shear wall at eccentric
position can increase force on structure. This can lead to
uneconomical structure. Five different cases of shear wall
position for 11-storey building have been analyzed as a space
frame system using ETABS.
Objectives of the project:
Study of different shear wall position to reduce torsion, base
shear in the structure due to seismic forces.
Checking the effect of thickness of shear wall in seismic
analysis.
Comparing all the cases with structure without shear wall.
1.10 Closure
This chapter clears the exact image of the present study; it
gives the general introduction of what this project work is all
about. It specifies the requirement and the objective of present
study in this introductory chapter.
II. TORSION IN BUILDING
Translations and rotations at floor levels are obtained for
different shear wall models. In the second part, the behavior
of the shear walls located in shear wall-frame building
structures is investigated. Building structures having different
floor plans and a different number of storeys are subjected to
ax symmetric lateral loads and pure floor torsions. The
Page 4
International Journal of Research and Scientific Innovation (IJRSI) | Volume IV, Issue X, October 2017 | ISSN 2321–2705
www.rsisinternational.org Page 64
performance of the proposed models is tested by comparing
floor displacements and total resultant forces on shear walls at
the floor levels. In the last part of the static analyses, the
results of analysis and experiments of some previous studies
are compared with the proposed models.
Torsional response in structure arise from two sources (a)
Eccentricity in mass and stiffness distribution, which cause a
torsional response coupled with translational response and (b)
torsion arising from accidental causes, including the rotational
component of ground motion about a vertical axis, the
difference between assumed and actual stiffness and mass,
uncertain live load distribution, uncertainties in dead load due
to variation in workmanship and material, asymmetrical
patterns of non linear force deformation relations and
subsequent alternation that may be made in building which
not only change the dead load but may change the position of
the centre.
For symmetrically building, the elementary analysis does not
disclose the slightest torque; while actually, the probability
that there will be such a generalized force during the
earthquake is one. Even non linear behavior can introduce
torque that is not accounted by conventional analysis. The
current state of scientific advancement in this field predicts an
accurate estimate of this accidental additional torsion. Torsion
in buildings during earthquake shaking may be caused from a
variety of reasons, the most common of which are non-
symmetric distributions of mass and stiffness. Modern codes
deal with torsion by placing restrictions on the design of
buildings with irregular layouts and also through the
introduction of an accidental eccentricity that must be
considered in design. The lateral-torsional coupling due to
eccentricity between centre of mass (CM) and centre of
rigidity (CR) in asymmetric building structures generates
torsional vibration even under purely translational ground
shaking. During seismic shaking of the structural systems,
inertia force acts through the centre of mass while the resistive
force acts through the centre of rigidity as shown in Fig. .
Fig.3-Generation of torsional moment in asymmetric structures during seismic excitation.[17]
To allow for effects such as the ones listed above, seismic
codes often required that buildings be designed to resist the
additional torsional moment Provision should be made in all
the buildings for increase in the shear forces and lateral forces
resisting elements, which is a result of horizontal torsional
moment arising due to an eccentricity between the centre of
mass and centre of rigidity. The design forces calculated are
to be applied at the centre of mass, which is appropriately
displayed so as to cause the designed eccentricity between the
displaced centre of mass and centre of rigidity.
The designed eccentricity edi , to be used at the floor I should
be
edi = 1.5 est + 0.05 bi or est – 0.05 bi
Whichever gives the more severe effect in the shear of any
frame. Here est is the static eccentricity at the floor i, defined
as the distance between centre of mass and centre of rigidity,
and bi is the floor plan dimension of the floor i, perpendicular
to the direction of force. The factor 1.5 represents dynamic
amplification factor, while the factor 0.05 represents the
extent of accidental eccentricity. The dynamic and
amplification factor is also known as response amplification
factor, is used to convert the static torsional response. Highly
irregular buildings are analyzed by using modal analysis. The
value of accidental eccentricity is assumed as 5% of the
planned dimension of the building storey, particularly for the
accidental torsional response during the applied ground
motion. Therefore additive shear have been superimposed for
statically applied eccentricity ±0.05bi with respect to centre of
rigidity.
Torsion arises from no. of causes: building shape, and
dynamic response. Torsion cannot be eliminated but can
possibly be minimized, or at least designed for if recognized.
Building codes and standards have lagged behind the
recognition of this important load type: most ignore torsion.
If torsion is resisted by shear walls placed near the ends of the
building then a given torque may increase the shear stresses
only slightly, and the wind direction of maximum overall
building shear may well represent the design case. However,
if the shear walls are concentrated near the core then the same
torque will produce a much greater shear stress, and the
design condition is more likely to occur at the direction of
maximum eccentricity.
III. LITERATURE REVEIW
3.1 General
In this analytical study of subject it is required to search
different existing cases and the available study material
regarding that subject. In order to collect the necessary and
valuable information, the literature survey is done. So the
study of topic and the related literature published in different
journals and papers are as follows
Earthquake analysis of three dimensional shear wall-
frame assembly on pile foundations considering soil
structure interaction, Clifford D’souza, Prof. D. N.
Buragohain (1984)
Page 5
International Journal of Research and Scientific Innovation (IJRSI) | Volume IV, Issue X, October 2017 | ISSN 2321–2705
www.rsisinternational.org Page 65
In this paper the earthquake response of a three dimensional
shear will-frame assembly on pile foundations considering
soil-structure interaction is evaluated by the Frequency
Domain general Substructure method (FDGS). The building-
pile foundation system is treated as two substructures:
building and pile foundation, For the building, the analysis
incorporates the rigidity of floor slabs in their planes, the
effect of three dimensional shear walls and the eccentricity of
beam connections to shear walls. Tremendous saving in
computational effort is achieved. A numerical example is
solved to illustrate the above approach. Two different values
of shear wave velocity of soil, Vs = 140 and 313 m/s are
considered.
The results of this analysis are presented in graphical and
tabular forms and compared for the two soil conditions to
bring forth the effects of soil-structure on the response of the
building. The maximum earthquake response of the building
alone by assuming it to be fixed at its base is evaluated by the
Response Spectrum method for buildings (RSB) and
compared with the absolute maximum response obtained by
FDGS for the two soil conditions. The evaluation of the mode
shapes and natural frequencies of the building-pile foundation
system for this purpose shows that these are not significantly
different from those of the building on fixed base. This means
that RSB can still be used for predicting satisfactorily the
earthquake response of the buildings on soft soil provided a
correct damping ratio is chosen. Computer programs have
been developed to carry out the different aspects of the
numerical work. The results of this investigation bring forth
the actual effects of soil-structure interaction in a building-pile
system for the first time.
The main conclusion drawn from the study is that : A
Component Element idealization method is developed for
idealizing shear-wall cores, the method considers all
significant factors that affect earthquake response behavior of
typical cores. The method has wider range of applicability
than the (DE) method. Although the number of d.o.f. needed
to adequately represent the core behavior in both methods is
comparable, the main advantage of the (CE) method is that the
cross-sectional properties need not to be computed, therefore,
the method can be used to idealize all practical shear-wall
core systems; Shear and warping de4formations are shown to
be of significant effect in cases of squat cores and affect the
torsional behavior of these cores.
Simplified model for damage in squat RC shear walls,
Edward D. thomsona, Maria E. Perdomob, Ricardo Picon,
Maria E. Marante3b, Julio Florez-Lopez, Engineering
Structures 31 (2009) 2215-2223
In this paper, a new simplified model for simulating damage
of squat RC shear walls under lateral loads is proposed. The
proposed numerical model is implemented in a commercial
finite element program and validated against experimental
results. This simplified model is based on damage and
fracture mechanics. It describes the reduction in stiffness and
strength due to diagonal cracking, permanent deformations
due to yielding of transverse reinforcement and sliding across
shear cracks. A yield function to describe permanent
deformations due to yielding of transverse reinforcement is
proposed. Then, a crack resistance function is introduced and
experimentally identified. Analytical expressions are
developed for hysteretic behavior. It is shown that the model
can predict well the response of RC shear walls. A good
correlation between experiment and model can be appreciated.
Most parameters of the model can be determined from
conventional reinforced concrete theory. In its present state,
the model does not account for the combined damage due to
shear and bending, as in tall shear walls, where cracking due
to bending may be more significant than cracking due to
shear.
The main conclusion drawn form study that stiffness and
strength degradation mainly due to diagonal cracking of the
concrete; plastic deformations due to yield of the horizontal
reinforcement; and sliding shear across diagonal cracks
(―pinching effect‖). A good correlation between experiment
and model can be appreciated. Most parameters of the model
can be determined from conventional reinforced concrete
theory.
The design algorithm makes use of properties of section
which is quite useful in describing deformations and stresses
when the plane cross section no longer remains plane. A
numerical procedure presented in this study automates the
computation of sectional properties in addition to the
determination of the shear center of reinforced concrete thin
walled sections. Furthermore an iterative procedure is
developed for finding the location of the neutral axis in
reinforced concrete thin walled section subjected to axial
force, biaxial bending moments and torsional moment.
A simplified approach for seismic calculation of a tall
building braced by shear walls and thin-walled open
section structures, Sid Ahmed Meftah, Abdelouahed
Tounsi, Adda Bedia El Abbas, Engineering Structures29
(2007) 2576-2585
In this paper an approximate hand-method for seismic
analysis of an asymmetric building structure having constant
properties along its height is presented. The building is
stiffened by a combination of shear walls and thin-walled
open section structures. Based on the continuum technique
and D’Alembert’s principle, the governing equations of free
vibration and the corresponding Eigen value problem were
derived. A generalized method is proposed for the free
vibration analysis of coupled vibration of a building braced by
shear walls and thin-walled open section structures.
Simplified formulae are given frequencies and internal forces
of a building structure subjected to earthquakes.
The utility and accuracy of the method is demonstrated by a
numerical example, in which he proposed method is compared
with finite element calculations. In this paper, a dynamic
analysis of tall buildings braced by shear walls and thin-
Page 6
International Journal of Research and Scientific Innovation (IJRSI) | Volume IV, Issue X, October 2017 | ISSN 2321–2705
www.rsisinternational.org Page 66
walled open section structures is presented. In such a
structural configuration, the lateral displacements in two
perpendicular directions and the torsional rotation can no
longer be treated separately due to their coupling in the
governing differential equations of free vibration. Hence, if
the flexural vibrations in one direction are coupled with the
torsional vibrations, the resulting phenomenon is called
double coupling.
Analysis of shear wall structures on elastic foundations, S.
S. Badiet, D. C. Salmon and A. W. Beshara Computers &
Structures Vol.65. No.2 (1995)
In this paper, method for analyzing shear wall structures on
elastic foundations is presented. The shear walls are modeled
using a nine-noded isoperimetric quadrilateral plane stress
element and the soil is modeled using a three-noded quadratic
element that includes the vertical sub grade reaction and soil
shear stiffness. It is observed that analyzing shear wall
structures as fixed cantilevers, i.e. ignoring soil-structure
interaction, significantly underestimates the wall drift.
Lateral stiffness and vibration characteristics of composite
plated RC shear walls with variable fibres spacing, S. A.
Meftah, R. Yeghnem, A. Tounsi, E.A. Adda Bedia,
Materials and Design 29 (2008) 1955-1964
In this paper, a finite element model for static and free
vibration analysis of reinforced concrete (RC) shear walls
structures strengthened with thin composite plates having
variable fibres spacing is presented. An efficient analysis
method that can be used regardless to the sizes and location of
the bonded plates is proposed in this study. In the numerical
formulation, the adherents and the adhesives are all modeled
as shear will elements, using the mixed finite element method.
Several test problems are examined to demonstrate the
accuracy and effectiveness of the proposed method.
Numerical results are obtained for six non uniform
distributions of E-glass, graphite and boron fibers in epoxy
matrices. The fibre redistributions of the bonded plates are
seen to increase the frequencies modes and reduce
substantially the lateral displacements. In the numerical
formulation of the present study, the adherents and the
adhesives layers are all modeled as shear walls, by using a
mixed finite element method to find the stiffness matrix of the
equivalent composite shear wall element having variable
fibres spacing. The finite element method (FEM) is employed
to determine the deflection and dynamic characteristics in free
vibration analyses problem. Numerical results are presented
that relate to the performance of RC shear walls strengthened
with composite sheets having parallel and variable fibres
spacing.
The numerical investigation on the representatives RC shear
walls structures strengthened with thin composite plates
having variable fibres spacing shows that good efficiency in
dynamic and lateral stiffness characteristics are obtained by
redistribution of the fibres so that they are concentrated more
in wall edges. This study can be extended to provide an
efficiency concept in the field of RC shear walls structures
strengthened by bonded composite plates.
A new approach on the strengthening of primary school
buildings in Turkey : An application of external shear
wall, M. Yasar Kaltakcia, M. Hakan arslana, Ulku S.
Yilmaza, H. Derya Arslan, Building and Environment, 43
(2008) 983-990
In this study, a new strengthening type of reinforced concrete
buildings namely ―external reinforced concrete shear will‖
application method is discussed, Considerable life and
property losses have occurred because of the devastation due
to the earthquakes happened in Turkey during the last 10
years. Especially, the damages that occurred on the public
buildings were more serious and unchangeable when
compared with the damages that took place on private
buildings. In this study, a new strengthening type of
reinforced concrete buildings namely ―external reinforced
concrete shear wall‖ application method is discussed. For this
purpose, three typical projects, which have been built
commonly, are mentioned. The structural deficiencies
observed in these buildings are given. According to these
tests, the strengthening and system improvement performed
through adding external reinforced concrete shear wall to the
reinforced concrete building will add improved behavior,
strength and rigidity to the system with its low cost besides
the ease of construction and application. Developing this
method for the existing primary school buildings will be able
to be implemented in most of the primary school buildings
without any problems.
External shear wall application will be a practical and
economical solution for the4se detached buildings. There will
be no changes made to the interior architecture of these
buildings. The mixed system formed through the
reinforcement of the reinforced concrete frame type of
buildings with external shear wall (on the outside and on one
side only) significantly increases the lateral load resistance
capacity and rigidity of the existing weak system.
Torsional Behavior of asymmetrical Buildings, Sachin G.
Maske, Dr. P. S. Pajgade. International Journal of Modern
Engineering Research (IJMER) Vol.3, Issue.2, March-
April. 2013 pp-1146-1149
In this paper focus is on torsion and Ast in columns. Torsional
behaviour of asymmetric building is one of the most frequent
sources of structural damage and failure during strong ground
motions. In this work a study on the influence of the torsion
effects on the behaviour of structure is done. In building two
cases are considered, case one is without considering torsion
and case two is considering torsion. The Indian standard code
of practice IS-1893 (Part I: 2002) guidelines and
methodology are used to analyzed and designed building.
Results are compared in terms of % Ast in columns.
Seismic damage surveys and analyses conducted on modes
of failure of building structures during past severe
Page 7
International Journal of Research and Scientific Innovation (IJRSI) | Volume IV, Issue X, October 2017 | ISSN 2321–2705
www.rsisinternational.org Page 67
earthquakes concluded that most vulnerable building
structures are those, which are asymmetric in nature.
Asymmetric-plan buildings, namely buildings with in-plan
asymmetric mass and strength distributions, are systems
characterized by a coupled torsional-translational seismic
response. Asymmetric building structures are almost
unavoidable in modern construction due to various types of
functional and architectural requirements. Torsion in
buildings during earthquake shaking may be caused from a
variety of reasons, the most common of which are non-
symmetric distributions of mass and stiffness. Modern codes
deal with torsion by placing restrictions on the design of
buildings with irregular layouts and also through the
introduction of an accidental eccentricity that must be
considered in design. The lateral-torsional coupling due to
eccentricity between centre of mass (CM) and centre of
rigidity (CR) in asymmetric building structures generates
torsional vibration even under purely translational ground
shaking.
3.2 Closure
The total overview of the literature is presented in chapter 2
which is on investigations done in past by various researchers.
It also gives work done by them and the results obtained by
them.
IV. CODAL PROVISIONS AND REQUIREMENTS
4.1 Codal provisions and requirements
This chapter deals with torsion in structure and shear wall,
various instruction and requirements which are to be followed,
given by the various codes consisting of Indian standard
codes. Structure should be analyzed considering given points.
4.1.1 IS: 13920-1993
General requirements
The requirements of this section apply to the shear walls,
which are part of the lateral force resisting system of the
structure.
1. The thickness of any part of the wall shall preferably,
not is less than 150 mm.
2. The effective flange width, to be used in the design of
flanged wall sections, shall be assumed to extend
beyond the face of the web for a distance which shall
be the smaller of (a) half the distance to an adjacent
shear wall web, and (b) 1/10th
of the total wall height.
3. Shear walls shall be provided with reinforcement in the
longitudinal and transverse directions in the plane of
the wall. The minimum reinforcement ratio shall be
0.0025 of the gross area in each direction. This
reinforcement shall be distributed uniformly across the
cross section of the wall.
4. lf the factored shear stress in the wall exceeds 0.25 or
if the wall thickness exceeds 200 mm, reinforcement
shall be provided in two curtains, each having bars
running transverse directions in the in the longitudinal
and transverse directions in the plane of the wall.
5. The diameter of the bars t o be used in any part of the
wall shall not exceed 1 / 10th of the thickness of that
part.
6. The maximum spacing of reinforcement in either
direction shall not exceed the smaller of Lw/5, 3Tw, and
450mm, where Lw, is the horizontal length of the wall,
and Tw is the thickness of the wall web.
Boundary Elements
Boundary elements are portions along the wall edges that are
strengthened by longitudinal and transverse reinforcement.
Though they may have the same thickness as that of the wall
web it is advantageous to provide them with greater thickness.
Where the extreme fibre compressive stress in the wall due to
factored gravity loads plus factored earthquake force exceeds
0.2Fck, boundary elements shall be provided along the vertical
boundaries of wall.
4.1.2: 1893(PART 1)-2002
Provision shall be made in all the building for increase in
shear forces on the lateral force resisting elements resulting
from the horizontal torsional moment arising due to
eccentricity between the centre of mass and centre of rigidity.
The design forces calculated are to be applied at the centre of
mass appropriately displaced so as to cause design
eccentricity between the displaced centre of mass and centre
of rigidity. However, negative torsional shear shall be
neglected.
In case of highly irregular buildings analyzed according to,
additive shears will be superimposed for a statically applied
eccentricity of ±0.05bi with respect to the centre of rigidity.
4.2 Closure
The total overview of the literature is presented in this chapter
which is on investigations done by various researchers. It also
gives work done them and the results obtained by them.
V. ANALYTICAL WORK
5.1 General
In this section, an 11- floor unsymmetrical structure in plan is
shown. In this structure, we took various positions to shear
walls. The loads acting on the structure are contributed from
slabs, beams, columns, walls, ceilings and finishes. They are
calculated by conventional methods according to IS: 4S6 —
2000 and are applied as gravity loads along with live loads as
per IS: 875 (Part II)-1987 in the structural model. The lateral
loads and their vertical distribution on each floor level are
determined as per IS: 1893 —2002 and calculated. These
loads are then applied in response spectrum method.
Page 8
International Journal of Research and Scientific Innovation (IJRSI) | Volume IV, Issue X, October 2017 | ISSN 2321–2705
www.rsisinternational.org Page 68
With the availability of high speed digital computers, a
rigorous three-dimensional analysis of a multistory building
can be performed. Three dimensional analysis is relatively
more realistic. It gives more exact results than those by two
dimensional analysis. 3-dimensional analysis is the only
solution in case of an unsymmetrical loading geometry of the
structures.
5.2 Types of cases used for analysis of structure
There are different cases considered to analyze 11-
storey structure so that proper position of shear wall
can be predicted.
1. building frame without shear wall [WOSW]
2. building frame with concentric shear wall [WSW]
3. building frame with shear wall parallel to X dir.
[WSHLLX]
4. building frame with shear wall parallel to Y dir
[WSWLLY]
5. Building frame with shear wall at all exterior corners
of building. [WSHEXC]
6. Building frame with shear wall at specified positions.
[WSWSP]
Case 1:- building frame without shear wall [WOSW]
Case 2:- building frame with concentric shear wall [WSH]
Page 9
International Journal of Research and Scientific Innovation (IJRSI) | Volume IV, Issue X, October 2017 | ISSN 2321–2705
www.rsisinternational.org Page 69
Case 3:- building frame with shear wall parallel to X dir. [WSHLLX]
Case 4:- building frame with shear wall parallel to Y dir [WSWLLY]
Page 10
International Journal of Research and Scientific Innovation (IJRSI) | Volume IV, Issue X, October 2017 | ISSN 2321–2705
www.rsisinternational.org Page 70
Case 5:- building frame with shear wall at all exterior corners of building. [WSHEXC]
Case 6:- building frame with shear wall at specified positions. [WSWSP]
5.3 Structural data
Building consists of 16 m in short direction and 20 m long
direction, so from preliminary design the sizes of various
structural members were estimated as follow
Column size
Columns all around were kept of the same size i.e. 18’’ x 18’’
[450 x 450 mm] to avoid the local eccentricity.
Beam size
All beams are of uniform size of 12’’x 18’’ [300x450mm]
having 7’’[165mm] think slab for all the spans.
Shear wall Thickness
150mm thick, 200mm, 300mm and 400mm thick shear wall
for all storey are provided for different cases.
Storey height is kept as 3.5 for all floors .Grade Fe- 500 hot
rolled deformed steel is recommended to be used. Concrete
having M-40 strength for columns, beams and slabs is to be
employed.
5.4 Gravity loading
Gravity loading consists of dead and live loading. Dead
loading can be predicted reasonable accurately from the
designed member sizes and material densities. Dead load due
to structural self weights and superimposed dead loads are as
follows:
Page 11
International Journal of Research and Scientific Innovation (IJRSI) | Volume IV, Issue X, October 2017 | ISSN 2321–2705
www.rsisinternational.org Page 71
Slab dead load= 4.5 KN/m2
Imposed dead load for typical floors= 4 KN/m2
5.6 Lateral loading
Lateral loading consists of earthquake loading. Earthquake
loading has been calculated by the program and it has been
applied to the mass center of the building.
Since the building under consideration was in zone – V with
standard occupancy so the total base shear was computed as
follows.
Case EQX and EQY
Period calculation: program calculated
Top storey-11
Bottom storey-base
R=5
I=1
Building height H= 42.5m above gr.
Soil type= II
Z= 0.16
5.7 Closure
Detailed structural analysis detailing and procedure is given in
this chapter.
VI. RESULTS AND DISCUSSION
6.1 Results Obtained Using Response Spectrum Method
Torsion, base shear, maximum displacement, and maximum
drift results for the 11-storey structure are obtained on five
different cases. Different thickness of shear wall 150mm,
200mm, 300mm and 400mm are used to calculate torsional
effect on structure. Relative torsional values of structure
having above conditions are compared with a structure
without shear wall.
Many times merely providing shear wall in structure didn’t
solve problem. Proving shear wall at eccentric position can
increase force and torsion on structure. This can lead to
uneconomical structure. Five different cases of shear wall
position for 11 storey building have been analysed as a space
frame system using ETABS.
There are different cases considered to analyze 11-storey
structure so that proper position of shear wall can be
predicted.
1. Building frame without shear wall [WOSW]
2. Building frame with concentric shear wall [WSW]
3. Building frame with shear wall parallel to X dir.
[WSHLLX]
4. Building frame with shear wall parallel to Y dir
[WSWLLY]
5. Building frame with shear wall at all exterior corners
of building. [WSHEXC]
6. Building frame with shear wall at specified positions.
[WSWSP]
All these cases will be analysed for various thicknesses
i.e.150mm, 200mm, 300mm, 400mm
Keeping length of shear wall in each case same i.e.42.5m
Case1:- building frame without shear wall [WOSW]
TABLE A: Storey Forces due to
EQX
Storey base shear Torsion
kN kN-m
TERRACE 180.9147 -1746.1583
XI 348.9322 -3365.7295
X 490.1136 -4726.6192
IX 606.7924 -5851.3214
VIII 701.3023 -6762.3302
VII 775.9767 -7482.1396
VI 833.1493 -8033.2437
V 875.1537 -8438.1365
IV 904.3234 -8719.312
III 922.992 -8899.2644
II 933.4931 -9000.4876
I 938.1603 -9045.4757
GR 938.6687 -9050.3416
Graph-A Base shear due to EQX (WOSW)
Graph-B Torsion due to EQX (WOSW)
Above table and graph shows base shear and torsion due to
EQX for structure without shear wall. These results will be
compared with all the cases of shear wall positions and
variable thickness.
0
200
400
600
800
1000
Bas
e s
he
ar
Storey
base shear kN
-10000
-8000
-6000
-4000
-2000
0
Tors
ion
Storey
Torsion kN-m
Page 12
International Journal of Research and Scientific Innovation (IJRSI) | Volume IV, Issue X, October 2017 | ISSN 2321–2705
www.rsisinternational.org Page 72
TABLE B: Storey Forces Due to EQY
Storey base shear Torsion
kN kN-m
T 180.9147 1546.876
11TH 348.9322 2982.78
10TH 490.1136 4189.337
9TH 606.7924 5186.493
8TH 701.3023 5994.188
7TH 775.9767 6632.367
6TH 833.1493 7120.973
5TH 875.1537 7479.949
4TH 904.3234 7729.238
3RD 922.992 7888.783
2ND 933.4931 7978.527
1ST 938.1603 8018.413
GR 938.6687 8022.814
Graph-C Base shear due to EQY (WOSW)
Graph-D torsion due to EQY (WOSW)
Above table and graph shows base shear and torsion due to
EQY for structure without shear wall. These results will be
compared with all the cases of shear wall positions and
variable thickness.
6.2 Tables and graphs for variable thickness
Case 2:- building frame with concentric shear wall [wsw]
Table1- for base shear due to EQX (WSW)
Storey 150mm 200mm 300mm 400mm
kN kN kN kN
TERRACE 126.3232 128.6768 133.3839 138.0907
11TH 240.1478 244.6593 253.6821 262.7048
10TH 335.792 342.1167 354.766 367.4152
9TH 414.8368 422.6601 438.3065 453.9528
8TH 478.8631 487.9002 505.9742 524.0482
7TH 529.4518 539.4479 559.4401 579.4323
6TH 568.1837 578.9141 600.3749 621.8357
5TH 596.6399 607.9098 630.4495 652.9892
4TH 616.4011 628.0456 651.3346 674.6236
3RD 629.0482 640.9325 664.7011 688.4696
2ND 636.1623 648.1814 672.2197 696.258
1ST 639.324 651.4032 675.5613 699.7195
GR 639.6528 651.7465 675.9339 700.1213
Graph-1 Base shear due to EQX (WSW)
Above table n graph shows decrease (25 to 31%) in base shear
by providing concentric shear wall compared to structure
without shear wall, when the force acting in EQX.
Table 2 for torsion due to EQX (WSW)
Storey 150mm 200mm 300mm 400mm
kN-m kN-m kN-m kN-m
TERRACE -1222.06 -1246.023 -1293.96 -1341.9
11TH -2321.86 -2367.7998 -2459.68 -2551.58
10TH -3246.01 -3310.4039 -3439.22 -3568.05
9TH -4009.76 -4089.4156 -4248.75 -4408.11
8TH -4628.4 -4720.415 -4904.47 -5088.55
7TH -5117.2 -5218.9824 -5422.57 -5626.19
6TH -5491.44 -5600.6982 -5819.24 -6037.82
5TH -5766.39 -5881.1423 -6110.67 -6340.24
4TH -5957.33 -6075.8953 -6313.06 -6550.25
3RD -6079.53 -6200.5371 -6442.58 -6684.66
2ND -6148.27 -6270.6482 -6515.44 -6760.27
1ST -6178.82 -6301.8086 -6547.82 -6793.87
GR -6181.98 -6305.1201 -6551.43 -6797.78
0100200300400500600700800900
1000
Bas
e s
he
ar
Storey
base shear kN
0100020003000400050006000700080009000
Tors
ion
Storey
Torsion kN-m
0
100
200
300
400
500
600
700
800
Bas
e s
he
ar
Storey
150mm kN200mm kN300mm kN400mm kN
Page 13
International Journal of Research and Scientific Innovation (IJRSI) | Volume IV, Issue X, October 2017 | ISSN 2321–2705
www.rsisinternational.org Page 73
Graph- 2 Torsion due to EQX (WSW)
Above table n graph shows decrease (33to 42%) in torsion by
providing concentric shear wall compared to structure without
shear wall, when the force acting in EQX.
TABLE3: base shear due to EQY (WSW)
Storey
150
kN
200
kN
300
kN
400
kN
TERRACE 126.3232 128.6768 133.3839 138.0907
11TH 240.1478 244.6593 253.6821 262.7048
10TH 335.792 342.1167 354.766 367.4152
9TH 414.8368 422.6601 438.3065 453.9528
8TH 478.8631 487.9002 505.9742 524.0482
7TH 529.4518 539.4479 559.4401 579.4323
6TH 568.1837 578.9142 600.3749 621.8357
5TH 596.6399 607.9098 630.4495 652.9892
4TH 616.4011 628.0456 651.3346 674.6236
3RD 629.0482 640.9325 664.7011 688.4696
2ND 636.1623 648.1814 672.2197 696.258
1ST 639.3241 651.4032 675.5613 699.7195
GR 639.6528 651.7465 675.9339 700.1213
Graph- 3 Base shear due to EQY (WSW)
Above table n graph shows decrease (25 to 32%) in base shear
by providing concentric shear wall compared to structure
without shear wall, when the force acting in EQX.
TABLE4: for torsion due to EQY (WSW)
Storey 150 200 300 400
kN-m kN-m kN-m kN-m
TERRACE 1076.1653 1090.562 1119.327 1148.055
11TH 2047.5053 2075.099 2130.232 2185.298
10TH 2863.7008 2902.384 2979.673 3056.869
9TH 3538.2425 3586.09 3681.69 3777.176
8TH 4084.6213 4139.892 4250.324 4360.625
7TH 4516.328 4577.464 4699.616 4821.622
6TH 4846.8534 4912.48 5043.604 5174.572
5TH 5089.6884 5158.614 5296.33 5433.883
4TH 5258.3238 5329.54 5471.835 5613.959
3RD 5366.2505 5438.933 5584.157 5729.208
2ND 5426.9593 5500.467 5647.339 5794.036
1ST 5453.9409 5527.815 5675.42 5822.848
GR 5456.7798 5530.742 5678.523 5826.129
Graph- 4 torsion due to EQY (WSW)
Above table n graph shows decrease (27 to 33%) in torsion by
providing concentric shear wall compared to structure without
shear wall, when the force acting in EQX.
Table5- Base shear due to EQX (WSHLLX)
Storey 150 200 300 400
kN kn kN kN
T 124.5566 126.8944 131.5698 136.2449
11TH 236.2906 240.7713 249.7324 258.6934
10TH 330.1782 336.4595 349.0219 361.5842
9TH 407.7712 415.5407 431.0792 446.6179
8TH 470.6216 479.5965 497.5457 515.4952
7TH 520.2812 530.2085 550.0624 569.9167
6TH 558.3018 568.9583 590.2705 611.5832
5TH 586.2354 597.4276 619.8112 642.1954
4TH 605.6337 617.1979 640.3255 663.4538
3RD 618.0486 629.8509 653.4547 677.0592
2ND 625.032 636.9683 660.8399 684.7122
1ST 628.1357 640.1315 664.1222 688.1136
GR 628.4506 640.4609 664.4805 688.5009
-8000
-7000
-6000
-5000
-4000
-3000
-2000
-1000
0
Tors
ion
Storey
Torsion ( kN.m) 150mmTorsion ( kN.m) 200mmTorsion ( kN.m) 300mmTorsion ( kN.m) 400mm
0
100
200
300
400
500
600
700
800
Bas
e s
he
ar
Storey
150 kN
200 kN
300 kN
400 kN
0
1000
2000
3000
4000
5000
6000
7000
Tors
ion
Storey
150 kN-m
200 kN-m
300 kN-m
400 kN-m
Page 14
International Journal of Research and Scientific Innovation (IJRSI) | Volume IV, Issue X, October 2017 | ISSN 2321–2705
www.rsisinternational.org Page 74
Graph-5 Base shear due to EQX (WSHLLX)
Above table n graph shows decrease (26 to 33%) in base shear
by providing shear wall parallel to X compared to structure
without shear wall, when the force acting in EQX.
TABLE6: for torsion due to EQX (WSHLLX)
Storey 150 200 300 400
kN-m kN-m kN-m kN-m
T -1206.44 -1234.23 -1289.84 -1345.49
11TH -2284.42 -2337.69 -2444.29 -2550.94
10TH -3190.23 -3264.91 -3414.34 -3563.86
9TH -3938.83 -4031.2 -4216.04 -4400.99
8TH -4545.19 -4651.9 -4865.42 -5079.06
7TH -5024.3 -5142.33 -5378.5 -5614.82
6TH -5391.11 -5517.82 -5771.33 -6025.01
5TH -5660.61 -5793.68 -6059.95 -6326.37
4TH -5847.76 -5985.26 -6260.37 -6535.65
3RD -5967.54 -6107.86 -6388.64 -6669.59
2ND -6034.91 -6176.83 -6460.8 -6744.93
1ST -6064.86 -6207.48 -6492.86 -6778.42
GR -6067.87 -6210.67 -6496.4 -6782.3
Graph- 6 Torsion due to EQX (WSHLLX)
Above table n graph shows decrease (25 to 32%) in torsion by
providing shear wall parallel to X compared to structure
without shear wall, when the force acting in EQX.
TABLE7: Base shear due to EQY(WSHLLX)
Storey 150 200 300 400
kN kN kN kN
TERRACE 124.5565 126.8943 131.5697 136.2449
11TH 236.2903 240.771 249.7323 258.6934
10TH 330.1777 336.4591 349.0217 361.5842
9TH 407.7706 415.5401 431.0791 446.6179
8TH 470.6209 479.5958 497.5456 515.4951
7TH 520.2804 530.2077 550.0623 569.9167
6TH 558.3009 568.9574 590.2704 611.5832
5TH 586.2343 597.4266 619.811 642.1954
4TH 605.6326 617.1968 640.3254 663.4538
3RD 618.0474 629.8498 653.4546 677.0592
2ND 625.0308 636.9671 660.8397 684.7122
1ST 628.1345 640.1303 664.122 688.1136
GR 628.4494 640.4597 664.4803 688.5009
Graph 7 Base shear due to EQY (WSHLLX)
Above table n graph shows decrease (26 to 33%) in base shear
by providing shear wall parallel to X compared to structure
without shear wall, when the force acting in EQY.
TABLE8 : Torsion due to EQY (WSHLLX)
Storey 150 200 300 400
kN-m kN-m kN-m kN-m
TERRACE 1069.808 1093.028 1139.483 1185.955
11TH 2027.058 2071.564 2160.604 2249.681
10TH 2831.414 2893.805 3018.63 3143.506
9TH 3496.17 3573.343 3727.742 3882.205
8TH 4034.623 4123.769 4302.123 4480.551
7TH 4460.068 4558.674 4755.954 4953.318
6TH 4785.799 4891.647 5103.419 5315.28
5TH 5025.111 5136.281 5358.7 5581.212
4TH 5191.3 5306.166 5535.978 5765.886
3RD 5297.661 5414.892 5649.435 5884.078
2ND 5357.489 5476.05 5713.256 5950.561
1ST 5384.08 5503.232 5741.62 5980.109
GR 5386.826 5506.122 5744.8 5983.578
0
100
200
300
400
500
600
700
800B
ase
sh
ear
Storey
150 kN200 kn300 kN400 kN
-8000
-7000
-6000
-5000
-4000
-3000
-2000
-1000
0
Tors
ion
Storey
150 kN-m200 kN-m300 kN-m400 kN-m
0
100
200
300
400
500
600
700
800
Bas
e s
he
ar
Storey
150 kN
200 kN
300 kN
400 kN
Page 15
International Journal of Research and Scientific Innovation (IJRSI) | Volume IV, Issue X, October 2017 | ISSN 2321–2705
www.rsisinternational.org Page 75
Graph 8 Torsion due to EQY (WSHLLX)
Above table n graph shows decrease (25 to 30%) in base shear
by providing shear wall parallel to X compared to structure
without shear wall, when the force acting in EQY.
Graph 9 Base shear due to EQX (WSHLLY)
Above table n graph shows decrease (27 to 34%) in base shear
by shear wall parallel to Y compared to structure without
shear wall, when the force acting in EQX.
TABLE10: Torsion due to EQX (WSHLLY)
Storey 150 200 300 400
kN-m kN-m kN-m kN-m
T -1174.59 -1193.6 -1231.62 -1269.6
11TH -2232.9 -2269.35 -2342.21 -2414.97
10TH -3122.16 -3173.27 -3275.41 -3377.4
9TH -3857.09 -3920.32 -4046.65 -4172.79
8TH -4452.39 -4525.43 -4671.35 -4817.06
7TH -4922.75 -5003.54 -5164.94 -5326.11
6TH -5282.86 -5369.59 -5542.85 -5715.85
5TH -5547.44 -5638.53 -5820.49 -6002.19
4TH -5731.17 -5825.29 -6013.3 -6201.03
3RD -5848.76 -5944.82 -6136.7 -6328.29
2ND -5914.91 -6012.06 -6206.11 -6399.88
1ST -5944.3 -6041.94 -6236.96 -6431.69
GR -5947.19 -6044.94 -6240.19 -6435.16
Graph 10: torsion due to EQX (WSHLLY)
Above table n graph shows decrease (28 to 34%) in base shear
by providing shear wall parallel to Y compared to structure
without shear wall, when the force acting in EQX.
TABLE11: base shear due to EQY(WSHLLY)
Storey 150 200 300 400
kN kN kN kN
TERRACE 122.4988 124.8532 129.6093 134.3147
11TH 232.7661 237.3296 246.3984 255.3322
10TH 325.4193 331.8447 344.5371 357.0144
9TH 401.9904 409.96 425.6468 441.0433
8TH 464.0112 473.2366 491.3485 509.1013
7TH 513.0137 523.2362 543.264 562.8704
6TH 550.5297 561.52 583.0143 604.0325
5TH 578.0911 589.6496 612.2212 634.2695
4TH 597.2297 609.1866 632.5059 655.2631
3RD 609.4771 621.6927 645.4904 668.6953
2ND 616.3652 628.7295 652.7961 676.2473
1ST 619.4256 631.8588 656.0448 679.601
GR 619.7305 632.1783 656.3934 679.9788
0
1000
2000
3000
4000
5000
6000
7000To
rsio
n
Storey
150 kN-m
200 kN-m
300 kN-m
0
100
200
300
400
500
600
700
800
Bas
e s
he
ar
Storey
150 kN
200 kN
300 kN
400 kN
-7000
-6000
-5000
-4000
-3000
-2000
-1000
0
Tors
ion
Storey
150 kN-m200 kN-m300 kN-m400 kN-m
TABLE9: base shear due to EQX (WSHLLY)
Storey 150 200 300 400
kN kN kN kN
T 122.5168 124.8706 129.5779 134.2849
11TH 232.8016 237.3132 246.3363 255.3592
10TH 325.4714 331.7962 344.4458 357.0952
9TH 402.058 409.8814 425.5281 441.1745
8TH 464.0932 473.1304 491.2047 509.2788
7TH 513.1087 523.1049 543.0974 563.0896
6TH 550.6361 561.3666 582.8277 604.2885
5TH 578.2073 589.4772 612.0173 634.5571
4TH 597.354 608.9985 632.2879 655.5769
3RD 609.6078 621.4921 645.2611 669.0296
2ND 616.5006 628.5198 652.5585 676.5968
1ST 619.5641 631.6432 655.8018 679.9599
GR 619.869 631.9627 656.1504 680.3378
Page 16
International Journal of Research and Scientific Innovation (IJRSI) | Volume IV, Issue X, October 2017 | ISSN 2321–2705
www.rsisinternational.org Page 76
Graph 11 Base shear due to EQY (WSHLLY)
Above table n graph shows decrease (27 to 34%) in base shear
by providing shear wall parallel to Y compared to structure
without shear wall, when the force acting in EQY.
TABLE12: Torsion due to EQY (WSHLLY)
Storey 150 200 300 400
kN-m kN-m kN-m kN-m
TERRACE 1028.775 1038.695 1058.899 1078.566
11TH 1959.909 1979.347 2017.635 2054.58
10TH 2742.304 2769.786 2823.27 2874.646
9TH 3388.894 3423.072 3489.114 3552.334
8TH 3912.619 3952.262 4028.473 4101.212
7TH 4326.412 4370.414 4454.659 4534.848
6TH 4643.209 4690.586 4780.981 4866.807
5TH 4875.946 4925.838 5020.751 5110.655
4TH 5037.558 5089.229 5187.277 5279.955
3RD 5140.979 5193.819 5293.874 5388.274
2ND 5199.144 5252.67 5353.853 5449.172
1ST 5224.987 5278.841 5380.525 5476.212
GR 5227.554 5281.467 5383.27 5479.077
Graph 12 Torsion due to EQY (WSHLLY)
Above table n graph shows decrease (31 to 34%) in base shear
by providing shear wall parallel to Y compared to structure
without shear wall, when the force acting in EQY.
Table13: Base shear due to EQX (WSHEXC)
Storey 150 200 300 400
kN kN kN kN
T 120.1008 127.1615 127.1615 131.848
11TH 228.3232 241.838 241.838 250.8794
10TH 319.2607 338.1969 338.1969 350.9009
9TH 394.4162 417.8313 417.8313 433.5656
8TH 455.2927 482.3342 482.3342 500.5257
7TH 503.3931 533.2985 533.2985 553.4343
6TH 540.2204 572.3173 572.3173 593.9439
5TH 567.2775 600.9834 600.9834 623.7074
4TH 586.0676 620.8898 620.8898 644.3775
3RD 598.0935 633.6295 633.6295 657.6074
2ND 604.8583 640.7951 640.7951 665.0498
1ST 607.865 643.9796 643.9796 668.358
GR 608.1559 644.3141 644.3141 668.7218
Graph 13 Base shear due to EQX (WSHEXC)
Above table n graph shows decrease (28 to 35%) in base shear
by providing shear wall at the exterior corners compared to
structure without shear wall, when the force acting in EQX.
Table14 : torsion due to EQX (WSHEXC)
Storey 150 200 300 400
kN-m kN-m kN-m kN-m
T -1155.29 -1212.8 -1212.8 -1250.87
11TH -2197.14 -2307.14 -2307.14 -2380.78
10TH -3072.59 -3226.68 -3226.68 -3330.25
9TH -3796.1 -3986.62 -3986.62 -4114.95
8TH -4382.16 -4602.16 -4602.16 -4750.58
7TH -4845.22 -5088.5 -5088.5 -5252.82
6TH -5199.75 -5460.85 -5460.85 -5637.37
5TH -5460.23 -5734.41 -5734.41 -5919.9
4TH -5641.12 -5924.37 -5924.37 -6116.11
3RD -5756.89 -6045.95 -6045.95 -6241.7
2ND -5822.02 -6114.33 -6114.33 -6312.35
1ST -5850.96 -6144.72 -6144.72 -6343.75
GR -5853.73 -6147.84 -6147.84 -6347.11
0
100
200
300
400
500
600
700
800B
ase
sh
ear
Storey
150 kN
200 kN
300 kN
400 kN
0
1000
2000
3000
4000
5000
6000
Tors
ion
Storey
150 kN-m
200 kN-m
300 kN-m
0
100
200
300
400
500
600
700
800
Bas
e s
he
ar
Storey
150 kN200 kN300 kN400 kN
Page 17
International Journal of Research and Scientific Innovation (IJRSI) | Volume IV, Issue X, October 2017 | ISSN 2321–2705
www.rsisinternational.org Page 77
Graph 14 Torsion due to EQX (WSHEXC)
Above table n graph shows decrease (29 to 35%) in base shear
by providing shear wall at the exterior corners compared to
structure without shear wall, when the force acting in EQX.
Table15 : Base shear due to EQY (WSHEXC)
Storey 150 200 300 400
kN kN kN kN
TERRACE 120.0989 127.1592 127.1592 131.8533
11TH 228.3196 241.8399 241.8399 250.8751
10TH 319.2557 338.2025 338.2025 350.8886
9TH 394.41 417.84 417.84 433.5462
8TH 455.2854 482.3455 482.3455 500.5006
7TH 503.385 533.3119 533.3119 553.4043
6TH 540.2116 572.3324 572.3324 593.9102
5TH 567.2683 600.9998 600.9998 623.6709
4TH 586.058 620.9071 620.9071 644.339
3RD 598.0837 633.6473 633.6473 657.5676
2ND 604.8484 640.8133 640.8133 665.0093
1ST 607.8551 643.998 643.998 668.3171
GR 608.1459 644.3325 644.3325 668.6809
Graph 15: Base shear due to EQY (WSHEXC)
Above table n graph shows decrease (28 to 35%) in base shear
by providing shear wall at the exterior corners compared to
structure without shear wall, when the force acting in EQY.
Table16 : Torsion due to EQY (WSHEXC)
Storey 150 200 300 400
kN-m kN-m kN-m kN-m
TERRACE 1018.503 1085.42 1085.42 1129.994
11TH 1935.26 2063.465 2063.465 2149.101
10TH 2705.595 2885.285 2885.285 3005.451
9TH 3342.24 3564.467 3564.467 3713.194
8TH 3857.926 4114.596 4114.596 4286.479
7TH 4265.386 4549.26 4549.26 4739.459
6TH 4577.351 4882.042 4882.042 5086.284
5TH 4806.553 5126.529 5126.529 5341.105
4TH 4965.725 5296.307 5296.307 5518.074
3RD 5067.597 5404.96 5404.96 5631.342
2ND 5124.902 5466.074 5466.074 5695.062
1ST 5150.373 5493.233 5493.233 5723.386
GR 5152.841 5496.117 5496.117 5726.547
Graph 16: Torsion due to EQY (WSHEXC)
Above table n graph shows decrease (28 to 35%) in base shear
by providing shear wall at the exterior corners compared to
structure without shear wall, when the force acting in EQY.
Table17 : Base shear due to EQX (wshsp)
Storey 150 200 300 400
kN kN kN kN
T 122.5021 124.8557 129.5631 134.3142
11TH 232.7729 237.2842 246.349 255.4167
10TH 325.4298 331.754 344.4842 357.1785
9TH 402.0045 409.8271 425.5898 441.2815
8TH 464.0289 473.0652 491.2875 509.4068
7TH 513.0349 523.0301 543.1985 563.2359
6TH 550.5541 561.2835 582.9445 604.4504
5TH 578.1184 589.3873 612.1472 634.7319
4TH 597.2596 608.9031 632.4281 655.7619
3RD 609.5093 621.3925 645.409 669.2222
2ND 616.3992 628.4172 652.7116 676.7944
1ST 619.461 631.539 655.958 680.1605
GR 619.7659 631.8584 656.3066 680.5383
-7000
-6000
-5000
-4000
-3000
-2000
-1000
0
Tors
ion
Storey
150 kN-m
200 kN-m
300 kN-m
400 kN-m
0
100
200
300
400
500
600
700
800
Bas
e s
he
ar
Storey
150 kN
200 kN
300 kN
400 kN
0
1000
2000
3000
4000
5000
6000
7000
Tors
ion
Storey
150 kN-m
200 kN-m
300 kN-m
400 kN-m
Page 18
International Journal of Research and Scientific Innovation (IJRSI) | Volume IV, Issue X, October 2017 | ISSN 2321–2705
www.rsisinternational.org Page 78
Graph 17: Base shear due to EQX (WSHSP)
Above table n graph shows decrease (27 to 34%) in base shear
by providing shear wall in both the direction compared to
structure without shear wall, when the force acting in EQX.
Table18 : Torsion due to EQX (WSHSP)
Storey 150 200 300 400
kN-m kN-m kN-m kN-m
T -1177.44 -1196.44 -1234.43 -1272.83
11TH -2238.16 -2274.58 -2347.8 -2421.1
10TH -3129.44 -3180.5 -3283.37 -3385.99
9TH -3866.02 -3929.18 -4056.59 -4183.44
8TH -4462.64 -4535.6 -4682.91 -4829.39
7TH -4934.04 -5014.74 -5177.81 -5339.79
6TH -5294.94 -5381.57 -5556.73 -5730.59
5TH -5560.08 -5651.07 -5835.14 -6017.71
4TH -5744.2 -5838.21 -6028.5 -6217.12
3RD -5862.03 -5957.97 -6152.26 -6344.75
2ND -5928.3 -6025.33 -6221.88 -6416.55
1ST -5957.75 -6055.27 -6252.84 -6448.46
GR -5960.65 -6058.28 -6256.09 -6451.95
Graph 18: Torsion due to EQX (WSHSP)
Above table n graph shows decrease (28 to 34%) in base shear
by providing shear wall in both the direction compared to
structure without shear wall, when the force acting in EQX.
Table19 : Base shear due to EQY (WSHSP)
Storey 150 200 300 400
kN kN kN kN
TERRACE 122.5221 124.8758 129.569 134.2772
11TH 232.8121 237.3234 246.3189 255.3666
10TH 325.4868 331.8111 344.4203 357.1171
9TH 402.078 409.9006 425.4949 441.2101
8TH 464.1174 473.1536 491.1646 509.3268
7TH 513.1365 523.1317 543.0508 563.1489
6TH 550.6672 561.3965 582.7756 604.3577
5TH 578.2412 589.5098 611.9605 634.6346
4TH 597.39 609.0333 632.2273 655.6613
3RD 609.6456 621.5285 645.1975 669.1192
2ND 616.5396 628.5573 652.4929 676.69
1ST 619.6038 631.6814 655.7349 680.0552
GR 619.9087 632.0009 656.0836 680.4331
Graph 19: Base shear due to EQY (WSHSP)
Above table n graph shows decrease (27 to 34%) in base shear
by providing shear wall in both the direction compared to
structure without shear wall, when the force acting in EQY.
Table20 : Torsion due to EQY (WSHSP)
Storey 150 200 300 400
kN-m kN-m kN-m kN-m
TERRACE 1044.279 1070.335 1122.378 1174.464
11TH 1981.479 2031.429 2131.09 2231.225
10TH 2768.994 2839.023 2978.675 3119.209
9TH 3419.839 3506.462 3679.145 3853.089
8TH 3947.029 4047.093 4246.516 4447.541
7TH 4363.58 4474.264 4694.797 4917.239
6TH 4682.506 4801.321 5038.003 5276.858
5TH 4916.825 5041.614 5290.145 5541.074
4TH 5079.55 5208.488 5465.235 5724.562
3RD 5183.699 5315.291 5577.285 5841.997
2ND 5242.286 5375.372 5640.306 5908.057
1ST 5268.328 5402.077 5668.309 5937.418
GR 5270.935 5404.847 5671.404 5940.839
0
100
200
300
400
500
600
700
800B
ase
sh
ear
Storey
150 kN200 kN300 kN400 kN
-7000
-6000
-5000
-4000
-3000
-2000
-1000
0
tors
ion
storey
150 kN-m
200 kN-m
300 kN-m
400 kN-m
0
100
200
300
400
500
600
700
800
Bas
e s
he
ar
Storey
150 kN200 kN300 kN400 kN
Page 19
International Journal of Research and Scientific Innovation (IJRSI) | Volume IV, Issue X, October 2017 | ISSN 2321–2705
www.rsisinternational.org Page 79
Graph 20: Torsion due to EQY (WSHSP)
Above table n graph shows decrease (25 to 34%) in base shear by providing shear wall in both the direction compared to structure
without shear wall, when the force acting in EQY.
TABLE21: Storey drift EQX (150mm THK)
Storey exc150 wsw150 llX150 llY150 sp150 wosw
T 0.000577 0.000454 0.000481 0.000429 0.000636 0.000663
11TH 0.000654 0.000515 0.000678 0.00046 0.000689 0.000903
10TH 0.000737 0.0006 0.000851 0.000498 0.000749 0.001115
9TH 0.000809 0.000675 0.000991 0.000534 0.000848 0.001288
8TH 0.000865 0.000737 0.001101 0.000563 0.000925 0.001422
7TH 0.000903 0.000782 0.001183 0.000582 0.000981 0.00152
6TH 0.000923 0.00081 0.001239 0.000589 0.001015 0.001586
5TH 0.000924 0.000821 0.001272 0.000583 0.001031 0.001623
4TH 0.000908 0.000814 0.001284 0.000562 0.001028 0.001632
3RD 0.000873 0.000786 0.00128 0.000551 0.001007 0.001619
2ND 0.000816 0.000727 0.001269 0.000516 0.000966 0.00159
1ST 0.000733 0.000603 0.001315 0.000451 0.000867 0.001611
GR 0.000425 0.000387 0.001012 0.000252 0.000601 0.00112
Graph 21: Storey Drift due to EQX
0
1000
2000
3000
4000
5000
6000
7000
TER
RA
CE
11
TH1
0TH
9TH
8TH
7TH
6TH
5TH
4TH
3R
D2
ND
1ST GR
Tors
ion
Storey
150 kN-m
200 kN-m
300 kN-m
400 kN-m
0
0.0002
0.0004
0.0006
0.0008
0.001
0.0012
0.0014
0.0016
0.0018
Sto
rey
Dri
ft
Storey
exc150
wsw150
llX150
llY150
sp150
wosw
Page 20
International Journal of Research and Scientific Innovation (IJRSI) | Volume IV, Issue X, October 2017 | ISSN 2321–2705
www.rsisinternational.org Page 80
Above table and graph shows comparison of storey drift for
all cases with 150mm thick shear walls. This shows storey
drift is maximum for structure without shear wall. And
minimum for shear walls parallel to Y direction
VII. CONCLUSION AND RECOMMENDATIONS AND
FUTURE SCOPE
A study has been carried out to determine the optimum
configuration of an eleven storey building by changing shear
walls location. Five different cases of shear wall position for
eleven storey building have been analyzed as a space frame
system using standard package ETABs subjected to lateral
and gravity loading. Four different thickness of shear wall i.e.
150, 200,300 and 400mm are also used in all five cases
keeping length of wall constant in all cases i.e. 42.5m
7.1 Conclusion
This study leads to following results:
Twisting in building is observed to have increasing
trend with enhancement in the eccentricity between
geometrical centroid of building and center of mass.
It is observed that torsional value of structure for
shear wall at lift is much less i.e. 24% for 400mm
and 34% for 150mm for EQX and EQY than a
structure without shear wall.
Base shear for concentric shear wall is less as
compared to building without shear wall in EQX and
EQY (31% for450mm & 25% for 150mm)
There is no significant change in base shear and
torsion when shear walls are kept parallel to Y
direction due to EQX & EQY.
Torsion at top floors is not more affected due to
shear walls parallel to Y direction due to EQX and
EQY. At bottom ground floor torsion is reduced by
16% to 24%.
No significant change in base shear and torsion when
shear walls are provided in X and Y direction.
When shear walls are placed at exterior corners base
shear reduced to 28% to35% for EQX and EQY.
Same with torsion it is reduced by 29% to 35%.
Increasing thickness of shear wall doesn’t give much
strength n resulting in uneconomical design in all
five cases.
Top floor displacement is much less in all cases
compared to without shear wall, but it is less when
shear walls are provided at corners than other places
of shear wall.
Storey drift is maximum for shear wall parallel to Y
direction and minimum in parallel to X direction for
EQX and EQY.
In all shear walls placed at the corners of structure
base shear due to EQX & EQY is minimum, so as
Torsion.
7.2 Recommendation
Considering all above points the optimum benefit
will be in case shear walls provided at all exterior
corners of the building.
Higher thicknesses of shear wall are uneconomical
and effect on torsion and base shear is comparatively
less. So thickness of 150mm and 200mm is more
recommended.
7.3 Future Scope
In the present study analysis of 11-storey building
has been performed using ETABS. The same
exercise can be carried out for more tall buildings.
The effect of the location of the shear walls can also
be studied by shifting these walls symmetrically
towards the center.
Thickness of shear walls throughout the height of
building is constant. Analysis can be performed
considering different thickness in building height.
ACKNOWLEDGEMENT
The ideal way to commence the documentation of this project
would be to extend my profound gratitude to all those who
encouraged and guided me directly or indirectly throughout
the project tenure.
I, with profound sense of gratitude and indebtedness thank my
project guide Mr. Kodag P. B. for his guidance, valuable
suggestions and continuous encouragement, which enabled
me to complete this project successfully.
My special thanks to Dr. S. S. Shastri, Head of the Civil
Engineering Department, for all the facilities provided and his
valuable guidance in successful completion of this work. I am
very thankful to all the faculty members of the department,
especially structural engineering specialization for their
constant encouragement, invaluable advices and inspiration
during the project. I would also like to thank Dr. S. D.
Lokhande, Principal, Sinhgad College of Engineering, Pune
for giving me opportunity.
Last but not the least, I would like to say thank you to my
friends and family for their encouragement during my project,
and also those who helped me directly and indirectly in
preparing this project.
REFERENCES
[1]. Adnan Fadih Ali Albasry ,Prof.P.Banerji, Structure idealization
for Earthquake response of shear wall core system, (1993) [2]. A.Jalali, F.Dashti; Nonlinear behavior of reinforced concrete
shear walls using macroscopic and microscopic models, ,
Engineering Structures 32(2010)2959-2968 [3]. Ashraf, Z.A. Siddiqi and M.A. Javed; Configuration of a multi
storey building subjected to lateral forces Department of Civil
Engineering, University of Engineering and Technology, Lahore ,Pakistan Asian journal of Civil engineering (building and
housing)(2008) 525-57
Page 21
International Journal of Research and Scientific Innovation (IJRSI) | Volume IV, Issue X, October 2017 | ISSN 2321–2705
www.rsisinternational.org Page 81
[4]. Clifford D’souza, Prof. D.N.Buragohain; Earthquake analysis of
three dimensional shear wall-frame assembly on pile foundations
considering soil structure interaction , (,1984) [5]. Ho jung Leea, Mark A. Aschheimb, Daniel Kuchma; Inter-story
drift estimates for low-rise flexible diaphragm structures,
,Engineering Structures 29 (2007) 1375-1397 [6]. H.S.Kim, D.G.Lee; Analysis of shear wall with opening using
super element, Architectural Engineering Sungkyunkwan
University ,25(2003)981-991 [7]. J.L. Humar and S.Yavari; Design of concrete shear wall building
for earthquake induced forces. Department of civil and
Environmental Engineering, Carleton University, Ottawa, Canada, 4th Structural Specialty Conference of the Canadian Society for
Civil Engineering (2002)
[8]. J.Kobaynshi, T.Korenaga, A.Shibata, K.Akino, T.Taira; Effect of small opening on strength and stiffness of shear walls in reactor
building, Nuclear Engineering and Design(1995)17-27
[9]. llker Fatih Kara, Cengiz Dundar; Prediction of deflection of reinforced concrete shear walls, Advances in Engineering
Software 40(2009)777-785
[10]. M.Paknahad, J.Noorzaei, M.S.Jaafar, Waleed A.Thanoon,
Analysis of shear walls structure using optimal membrane triangle
element, Finite Elements in Analysis and Design 43(2007)861-869
[11]. O.A.Pekau, Yuzhu Cui; Progressive collapse simulation of precast panel shear walls during earthquakes, Computers and Structures
84(2006)400-412
[12]. Paulay T.; Earthquake resisting shear walls NEW Zealand Design Trends, Journal ACI, (1980, No.3)
[13]. R.K.L.Su, S.M.Wong; Seismic behavior of slender reinforced
concrete shear walls under high axial load ratio, The University of Hong Kong ,29 (2007) 1957-1965
[14]. Saher Raffat Ibrahim EI-khoriby, Prof.P.Banerji,(Structure–
foundation interaction in coupled shear wall subjected to earthquake ground motion , 1992)
[15]. S.A.Meftah, R.Yeghnem, A.Tounsi, E.A.Adda bedia; Seismic
behavior of RC coupled shear walls repaired with CFRP laminates
having variable fibers spacing , Construction and Building Materials 21(2007)1661-1671
[16]. S.A.Meftah, A.Tounsi, A.Megueni, E.A.Adda Bedia; Lateral
stiffness and vibration characteristics of RC shear walls bonded with thin composite plates, Composite Structure 73(2006)110-119
[17]. Sachin G. Maske, Dr. P. S. Pajgade; Torsional Behavior of
asymmetrical Buildings, International Journal of Modern
Engineering Research (IJMER) Vol.3, Issue.2, March-April. 2013 pp-1146-1149
[18]. S Edward D.Thomsona, Maria E.Perdomob, Ricardo Picon, Maria E.Maranteb, Julio Florez-Lopez; Simplified model for damage in
squat RC shear walls, Engineering Structures 31 (2009) 2215-
2223 [19]. S.S.AI-Mosawi, M.P.Saka, Optimum design of single core shear
walls, Computers and Structures 71(1999)143-162
[20]. Sid Ahmed Mehtaf, Abdelouahed Tounsi, Adda Bedia Ei Abbas; A simplified approach for seismic calculation of a tall building
braced by shear walls and thin-walled open section structures,
Engineering Structures 29 (2007) 2576-2585
[21]. S.S.Badiet, D.C.Salmon and A.W.Beshara; Analysis of shear walls
structures on elastic foundation , Computer & Structures
Vol.65.No.2 (1995) [22]. Y.F. Rashed; Analysis of building shear walls using boundary
elements, Engineering analysis with Boundary Elements
24(2000)287-293 [23]. Youssef Belmouden, Pierino Lestuzzi; Analytical model for
predicting nonlinear reversed cyclic behavior of reinforced
concrete structure walls, Engineering Structures 29(2007)1263-1276
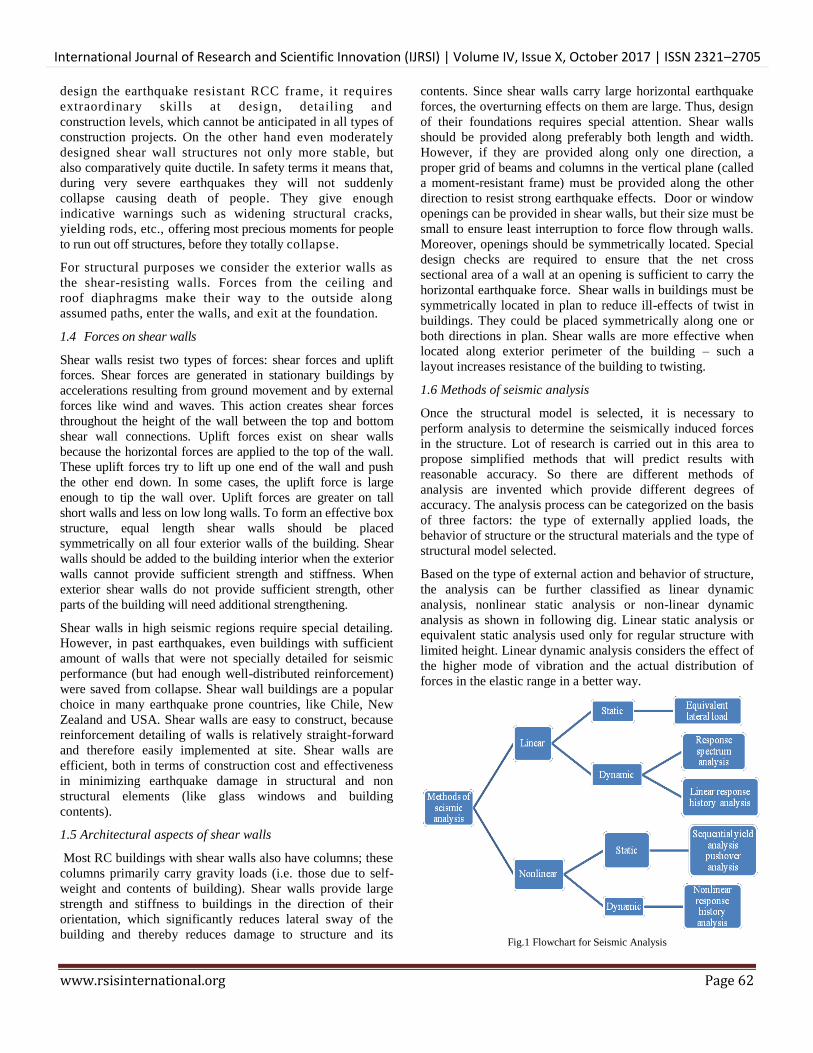


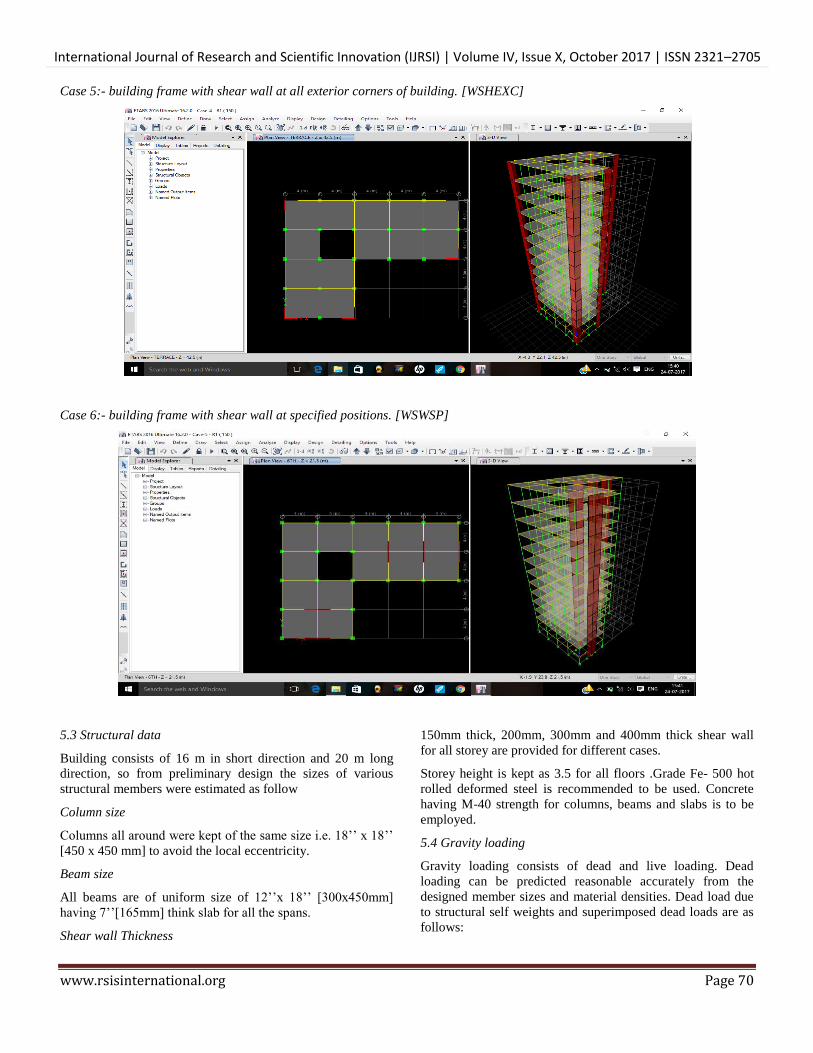


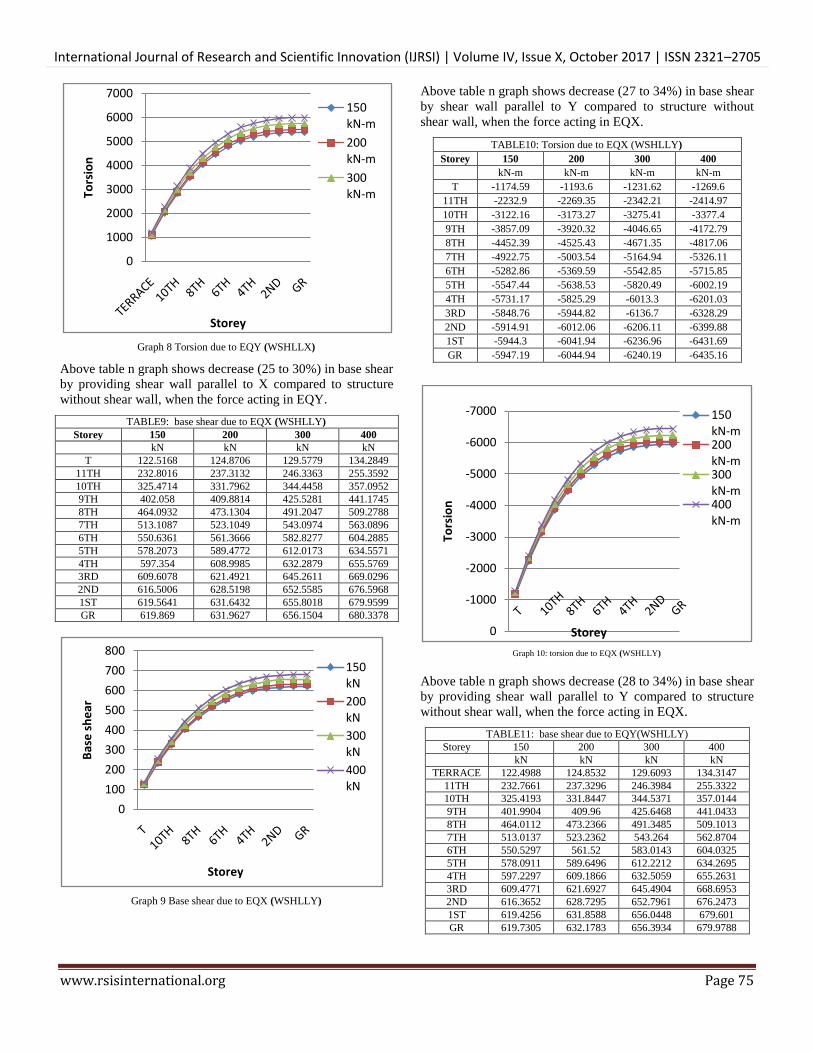
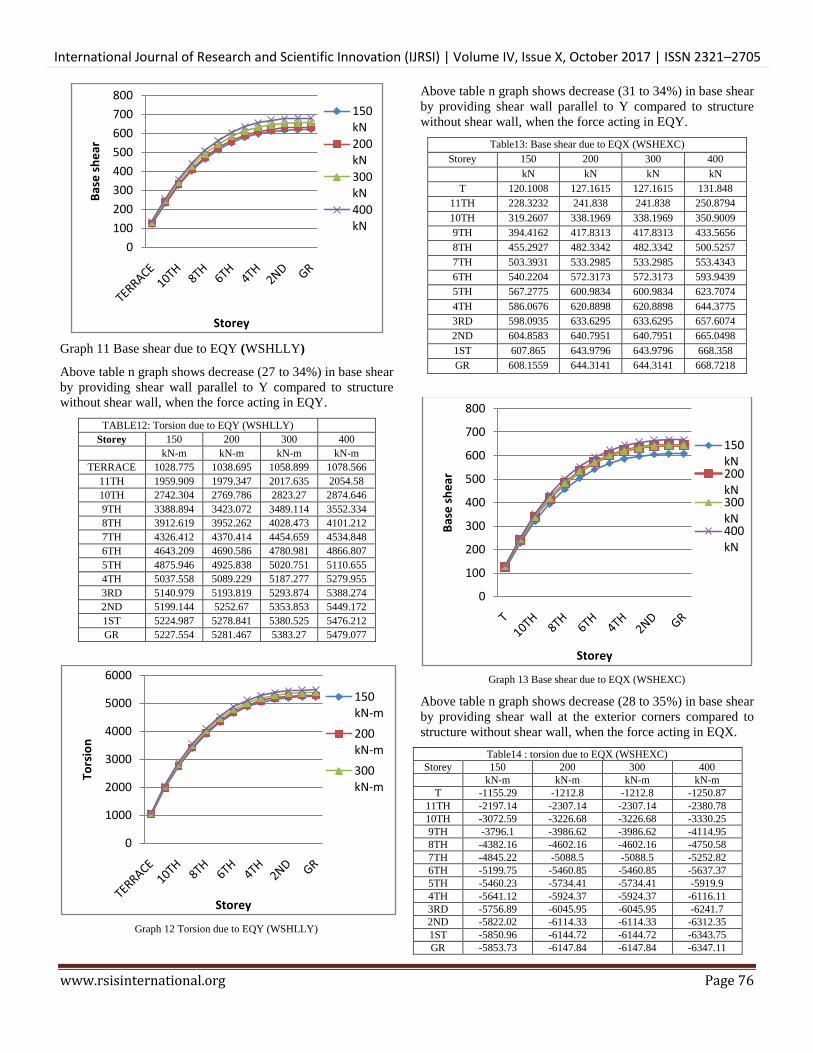
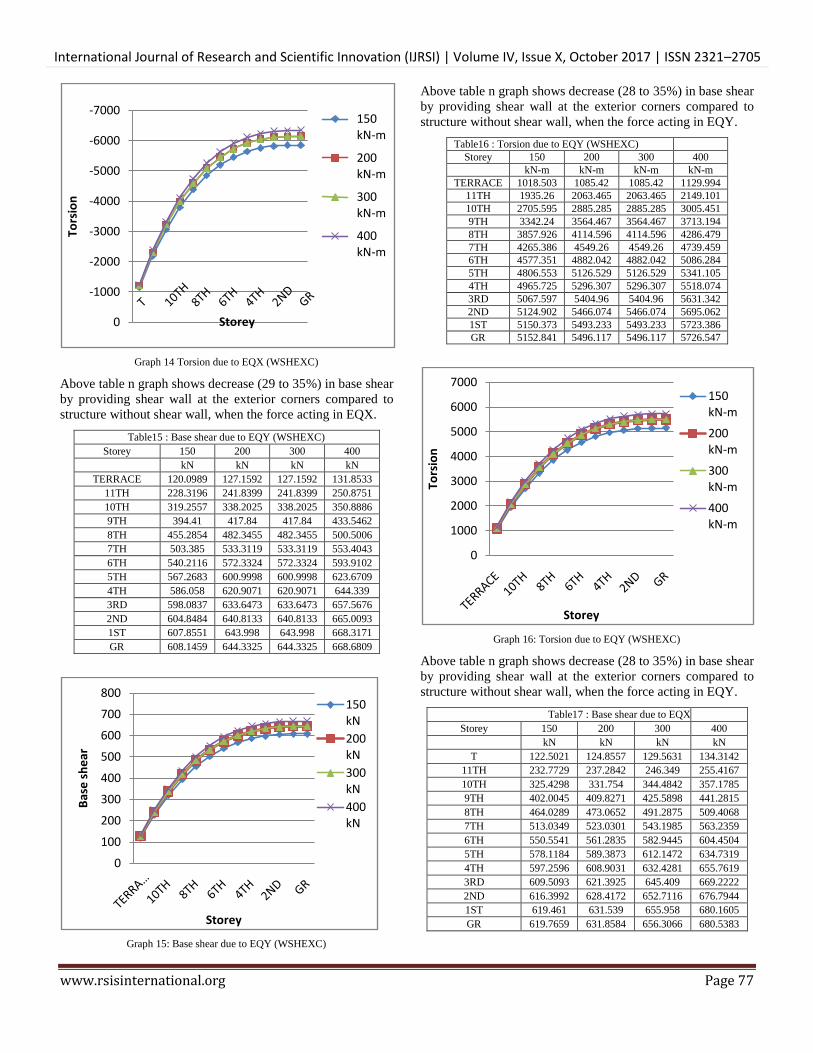
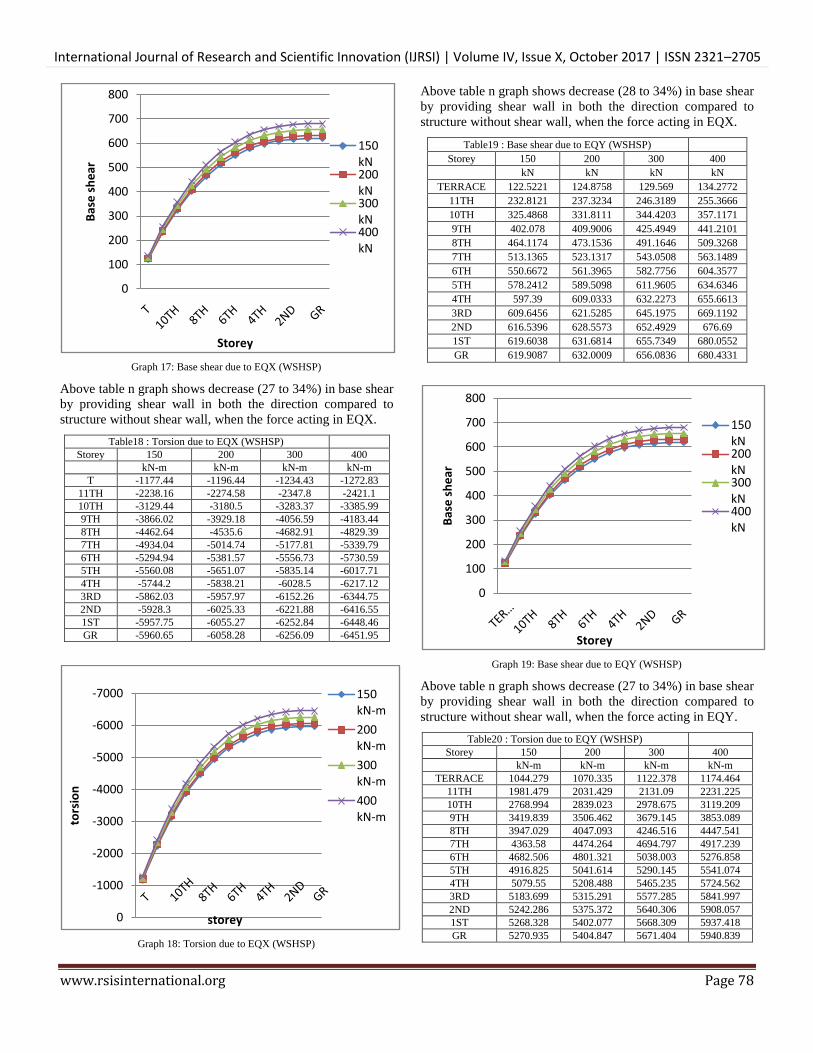
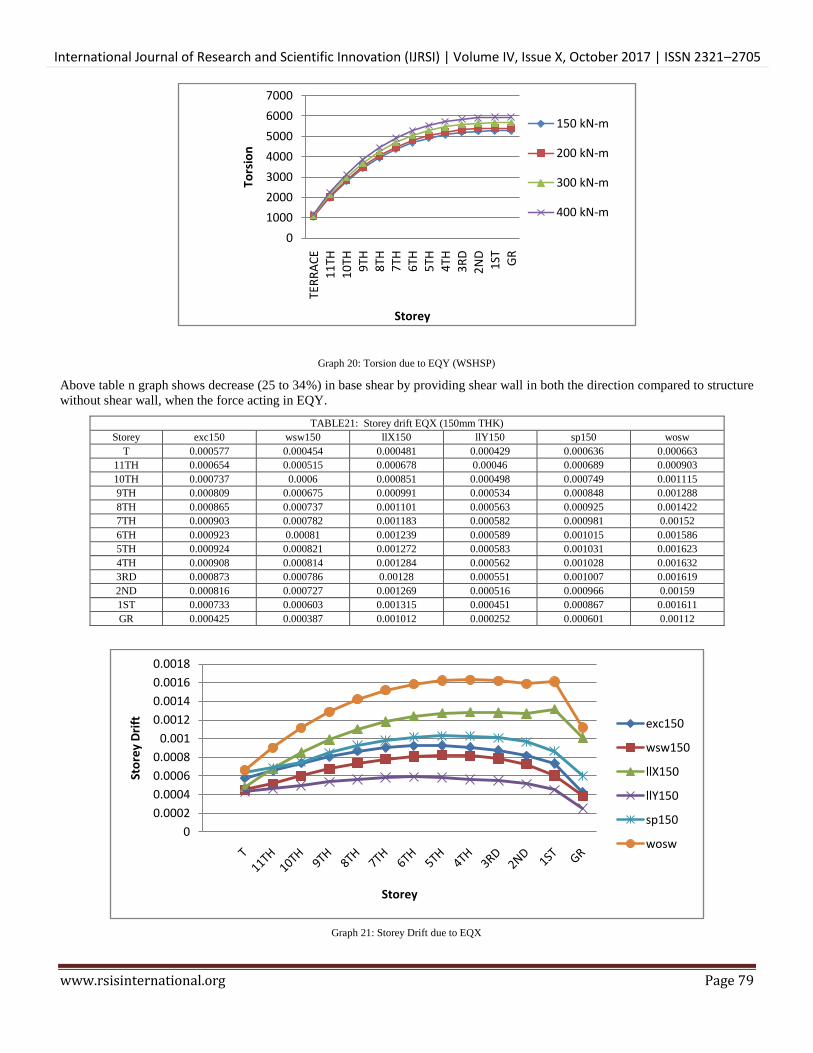


![GLOBALIZATION INDIAN SOCIETY AND. PARTICIPANTS OF PROJECT Name of participants Shalaka Salian [Group leader] Akshada Joshi Sayli Apte Haritha Naidu Ujwala.](https://static.documents.pub/doc/80x56/56649e0f5503460f94afa39c/globalization-indian-society-and-participants-of-project-name-of-participants.jpg)


