Page 1
Effect of Size and Shape of Test Specimens on Compressive Strength of Normal Strength Concrete
S.M. Habibul Ahsan
A thesis submitted to the Department of Civil Engineering of Bangladesh University of
Engineering and Technology, Dhaka, in partial fulfilment of the requirements for the degree
of
MASTER OF SCIENCE IN CIVIL ENGINEERING (STRUCTURAL)
DEPARTMENT OF CIVIL ENGINEERING
BANGLADESH UNIVERSITY OF ENGINEERING AND TECHNOLOGY DHAKA-1000, BANGLADESH
March, 2018
Page 2
ii
The thesis titled “Effect of Size and Shape of Test Specimens on Compressive Strength of
Normal Strength Concrete” submitted by S.M. Habibul Ahsan, Roll No.: 0413042335,
Session: April 2013 has been accepted as satisfactory in partial fulfilment of the requirement
for the degree of M.Sc. Engineering (Civil and Structural) on 27th March, 2018.
BOARD OF EXAMINERS ______________________________________ Dr. Mohammad Al Amin Siddique Chairman Associate Professor (Supervisor) Department of Civil Engineering BUET, Dhaka. ______________________________________ Dr. Ahsanul Kabir Member Professor and Head (Ex-officio) Department of Civil Engineering BUET, Dhaka. ______________________________________ Dr. Shameem Ahmed Member Assistant Professor Department of Civil Engineering BUET, Dhaka. ______________________________________ Dr. Md. Tarek Uddin Member Professor (External) Department of Civil and Environmental Engineering IUT, Gazipur.
Page 3
iii
D E D I C A T I O N
To Those
Who Are Praised
By
Allah
Page 4
iv
D E C L A R A T I O N
It is hereby declared that except for the contents where specific reference have been made to
the work of others, the studies contained in this thesis is the result of investigation carried out
by the author. No part of this thesis has been submitted to any other university or other
educational establishment for a Degree, Diploma or other qualification (except for
publication).
_________________________________ S.M. Habibul Ahsan
Page 5
v
A C K N O W L E D G E M E N T
I n t h e n a m e o f A l l a h , M o s t G r a c i o u s , M o s t M e r c i f u l
All praises to the Sustainer of the worlds, and grace, honour and salutations on the Chief of
Apostles and Seal of Prophets, Muhammad Sallallahu Alaihissalam, his family, companions
and those who followed him in an excellent manner and invited mankind towards Allah, till
the Day of Resurrection.
I would like to thank Allah Subha’nahu Wa Ta’ala the Exalted for His blessing that allowed
me to complete this thesis and I pray that He accepts it as a work of sincerity and benefit.
I would like to express my deep and sincere gratitude to my thesis supervisor, Dr.
Mohammad Al Amin Siddique, Associate Professor of Civil Engineering Department of
BUET for his dynamic supervision, continuous guidance, invaluable suggestion, and
enthusiastic encouragement throughout various stages of this research. His active interest in
this topic and valuable advice was the source of author’s inspiration. The author is also
grateful to all personnel of Concrete and SM laboratories of BUET for their excellent support
during carrying out the experimental works.
During this work I have collaborated with many colleagues for whom I have great regard, and
I wish to extend my warmest thanks to all those who have helped me with my work in the
Department of Civil Engineering of BUET.
Finally, I extend my acknowledgement and heartfelt love to my family members who are
always a constant source of inspiration throughout my life.
Page 6
vi
A B S T R A C T
Different codes (ASTM, BS etc) specify different size/shape test specimens for quality
assurance testing. Cylinder specimens of 6×12 in. (150×300 mm) or 4×8 in. (100×200 mm)
and cube specimens of 6×6 ×6 in. (150×150×150 mm) or 4×4×4 in. (100×100×100 mm) are
widely used in different countries. In our country, design specifications refer to the
compressive strength obtained from either testing 6×12 in. concrete cylinder or 6 in. concrete
cube and tested as per relevant standards. However, 4×8 in. cylinder specimens are almost
exclusively used in our country nowadays considering testing machine capacity, ease of
handling, cost of materials etc. Therefore, a correlation between concrete compressive
strengths of using cylinders and cube specimens are necessary. L'Hermite equation is widely
used as a conversion factor between the standard cube and cylinder specimens. However, the
applicability of this conversion factor may require to be evaluated in context of concrete as
used in our country. Therefore, the main objective of this research is to study the effect of
size and shape of test specimens on compressive strength of normal strength concrete. The
variability of using L’Hermite equation as a conversion factor of compressive strength is also
evaluated.
An experimental program is carried out to study the size and shape effect of concrete test
specimens on normal strength concrete. A total of 324 nos. samples (90 nos. 6×12 in.
cylinders; 90 nos. 4×8 in. cylinder; 72 nos. 6 in. cube and 72 nos. 4 in. cube) have been
prepared and tested for unit weight, compressive strength, splitting tensile strength, static
modulus of elasticity. In addition, a non-destructive test UPV is conducted to evaluate the
concrete compressive strength. During the experimental study, 06 (six) strength levels
(concrete mix design) i.e., 7 MPa (1000 psi) to 41 MPa (6000 psi) were obtained by mostly
varying water-cement ratio, and other parameters such as maximum size of coarse aggregate,
properties of fine and coarse aggregates and fine aggregate-to-total aggregate ratio were kept
almost the same. 2% air content is considered in all concrete mixes. Parameters like curing
condition, capping method, consolidation and testing method were controlled as per relevant
standards (ASTM and BS) for the entire test program.
From the experimental results, it is observed that the smaller size cylinder specimen (4 × 8
in.) has higher compressive strength than that of larger sizes (6×12 in.) and the same trend is
followed for the cube specimens. The ratio of compressive strength of 4×8 in. cylinder
specimens to that of 6×12 in. specimens is 1.13 on an average with coefficient of variation of
6.2 percent. The average ratio of compressive strength of 4 in. cube specimens to that of 6 in.
Page 7
vii
is approximately 1.06 with a coefficient of variation of 6.6 percent. The ratios of compressive
strength between standard cylinder to standard cube are dependent on strength of concrete
and the ratios increases with the increase of strength. Using L’Hermite equation to convert
standard cube strength to cylinder strength is not conservative for strength level between 7
MPa and 41 MPa in case of concrete produced in our country. For the strength range between
41 MPa to 53 MPa, L’Hermite equation yields conservative values. When concrete strength
using cylinder specimens is converted to cube strength according to LGED specification, it
always overestimates the concrete strength for the range of 7 to 40 MPa concrete. For
strength ranges between 10.5 to 62 MPa, REB specification provides better agreement with
the test results.
Page 8
viii
T A B L E O F C O N T E N T S Page No.
DEDICATION iii
DECLARATION iv
ACKNOWLEDGEMENT v
ABSTRACT vi
LIST OF FIGURES xii
LIST OF TABLES xvi
LIST OF ABBREVIATIONS xviii
CHAPTER 1 INTRODUCTION
1.1 General 1
1.2 Background of the Study 1
1.3 Objectives of the Present Study 3
1.4 Scope and Methodology of the Study 3
1.5 Organization of the Thesis 3
CHAPTER 2 LITERATURE REVIEW
2.1 Introduction 5
2.2 Size and Shape Effect on Concrete Strength 6
2.3 Factors Affecting Strength of Concrete 9
2.3.1 Water-Cement Ratio 9
2.3.2 Air Entrainment 10
2.3.3 Aggregate/Cement Ratio 10
2.3.4 Coarse Aggregate 11
2.3.5 Curing Condition 12
2.3.6 Mold Material 13
2.3.7 Rate of Load Application 13
2.3.8 Age of Test Specimen 13
2.4 Correlation Between Cylinder and Cube Strength 14
2.4.1 Strength Level 14
2.4.2 Age of Specimen 14
Page 9
ix
2.4.3 Aggregate Size 15
2.4.4 Curing Condition 15
2.4.5 Capping Method 15
2.4.6 Consolidation Method 15
2.5 Correlation Between UPV and Compressive Strength 16
2.6 Summary and Discussion 19
CHAPTER 3 EXPERIMENTAL WORK
3.1 Introduction 20
3.2 Sieve Analysis and Aggregate Properties 21
3.3 Mix Design 26
3.4 Material Used in the Present Study 27
3.4.1 Cement 27
3.4.2 Aggregate 27
3.4.3 Water 28
3.5 Methodology 28
3.5.1 Casting of Concrete 28
3.5.2 Compacting & Curing 28
3.6 Test on Fresh Concrete 30
3.6.1 Workability Test 30
3.7 Test on Hardened Concrete 30
3.7.1 Compressive Strength Test 31
3.7.2 Splitting Tensile Strength Test 32
3.7.3 Concrete Density 33
3.7.4 Ultrasound Pulse Velocity Test (UPV) 34
3.7.5 Stress-Strain Diagram and Modulus of Elasticity 35
3.8 Summary 36
CHAPTER 4 RESULTS AND DISCUSSION
4.1 Introduction 37
4.2 Test on Fresh Concrete 37
4.3 Experiment on Hardened Concrete(Non- Destructive) 38
Page 10
x
4.3.1 Hardened Unit Weight of Concrete 38
4.3.2 Ultrasound Pulse Velocity 39
4.4 Experiment on Hardened Concrete (Destructive) 43
4.4.1 Splitting Tensile Strength 43
4.4.2 Compressive Strength Test 45
4.4.3 Correlation between Strength of Cylinders 48
4.4.4 Correlation between Strength of Cubes 52
4.4.5 Correlation between Strength of Cylinder & Cube 55
4.5 Stress-Strain Diagram 62
4.5.1 Static Modulus of Elasticity 62
4.5.2 Static Modulus of Elasticity for Specified
Strength 7 MPa
63
4.5.3 Static Modulus of Elasticity for Specified
Strength 14 MPa
65
4.5.4 Static Modulus of Elasticity for Specified
Strength 21 MPa
67
4.5.5 Static Modulus of Elasticity for Specified
Strength 28 MPa
69
4.5.6 Static Modulus of Elasticity for Specified
Strength 34 MPa
71
4.5.7 Static Modulus of Elasticity for Specified
Strength 41 MPa
73
4.6 Failure Pattern 76
4.6.1 Failure Types of Concrete Specimen for Specified
Strength 7 MPa
77
4.6.2 Failure Types of Concrete Specimen for Specified
Strength 14 MPa
78
4.6.3 Failure Types of Concrete Specimen for Specified
Strength 34 MPa
78
4.7 Summary 80
CHAPTER 5 CONCLUSIONS AND RECOMMENDATIONS
5.1 General 81
Page 11
xi
5.2 Conclusions 82
5.3 Limitations
83
5.4 Recommendations for the Future Study 83
REFERENCES 85
Page 12
xii
L I S T O F F I G U R E S
Page No.
FIGURE 2.1 Wall effect (Neville, 2002) 7
FIGURE 2.2 Water-cement ratio vs. strength of concrete (Neville, 1996)
9
FIGURE 2.3 Influence of the aggregate/cement ratio on strength of concrete (Neville & Brooks, 2007)
10
FIGURE 2.4 Aggregate size, w/c, and compressive strength (Cordon and Gillespie 1963)
11
FIGURE 2.5 Pulse velocity testing equipment 17
FIGURE 2.6 Direct (a), Semi-direct (b), Indirect (surface) transmission (c).
17
FIGURE 3.1 ASTM C 33 gradation chart (upper & lower limit) and sample gradation curve (stone chips-1st phase).
22
FIGURE 3.2 ASTM C 33 gradation chart (upper & lower limit) and sample gradation curve(sand-1st phase).
23
FIGURE 3.3 ASTM C 33 gradation chart (upper & lower limit) and sample gradation curve(stone chips-2nd phase)
24
FIGURE 3.4 ASTM C 33 gradation chart (upper & lower limit) and sample gradation curve(sand-2nd phase).
25
FIGURE 3.5 Natural Sylhet sand 27
FIGURE 3.6 Natural Stone chips 27
FIGURE 3.7 Mixing of concrete ingredients 29
FIGURE 3.8 Placing and compacting of concrete. 30
FIGURE 3.9 Slump test on a fresh concrete 31
FIGURE 3.10 Top and bottom capping of 4×8 in. cylinder 32
FIGURE 3.11 Testing Machine and Test Setup 32
FIGURE 3.12 Typical Splitting tensile strength test set up 33
FIGURE 3.13 Ultrasound Pulse Velocity test 35
FIGURE 3.14 Typical test up with dial gauge for determining modulus of elasticity
36
Page 13
xiii
FIGURE 4.1 Compressive Strength vs. UPV (6×12 in. Cylinder) 40
FIGURE 4.2 Compressive Strength vs. UPV (4×8 in. Cylinder) 40
FIGURE 4.3 Compressive Strength vs. UPV (6 in. Cube) 41
FIGURE 4.4 Compressive Strength vs. UPV (4 in. Cube) 41
FIGURE 4.5 Tensile Strength vs. UPV 42
FIGURE 4.6 √𝑓′c vs. tensile strength 44
FIGURE 4.7 Water-Cement Ratio vs. Compressive Strength of 6×12 in. Cylinder specimens
47
FIGURE 4.8 Water-Cement Ratio vs. Compressive Strength of 4×8 in. Cylinder specimens
47
FIGURE 4.9 Water-Cement Ratio vs. Compressive Strength of 6 in. Cube specimens
48
FIGURE 4.10 Water-Cement Ratio vs. Compressive Strength of 4 in. Cube specimens
48
FIGURE 4.11 Seven-day strength of standard and small size cylinder specimens
50
FIGURE 4.12 Fourteen-day strength of standard and small size cylinder specimens
51
FIGURE 4.13 Twenty eight-day strength of standard and smaller size cylinder specimens
51
FIGURE 4.14 Seven-day strength of standard and small size cube specimens.
54
FIGURE 4.15 Fourteen-day strength of standard and small size cube specimens
54
FIGURE 4.16 Twenty Eight-day strength of standard and small size cube specimens
55
FIGURE 4.17 Compressive strength vs. conversion factors 56
FIGURE 4.18 Conversion between the cylinder and cube strengths of concrete
58
FIGURE 4.19 Cube strength vs. cylinder/cube ratio (L’Hermite & present study)
59
FIGURE 4.20 Cylinder and cube strength (LGED recommendation and present study)
60
Page 14
xiv
FIGURE 4.21 Cylinder strength vs cube strength found in the present study
61
FIGURE 4.22 REB cube strength vs cube strength from the present study
62
FIGURE 4.23 Stress-strain diagram for specimen-1 for specified strength 7 MPa
63
FIGURE 4.24 Stress-strain diagram for specimen-2 for specified strength 7 MPa
64
FIGURE 4.25 Stress-strain diagram for specimen-3 for specified strength 7 MPa
64
FIGURE 4.26 Stress-strain diagram for specimen-1 for specified strength 14 MPa
65
FIGURE 4.27 Stress-strain diagram for specimen-2 for specified strength 14 MPa
66
FIGURE 4.28 Stress-strain diagram for specimen-3 for specified strength 14 MPa
66
FIGURE 4.29 Stress-strain diagram for specimen-1 for specified strength 21 MPa
67
FIGURE 4.30 Stress-strain diagram for specimen-2 for specified strength 21 MPa
68
FIGURE 4.31 Stress-strain diagram for specimen-3 for specified strength 21 MPa
68
FIGURE 4.32 Stress-strain diagram for specimen-1 for specified strength 28 MPa
69
FIGURE 4.33 Stress-strain diagram for specimen-2 for specified strength 28 MPa
70
FIGURE 4.34 Stress-strain diagram for specimen-3 for specified strength 28 MPa
70
FIGURE 4.35 Stress-strain diagram for specimen-1 for specified strength 34 MPa
71
FIGURE 4.36 Stress-strain diagram for specimen-2 for specified strength 34 MPa
72
FIGURE 4.37 Stress-strain diagram for specimen-3 for specified strength 34 MPa
72
FIGURE 4.38 Stress-strain diagram for specimen-1 for specified strength 41 MPa
73
FIGURE 4.39 Stress-strain diagram for specimen-2 for specified strength 41 MPa
74
FIGURE 4.40 Stress-strain diagram for specimen-3 for specified strength 41 MPa
74
Page 15
xv
FIGURE 4.41 Satisfactory failure patterns for cylinder and cube 77
FIGURE 4.42 Failure pattern of (a) 4 ×8 in. and (b) 6×12 in. cylinders specimen
77
FIGURE 4.43 Failure pattern of 6 in. (a) and 4 in. cubes (b) 77
FIGURE 4.44 Failure type for large and small size cylinder specimens
78
FIGURE 4.45 Shows the failure type of concrete cylinder specimens 79
FIGURE 4.46 Failure pattern is semi-explosive (a) and explosive (b) 79
FIGURE 4.47 Tensile splitting surface for 6×12 and 4×8 in. cylinder
80
Page 16
xvi
L I S T O F T A B L E S Page No.
Table 3.1 Sieve analysis of stone chips procured at 1st phase 21
Table 3.2 Sieve analysis of Sylhet sand procured at 1st phase 22
Table 3.3 Sieve analysis of stone chips procured at 2nd phase 23
Table 3.4 Sieve analysis of Sylhet sand procured at 2nd phase 24
Table 3.5 Comparison of different properties of Sylhet sand used at 1st and 2nd phases of testing
25
Table 3.6 Comparison of different properties of stone chips used at 1st and 2nd phases of testing
26
Table 3.7 Quantity of materials for different concrete mixes 26
Table 4.1 Slump test results of different concrete mixes 37
Table 4.2 Unit weight of different concrete mixes 38
Table 4.3 Ultrasound Pulse Velocity (m/s) and compressive strength (MPa) of cylinders
39
Table 4.4 Ultrasound Pulse Velocity (m/s) and compressive strength (MPa) of cubes
39
Table 4.5 UPV (m/s) and tensile strength (MPa) for different concrete mixes
42
Table 4.6 Conversion between compressive strength (psi) and splitting tensile strength (psi) for 6×12 in. cylinder
44
Table 4.7 Conversion between compressive strength (psi) and splitting tensile strength (psi) for 4×8 in. cylinder
45
Table 4.8 Compressive strength of cylinder and cube specimens 46
Table 4.9 Conversion factors between cylinder specimens 49
Table 4.10 Conversion factors between 6 in. and 4 in. cube specimens 52
Table 4.11 Conversion factors between 6x12 in. cylinder and 6 in. cube
56
Table 4.12 Conversion factors between 6x12 in. cylinder and 6 in. cube(28-day)
58
Page 17
xvii
Table 4.13 Conversion factors as recommended by LGED, Bangladesh
59
Table 4.14 Conversion factors between 4x8 in. cylinder and 4 in. cube specimens
60
Table 4.15 Conversion between cylinder to cube strength 61
Table 4.16 Static modulus of elasticity for specified strength 7 MPa
65
Table 4.17 Static modulus of elasticity for specified strength 14 MPa 67
Table 4.18 Static modulus of elasticity for specified strength 21 MPa 69
Table 4.19 Static modulus of elasticity for specified strength 28 MPa 71
Table 4.20 Static modulus of elasticity for specified strength 34 MPa 73
Table 4.21 Static modulus of elasticity for specified strength 41MPa 75
Table 4.22 Summary of findings from stress-strain test data 75
Page 18
xviii
L I S T O F A B B R E V I A T I O N
ACI American Concrete Institute
AASHTO American Association of State Highway and Transportation Officials
ASTM American Society for Testing and Materials
BS British Standards
IS Indian Standards
UPV Ultrasound Pulse Velocity
PSI Pound Per Square in.
LGED Local Government Engineering Department
REB Rural Electrification Board
PCC Portland Composite Cement
FM Fineness Modulus
Page 19
1
Chapter 1
INTRODUCTION
1.1 General
Worldwide, over 4.1 billion tons of cement was produced in the year 2017. In the United
States, the annual production is over 86.3 million tons (https://www.statista.com/statistics/).
In Bangladesh, per capita consumption of cement is 120 kg annually, whereas per capita
consumption of cement in Pakistan, Sri Lanka and India are 170 kg, 310 kg and 220 kg
respectively annually (http://www.eblsecurities.com/). Around 32 million tons of concrete
was produced in Bangladesh in 2016-17 compared to 13.9 million tons in 2010-11. If the
demand is considered of other developing countries, Bangladesh has a huge potential in
growth of concrete consumption in the years to come. Concrete is used in many civil
engineering structures such as to build roads, bridges, skyscrapers, airplane runways and
dams etc.
1.2 Background of the study
Concrete is by far the most used building material on earth due to its excellent compressive
strength, mouldability to different predefined shapes and a long service life. In most areas,
concrete takes advantage of inexpensive local materials (sand, brick and stone) and requires
relatively less amount of cement and reinforcing steel which can be transported in from one
to other locations of the country. Concrete in a civil engineering structure mainly resists
compressive stress generated from different load types, and tensile stress is left for
reinforcing steel to take over.
Compressive strength of concrete depends on many factors. The main influencing factors on
strength are taken in practice as: water/cement ratio, degree of compaction, age and
temperature. However, there are also other factors which affect strength: aggregate/cement
ratio, quality of aggregate (grading, surface texture, shape, strength, and stiffness), and the
maximum size of the aggregate. These factors are regarded as of secondary importance when
usual aggregates up to a maximum size 40 mm are used (Neville, 2002).
Page 20
2
For construction of any concrete structure, compressive strength of concrete is specified
beforehand. Various mix design approaches are available to attain specified strength of
concrete. Among the various methods in use, the method proposed by American Concrete
Institute (ACI 211.1-91) is probably the most popular one. The ACI method requires in total
seven input parameters to design a normal strength concrete mix. These are: coarse aggregate
unit weight, design compressive strength, fine aggregate specific gravity, coarse aggregate
specific gravity, fine aggregate fineness modulus, coarse aggregate maximum size and slump.
Concrete samples as specified by various standards (ASTM, BS and IS etc) are casted and
tested in laboratory to ensure that concrete of specified strength are attained at the
construction site.
It is well established that for a specific mix, compressive strength of concrete varies
depending on shape and/or size of concrete test specimens (Neville, 1996). During
construction works, quality of concrete is ensured by casting concrete samples using various
moulds (6×12 in. (150×300 mm) or 4×8 in. (100×200 mm) cylinders; 6 in. (150 mm) or 4
in.(100 mm) cube) according to different standards in different countries. In our country,
design specifications refer to the compressive strength obtained from either testing 6 × 12 in.
concrete cylinder or 6 in. concrete cube and tested as per relevant standards. However, 4×8
in. cylinder specimens are almost exclusively used in our country nowadays considering
testing machine capacity, ease of handling, cost of materials etc. Also, ASTM C192 and
AASHTO R39 allow the use of 4 × 8 in. cylinders for quality assurance testing. Therefore, a
correlation between concrete compressive strengths of using cylinders and cube specimens
are necessary. A widely used L'Hermite equation gives conversion factors between the
standard cube and cylinder specimens. However, the applicability of these conversion factors
may require to be evaluated in context of concrete as used in our country. Also, government
organizations like LGED, REB etc. have their own conversion factors for different project
specifications. The present study will also evaluate the applicability of the use of these
conversion factors. An experimental program will be conducted to assess the effect of test
specimen sizes and shapes on compressive strength of concrete, to be cured under standard
laboratory controlled conditions and to be tested at 7, 14 and 28 days. In addition, tensile
strength, modulus of elasticity of concrete will be evaluated. A non-destructive test such as
UPV will also be used to assess the variation of different concrete mixes as well as to
correlate the compressive strength.
Page 21
3
1.3 Objectives of the present study
The main objectives of the thesis are as follows:
To determine a correlation between the compressive strength of 4 × 8 in. and 6 × 12
in. cylinders and the variability associated with those results.
To determine a correlation between the compressive strength of 4 in. and 6 in. cubes
and the variability associated with those results.
To evaluate a conversion factor between the compressive strength of cylinders and
cube specimens and the applicability of L'Hermite equation for conversion factors of
cube and cylinder specimens.
1.4 Scope and methodology of the study
An experimental program will be carried out to determine the concrete properties using
different sizes and shape of specimens. Cylinder sizes of 6 ×12 in. and 4×8 in. and cube sizes
of 6×6 in. and 4×4 in. will be used in the study. Specimens with target concrete compressive
strength ranging from 7 MPa (1000 psi) to 41 MPa (6000 psi) will be prepared and tested in
the laboratory. Six different concrete mixes will be prepared. Properties like bulk specific
gravity, unit weight, water absorption capacity, and fineness modulus of coarse and fine
aggregates will be evaluated through different laboratory tests. Portland composite cement
(PCC), Sylhet sand and natural stone aggregates will be used as ingredients of concrete
without any chemical admixture. Concrete compressive strength will be evaluated for
different sizes and shapes at 7, 14, and 28 days. Splitting tensile strength and modulus of
elasticity of concrete will be determined at 28 days. In addition, a non-destructive test such as
Ultrasound Pulse Velocity (Mohammed & Rahman, 2016) will be used to determine the
concrete compressive strength.
1.5 Organization of the thesis
The thesis is organized into five chapters. Chapter 1 is the current chapter, which introduces
the background, objectives and scope of the thesis.
In chapter 2 (literature review), the previous significant works on size and shape effect of
different specimens on concrete strength have been mentioned.
Page 22
4
Chapter 3 (experimental works) includes complete details about the experiments, which were
performed together with their respective standards.
Chapter 4 (results and discussions) contains the results of experimental program and the
analyses of the obtained results. Explanations and discussions about each of results are made
and were compared with the available literature.
In chapter 5 (conclusions and recommendations), conclusions of the present study are listed
briefly. In addition, a further research scope will be mentioned.
Page 23
5
Chapter 2
LITERATURE REVIEW
2.1 Introduction
Compressive strength of concrete is determined by testing on hardened concrete samples
which is one of the most important and necessary experiments performed widely for quality
assurance testing. Usually samples of various size and shape according to different standards
are casted in the field/laboratory and crushed them by using relevant testing machines.
Splitting tensile strength, static and dynamic modulus of elasticity, Poisson’s ratio and stress-
strain diagram are evaluated according to relevant testing standards.
However, it is widely known fact that results of the experiment on compressive strength can
be affected by diverse factors, such as specimens’ sizes, their shapes, the moulds used for
casting, curing conditions and rate of load application (Neville, 2002). It is also realized that
the strength of a concrete specimen may also be influenced by other factors, such as modulus
of elasticity of aggregate, its Poisson’s ratio, the aggregate-cement ratio etc. (Neville, 1966).
According to different testing standards (ASTM, BS etc) adopted for compressive and
splitting tensile strengths tests, there are two main shapes for testing concrete specimens:
cubes and cylinders. While cylindrical specimens 150×300 mm (6×12 in.) are used mostly in
Australia, Canada, France, New Zealand and the United States, cubic specimens of 300 mm
(6 in.) and 100 mm (4 in.) are used generally in India and Europe (Yakkali, 2015). Due to two
main shapes and various sizes, testing specimens can easily differ in strengths and may
produce scattered results even if they are from the same batch and tested at the same testing
condition such as age of specimen, curing condition. Of course, in each region, regarding to
the specimens types, there are codes like British and ASTM code, explaining how to perform
the experiment.
One of the differences between cylinder and cube specimens is that before being loaded,
cylinder specimens need capping. The specimens have to be capped by Sulphur mortar,
rubber pad or cement paste in order to have uniform loading surfaces. Unlike the cylinders,
cubes do not require capping as they are turned over on their sides to get plain surface, when
being loaded. Various researches have been conducted and available in literature to
Page 24
6
understand and clarify the size and shape effect of concrete specimens on the compressive
strength test results. According to Bažant and Planas (1998), size effect can be seen when by
altering the size of a concrete member, its nominal strength also gets changed, even though
their shape is similar to each other. The same definition can be proposed for shape effect as
well, when nominal strength of concrete members is dependent on their shape.
2.2 Size and shape effect on concrete strength
To address size and shape effect on concrete test specimen, conversion factors have been
proposed for different conditions. One of the first investigations about size effect was carried
out in 1925 by Gonnerman, using standard cubes of 6 in. and 8 in. and different sizes of
cylinders. Testing different specimens at different ages, the average cylinder/cube ratio of
0.85 to 0.88 was obtained.
Since concrete is composed of ingredients of variable strength, it is reasonable to assume that
the larger the volume of the concrete, the probability of occurrence of an element of weaker
strength of a given level of strength is higher (Neville, 1966). As a result, for a concrete
specimen of the same batch, it is reasonable to expect that its strength and its variability will
decrease as the specimen size increases. Since the size effect is a result of the non-
homogeneity of the concrete, it follows that the more homogeneous the concrete the smaller
will be the size effect. Lessard and Aitcin (1992) found that the compressive strength of
cylinders of 150 mm dia. by 300 mm height was about 94% that of cylinders of 100 mm dia.
by 200 mm height. Baalbaki et al. (1992) repeated the experiment on a total of 126 cylinders
and found that the strength of the cylinders of 150mm dia. was 93% that of cylinders of 100
mm dia. Neville (2002) suggested that the strength of the 100 mm cubes was about 1.04%
that of the 150 mm cubes.
Size and shape effect and the factors influencing them were also studied by Tokyay and
Ozdemir (1997). They also explained the fact of getting low strength of very small size
specimen compared to large size specimen, which is a contradiction as small size specimen
shall have higher apparent compressive strength. This was explained by the phenomenon of
wall effect (as shown in figure 2.1), according to which, the quantity of mortar required to fill
the space between the particles of the coarse aggregate and the wall of the mold is greater
Page 25
7
than that necessary in the interior of the mass and therefore in excess of the mortar available
even in a well-proportioned mix. This effect limits the compactibility of specimens and is
more pronounced in specimens with larger lateral surface area-to-volume ratio, and this
phenomenon influences the results of compressive strength, as well as the conversion factors
of different specimens to each other.
Figure 2.1 Wall effect (Neville, 2002)
Size and shape effect for brick aggregate concrete have been studied by Banda et al. (2013).
They compared the results between compressive strength of 6×12 in. cylinder and 6 in. cube
for various water-cement ratio and mix proportion of concrete ingredients. On an average,
cube strength were found 15.12%, 10.63% and 12.00% greater than that of cylinder strengths
for various mix proportions and water-cement ratio. They compared the results between
compressive strength of 6×12 in. cylinder and 4×8 in. cylinder for various water-cement ratio
and mix proportion of concrete ingredients. On an average, small cylinder strengths were
7.40%, 8.03% and 9.70% higher that of larger cylinder strengths for various water- cement
ratios and mix proportions.
Due to different shapes of the testing specimen, measured compressive strengths are different
for cubes and cylinder specimens although they are from the same mix and similar testing
condition. Cylinder specimens are slender compared to that of cubes. The ratio of height-to-
diameter (h/d) of cylinders is 2 while that of cubes is 1. This is one of the causes. It was
found that the cube/cylinder strength ratio decreases by the increase in concrete strength
(Yakkali and Reddy, 2015). This ratio reaches values above 0.9 for high strength concrete. A
Page 26
8
ratio of 1.15 to 1.25 is expected for normal concrete (25 to 50MPa cube strength), while this
value reaches 1.1 for high strength concrete (55 to 85MPa cube strength) (Yakkali and
Reddy, 2015). Generally, cylinder/cube compressive strength values close to 0.9 and 0.95 for
higher strength concretes. On the other hand, practically, the ratio between cylinder and cube
strength is typically taken equal to 0.8 averagely at a lower to medium strength grades
(Yakkali and Reddy, 2015).
During testing, the platens of the loading machine restrain the lateral expansion of the
concrete in parts of the specimen near its ends. This restraint is dependent on the amount of
friction developed. Under normal conditions, with friction, an element within the specimen is
subjected to a shearing stress as well as to compression. With an increase of distance from the
platen, the magnitude of the shearing stress decreases and the lateral expansion increases.
This shear stress has the confining effect of increasing the axial load for failure. The
restraining effect of the platens of the testing machine extends over the entire height of the
cube but leaves a part of the cylinder unaffected due to this increase in aspect ratio.
Therefore, compressive strengths of cubes are expected to be higher than those of cylinders
made from the same concrete (Yakkali and Reddy, 2015).
In reality, there is no unique relationship among the cube and cylinder made with different
proportions. The interrelation varies also with age factors. Cylinders are believed to give a
higher uniformity of results for similar specimens because their failure is less affected by the
end restraint of the specimen, their strength is influenced by the properties of the coarse
aggregate used in the mix, and the stress distribution on horizontal planes in a cylinder is
more uniform than on a cube specimen. The use of rigid and nonrigid moulds affects their
strength (Yakkali and Reddy, 2015).
As discussed, concrete cubes may be loaded in the direction perpendicular to casting while
cylinders are always loaded in the direction of casting. Since these concrete cubes and
cylinders are casted in multiple layers, their strength will differ based on direction of loading.
Lower the rate of application of load, the lower will be the recorded strength; the reason for
this is probably the effect of creep. If the load is applied slowly, or if the there is some time
lag, the specimen will undergo certain amount of creep which will increase the strain due to
creep will be responsible for failure of sample (Yakkali and Reddy, 2015).
Page 27
9
The objectives of the present research are to determine correlation between compressive
strength of 6×12 in. cylinder and 4×8 in. cylinder; 6 in. cube and 4 in. cube and 6×12 in.
cylinder and 6 in. cube for normal strength concrete. In the subsequent paragraphs, factor that
affect compressive strength of concrete and factors that may affect correlation of strengths
between cylinder and cube specimens will be discussed.
2.3 Factors affecting strength of concrete
In general, there are many factors that affect the compressive strength of concrete and among
these factors, most of them are interdependent. Some of the important parameters that may
affect the compressive strength of concrete are discussed in the following sections.
2.3.1 Water-cement ratio
In properly compacted concrete, the compressive strength is inversely proportional to water-
cement ratio as shown in figure 2.2.
Figure 2.2 Water-cement ratio Vs strength of concrete (Neville, 1996)
The water-cement ratio is a very important factor in the determination of porosity and
eventually the strength of concrete (Neville 1996). An increase in temperature increases the
rate of the exothermic hydration reaction and also the development of strength with time
(Neville 1996). In practical applications, it is found that the water-cement ratio is usually the
most important factor with respect to strength (Neville 1996).
Page 28
10
2.3.2 Air entrainment
Air entrainment is the incorporation of air bubbles into the concrete by either using an air-
entraining admixture or air-entraining cement. There are two forms of air found in concrete:
entrapped and entrained air. Entrained air causes a reduction in compressive strength at a
particular water-cement ratio when compared with non-air-entrained concrete. It is found that
as the amount of entrained air increases, the demand for mixing water and sand reduces at a
particular cement content. However, when the cement content increases the reduction in the
demand for mixing water decreases. Thus the reduction in compressive strength associated
with air-entrained concrete can be somewhat compensated by making air-entrained concrete
with lower water-cement ratios (Vandegrift and Schindler, 2006).
2.3.3 Aggregate/cement ratio
It has been found that, for a constant water/cement ratio, a leaner mix leads to a higher
strength. The influence of aggregate/cement ratio on strength of concrete is shown in figure
2.3.
Figure 2.3 Influence of the aggregate/cement ratio on strength of concrete (Neville & Brooks,
2007)
Page 29
11
The main explanation if this influence lies in the total volume of voids in the concrete.
Clearly if the paste represents a smaller proportion of the volume of concrete (as in the case
of leaner mix) then the total porosity of the concrete is lower, and hence its strength is higher.
The above argument ignores any voids in the aggregate, but with normal aggregates these are
minimal (Vandegrift and Schindler, 2006).
2.3.4 Coarse Aggregate
The strength of concrete is dependent on size, shape, grading, surface texture mineralogy of
the aggregate, strength, stiffness and the maximum size of aggregate as seen in Figure 2.4.
Figure 2.4 Aggregate size, w/c, and compressive strength (Cordon and Gillespie, 1963)
Research studies conducted by Gilkey 1961 and Mehta and Monteiro (1993) suggested that
the effect of aggregate strength on the compressive strength of concrete is not considered in
the case of normal strength concrete, as it is much stronger than the transition zone and
cement paste matrix. Mehta and Monteiro (1993) also explained that the transition zone and
the cement paste matrix would fail before the aggregate and thus nullify the effect of the
Page 30
12
strength of aggregate. Kosmatka et al. (2002) also suggested that the aggregate strength is
usually not a factor in normal strength concrete as the failure is generally determined by the
cement paste-aggregate bond. Much research has linked the bonding of the aggregate to the
strength of concrete. Neville and Brooks (2007) explained that greater aggregate surface
areas result in better bonding between the aggregate and the cement paste. They also
observed that rough aggregates tend to exhibit better bonding than smooth aggregates. Jones
and Kaplan (1957) made similar observations as Neville and Brooks (2007) but linked the
surface properties to the cracking stress suggesting rough aggregates would crack at a higher
stress compared to smooth aggregates. Figure 2.4 shows the effect of water-cement ratio and
the maximum aggregate size on compressive strength. It can be seen that compressive
strength decreases with an increase in maximum coarse aggregate size especially for
concretes with low water-cement ratios. It should be noted that the compressive strength is
more sensitive to the water-cement ratio than the maximum aggregate size (Vandegrift and
Schindler, 2006).
2.3.5 Curing condition
The reaction of water with cement is called the hydration process and the results are called
the products of hydration. Curing is a process by which moisture loss is prevented at a
particular temperature to enhance the hydration process of cement. The curing process not
only increases strength and durability but also decreases the porosity of the concrete. To
ensure that there is satisfactory development of strength during the hydration process it is
necessary to prevent moisture loss (Kosmatka et al. 2002).
Neville and Brooks (2007) stated that “it must be stressed for a satisfactory development of
strength it is not necessary for all the cement to hydrate and indeed this is rarely achieved in
practice.” Burg (1996) observed that a higher initial curing temperature increases the rate of
hydration process and early-age strength. However, high initial temperatures have been
reported to produce concretes with reduced long-term strengths as per Burg (1996). The
curing temperature is very important with respect to concrete strength because it contributes
towards the rate of hydration. With proper curing the capillary pores get filled up with
hydration products (Neville 1996) and this increases the impermeability and strength
(Kosmatka et al. 2002). To maintain proper hydration during the initial stages of concrete
stiffening, the internal relative humidity should be maintained at 80 percent as per Kosmatka
Page 31
13
et al. (2002). Neville and Brooks (2007) explained the impermeable nature of adequately
cured concrete by stating that the capillary pores inside concrete get interconnected by pores
formed by the products of hydration after sufficient hydration has taken place (Vandegrift
and Schindler, 2006).
2.3.6 Mold material
It is found that mold material does affect the apparent strength of concrete test specimens. In
general, specimen made with plastic mold has less compressive strength than that made with
steel mold (Vandegrift and Schindler, 2006).
2.3.7 Rate of load application
According to Mali et al. (2015), with the variation of loading, the strength of the specimen
varies proportionately and at higher rate of loading, the compressive strength increases.
However, at lower rate of loading, the reduction in strength of concrete cube compared to its
true strength is insignificant as per Mali et al. (2015).
2.3.8 Age of test specimen
The relationship between strength and porosity is an indicator to extent which the hydration
process is completed and the amount of hydration products present. Different cements require
different lengths of time to achieve a particular strength and the rate of hydration is different
for different types of cement (Neville 1996).
The water-cement ratio influences the rate of the hydration process and consequently the rate
of strength gain in concrete. Meyer (1963) found that when low water-cement ratios are
considered there is a rapid gain in early strength as compared to higher water-cement ratios.
He also found that the rate of strength gain at lower water-cement ratio decreased at later ages
as compared to higher water-cement ratios. Meyer (1963) also showed that the strength of
concrete increases with an increase in the age of concrete.
Page 32
14
2.4 Correlation between cylinder and cube strength
In general, the factors that may affect the correlation between specimens are: strength level,
age of specimen, aggregate size, capping method, mold material, consolidation method and
curing condition (Vandegrift and Schindler, 2006).
2.4.1 Strength Level
According to Yakalli & Reddy (2015), the value of the ratio of cylinder/cube strength
increases with the increase of strength of concrete. The conclusion can also be drawn from
L’Hermite’s equation that may be used to convert strengths between cylinder and cube
strength. L’Hermite’s equation is written as below:
= 0.76 + 0.2 log10 ( ------------------------ (2.1)
Here, strength is expressed as psi unit.
From the above equation, it is evident that when cube strength increases the ratio
also increases. Units of cube strength and cylinder strength are in psi.
2.4.2 Age of specimen
The relationship between strength and porosity is an indicator to extent which the hydration
process is completed and the amount of hydration products present. Different cements require
different lengths of time to achieve a particular strength and the rate of hydration is different
for different types of cement (Neville 1996). The water-cement ratio influences the rate of the
hydration process and consequently the rate of strength gain. Meyer (1963) found that when
low water-cement ratios are considered there is a rapid gain in early strength as compared to
higher water-cement ratios. He also found that the rate of strength gain at lower water-cement
ratio decreased at later ages as compared to higher water cement ratios. Meyer (1963) also
showed that the strength of concrete increases with an increase in the age of concrete.
Page 33
15
2.4.3 Aggregate size
According to Sim et al. (2013), the influence of maximum aggregate size on the size effect is
dependent on concrete type. The values of conversion factor for normal weight concrete
slightly increase with the increase of maximum aggregate size. For normal weight concrete,
as maximum aggregate size increased from 8mm to 19mm, the average values of conversion
factor increased by 5.8% in specimen with lateral dimension of 50 mm and by 6.8% in
specimen with lateral dimension of 400 mm.
2.4.4 Curing condition
It has been shown that variation from standard methods of curing conditions can affect the
compressive strength of cylindrical concrete specimens. This is expected as humidity less
than 100% will cause moisture loss from the cylinders and the rate of moisture loss will be
different for cylinders of different sizes (Vandegrift and Schindler, 2006).
2.4.5 Capping method
A study done by Glover and Stallings (2000) at Auburn University found that compressive
strengths from 4 × 8 in. cylinders with neoprene caps were 9.6 % greater than strengths from
sulfur-capped 4 × 8 in. cylinders. It was also found that for 6 × 12 in. cylinders, compressive
strengths from cylinders with neoprene caps were greater by 4.6% than that of strengths from
sulfur-capped cylinders.
2.4.6 Consolidation method
When 6 × 12 in. cylinders compacted with two equal layers and 25 roddings per layer are
compared to 3 × 6 in. cylinders with two equal layers and decreasing number of roddings per
layer, the strength ratio of 3×6 in. cylinder to 6×12 in. cylinder decreases with decreasing
number of roddings per layer for the 3 × 6 in. cylinder (Nassar and Al-Manaseer, 1987).
In the literature review, factors affecting the compressive strength as well as the factors
affecting the correlation between the strengths of test specimens have been discussed. Since
Page 34
16
the smaller specimen size provides ease in transportation and construction, it is gaining
popularity and is widely used.
The factors that affect the compressive strength as well as the strength ratio are aggregate
size, strength level, and age of specimen. Age of specimen, strength level, and aggregate size
were the three factors that were shown to have the greatest affect on the strength ratio. There
are factors such as compaction, curing conditions, rate of loading etc that can be varied and
will also affect the strength ratio. However, varying these factors will violate AASHTO and
ASTM standards (Vandegrift and Schindler, 2006).
2.5 Correlation between UPV and Compressive strength
UPV (Ultrasound Pulse Velocity) is a nondestructive test done on concrete
specimens/structures. The Non Destructive Testing (NDT) of concrete has a great technical
and useful importance. These techniques have been grown during recent years especially in
the case of construction quality assessment. The main advantage of non-destructive testing
method is to avoid the concrete damage or the performance of building structural
components. Additionally, their usage is simple and quick. Test results are available on the
site and the possibility of concrete testing in structures is demanding in which the cores
cannot be drilled and the use of less expensive equipments.
Recently in Bangladesh, after the collapse of a garments factory that killed more than 3000
workers, it becomes an important task to the civil engineers to assess the safety of the
existing structures. For safety assessment, evaluation of compressive strength of concrete is
an important requirement. Determination of compressive strength by cutting core is not an
easy method. Also, cutting cores from columns may hamper the load carrying capacity of the
columns. On the other hand, UPV through concrete can be evaluated easily for different
structural elements (Mohammed & Rahman, 2016).
The UPV equipment (e.g. PUNDIT) includes a transducer, a receiver and an indicator for
showing the time of travel from the transducer to the receiver (Figure 2.5) (Pundit manual
1998). Ultrasonic pulse uses fast potential changes to create vibration that leads to its basic
frequency. The transducer is firmly attached to concrete surface to vibrate the concrete. The
Page 35
17
pulses go through the concrete and reach the receiver (ASTM, 2002). The pulse velocity can
be determined from the following equation:
Figure 2.5. Pulse velocity testing equipment. V=L/T ---------------------------------------------------------------------------(2.2)
where V = pulse velocity (km/s), L = path length (cm), T = transit time (μs).
Based on this technique, the velocity of sound in a concrete is related to the concrete modulus
of elasticity:
V = --------------------------------------------------------------------------(2.3)
Where, E = modulus of elasticity, ρ=density of the concrete.
The transducer detects the pulses which reach first and it is usually the leading edge of the
longitudinal vibration. The positions of pulse velocity measurements are categorized in, a:
Opposite faces (direct transmission), b: Adjacent faces (semi-direct transmission) or c: Same
face (indirect or surface transmission) which are shown in Figure 2.6. In this study, the direct
method is used for test specimens.
Figure 2.6. Direct (a), Semi-direct (b) Indirect (surface) transmission (c).
Page 36
18
A number of studies have been conducted by various authors to correlate UPV and
compressive strength. According to ASTM C597-02, when circumstances permit, a velocity-
strength (or velocity modulus) relationship may be established by the determination of pulse
velocity and compressive strength (or modulus of elasticity) on a number of samples of a
concrete. This relationship may serve as a basis for the estimation of strength (or modulus of
elasticity) by further pulse-velocity tests on that concrete. The accuracy of the measurement
depends upon the ability of the operator to determine precisely the distance between the
transducers and of the equipment to measure precisely the pulse transit time. The received
signal strength and measured transit time are affected by the coupling of the transducers to
the concrete surfaces. Sufficient coupling agent and pressure must be applied to the
transducers to ensure stable transit times. The strength of the received signal is also affected
by the travel path length and by the presence and degree of cracking or deterioration in the
concrete tested.
According to Abo-Qudais (2005), the UPV on test specimen depends on aggregate size
distribution (maximum size of coarse aggregate), water-cement ratio and curing time. The
ultrasonic wave velocity in concrete decrease as the size of used coarse aggregate increase.
This effect is more significant in concrete with higher water–cement ratio. Ultrasound wave
velocity increases with curing time. However, the curing time effect is more significant at
higher water–cement ratios. The concrete strength increases as the size of used aggregate
decreases. This effect is more significant at short age and low water–cement ratio.
According to Al-Nu’man et al. (2015), coarse aggregate contend is a parameter which defines
the relationship between compressive strength and UPV. The equations developed by to Al-
Nu’man et al. (2015) are valid for 18 to 55 MPa concrete with various coarse aggregate
content. They developed the following equations to predict compressive strength of concrete.
fcu = 8.88 e (0.42v) for CA = 1000 kg/m3--------------------------(2.4) fcu = 0.06 e(1.60 v) for CA = 1200 kg/m3 ------------------------- (2.5) fcu = 1.03 e (0.87 v) for CA = 1300 kg/m3 ------------------------ (2.6) fcu = 1.39 e (0.78 v) for CA = 1400 kg/m3 ------------------------ (2.7)
Mohammed & Rahman(2016) carried out an experimental investigation to understand the
variation of ultrasonic pulse velocity (UPV) in concrete with the types of coarse aggregate
Page 37
19
and sand-to-aggregate volume ratio (s/a). The types of aggregate investigated were brick
chips, crushed stone, round shaped stone and black stone. Sand-to-aggregate ratios were 0.36,
0.40, and 0.44 and W/C ratios were 0.45, 0.50, and 0.55. Concrete specimens were made and
tested for UPV, compressive strength, and modulus of elasticity. They found that UPV in
concrete is significantly influenced by the types of aggregate and s/a ratio in addition to the
compressive strength of concrete. UPV in concrete is reduced with the increase of s/a ratio.
They proposed relationships between UPV and compressive strength, and UPV and modulus
of elasticity for different aggregates and s/a ratio investigated. For sand- to- aggregate ratio of
0.4 the following equation has been developed by the author:
f'c = 1.2003 e(0.000680 UPV) -------------------------------------------------(2.8)
EC = A* e(B*UPV*UPV)---------------------------------------------------------(2.9)
For equation, A & B are coefficient of exponential equation. EC and f'c are modulus of
elasticity and compressive strength in MPa. UPV is Ultrasound Pulse Velocity in m/s.
From the above discussion, it is apparent that UPV in concrete is dependent upon many
factors such as maximum size and type of aggregate, sand-to-aggregate ratio, water cement
ration, curing condition, age of specimen and strength of test specimen. So, no unique
relationship can be developed for all type of concrete mix. However, only varying strength of
concrete keeping other parameter constant, one may develop reliable equation to convert
between UPV and compressive strength.
2.6 Summary and discussion
Size and/or shape effect on compressive strength of concrete has been studied by many
authors; however no unique relationship has been obtained. Their relationship is modified by
many factors such as, strength level, age of specimen, aggregate size, curing condition,
capping method and consolidation method. As already discussed, their relationship is also
modified by wall effect. L’Hermite equation is sometime used to convert compressive
strength between standard cylinder and cube but their applicability in the case of concrete as
produced in Bangladesh needs to be evaluated.
At present there is no major study to convert strength between cylinder and cube in
Bangladesh. Although there are many studies carried out by various authors in different
countries and they did not find any specific relationship for various shapes and sizes. The
results of other authors may not be used in the context of materials as used in our country.
Page 38
20
Chapter 3
EXPERIMENTAL WORK
3.1 Introduction
The main goal of this study is to figure out the conversion factor between 6×12 in. (150×300
mm) cylinder and 4×8 in. (100×200 mm) cylinder; 6 in. (300 mm) cube and 4 in. (100 mm)
cube; and 6×12 in. cylinder and 6 in. cube. During the experimental study, six mix designs
with concrete target strength ranging from 7 MPa to 41 MPa were prepared and casted in
various shapes/sizes mold. A total of 54 nos. specimen (15 nos. 6×12 in. cylinder; 15 nos.
4×8 in. cylinder; 12 nos. 6 in. cube and 12 nos. 4 in. cube) were prepared for each concrete
mix i.e., total 324 nos. test specimen were prepared for six different strength of concrete. The
specimens were then cured under water in a water tank according to ASTM C 192/C 192M-
02 standard and tested for compressive strength at 7, 14 and 28 days as per ASTM C 39/C
39M standard. The following tests were also done as per relevant testing standard:
1. Slump test as per ASTM C143/C 143M-03.
2. Harden density at 7, 14 and 28 days as per ASTM 127.
3. Ultrasound Pulse Velocity (UPV) at 7, 14 and 28 days as per ASTM C 597-02.
4. Splitting tensile strength test on cylinders at 28 days as per ASTM C 496/C 496M-04.
5. Stress- diagram and static modulus of elasticity at 28 days as per ASTM C 469-02.
For casting concrete specimens, BDS EN 197-1:2003 type II (CEM II/B-M(S-V-L)) cement
of class 42.5 N was used. Stone chips obtained from boulder (from Bholagonj ) crushing as
coarse aggregate and Sylhet sand as fine aggregate and potable water were utilized for each
concrete mix.
Before beginning of casting, the following tests on both the fine and coarse aggregates were
done as per relevant testing standard:
1. Aggregate crushing value as per BS 812 (part 3) 1975.
2. Flakiness index as per BS812; Part1.
3. Sieve analysis as per ASTM C 136.
4. Bulk specific gravity (OD basis) as per ASTM C 127.
5. Apparent specific gravity (OD basis) as per ASTM C 127.
6. Absorption Capacity as per ASTM C 127.
Page 39
21
7. Dry rodded unit weight as per ASTM C 29.
8. Moisture content as per ASTM C 566-13.
It is mentioned here that initially it was planned to prepare 04 (four) concrete mixes and
materials were procured considering the quantity required for those mix design. However,
later it was extended to 06 (six) concrete mixes, so materials were procured 2nd time.
Adequate care was taken and materials were procured from same source. Therefore, in the 1st
phase of experimental work, target concrete strength ranges from 2000 psi to 5000 psi are
prepared. In the 2nd phase of testing, concrete target strength of 1000 psi and 6000 psi are
casted considering the procured material at the 2nd time.
3.2 Sieve analysis and aggregate properties
Sieve analysis was carried out as per ASTM C 136. This is used primarily to determine the
grading of materials proposed for use as aggregates. The results are used to determine
compliance of the particle size distribution with applicable specification requirements and to
provide necessary data for control of the production of various aggregate products and
mixtures containing aggregates. The results of sieve analysis for coarse aggregate are shown
in the table 3.1 below:
Table 3.1 Sieve analysis of stone chips procured at 1st phase
Sieve Material Percent of Cumulative Percent Fineness Modulus
Size Retained Material Retained % Retained Finer
mm gm % % % 50 0.0 0 0 100
37.5 0.0 0 0 100
25.4 394.0 4 4 96
19.05 5507.0 55 59 41
12.5 3509.0 35 94 6
9.5 444.0 4 98 2 7.41 (Seven Point Four One) 6.3 32.0 0 98 2
4.75 7.0 0 98 2
2.36 0.0 0 98 2
1.18 0.0 0 98 2
0.6 0.0 0 98 2
0.3 0.0 0 98 2
0.15 0.0 0 98 2
0.075 0.0 0 98 2
Pan 107.0 1 99
Total 10000.0
Page 40
22
Figure 3.1 shows the ASTM gradation limit (upper and lower limit) sample gradation curve
to understand whether the gradation curve of used materials in concrete mixes falls within the
limit as designated by ASTM C 136.
Figure 3.1 ASTM C 33 gradation chart and sample gradation curve(stone chips-1st phase).
It is evident from the above figure that the material gradation chart fall marginally within the
ASTM upper and lower limit. The fineness modulus was calculated using ASTM C 136.
Table 3.2 shows the result of sieve analysis of sylhet sand which has been used fine aggregate
in the concrete mix.
Table 3.2 Sieve analysis of Sylhet sand procured at 1st phase
Sieve Material Percent of Cumulative Percent Fineness Size Retained Material Retained % Retained Finer Modulus mm gm % % % 12.5 0.00 0 0 100 9.5 0.00 0 0 100 6.3 0.00 0 0 100 4.75 0.00 0 0 100 2.93
(Two point nine three)
2.36 35.40 7 7 93 1.18 128.20 26 33 67 0.6 171.50 34 67 33 0.3 104.70 21 88 12 0.15 49.60 10 98 2
0.075 7.60 2 100 0 Pan 3.00
Total 500.0 100
0
10
20
30
40
50
60
70
80
90
100
1 10 100
Pe
rce
nt
fin
er
Sieve size (mm)
Gradation Curve
ASTM Upper Limit
ASTM Lower Limit
Page 41
23
Figure 3.2 ASTM C 33 gradation chart and sample gradation curve(sand-1st phase)
It is observed from the above figure that gradation curve for Sylhet sand falls within the
gradation curve defined by ASTM upper and lower limit. The fineness modulus was
calculated using ASTM C 136.
Sieve analysis was also done for the materials used in the 2nd phase of experimental work.
Table 3.3 Sieve analysis of stone chips procured at 2nd phase
Sieve Size
Material Retained
Percent of Material Retained
Cumulative % Retained
Percent Finer
Remarks
mm gm % % % 50 0.0 0 0 100
37.5 0.0 0 0 100
25.4 0.0 0 0 100
19.05 5957.0 60 60 40
12.5 3601.0 36 96 4
7.60 (Seven point six zero)
9.5 384.0 4 100 0 6.3 46.0 0 100 0 4.75 0.0 0 100 0 2.36 0.0 0 100 0 1.18 0.0 0 100 0
0.6 0.0 0 100 0
0.3 0.0 0 100 0
0.15 0.0 0 100 0
0.075 0.0 0 100 0
Pan 12.0 0 100
Total 10000.0
0
10
20
30
40
50
60
70
80
90
100
0.01 0.1 1 10
Pe
rce
nt
fin
er
Seive Size (mm)
Gradation curve
ASTM upper limit
ASTM lower limit
Page 42
24
Figure 3.3 ASTM C 33 gradation chart and sample gradation curve(stone chips-2nd phase).
Table 3.3 shows the result of sieve analysis of stone chips and figure 3.3 shows the gradation
chart compared to the sample used in the current study. It is shown from the figure that the
coarse material gradation chart fall marginally within the ASTM upper and lower limit. The
fineness modulus was calculated using ASTM C 136. Table 3.4 below shows the result of
sieve analysis of sylhet sand.
Table 3.4 Sieve analysis of Sylhet sand procured at 2nd phase
Sieve Material Percent of Cumulative Percent Fineness
Size Retained Material Retained % Retained Finer Modulus
mm gm % % % 12.5 0.00 0 0 100 9.5 0.00 0 0 100 6.3 0.00 0 0 100 4.75 0.00 0 0 100 2.36 20.60 4 4 96 1.18 68.70 14 18 82 2.50 0.6 148.20 30 48 52 (Two point
five zero ) 0.3 174.00 35 83 17 0.15 72.30 14 97 3
0.075 12.90 3 100 0 Pan 3.30 0.7
Total 500.0
0
10
20
30
40
50
60
70
80
90
100
1 10 100
Pe
rcn
t Fi
ne
r
Particle size (mm)
gradation curve
ASTM lower limit
ASTM upper limitr
Page 43
25
Figure 3.4 ASTM C 33 gradation chart and sample gradation curve(sand-2nd phase).
It is evident from the above figure that gradation curve for Sylhet sand falls within the
gradation curve defined by ASTM upper and lower limit. Tables 3.5 and 3.6 summarized and
provided the comparison of the test results for different aggregate properties used in 1st and
2nd phase of experimental works.
Table 3.5 Comparison of different properties of Sylhet sand used at 1st and 2nd phases of
testing
Sl.
No
Test Name 1st phase 2nd phase
01 Fineness modulus 2.93 2.50
02 Bulk Specific Gravity(OD basis) 2.55 2.55
03 Apparent Specific Gravity (OD) 2.59 2.58
04 Absorption Capacity 1.56% 1.09%
05 Dry Rodded Unit Weight 1560 kg/m3 1590 kg/m3
06 Moisture Content 4.56 % 2.90%
0
10
20
30
40
50
60
70
80
90
100
0.01 0.1 1 10 100
Pe
rce
nt
Fin
er
Particle Size (mm)
Gradation chart
ASTM lower limit
ASTM upper limit
Page 44
26
Table 3.6 Comparison of different properties of stone chips used at 1st and 2nd phases of
testing
Sl.
No
Test Name 1st phase 2nd phase
01 Fineness modulus 7.41 7.60
02 Bulk Specific Gravity(OD basis) 2.63 2.64
03 Apparent Specific Gravity (OD) 2.65 2.65
04 Absorption Capacity 0.59% 0.46%
05 Dry Rodded Unit Weight 1540 kg/m3 1530 kg/m3
06 Moisture Content 0.60 % 0.14%
07 Aggregate Crushing Value 18% 20%
08 Flakiness Index 11% 13%
3.3 Mix design
Six different concrete strength were considered in the present study. The mix designs were
decided to be different in cement content and water/cement ratio. Table 3.7 shows the
quantity of material used in each of six mix designs. It is observed from the table that
quantity of fine and coarse aggregate was kept almost constant and the variable were water-
cement ratio and cement content. It is also considered 2% air content in all mixes.
Table 3.7 Quantity of materials for different concrete mixes
Mix Target strength (psi)
Cement (kg/m³)
Water (kg/m³) Fine aggregates (kg/m³)
Coarse aggregate (kg/m³)
Mix-1 1000 198 182 796 1186 Mix-2 2000 271 190 753 1130 Mix-3 3000 356 178 734 1102 Mix-4 4000 405 178 717 1075 Mix-5 5000 445 178 727 1090 Mix-6 6000 494 178 689 1034
Page 45
27
Water to cement ratio of different concrete mixes used as 0.92, 0.70, 0.50, 0.43, 0.40 and
0.36, respectively for mix 1 to 6. A concrete volume of 0.184 m3 was casted for each mix to
get 54 test samples. On a fresh concrete for each mix design, a slump test as a measure of
workability of concrete was done. On a hardened concrete, compressive strength tests at 7,
14, and 28 days and splitting tensile strength test at 28 days were performed. Also, a non-
destructive test such as ultrasonic pulse velocity (UPV) was carried out. Stress-strain diagram
of concrete specimen at 28 days was plotted for each concrete mix and a static modulus of
elasticity was determined for each strength level.
3.4 Material used in the present study
3.4.1 Cement
Portland composite cement widely known as PCC is used in the present study. This cement
complies with technical specification as per BDS EN 197-1:2003, CEM II/B-M (S-V-L), 42.5
N and ASTM C595. According to data provided by the cement manufacturer, the
composition of ingredients of cement used in the present such as Clinker : 65-79%; Slag, Fly
ash & Limestone : 21-35% and Gypsum : 0-5% as per version of the manufacturer.
3.4.2 Aggregate
Coarse aggregate: Natural stone chips were used as coarse aggregate. The stone chips were
obtained by crushing of boulder shipped from Bholagonj. Figures 3.5 and 3.6 show the
aggregates used in the present study.
Fine Aggregate: Natural Sylhet sand was used as fine aggregate.
Figure 3.5 Natural Sylhet Sand Figure 3.6 Natural stone chips
Page 46
28
3.4.3 Water
Tap water was used for casting all specimens (BS5328: Part 1, 2000).
3.5 Methodology
Six different concrete mixes were designed according to ACI mix design for normal strength
concrete. Considering the aggregate properties and following the method of weight batching,
06 (six) mixes were designed, casted in various shapes and sizes mold.
3.5.1 Casting of concrete
The process of batching, weighting and mixing of necessary materials were performed
according to ASTM standards. By using a concrete mixer machine, first coarse and fine
aggregate were mixed for about two minutes. After that cement was mixed and then water
was added to the blended materials and mixed for approximately 3 minutes. When a test on
fresh concrete (i.e. slump test) had to be performed, necessary sample was taken from fresh
concrete, test was executed and then, the utilized amount of concrete was poured back to the
source, blended once again to make homogeneous mix and then concrete was poured into the
moulds (ASTM C 192/C 192M-02). Due to limitation of mixing machine capacity, half of the
materials were mixed first time and then remaining half of the materials was mixed. Both the
mixes were poured back into the mixing machine again and mixed for 3 minutes. To get
uniform mix, machine-mix concrete was poured on clean, damp platform and remix by
trowel until it appears to be uniform. Figure 3.7 shows the mixing of concrete ingredients.
3.5.2 Compacting and curing
Preparation of satisfactory specimens requires different method of consolidation. The
methods of consolidation are rodding, and internal or external vibration. The selection
method is based on slump of fresh concrete. Rodding or vibration is done when slump of
concrete is greater than or equal to 1 in. Vibration is used when slump of fresh concrete is
less than 1 in.. In this research work, internal vibration was used to consolidate concrete.
4×8 in. cylinders were consolidated in two layers while 6×12 in. cylinders were consolidated
in three layers. For 6 in. cube and 4 in. cube vibration was done in two layers. The insertions
were distributed uniformly in each layer. The vibrator was allowed to penetrate 1 in. in each
layer. After each layer is vibrated, outside of the mold was tapped at least 10 times with the
mallet to close the holes that remain and to release the entrapped air voids (ASTM C 192/C
Page 47
29
192M-02). Figure 3.7 shows the mixing and 3.8 shows the placement and compaction of
concrete in a cylindrical mould.
Figure 3.7 Mixing of concrete ingredients
The objective of curing at normal temperature is to keep concrete saturated, or nearly
saturated as possible, until the water-filled space in the fresh concrete paste has been
occupied to the desired extent by the products of hydration of cement. The necessity of curing
arises from the fact that hydration of cement can take place only in water filled capillaries.
This is why loss of water by evaporation from the capillaries must be prevented. Adequate
care was taken after casting of concrete into the mold to prevent moisture loss. After being
kept for approximately 24 hours into the molds, the specimens were taken to water tank kept
there until their testing age (ASTM C 192/C 192M-02).
Page 48
30
Figure 3.8 Placing and compacting of concrete.
3.6 Test on fresh concrete
3.6.1 Workability test
The only test, performed on fresh concrete mixes, was slump test. The experiments were
performed according to ASTM C 143/C 143M-03. In this test, a sample of freshly mixed
concrete is placed and compacted by rodding in a mold shaped frustum of a cone. The mold
is raised, and the concrete allowed subsiding. The vertical distance between the original and
displaced position of the center of the top surface of the concrete is measured and reported as
slump of the concrete. Figure 3.9 shows typical slump test on a fresh concrete.
3.7 Test on hardened concrete
A total of five tests has been conducted to evaluate the hardened properties of concrete for
each concrete mix. Concrete compressive strength, splitting tensile strength, UPV, density
and stress-strain diagram with static modulus of elasticity are determined for each strength.
Details of the test are provided in the next sub-sections.
Page 49
31
Figure 3.9 Slump test on a fresh concrete
3.7.1 Compressive strength test
In this research, as concrete specimens were chosen from different sizes and shapes, for
executing compressive strength test, different standards were followed. For measurement of
compressive strength of cubes, BS EN 12390-3:2009 was used. Compressive strength test of
cylindrical specimens were carried out according to ASTM C39/C39M– 01. Testing cylinders
in compressive strength has an additional stage of capping. Various types of capping such as
sulphur capping, neoprene rubber pad etc. are widely used around the world. In the present
study, neoprene rubber pad is used as a capping of the tested specimens as typically is shown
in Figure 3.10.
The load was applied at a rate of movement (platen to crosshead measurement)
corresponding to a loading rate on the specimen within the range of 20 to 50 psi/s [0.15 to
0.35 MPa/s]. The designated rate of movement was maintained at least during the latter half
of the anticipated loading phase of the testing cycle. During the application of the first half of
the anticipated loading phase a higher rate of loading was allowed. No adjustment in the rate
of movement of the platen was made at any time while the specimen is yielding rapidly
immediately before failure. The load was applied until the specimen fails, and the maximum
load carried by the specimen was recorded during the test. Type of failure and the appearance
Page 50
32
of the concrete were noted. Figure 3.11 shows the test set up for determining compressive
strength of concrete.
Figure 3.10 Top and bottom capping of 4×8 in. cylinder
Figure 3.11 Testing Machine and test set up.
3.7.2 Splitting Tensile strength test
Splitting tensile test was also carried out on both the small and large size cylinders at the age
of 28 days. Specimens were properly placed into the machine to be tested. The following
equation was used to calculate splitting tensile strength of concrete specimen:
T = ---------------------------------------------------------------- (3.1)
Page 51
33
Where,
T = Splitting tensile strength, psi.
P = Maximum applied load indicated by the testing machine, lbf.
l = Length, in..
d = Diameter, in..
The splitting tensile strength test was carried out according to ASTM C 496/C 496M-04.
Figure 3.12 shows the typical tensile strength test up.
Figure 3.12 Typical Splitting tensile strength test set up.
3.7.3 Concrete density
Determination of hardened density was done according to ASTM C 138/C 138M–01a. For a
cylindrical specimen, diameter was measured two times at right angles and average was taken
for calculation. Also length was measured two times and average was taken for calculation.
Volume was then determined. In case of cubic specimen, three dimensions were measured
and volume was then determined. The weight of the tested specimen is measured and the
density of the hardened concrete is determined from the measured volume and weight data.
Page 52
34
3.7.4 Ultrasound pulse velocity test (UPV)
This test was done following the standard ASTM C 597-02. Ultrasonic pulse velocity test is
one of the non-destructive experiments carried out to assess the uniformity and relative
quality of concrete, to indicate the presence of voids and cracks, and to evaluate the
effectiveness of crack repairs. It is also applicable to indicate changes in the properties of
concrete, and in the survey structures, to estimate the severity of deterioration or cracking.
When circumstances permit (in this research), a velocity-strength relationship may be
established by the determination of pulse velocity and compressive strength on a number of
samples of a concrete. This relationship may serve as a basis for the estimation of strength by
further pulse-velocity test on that concrete (ASTM C 597-02).
Pulses of longitudinal stress waves are generated by an electro-acoustical transducer that is
held in contact with one surface of the concrete under test. After traversing through the
concrete, the pulses are received and converted into electrical energy by a second transducer
located a distance L from the transmitting transducer. The transit time T is measured
electronically. The pulse velocity V is calculated by dividing L by T. Sometimes length of
the specimen can be given as input in the UPV machine, and in this case velocity can be
directly obtained (ASTM C 597-02).
Appropriate coupling agent (ultrasound gel) was used to the transducer faces. The transducers
were then firmly placed against the surfaces of concrete test specimen to get the stable transit
time in micro seconds. Length of the specimen was assigned as input in the UPV machine
and velocity was obtained directly from machine readings. Figure 3.13 presents the typical
arrangements for UPV tests for concrete.
Page 53
35
Figure 3.13 Ultrasound Pulse Velocity test
3.7.5 Stress-strain diagram and static modulus of elasticity
For each concrete strength, 3 cylinders (4×8 in.) were casted for determining stress-strain
diagram of concrete. For calculating stress-strain diagram, dial gauge of 1 micro meter
precision was used. From the stress-strain diagram, static modulus of elasticity of concrete
was determined in accordance with ASTM C 469-2. Figure 3.14 shows the typical test set up
for determining stress-strain diagram in the elastic range. The following equation as
suggested in ASTM C 469-02 was used for calculating static modulus of elasticity:
E = (S2 – S1) / (ɛ 2 - 0.000050) ----------------------------------------------------------(3.2)
Where,
E= Chord modulus of elasticity.
S2 = Stress corresponding to 40% of ultimate load.
S1 = Stress corresponding to a longitudinal strain, ɛ 1, of 50 millionths, psi and ɛ 2 = Longitudinal strain produced by stress S2.
Page 54
36
Figure 3.14 Typical test up with dial gauge for determining modulus of elasticity
3.8 Summary
A total of 324 nos. samples (90 nos. 6×12 in. cylinders; 90 nos. 4×8 in. cylinder; 72 nos. 6 in.
cube and 72 nos. 4 in. cube) have been prepared and tested for unit weight, compressive
strength, splitting tensile strength, static modulus of elasticity and UPV to study the effect of
size and shape of test specimens. During the experimental study, 06(six) strength levels (mix
design) i.e., 1000 psi to 6000 psi were obtained by mostly varying water-cement ratio, and
other parameters such as maximum size of coarse aggregate, properties of fine and coarse
aggregate and their quantity and air content (2 percent considered) were almost kept the
same. Parameters like curing condition, capping method and consolidation method and
testing method were controlled as per relevant standards (ASTM and BS) for the entire test
program.
Page 55
37
Chapter 4
RESULTS AND DISCUSSION
4.1 Introduction
The experiments conducted were briefly explained in the previous chapter. In this chapter,
the outcomes of those mentioned experiments will be shown; graphs and findings from
analyses will be presented, followed by discussions about each of the results.
The experiments carried out were slump test (for fresh concrete), hardened density, ultrasonic
pulse velocity test (PUNDIT) which is a non-destructive test on hardened concrete,
compressive strength, splitting tensile strength test (destructive tests on hardened concrete)
and finally stress-strain diagram of concrete. For each test, results will be presented and
discussed.
4.2 Test on fresh concrete
For each mix design, slump test was performed as workability measure of fresh concrete. The
results are presented in Table 4.1 below.
Table 4.1 Slump test results of different concrete mixes
Mix Design Specified Strength, MPa(psi) Slump, mm(in.)
mix-1 7(1000) 150(6.0)
mix-2 14(2000) 100(4.0)
mix-3 21(3000) 69(2.75)
mix-4 28(4000) 37(1.5)
mix-5 34(5000) 30(1.2)
mix-6 41(6000) 12(0.5)
Specimens with different concrete strength were prepared by mostly varying water-cement
ratio and cement content keeping the water content almost the same. As no chemical
admixture was used in any concrete mix, lower range of water-cement ratio such as mix -6
results higher strength but with lower slump value. On the other hand, the water-cement ratio
was highest for concrete mix-1 and strength obtained was the lowest for the said mix. The
Page 56
38
gradual low slump is indicative of using lower water-cement ratio of subsequent mixes. The
experiment was performed as per ASTM C 143/C 143M.
4.3 Experiments on hardened concrete (non-destructive)
Hardened properties of concrete such as unit weight and Ultrasound Pulse Velocity (UPV)
through concrete specimen were determined following relevant codes.
4.3.1 Hardened unit weight of concrete
On each concrete strength, hardened concrete unit weight test was performed according to
ASTM C 138. Table 4.2 shows the average hardened density for each experiment’s condition.
Table 4.2 Unit weight of different concrete mixes
Specified
Strength(MPa)
Unit Weight (kg/m3 ) Average unit
weight
(kg/m3) 6×12 in.
(150×300
mm)
4×8 in.
(100×200
mm)
6 in.
cube(150
mm)
4 in.
cube(100mm)
7 2395 2382 2348 2340 2366
14 2371 2357 2335 2332 2348
21 2399 2395 2382 2357 2383
28 2390 2409 2363 2299 2365
34 2387 2343 2365 2314 2352
41 2414 2429 2384 2422 2412
Average 2392 2385 2362 2344
It is shown from Table 4.2 that unit weight of cylindrical specimens is comparatively higher
than that of cube specimen. Also, larger cylinders have higher unit weight than smaller
cylinders. This is due to the fact that three layer of compaction was done for 6×12 in.
cylinders compared to 4×8 in. cylinders in which two layer of compaction was done. Except
few exceptions, the unit weight of cylindrical specimen is higher for each mix design as well
compared to cube specimens.
Page 57
39
4.3.2 Ultrasound Pulse Velocity (UPV)
Ultrasound Pulse Velocity (UPV) test was performed on each test specimen at 7, 14 and 28
days as per ASTM 597-02. The results are summarized in Table 4.3 and Table 4.4 below for
28-days as most design specification refers to the compressive strength of concrete at 28-
days. UPV vs. splitting tensile strength is summarized at Table 4.5. For sand to aggregate
ratio of 0.4 (0.4 is used in present study) the following equation has been developed by
Mohammed & Rahman (2016) for 4×8 in. cylinder. The applicability of the eq(4.1) is
evaluated in the Table 4.3 below.
f'c = 1.2003 e(0.000680 UPV) -------------------------------------------------(4.1)
where, f'c and UPV are in MPa and m/s respectively.
Table 4.3 Ultrasound Pulse Velocity (m/s) and compressive strength (MPa) of cylinders
Specified
Strength(MPa)
Strength
obtained
(MPa)
6×12 in. cylinder 4×8 in. cylinder
Strength (MPa)
UPV (m/s)
Strength (MPa)
UPV (m/s)
1.2003 e(0.000680
UPV) 7 7.1 7.1 4236 9 4336 22.8
14 11.9 11.9 4292 13 4328 22.8
21 19.3 19.3 4699 19.5 4328 22.8
28 31.2 31.2 4611 35.5 4723 29.8
34 34.3 34.3 4657 38.5 4812 31.6 41 49 49 4712 56 4964 35.1
Table 4.4 Ultrasound Pulse Velocity (m/s) and compressive strength (MPa) of cubes
Specified
Strength(MPa)
Strength
obtained (MPa)
6 in. cube 4 in. cube
Strength (MPa)
UPV (m/s) Strength (MPa)
UPV (m/s)
7 7.1 11.5 4460 12 4426
14 11.9 17.5 4467 18.5 4457
21 19.3 28 4699 26.5 4903
28 31.2 39 4786 45.1 4822
34 34.3 41.5 4736 45.5 4903
41 49 53 4925 55 5230
Page 58
40
Figure 4.1 Compressive Strength vs. UPV (6×12 in. Cylinder)
Different trends can be seen among different size and shape of test specimens as evident from
Figures 4.1 to 4.4. This difference can be related to size/shape effect, according to which,
different compressive strengths are resulted from different size/shape specimens. Also
coefficient determinations are different for different size/shape specimens. The coefficients of
determination are found as low as 0.64 for 6×12 in. cylinder to as high as 0.94 for 6 in. cube.
Figure 4.2 Compressive Strength vs. UPV (4×8 in. Cylinder)
R² = 0.6429
0
10
20
30
40
50
60
4000 4500 5000 5500
Co
mp
ress
ive
Str
en
gth
(M
Pa)
Ultrasound Pulae Velocity (m/s)
6x12 inch cylinder
R² = 0.9386
0
10
20
30
40
50
60
4000 4500 5000 5500
Co
mp
ress
ive
Str
en
gth
( M
Pa)
Ultrasound Pulse Velocity (m/s)
4x8 inch cylinder
Page 59
41
Figure 4.3 Compressive Strength vs. UPV (6 in. Cube)
It is evident from the data summarized in Table 4.3 & and Table 4.4 subsequent Figures 4.1
to 4.4 that for the same strength grade different pulse velocities obtained for different
size/shape samples. This indicates that the pulse velocity is not only affected by the strength
grade of the sample but also the size/shape of the test specimen.
Figure 4.4 Compressive Strength vs. UPV (4 in. Cube)
R² = 0.7875
0
10
20
30
40
50
60
4000 4500 5000 5500
Co
mp
ress
ive
Str
en
gth
( M
Pa)
Ultrasound Pulse Velocity (m/s)
4 in. cube
R² = 0.9402
0
10
20
30
40
50
60
4000 4500 5000 5500
Co
mp
ress
ive
Str
en
gth
( M
Pa)
Ultrasound Pulse Velocity (m/s)
6 in. cube
Page 60
42
Table 4.5 UPV (m/s) and tensile strength (MPa) for different concrete mixes
Specified Strength (MPa)
Strength obtained(MPa)
6×12 in. cylinder 4×8 in. cylinder
UPV(m/s) Tensile Strength(MPa)
UPV(m/s) Tensile Strength(MPa)
7 7.1 4277 1.25 4448 1.5
14 11.9 4204 1.5 4274 1.8
21 19.3 4543 2.2 4660 2.1
28 31.2 4628 2.4 4705 3.1
34 34.3 4603 3.0 4737 3.3
41 49 4755 3.5 4964 3.8
In Table 4.5, UPV and their corresponding tensile strength are shown. In general, with the
increase in tensile strength, the value of UPV increases. Figure 4.5 has been plotted both for
6×12 in. cylinder and 4×8 in. cylinder.
Figure 4.5 Tensile Strength vs. UPV
It is evident from above Figures 4.5 that in general with the increase of tensile strength the
value of UPV increases. The coefficient of determination is found to be 0.861 for 6×12 in.
cylinder and 0.780 for 4×8 in. cylinder.
R² = 0.8614 R² = 0.7805
0
0.5
1
1.5
2
2.5
3
3.5
4
4000 4500 5000 5500
Ten
sile
Str
en
gth
(M
Pa)
UPV (m/s)
6x12 inch cylinder
4x8 inch cylinder
Page 61
43
4.4 Experiments on hardened concrete (destructive)
Splitting tensile strength and compressive strength tests were performed on concrete
specimens. Relationships have been developed between splitting tensile strength and
compressive strength of concrete and are compared with relevant code equations.
Relationship between compressive strength of various shape and size test specimens were
also developed.
4.4.1 Splitting tensile strength
In this experimental investigation, splitting tensile strength test was performed on both 6×12
in. and 4×8 in. cylindrical samples, cured in water, at the age of 28 days. Outcomes of the
experiment are shown in Table 4.5 and 4.6. The Table has several sections showing tensile
strength according to various mix designs for 6×12 in. and 4×8 in. samples and predicting
model considering the baseline equation of ACI (American Concrete Institute). The ACI
equation for predicting tensile strength of a sample is shown as below:
Tensile Strength = 7.5 x c -----------------------------------------------------------------(4.2)
Where f’c is the compressive strength of concrete sample in psi.
However, it is seen from the Figure 4.6 below that the following equation will provide better
agreement with the tensile strength of concrete samples based on obtained compressive
strength of concrete.
Tensile Strength = 5.79 x c ---------------------------------------------------------------(4.3)
Where f'c is the compressive strength of concrete sample in psi.
Page 62
44
Figure 4.6 c vs tensile strength.
Table 4.6 Conversion between compressive strength (psi) and splitting tensile strength (psi)
for 6×12 in. cylinder
Specified
Strength
(psi)
Mix 6×12 in. cylinder
UPV Tensile
Strength
Compressive
Strength (f’c ) 5.79 x c 7.5x c
1000 Mix-1 4277 180 1030 185 240
2000 Mix-2 4204 225 1720 240 310
3000 Mix-3 4543 320 2790 305 395
4000 Mix-4 4628 345 4530 390 505
5000 Mix-5 4603 430 4980 408 530
6000 Mix-6 4755 500 7110 488 630
y = 5.7908x R² = 0.9822
0
100
200
300
400
500
600
0 10 20 30 40 50 60 70 80 90
Ten
sile
Str
en
gth
(p
si)
√ f'c
Series1
Page 63
45
Table 4.7 Conversion between compressive strength (psi) and splitting tensile strength (psi)
for 4×8 in. cylinder
Specified
Strength
(psi)
Mix 4×8 in. cylinder
UPV Tensile
Strength(psi)
Compressive
Strength (f’c ) 5.79x c 7.5 x c
1000 Mix-1 4448 210 1280 205 270
2000 Mix-2 4274 260 1880 250 325
3000 Mix-3 4660 310 2870 310 400
4000 Mix-4 4705 445 5150 415 540
5000 Mix-5 4737 475 5500 429 555
6000 Mix-6 4964 562 8160 525 680
It is evident from Table 4.6 and 4.7 that eq.(2) predict more closely the tensile strength of
stone aggregate concrete usually produced/used in construction in our country. The variation
from ACI recommended equation may be due to the fact that various ingredients used to
produce concrete in our country are different than that used in USA.
4.4.2 Compressive strength test
The most extensive experiment was compressive strength test during this study. A total of
three factors were investigated to figure out their influence on the compressive strength. The
factors are three different ages, six different concrete mixes and finally, moulds’ shapes and
sizes. The employed moulds were 2 different cubes (4 in. and 8 in.) and two different
cylinders (4×8 in. and 6×12 in.). Three samples were casted for each batch of testing in order
to minimize scatters and errors in results and analyses.
In addition, three samples (4×8 in.) from each concrete mix, stress-strain curves are plotted
by using Universal Testing Machine and dial gauge.
Page 64
46
Table 4.8 Compressive strength of cylinder and cube specimens
Specified
strength
(MPa)
W/C Slump
(mm)
Age
(day)
Compressive Strength (MPa) Mode of
Failure at
28 days 6×12 in.
cylinder
4×8 in.
cylinder
6 in.
cube
4 in.
cube
7 0.92 150 7 3.5 5.7 7.2 5.8 Mortar 14 5.8 7.4 8.9 9.3 28 7.1 8.8 11.3 12.1
14 0.70 100 7 8.1 8.4 13.3 11.7 Mortar 14 9.9 10.9 15.4 15.6 28 11.9 12.9 17.5 18.6
21 0.50 69 7 12.7 12.8 16.3 18.9
Combined
14 16.3 17.3 22.1 19.4 28 19.3 19.8 28.2 26.5
28 0.43 37 7 19.8 22.9 27.8 33.3 14 26.4 29.3 33.5 34.5 28 31.2 35.5 39 45.1
34 0.40 30 7 27.5 31.4 33.6 29.8 14 26 30.8 38.4 41.3 28 34.3 38.5 41.5 45.7
41 0.36 12 7 39.9 45 43.8 47.8 14 43 50.6 47.7 52.1 28 49 56.3 53 54.9
A common observation from many experimental works on the size effect in the strength of
concrete is that the specimen of smaller size has the higher compressive strength (Neville,
1966). From the above Table 4.8, it is evident that the smaller size cylinder specimen has
higher compressive strength than that of larger size cylinder, and also the smaller cube has
comparatively higher compressive strength than that of larger cube. It is generally true that
cubes with same lateral dimension or smaller have higher compressive strength than that of
cylinders for the similar mix and lateral dimension, which can also be visualized from above
Table 4.8. In few cases, the results are not in accordance with common observation on the
size effect in the strength of concrete. For example, the bold marks on the strength of small
cube actually have lesser strength than their counterpart i.e. 6 in. cube. This may be attributed
to improper placing /compacting/curing /testing/strength gain with age /wall effect of the said
specimens. Figures 4.7 to 10 show water-cement ratio vs compressive strength of various size
specimens tested at 28-day. From the figures, it is apparent that the compressive strength
Page 65
47
decrease exponentially with the increase of water cement ratio. From regression analysis, the
coefficients of determination are found to be 0.948, 0.878, 0.974 and 0.946, respectively.
Figure 4.7 Water-cement ratio vs. compressive strength of 6×12 in. cylinder specimens
Figure 4.8 Water- cement ratio vs. compressive strength of 4×8 in. cylinder specimens
R² = 0.948
0
10
20
30
40
50
60
0 0.2 0.4 0.6 0.8 1
Co
mp
ress
ive
Str
en
gth
(M
Pa)
Water cement ratio (W/C)
6x12 in cylinder
R² = 0.878
0
10
20
30
40
50
60
0 0.2 0.4 0.6 0.8 1
Co
mp
ress
ive
Str
en
gth
(M
Pa)
Water cement ratio (W/C)
4x8 inch cylinder
Page 66
48
Figure 4.9 Water-cement ratio vs. compressive strength of 6 in. cube specimens
Figure 4.10 Water-cement ratio vs. compressive strength of 4 in. cube specimens
4.4.3 Correlation between strength of cylinders
In our country, design specifications refer to the compressive strength obtained from either
testing 6×12 in. concrete cylinder or 6 in. concrete cube and tested as per relevant standards.
However, 4×8 in. cylinders are almost exclusively used in our country nowadays considering
testing machine capacity, ease of handling, cost of materials etc. Also, ASTM C192 and
R² = 0.974
0
10
20
30
40
50
60
0 0.2 0.4 0.6 0.8 1
Co
mp
ress
ive
Str
en
gth
(M
Pa)
Water cement ratio (W/C)
6 inch cube
R² = 0.946
0
10
20
30
40
50
60
0 0.2 0.4 0.6 0.8 1
Co
mp
ress
ive
Str
en
gth
(M
Pa)
Water cement ratio (W/C)
4 inch cube
Page 67
49
AASHTO R39 allow the use of 4×8 in. cylinders for quality assurance testing. Therefore, a
correlation between concrete compressive strengths of using cylinders and cube specimens
are necessary. The subsequent tables and figures will illustrate the conversion factors
between 6×12 in. cylinder and 4×8 in. cylinder. The conversion factors will be evaluated
with respect to 6×12 in. cylinder.
Table 4.9 Conversion factors between cylinder specimens
Specified
strength
(MPa)
Age (day) Compressive Strength
(MPa)
Conversion
factors
7-day &
14-day
strength as
percentage
of 28-day
strength
(4×8 in.)
7-day & 14-day strength as percentage of 28-day strength (6×12 in.)
6×12 in.
cylinder
4×8 in.
cylinder
7 7 3.5 5.7 1.60 64.5% 50.2% 14 5.8 7.4 1.28 83.9% 81.8% 28 7.1 8.8 1.25 - -
14 7 8.1 8.4 1.04 64.5% 67.9 14 9.9 10.9 1.10 83.9% 83.6 28 11.9 12.9 1.09 - -
21 7 12.7 12.8 1.01 54.2% 65.8 14 16.3 17.3 1.06 87.4% 84.4 28 19.3 19.8 1.03 - -
28 7 19.8 22.9 1.16 64.6% 63.4 14 26.4 29.3 1.11 82.4% 84.5 28 31.2 35.5 1.14 - -
34 7 27.5 31.4 1.14 81.5% 80.1 14 26 30.8 1.18 80.0% 75.8 28 34.3 38.5 1.12 - -
41 7 39.9 45 1.12 80.0% 81.5 14 43 50.6 1.18 89.8% 87.7 28 49 56.3 1.15 - -
It is useful to determine conversion factor at 28-day as most of the specification indicate 28-
day strength of concrete is specified as design strength and is used for quality assurance
testing. From the above Table 4.9, it is also apparent that the conversion factors do not follow
a specific pattern i.e. the conversion factor is not dependent of age and compressive strength
Page 68
50
of concrete specimen. If we consider 28-day strength to determine conversion factor, the
average value of conversion factor is 1.13 with a standard deviation and coefficient of
variation are 0.07 and 6.2%, respectively. Another way to say that small size cylinder
strength will be 13% more than that of standard cylinder strength in an average.
It is also interesting to note the strength gain at 7-day and 14-day as a percentage of 28 day
strength. Sometime it is required to predict 28-day strength form early strength data for
acceptance of a batch of concrete. From Table 4.9, it is apparent that up to 31 MPa concrete
7-day strength may be taken as 65% of 28 day strength and 14-day strength may be taken as
85% of 28-day strength. For 31 to 49 MPa, 7-day strength may be taken as 81% of 28 day
strength and 14-day strength may be taken as 87% of 28-day strength.
Figure 4.11 Seven-day strength of standard and small size cylinder specimens
From the above Figure 4.11, it is shown that for larger water-cement ratio, the difference in
strength between the standard and smaller size cylinder strength is comparatively smaller
than that of lower water-cement ratio.
0
10
20
30
40
50
60
0 0.2 0.4 0.6 0.8 1
Co
mp
ress
ive
Str
en
gth
(M
Pa)
Water cement ratio (W/C)
6x12 inch cylinder
4x8 inch cylinder
Page 69
51
Figure 4.12 Fourteen-day strength of standard and small size cylinder specimens
From the above Figure 4.12, it is observable that for larger water cement ratio, the difference
in strength between standard and small cylinder strength is smaller than that of lower water
cement ratio. Both graphs almost merge at water/cement ratio of 0.5. After that the difference
in strength increases again.
Figure 4.13 Twenty eight-day strength of standard and smaller size cylinder specimens
From the above Figure 4.13, it is observable that for larger water cement ratio, the difference
in strength between standard and small cylinder strength is comparatively smaller than that of
0
10
20
30
40
50
60
0 0.2 0.4 0.6 0.8 1
Co
mp
ress
ive
Str
en
gth
(M
Pa)
Water cement ratio (W/C)
6x12 inch cylinder
4.8 inch cyinder
0
10
20
30
40
50
60
0 0.2 0.4 0.6 0.8 1
Co
mp
ress
ive
Str
en
gth
(M
Pa)
Water cement ratio (W/C)
6x12 inch cylinder
4.8 inch cyinder
Page 70
52
lower water cement ratio. Both graphs almost merge at water/cement ratio 0.5. After that the
difference in strength increases again.
4.4.4 Correlation between strength of cubes
In our country, design specifications refer to the compressive strength obtained from either
testing 6×12 in. concrete cylinder or 6 in. concrete cube and tested as per relevant standards.
However, 4 in. cubes are sometimes prepared for quality assurance testing. Therefore,
correlations between concrete compressive strengths of using different size cube specimens
are necessary. The subsequent Tables and Figures will illustrate the conversion factors
between 6 in. cube and 4 in. cube. The conversion factors will be evaluated with respect to 6
in. cube.
Table 4.10 Conversion factors between 6 in. and 4 in. cube specimens
Specified
strength
(MPa)
Age (day) Compressive Strength
(psi)
Conversion
factors
7-day &
14-day
strength as
percentage
of 28-day
strength (4
in. cube)
7-day & 14-day strength as percentage of 28-day strength (6 in. cube)
6 in. cube 4 in. cube
7 7 7.2 5.8 0.82 48.1% 63.4% 14 8.9 9.3 1.05 76.6% 78.7% 28 11.3 12.1 1.07 - -
14 7 13.3 11.7 0.88 63.1% 76.2% 14 15.4 15.6 1.02 84.1% 88.1% 28 17.5 18.6 1.06 - -
21 7 16.3 18.9 1.15 71.1% 57.9% 14 22.1 19.4 0.88 73.3% 78.4% 28 28.2 26.5 0.94 - -
28 7 27.8 33.3 1.20 73.9% 71.3% 14 33.5 34.5 1.03 76.5% 85.9% 28 39 45.1 1.15 - -
34 7 33.6 29.8 0.89 65.3% 80.9% 14 38.4 41.3 1.07 90.0% 92.5% 28 41.5 45.7 1.10 - -
41 7 43.8 47.8 1.09 87.1% 82.7% 14 47.7 52.1 1.09 94.8% 90.0% 28 53 54.9 1.04 - -
Page 71
53
It is useful to determine conversion factor at 28-day as most of the specification indicate 28-
day strength of concrete is specified as a design strength and is used for quality assurance
testing. From the above Table 4.10, it is also apparent that the conversion factors do not
follow a specific pattern i.e. the conversion factor is not dependent of age and compressive
strength of concrete specimen. If we consider 28-day strength to determine conversion factor,
the average value of conversion factor is 1.06 with a standard deviation and coefficients of
variation are 0.07 and 6.6%, respectively. Another way to say that small cube strength will be
6% more than standard cube strength on an average.
It is also interesting to note the strength gain at 7-day and 14-day as a percentage of 28 day
strength. Sometime it is required to predict 28-day strength form early strength data for
acceptance of a batch of concrete. From the Table, it is apparent that strength gain does not
follow specific pattern. 7-day and 14-day strength gain as a percentage of 28-day strength
vary from 63% to 87% for small size cube.
It is apparent that for specified strength of 7 MPa, 7-day strength of small cube is only about
48% of 28-day strength which is unusual and may be attributable to improper
placing/compacting/curing/testing of the sample. It is apparent from the Table 4.10 that for
larger cube and for specified strength of 34 MPa and 41 MPa, 7-day and 14-day strengths
may be taken as 80% and 90% of 28-day strength, respectively. However, for lower strength
level the data does not fit well in any pattern.
Page 72
54
Figure 4.14 Seven-day strength of standard and small size cube specimens.
From the above Figure 4.14, it is observed that for larger water-cement ratio up to 0.6, the
standard cube (6 in.) strength is higher. Both graphs almost merge at water/cement ratio of
0.6. After that the strength of smaller cube is higher that standard cube. It is observed from
the above graph that strength of small cube actually decrease when water cement ratio
decreases from 0.43 to 0.40 which is an exception. The anomaly may occur due to improper
placing/compaction/curing/testing of said concrete samples.
Figure 4.15 Fourteen-day strength of standard and small size cube specimens
0
10
20
30
40
50
60
0 0.2 0.4 0.6 0.8 1
Co
mp
ress
ive
Str
en
gth
(M
Pa)
Water cement ratio (W/C)
6 inch cube
4 inch cube
0
10
20
30
40
50
60
0 0.2 0.4 0.6 0.8 1
Co
mp
ress
ive
Str
en
gth
(M
Pa)
Water cement ratio (W/C)
6 inch cube
4 inch cube
Page 73
55
From the above Figure 4.15, it is shown that for larger water-cement ratio up to 0.7, the
difference of strength between standard cube and smaller cube is small compared to other
water cement ratios. It is interesting to note that at a water-cement ratio 0.5, the standard cube
strength is higher. This anomaly may be explained by improper placing/curing/compacting/
wall effect /testing of said samples.
Figure 4.16 Twenty Eight-day strength of standard and small size cube specimens
From the above Figure 4.16, it is shown that for larger water-cement ratio up to 0.7, the
difference of strength between standard cube and smaller cube is small compared to other
water cement ratios. It is interesting to note that at water cement ration 0.5, the standard cube
strength is higher. This anomaly may be explained by improper placing/curing/compacting/
testing/wall effect of said samples.
4.4.5 Correlation between strength of cylinder and cube
Correlation coefficient between compressive strength of standard cylinder (6×12 in.) and
standard cube (6 in.) will be determined in the subsequent section. Coefficients are
determined with respect to standard cube (as denominator). It is observed from previous
Table 4.10 that strength gains with respect to age are not consistent in case of cube specimens
(both standard and small cube), so conversion factor will be evaluated on the basis of 28-day
0
10
20
30
40
50
60
0 0.2 0.4 0.6 0.8 1
Co
mp
ress
ive
Str
en
gth
(M
Pa)
Water cement ratio (W/C)
6 inch cube
4 inch cube
Page 74
56
strength. It is also evident from the below Table 4.10 that the conversion factors at 14-day
and 7-day do not follow any specific pattern. Figure 4.17 has been plotted considering all the
Table 4.11 Conversion factors between 6x12 in. cylinder and 6 in. cube
Specified
strength
(MPa)
Age (day) Compressive Strength (MPa) Conversion factor
6×12 in. cylinder 6 in. cube
7 7 3.5 7.2 0.50 14 5.8 8.9 0.65 28 7.1 11.3 0.62
14 7 8.1 13.3 0.60 14 9.9 15.4 0.64 28 11.9 17.5 0.68
21 7 12.7 16.3 0.77 14 16.3 22.1 0.73 28 19.3 28.2 0.68
28 7 19.8 27.8 0.71 14 26.4 33.5 0.78 28 31.2 39 0.80
34 7 27.5 33.6 0.82 14 26 38.4 0.68 28 34.3 41.5 0.83
41 7 39.9 43.8 0.91 14 43 47.7 0.90 28 49 53 0.92
Figure 4.17 Compressive strength vs. conversion factors
R² = 0.763
0
0.1
0.2
0.3
0.4
0.5
0.6
0.7
0.8
0.9
1
0 10 20 30 40 50 60
Co
nve
rsio
n f
acto
r
Compressive strength of standard cube (MPa)
Conversion factor
Page 75
57
conversion factors. From the above Figure 4.17 the coefficient of determination is found to be
0.763. Due to inconsistent strength gain at 7-day and 14-day, this low value of coefficient of
determination is observed. In the subsequent section, 28-day strength will be considered for
evaluation of conversion factors and applicability of widely used L’Hermite’s equation.
This problem of finding conversion factor has been studied by many authors notably
L’Hermite and Adam M. Neville. L’Hermite proposed below equation for evaluating the
conversion factors:
= 0.76 + 0.2 ------------------------ (4.4)
Adam M. Neville proposed following equation irrespective of strength of cube specimen. He
finds a fixed conversion factor which is 0.81. His generalized equation is as below:
= 0.56 + 0.687 ( ) ------------------------ ---------- (4.5)
Where, h = height of 6×12 in. cylinder
And V = Volume of 6×12 in cylinder.
Cylinder strength and cube strength are in psi unit.
As fixed ratio was not obtained in this research, so applicability of widely used L’Hermite
equation will be considered in the subsequent section. Also, LGED/REB has their own
conversion factors to convert cylinder strength to cube strength. Applicability of these
conversion factors will also be considered. It is hypothesized that due to difference in
concrete constituents in Bangladesh compared to other countries where those equations were
developed, the conversion factor will be different than that predicted by L’Hermite equation.
The below Table 4.12 is prepared to depict comparative scenario. Figure 4.18 below
represent the ratio (cylinder/cube) vs cube strength as predicted by L’Hermite equation and as
found from present study.
Page 76
58
Table 4.12 Conversion factors between 6×12 in. cylinder and 6 in. cube (28-day)
Specified
strength (psi)
Age
(day)
Compressive Strength
(psi)
Conversion factor Conversion factor
6×12 in.
cylinder
6 in. cube Predicted by
L’Hermitte equation
1000 28 1030 1640 0.63 0.71 2000 28 1720 2540 0.68 0.75 3000 28 2790 4090 0.68 0.79 4000 28 4530 5660 0.80 0.82 5000 28 4980 6020 0.83 0.83 6000 28 7110 7690 0.92 0.85
Figure 4.18 Conversion between the cylinder and cube strengths of concrete
y = 1.1866x R² = 0.9361
0
10
20
30
40
50
60
70
0 10 20 30 40 50 60
Cu
be
Str
en
gth
(M
Pa)
Cylinder Strength (MPa)
Cube Strength
Linear (Cube Strength)
Page 77
59
Figure 4.19 Cube strength vs. cylinder/cube ratio (L’Hermite & present study)
The following equation as obtained from Figure 4.18 above with coefficient of determination
0.983 will be used to convert cylinder strength to cube strength.
fcu = 1.186 fcyl --------------------------------------------- (4.6)
Where fcu and fcyl are 6 in. cube strength and 6×12 in. cylinder strength in MPa respectively.
LGED, Bangladesh has a comprehensive chart to convert cylinder strength to cube strength.
The comparative scenario is depicted in the Table 4.13 below.
Table 4.13 Conversion factors as recommended by LGED, Bangladesh
Cylinder Strength (MPa)
Proposed by LGED
Cube strength (MPa)
Proposed by LGED
Cube strengths from
present study (MPa)
Percent
variation 7 9 8.3 8.4%
10 13 11.9 9.2%
15 19 17.8 6.7%
20 25 23.7 5.5%
25 31 29.7 4.3%
30 37 35.6 4%
35 44 41.5 6%
40 50 47.5 5.3%
0
0.1
0.2
0.3
0.4
0.5
0.6
0.7
0.8
0.9
1
0 2000 4000 6000 8000 10000
Cyl
ind
er/
Cu
be
Cube Strength (psi)
PresentStudy(Cylinder/Cube)L'Hermite Equation(Cylinder/Cube)
Page 78
60
Figure 4.20 Cylinder and cube strength (LGED recommendation and present study)
From the above Table 4.13 and Figure 4.20, it is evident that LGED overestimates cube
strength for concrete ranges from 7 to 40 MPa. The percent variation ranges from 4% to 9.2%
and again the variation is not significant.
Table 4.14 Conversion factors between 4×8 in. cylinder and 4 in. cube specimens
Specified
strength
(MPa)
Age
(day)
Compressive Strength
(MPa)
Conversion
factor from
present study
Conversion factor
4×8 in.
cylinder
4 in. cube Proposed by REB
7 28 8.8 12.1 1.38 1.20 for less than 28 MPa 14 28 12.9 18.6 1.44
21 28 19.8 26.5 1.34 1.15 between 28 to 49 MPa 28 28 35.5 45.1 1.27
34 28 38.5 45.7 1.19 1.10 for more than 49 MPa 41 28 56.3 54.9 0.98
0
10
20
30
40
50
60
0 10 20 30 40 50
Cu
be
Str
en
gth
(M
Pa)
Cylinder Strength (MPa)
Cube strength (MPa)Proposed by LGED
Cube strengths frompresent study (Mpa)
Page 79
61
In the above Table 4.14, conversion factor with respect to 4×8 in. cylinder has been shown as
obtained in the present study. Correspondingly REB recommended values have been shown
in the right most column. In Figure 4.21, cylinder strength vs cube strength has been plotted
to find the trend line and following conversion equation is obtained:
fcu = 1.118 fcyl ----------------------------------------------------------(4.7)
Where fcu and fcyl are 4 in. cube strength and 4×8 in. cylinder strength in MPa respectively.
Figure 4.21 Cylinder strength vs. cube strength found in the present study
Table 4.15 Conversion between cylinder to cube strength
Cylinder Strength (MPa)
Proposed by REB
Cube strength (MPa)
Proposed by REB
Cube Strengths from present
study (psi) 8.8 10.5 9.8 12.9 15.5 14.4 19.8 23.8 22.0 35.5 40.8 39.7 38.5 44.3 43.0 56.0 62.0 63.0
y = 1.1183x R² = 0.9029
0
10
20
30
40
50
60
70
0 10 20 30 40 50 60
Cu
be
Str
en
gth
(M
pa)
Cylinder Strength (MPa)
4 inch cube
Page 80
62
Figure 4.22 REB cube strength vs. cube strength from present study
Comparison between the cube strength as proposed by REB and from the present study has
been shown in Figure 4.22. It is evident that for cylinder strengths between 8.8 to 56.0 MPa,
there is not much difference between REB cube strength and strength of cube found from
present study.
4.5 Stress-Strain diagram
For each concrete strength level, 3 cylinders (4×8 in.) were casted for drawing stress-strain
diagram. For drawing stress-strain diagram dial gauge of 1 micro meter precision was used.
From the stress-strain diagram, static modulus of elasticity of concrete was determined in
accordance with ASTM C 469.
4.5.1 Static modulus of elasticity
The following equation as suggested in ASTM C 469 was used for calculating static modulus
of elasticity:
E = (S2 – S1) / (ɛ 2 - 0.000050) ----------------------------------------------------------(4.8)
0
10
20
30
40
50
60
70
0 10 20 30 40 50 60
Cu
be
Str
en
gth
(M
pa)
Cylinder Strength (MPa)
Cube strength (MPa)Proposed by REB
Cube Strengths frompresent study (psi)
Page 81
63
Where,
E= Chord modulus of elasticity.
S2 = Stress corresponding to 40% of ultimate load.
S1 = Stress corresponding to a longitudinal strain, ɛ 1, of 50 millionths, psi and ɛ 2 = Longitudinal strain produced by stress S2.
4.5.2 Static modulus of elasticity for specified strength 7 MPa
For each concrete mix, three specimens were casted for drawing stress-strain diagram. The
following stress-strain diagrams are chronologically for specimen-1, specimen-2 and
specimen-3 as shown in figures 4.23 to 4.25, respectively. Table 4.16 shows the summarized
values for three specimens.
Figure 4.23 Stress-strain diagram for specimen-1 for specified strength 7 MPa
0
100
200
300
400
500
600
700
0 0.00005 0.0001 0.00015 0.0002 0.00025
Stre
ss (
psi
)
Strain (in/in)
Page 82
64
Figure 4.24 Stress-strain diagram for specimen-2 for specified strength 7 MPa
Figure 4.25 Stress-strain diagram for specimen-3 for specified strength 7 MPa
0
100
200
300
400
500
600
0 0.00005 0.0001 0.00015 0.0002 0.00025
Stre
ss (
psi
)
Strain (in/in)
0
100
200
300
400
500
600
700
0 0.00005 0.0001 0.00015 0.0002 0.00025
Stre
ss (
psi
)
Strain (in/in)
Page 83
65
Table 4.16 Static modulus of elasticity for specified strength 7 MPa
Specimen ID Compressive
strength (psi)
S2 (psi) S1 (psi) ɛ 2(in/in) Modulus of
Elasticity
(ksi)
Predicted by
57000x c
(ksi)
Specimen-1 832 333 159 0.00011 2900 1600
Specimen-2 1140 456 186 0.00014 3000 1900
Specimen-3 832 333 150 0.000112 2900 1600
4.5.3 Static modulus of elasticity for specified strength 14 MPa
For each mix, three specimens were casted for drawing stress-strain diagram. The following
stress-strain diagrams are chronologically for specimen-1, specimen-2 and specimen-3 as
shown in figures 4.26 to 4.28, respectively.
Figure 4.26 Stress-strain diagram for specimen-1 for specified strength 14 MPa
0
200
400
600
800
1000
1200
0 0.00005 0.0001 0.00015 0.0002 0.00025 0.0003 0.00035 0.0004
(str
ess
(p
si)
Strain (in/in)
Page 84
66
Figure 4.27 Stress-strain diagram for specimen-2 for specified strength 14 MPa
Figure 4.28 Stress-strain diagram for specimen-3 for specified strength 14 MPa
Table 4.17 presents the modulus of elasticity values for specified strength of 14 MPa for all
the three specimens.
0
100
200
300
400
500
600
700
800
900
0 0.0001 0.0002 0.0003 0.0004 0.0005 0.0006 0.0007
Stre
ss (
psi
)
Strain (in/in)
0
100
200
300
400
500
600
700
800
900
1000
0 0.00005 0.0001 0.00015 0.0002 0.00025 0.0003 0.00035
Stre
ss (
psi
)
Strain (in/in)
Page 85
67
Table 4.17 Static modulus of elasticity for specified strength 14 MPa
Specimen ID Compressive
strength (psi)
S2 (psi) S1 (psi) ɛ 2(in/in) Modulus of
Elasticity
(ksi)
Predicted by
57000x c
(ksi)
Specimen-1 2150 860 105 0.000302 3000 2600
Specimen-2 1473 589 57 0.00058 1000 2200
Specimen-3 1828 731 123 0.000253 3000 2400
4.5.4 Static modulus of elasticity for specified strength 21MPa
For each mix, three specimens were casted for drawing stress-strain diagram. The following
stress-strain diagrams are chronologically for specimen-1, specimen-2 and specimen-3 as
shown in figures 4.29 to 4.31, respectively.
0
200
400
600
800
1000
1200
1400
1600
0 0.00005 0.0001 0.00015 0.0002 0.00025 0.0003 0.00035 0.0004 0.00045
Stre
ss (
psi
)
Strain (in/in)
Figure 4.29 Stress-strain diagram for sample-1 for specified strength 21 MPa
Page 86
68
Figure 4.30 Stress-strain diagram for specimen-2 for specified strength 21 MPa
Figure 4.31 Stress-strain diagram for specimen-3 for specified strength 21 MPa
Table 4.18 presents the modulus of elasticity values for specified strength of 21 MPa for all
the three specimens.
0
200
400
600
800
1000
1200
1400
1600
0 0.0001 0.0002 0.0003 0.0004 0.0005
Stre
ss (
psi
)
Strain (in/in)
0
200
400
600
800
1000
1200
1400
1600
0 0.00005 0.0001 0.00015 0.0002 0.00025 0.0003 0.00035
Stre
ss (
psi
)
Strain (in/in)
Page 87
69
Table 4.18 Static modulus of elasticity for specified strength 21 MPa
Specimen ID Compressive
strength (psi)
S2 (psi) S1
(psi) ɛ 2(in/in) Modulus of
Elasticity
(ksi)
Predicted by
57000x c
(ksi)
Specimen-1 2570 1028 280 0.0003 3000 2900
Specimen-2 2688 1075 294 0.00031 3000 3000
Specimen-3 3029 1211 413 0.00021 5000 3100
4.5.5 Static modulus of elasticity for specified strength 28 MPa
For each mix, three specimens were casted for drawing stress-strain diagram. The following
stress-strain diagrams are chronologically for specimen-1, specimen-2 and specimen-3 as
shown in figures 4.32 to 4.34, respectively.
Figure 4.32 Stress-strain diagram for specimen-1 for specified strength 28 MPa
0
500
1000
1500
2000
2500
0 0.0001 0.0002 0.0003 0.0004 0.0005 0.0006
Stre
ss (
psi
)
Strain (in/in)
Page 88
70
Figure 4.33 Stress-strain diagram for specimen-2 for specified strength 28 MPa
Figure 4.34 Stress-strain diagram for specimen-3 for specified strength 28 MPa
Table 4.19 presents the modulus of elasticity values for specified strength of 28 MPa for all
the three specimens.
0
500
1000
1500
2000
2500
0 0.0002 0.0004 0.0006 0.0008 0.001
Stre
ss (
psi
)
Strain(in/in)
0
500
1000
1500
2000
2500
0 0.0001 0.0002 0.0003 0.0004 0.0005
Stre
ss (
psi
)
Strain (in/in)
Page 89
71
Table 4.19 Static modulus of elasticity for specified strength 28 MPa
Specimen ID Compressive
strength (psi)
S2 (psi) S1
(psi) ɛ 2(in/in) Modulus of
Elasticity
(ksi)
Predicted by
57000x c
(ksi)
Specimen-1 4199 1679 311 0.000393 4000 3700
Specimen-2 4362 1744 306 0.00053 3000 3800
Specimen-3 4667 1867 360 0.000353 5000 3900
4.5.6 Static modulus of elasticity for specified strength 34 MPa
For each mix, three specimens were casted for drawing stress-strain diagram. The following
stress-strain diagrams are chronologically for specimen-1, specimen-2 and specimen-3 as
shown in figures 4.35 to 4.37, respectively.
Figure 4.35 Stress-strain diagram for specimen-1 for specified strength 34 MPa
0
500
1000
1500
2000
2500
3000
0 0.0001 0.0002 0.0003 0.0004 0.0005 0.0006 0.0007 0.0008
Stre
ss (
psi
)
Strain (in/in)
Page 90
72
Figure 4.36 Stress-strain diagram for specimen-2 for specified strength 34 MPa
Figure 4.37 Stress-strain diagram for specimen-3 for specified strength 34 MPa
Table 4.20 presents the modulus of elasticity values for specified strength of 34 MPa for all
the three specimens.
0
500
1000
1500
2000
2500
3000
0 0.0001 0.0002 0.0003 0.0004 0.0005 0.0006 0.0007 0.0008
Stre
ss (
psi
)
Strain (in/in)
0
500
1000
1500
2000
2500
3000
0 0.0002 0.0004 0.0006 0.0008
Stre
ss (
psi
)
Strain (in/in)
Page 91
73
Table 4.20 Static modulus of elasticity for specified strength 34 MPa
Specimen ID Compressive
strength (psi)
S2 (psi) S1
(psi) ɛ 2(in/in) Modulus of
Elasticity
(ksi)
Predicted by
57000x c
(ksi)
Specimen-1 5394 2157 153 0.00055 4000 4200
Specimen-2 5342 2137 103 0.00072 3000 4200
Specimen-3 5466 2186 353 0.000508 4000 4200
4.5.7 Static modulus of elasticity for specified strength of 41MPa
For each mix, three specimens were casted for drawing stress-strain diagram. The following
stress-strain diagrams are chronologically for specimen-1, specimen-2 and specimen-3 as
shown in figures 4.38 to 4.40, respectively.
Figure 4.38 Stress-strain diagram for specimen-1 for specified strength 41 MPa
0
500
1000
1500
2000
2500
3000
3500
4000
0 0.0002 0.0004 0.0006 0.0008 0.001
Stre
ss (
psi
)
Strain (in/in)
Page 92
74
Figure 4.39 Stress-strain diagram for specimen-2 for specified strength 41 MPa
Figure 4.40 Stress-strain diagram for specimen-3 for specified strength 41 MPa
Table 4.21 presents the modulus of elasticity values for specified strength of 41 MPa for all
the three specimens.
0
500
1000
1500
2000
2500
3000
3500
4000
0 0.0002 0.0004 0.0006 0.0008 0.001
Stre
ss (
psi
)
Strain (in/in)
0
500
1000
1500
2000
2500
3000
3500
4000
0 0.0002 0.0004 0.0006 0.0008 0.001 0.0012
Stre
ss (
psi
)
Strain (in/in)
Page 93
75
Table 4.21 Static modulus of elasticity for specified strength 41 MPa
Specimen ID Compressive
strength (psi)
S2 (psi) S1
(psi) ɛ 2(in/in) Modulus of
Elasticity
(ksi)
Predicted by
57000x c
(ksi)
Specimen-1 7527 3010 289 0.00073 4000 5000
Specimen-2 7939 3175 300 0.000625 5000 5100
Specimen-3 7634 3053 341 0.00095 3000 5000
Table 4.22 Summary of findings from stress-strain test data
Specified
Strength(psi)
Specimen ID Compressive
Strength (psi)
Modulus of
Elasticity
(ksi)
Predicted by
57000x c
(ksi)
% variation
1000 Specimen-1 830 2900 1600 44.82%
Specimen-2 1140 3000 1900 36.66%
Specimen-3 830 2900 1600 44.82%
2000 Specimen-1 2150 3000 2600 13.33%
Specimen-2 1470 1000 2200 -120%
Specimen-3 1830 3000 2400 20%
3000 Specimen-1 2570 3000 2900 3.33%
Specimen-2 2690 3000 3000 0.0%
Specimen-3 3030 5000 3100 38%
4000 Specimen-1 4200 4000 3700 7.5%
Specimen-2 4360 3000 3800 -26.66%
Specimen-3 4670 5000 3900 22%
5000 Specimen-1 5390 4000 4200 -5%
Specimen-2 5340 3000 4200 -40%
Page 94
76
Specified
Strength(psi)
Specimen ID Compressive
Strength (psi)
Modulus of
Elasticity
(ksi)
Predicted by
57000x c
(ksi)
% variation
Specimen-3 5470 4000 4200 -5%
6000 Specimen-1 7530 4000 5000 -25%
Specimen-2 7940 5000 5100 -2%
Specimen-3 7630 3000 5000 -66.66%
From the Table as shown 4.22 above, modulus of elasticity may be taken equal to
57000x c as mentioned by ACI code. From the above Table, few results are not in
accordance with ACI projected values which may be due to experimental errors.
4.6 Failure pattern
Figure 4.41 below shows the different satisfactory failure pattern for Cylinder and cube as
described in ASTM C39/ C39M and BS 1881-116: 1983.
Figure 4.41 Satisfactory failure patterns for cylinder and cube
Page 95
77
4.6.1 Failure types of concrete specimen for specified strength 7 MPa
(a) (b)
Figure 4.42 Failure pattern of (a) 4 ×8 in. and (b) 6×12 in. cylinders specimen
From the above Figure 4.42, it is evident that the crack pattern is columnar type. Cement
paste which binds the aggregate together is very low strength type, so mortar failure is
observed with columnar cracking.
(a) (b)
Figure 4.43 Failure pattern of 6 in. (a) and 4 in. cubes (b)
From the above Figure 4.43, it is evident that the crack pattern is non explosive type. Cement
paste which binds the aggregate together is very low strength type, so mortar failure is
observed with non explosive cracking.
Page 96
78
4.6.2 Failure types of concrete specimen for specified strength 14 MPa
Figure 4.44 Failure type for large and small size cylinder specimens
From the above Figure 4.44, it is evident that the crack pattern is columnar type. Cement
paste which binds the aggregate together is very low strength type (specified strength of
concrete is 2000 psi), so mortar failure is observed with columnar cracking. Also cracking
lines are more densely spaced that the specimen of specified strength 1000 psi as shown in
Figure 4.46.
4.6.3 Failure types of concrete specimen for specified strength 34 MPa
The failure type is different for higher strength concrete. The cement paste that binds the
aggregate together is of higher strength and this type of failure is always combined and
explosive in nature. Figure 4.45 shows the failure type of cylindrical specimen both 6×12 in.
and 4×8 in..
Page 97
79
Figure 4.45 Shows the failure type of concrete cylinder specimens
From the figure, it is evident that the failure type is shear and explosive as well as the failure
is combined in nature. The cylinder take load gradually upto a pick and then sudden
explosion would occur during the failure. For concrete of specified strength of 6000 psi
similar pattern of failures were observed.
From Figure 4.46, failure pattern is semi explosive (left) and explosive (right) in nature
(a) (b)
Figure: 4.46 Failure pattern is semi-explosive (a) and explosive (b)
Page 98
80
From the Figure 4.47, it is shown below, the failure is obtained combined.
Figure: 4.47 Tensile splitting surface for 6×12 and 4×8 in. cylinder
4.7 Summary:
In this chapter, the effect of specimen size and shape on concrete compressive strength have
been evaluated using the test results found in Chapter 3. From the study, it is found that
smaller size cylinder specimen has higher compressive strength than that of larger sizes and
the same trend is followed for the cube specimens. The ratio of compressive strength of 4×8
in. cylinder specimens to that of 6×12 in. specimens is 1.13 on an average with coefficient of
variation of 6.2 percent. The average ratio of compressive strength of 4 in. cube specimens to
that of 6 in. is approximately 1.06 with coefficient of variation of 6.6 percent. The ratios of
compressive strength between standard cylinder to standard cube are dependent on strength
of concrete and the ratios increases with the increase of strength. Using L’Hermite equation
to convert standard cube strength to cylinder strength is not conservative for strength level
between 7 and 41 MPa in case of concrete produced in our country. For the strength range
between 41 MPa to 53 MPa, L’Hermite equation yields conservative values. LGED
overestimates cube strength for concrete ranges from 7 to 40 MPa. The percent variation
ranges from 4% to 9.2% and again the variation is not significant. For strength ranges
between 10.5 to 62 MPa, there is not much difference between REB cube strength and
strength of cube found from the present study.
6×12 in. cylinder
4 x8 in. cylinder
Page 99
81
Chapter 5
CONCLUSIONS AND RECOMMENDATIONS
5.1 General
The effect of size and shape of test specimens on compressive strength of normal strength
concrete and correlating the strength of concrete considering different size and shape of
specimens used in Bangladesh were the main objectives of this study. Most of the design
specification of Bangladesh refers to either the strength of 6×12 in. cylinder or 6 in. cube.
However, smaller cylinder/cube are used for quality assurance testing in laboratory
considering the testing machine capacity or ease of handling. For this reason, relationship is
required to be developed between various size samples. In this research, various relationships
have been proposed: UPV versus compressive strength of various size/shape test specimens;
correlation coefficient among various size/shape test specimens’ strengths; UPV versus
splitting tensile strength. The applicability of widely used L’Hermite equation to convert
standard cube strength to cylinder strength was also evaluated in this research. In addition,
government organizations such as LGED, REB etc. have used their own conversion factors to
convert standard cube strength to cylinder strength in technical specification of various
projects. The applicability of this conversion factor is evaluated as well. From the ACI
proposed equation, it is known that splitting tensile strength of concrete is dependent on
compressive strength of concrete and ACI proposes equation to determine splitting tensile
strength from compressive strength of concrete. The applicability of ACI equation in the
context of materials used in our country was evaluated in this study. ACI also proposes
equation to get static modulus of elasticity from compressive strength of concrete. The
viability of this equation is evaluated in this study. From the literature review, it is known that
correlation coefficient between compressive strengths of different shapes/sizes specimen is
dependent on strength level of specimens, age of specimen, maximum aggregate size,
capping method, mold material consolidation method and curing condition. However,
varying these factors such as capping method, mold material, consolidation method and
curing condition will violate AASHTO and ASTM standards. In this research, these were
done as per ASTM standards. Only variable was strength level and age of specimen as
maximum size of aggregate was also kept the same throughout the experimental study.
Strength of concrete was varied by mostly varying water-cement ratio keeping the other
ingredients to be the same.
Page 100
82
5.2 Conclusions
Based on the experimental work done on various shape/size concrete test specimens and
correlation study among them, the following conclusions can be drawn for size and shape
effects including other general findings:
1. Unit weight of cylindrical specimens is comparatively higher than that of cube
specimens. Also, larger size cylinder specimens have higher unit weight than that of
smaller size specimens. This is due to the fact that three layer of compaction was done
for 6×12 in. cylinder specimens compared to 4×8 in. cylinder specimens in which two
layer of compaction was done.
2. For the same strength grade, different pulse velocities obtained using UPV tests for
different size/shape samples. This indicates that the pulse velocity is not only affected
by the strength grade of the sample but also the size/shape of the test specimen.
3. The relationship between the splitting tensile strength and compressive strength may
be expressed using the obtained results as 5.79 x c in comparison to 7.5 x c as
proposed by ACI.
4. The smaller size cylinder specimen has higher compressive strength than that of the
larger size specimen for the same concrete mix. The same trend is obtained for cube
specimens.
5. The ratio of compressive strength of 4x8 in. cylinder specimen to that of 6x12 in.
cylinder have been determined at 28-day. The average value of conversion factor is
1.13 with a standard deviation and coefficient of variation are 0.07 and 6.2%,
respectively. Another way to say that smaller size cylinder specimen results 13%
higher strength than that of standard cylinder strength in an average.
6. The ratio of compressive strength of 4 in. cube specimen to that of 6 in. specimen
have been determined at 28-day. The average value of conversion factor is 1.06 with a
standard deviation and coefficients of variation are 0.07 and 6.6%, respectively. That
Page 101
83
means, smaller size cube strength will have only 6% higher strength results than that
of the standard cube specimens.
7. Correlation coefficients between compressive strength of standard cylinder (6 ×12 in.)
and standard cube (6 in.) have been determined at 7, 14 and 28 days. Coefficients are
determined with respect to standard cube (as denominator). It is observed that at 28-
day strength, the ratios increase with the increase of strength of standard cube. Using
L’Hermite equation to convert standard cube strength to cylinder strength is not
conservative for strength level between 7 MPa and 41 MPa in case of concrete
produced in our country. For the strength range between 41 MPa to 53 MPa,
L’Hermite equation yields conservative values.
8. LGED overestimates cube strength for concrete ranges from 7 to 40 MPa. The percent
variation ranges from 4% to 9.2% and again the variation is not significant. For
strength ranges between 10.5 to 62 MPa, there is not much difference between REB
cube strength and strength of cube found from the present study.
9. The static modulus of elasticity as predicted by the ACI equation 57000x c is
shown good agreement with the test results.
5.3 Limitations
1. The materials were carried in two phases and the grain size distribution of coarse
aggregate marginally fall with the lower limit.
2. For all sample sizes ¾ inch downgraded coarse aggregate was used. For this reason
impact of maximum size of coarse aggregate on shape and size effect was not
incorporated in this study.
3. Only standard size samples have been studied.
5.4 Recommendations for the Future Study
It is recommended that the study can be extended further in the following fields:
Page 102
84
1. The conversion ratios vary with the maximum size of coarse aggregate. So, future
study may be carried out to find the effect of different size coarse aggregate on the
size/shape effect (conversion ratios).
2. Effect of type of coarse aggregate (Brick chips, rounded stone aggregate, black stone
chips etc) may be considered to assess the size/shape effect on strength of concrete.
3. Different Prism shape may be considered for the preparation of test specimens.
4. UPV in concrete is dependent upon many factors such as maximum size and type of
aggregate, sand-to-aggregate ratio, water-cement ratio, curing condition, age of
specimen and strength of test specimens. Future study may look into those factors.
Page 103
85
R E F E R E N C E S
AASHTO R39 (2017), Standard Practice for Making and Curing Concrete Test Specimens in
the Laboratory. American Association of State and Highway Transportation Officials,
Washington DC 20001, USA.
Abo-Qudais, S.A. (2005). Effect of Concrete Mixing Parameters on Propagation of
Ultrasound Waves. Construction and Building Materials, Vol. 19, No. 4, pp.257-263.
Al-Nu’man B.S., Aziz B.R., Abdulla S.A. and Khaleel S.E.(2015). Compressive Strength
Formula for Concrete using Ultrasonic Pulse Velocity. International Journal of Engineering
Trends and Technology (IJETT) – Volume 26, No. 1.pp.9-14.
Arioz, O., Ramyar, K., Tuncan, M., Tuncan, A., & Cil, I. (2007). Some Factors Influencing
Effect of Core Diameter on Measured Concrete Compressive Strength. ACI Materials
Journal, Vol. 104. Issue. 3, pp.291-296.
ASTM C192/C192M(2016), Standard Practice for Making and Curing Concrete Test
Specimens in the Laboratory. ASTM International, West Conshohocken,PA, USA.
ASTM C136-01(2001), Standard Test Method for Sieve Analysis of Fine and Coarse Aggregates. ASTM International, West Conshohocken,PA, USA.
ASTM C496/C 496M (2004), Standard Test Method for Splitting Tensile Strength of
Cylindrical Concrete Specimens. ASTM International, West Conshohocken,PA, USA,
ASTM C 143/C 143M (2003), Standard Test Method for Slump of Hydraulic-Cement
Concrete. ASTM International, West Conshohocken,PA, USA.
ASTM C 617-98 (2003), Standard Practice for Capping Cylindrical Concrete Specimens.
ASTM International, West Conshohocken,PA, USA.
Page 104
86
ASTM C 469-02 (2002), Standard Test Method for Static Modulus of Elasticity and
Poisson’s Ratio of Concrete in Compression. ASTM International, West Conshohocken,PA,
USA.
ASTM C597 (2002). Standard Test Method for Pulse Velocity Through Concrete. ASTM
International, West Conshohocken, PA, USA.
ASTM C39/C39M-01 (2001). Standard Test Method for Compressive Strength of Cylindrical Concrete Specimens, West Conshohocken, PA, USA. ASTM C127-01 (2001). Standard Test Method for Density, Relative Density (Specific Gravity), and Absorption of Coarse Aggregate, West Conshohocken, PA, USA. ASTM C 29/C 29M – 97 (2003). Standard Test Method for Bulk Density (“Unit Weight”) and Voids in Aggregate, West Conshohocken, PA, USA.
ASTM C 566 – 97 (2004). Standard Test Method for Total Evaporable Moisture Content of Aggregate by Drying, West Conshohocken, PA, USA.
Baalbaki, W., Baalbaki, M., Benmokrane, B., and P. C. Aitcin. (1992). Influence of Specimen
Size on Compressive Strength and Elastic Modulus of High-Performance Concrete. Cement,
Concrete, and Aggregates Vol.14, No.2, pp.113-117.
Banda M.S., Hossain M.S., and Amin M.R. (2013). A Study on Cube and Cylinder Strength
of Brick Aggregate Concrete. IOSR Journal of Mechanical and Civil Engineering (IOSR-
JMCE), Vol. 9, Issue 3, pp. 65-72.
Bazant, Z. P. (1984). Size Effect in Blunt Fracture: Concrete, Rock and Metal. Journal of
Engineering Mechanics, ASCE, Vol. 110, No. 4, pp. 518-535.
Bažant, Z. P., & Planas, J. (1998). Fracture and Size Effect in Concrete and Other
Quasibrittle Materials. CRC Press.
BS 1881: Part 1125. (1986). Methods for Mixing and Sampling Fresh Concrete in the
Laboratory. British Standards Institution.
Page 105
87
BS 1881 : Part 114. (1983). Methods for Determination of Density of Hardened Concrete.
British Standards Institution.
BS 1881 : Part 116 . (1983). Method for Determination of Compressive Strength of Concrete
Cubes . British Standards Institution.
BS5328 : Part 1. (2000). Guide to Specifying Concrete. British Standards Institution.
BS 812 : part 3. (1975). Methods for Determination of Mechanical Properties of Aggregates.
British Standards Institution.
BS 812 : part 1. (1975). Methods for Determination of Particle Size and Shape. British
Standards Institution.
BS EN 197-1. (2003). Composition, Specifications and Conformity Criteria for Common
Cements. . British Standards Institution.
BS EN 12390-1. (2009). Testing hardened Concrete. Compressive strength of test specimens. .
British Standards Institution.
. Burg, R. G. (1996). The Influence of Casting and Curing Temperature on the Properties of
Fresh and Hardened Concrete. Portland Cement Association, Research and Development
Bulletin RD113T.
Cordon, W. A., and H. A. Gillespie. (1963). Proceedings ACI Journal, Vol.60 (8),pp. 1029-
50.
Dehestani M., Nikbin I.M., and Asadollahi S. (2014). Effect of Specimen Shape and Size on
Compressive Strength of Self-Consolidating Concrete (SCC). Construction and Building
Materials, Vol. 38, pp.685-691.
Del Viso, J., Carmona, J., & Ruiz, G. (2008). Shape And Size Effects On The Compressive
Strength Of High-Strength Concrete. Cement and Concrete Research , Vol. 38; Issue No. 3,
pp.386–395.
Page 106
88
Gilkey, H. J. 1961. Water/cement Ratio versus Strength-Another Look. Journal of the
American Concrete Institute, Vol. 2, No.58, pp.1851-1878.
Glover, J. M. And J. M. Stallings. (2000). High-Performance Bridge Concrete. Highway
Research Center, Auburn University.
Gonnerman, H. F. (1925). Effect of Size and Shape of Test Specimen on Compressive
Strength of Concretes. Structural Materials Research Laboratory, Vol.25, Part 2, pp.1-21.
Kosmatka, S. H., Kerkhoff, B., and W. C. Panarese. (2002). Design and Control of Concrete
Mixtures 14th Ed. Portland Cement Association.
Lessard, M. And P.C. Aitcin. (1992). Testing High Performance Concrete. High Performance
Concrete.Y Malier ed. E & FN Spon Publishers.
Mahure, N.V., Vijh, G.K., Sharma, P., Sivakumar, N., and Ratnam, M.(2011). Correlation
between Pulse Velocity and Compressive Strength of Concrete. International Journal of Earth
Science and Engineering, Volume 04, No 06 SPL, pp 871-874.
Mali S., Pachpande T., and Kothrud A. J. (2015). Effect of Rate of Loading on Compressive
Strength of Concrete. International Journal of Innovation and Emerging Research in
Engineering, Volume 2, Issue 4, pp. 20-25.
Mehta, P. K. And Monteiro, J. M. (1993). Concrete Microstructure Properties and Materials.
The McGraw-Hill Companies, Inc. New York, NY.
Meyer, A. (1963). On the Effect of the Water-Cement Ratio on the Early Strength of
Concrete Vol. 29. No. 8. Aug. 1963b. Pp. 391-394.
Mohammed, T.U. and Rahman, M.N. (2016). Effect of Types of Aggregate and Sand-to-
Aggregate Volume Ratio on UPV in Concrete. Construction and Building Materials, Vol.125,
pp. 832-841.
Page 107
89
Nassar, K. W. And A. A. Al-Manaseer. (1987). It’s Time for a Change from 6 x 12- to 3 x 6-
inch Cylinders. ACI Materials Journal,Vol. 84 (3), pp. 213-216.
Neville,A.M.(1966).A General Relation for Strengths of Concrete Specimens of Different
Shapes and Sizes. Journal of the American Concrete Institute, Vol. 63, No. 10, pp.1095-1109.
Neville, A. M. (2002). Properties of concrete. John Wiley & Sons.
Neville A. M. And Brooks J. J. (2007). Concrete Technology. 2nd edition, Published by
Dorling Kindersley (India) Pvt. Ltd.
Sim J., Yang K., Jeon J. (2013). Influence of Aggregate Size on the Compressive Size Effect
According to Different Concrete Types. Construction and Building Materials, Vol. 44,
pp.716-725.
Sim J., Yang K., Kim H., and Choi B. (2013). Size and Shape Effect of Compressive Strength
of Lightweight Concrete. Construction and Building Materials, Vol. 38, pp.854-864.
Tanigawa, Y. And Yamada (1978). Size Effect in Compressive Strength of Concrete. Cement
and Concrete Research, Vol. 8, No. 2, pp. 181-190.
Tokyay M., and Ozdemir M. (1997). Specimen Shape and Size Effect on the Compressive
Strength of Higher Strength Concrete. Cement and Concrete Research, Vol 27, No.8,
pp.1281-1289.
Turkel, A., & Ozkul, M. H. (2010). Size and Wall Effects on Compressive Strength of
Concrete. Aci Materials Journal , Vol. 107, Issue No.04, pp.372-379.
Vandegrift D., and Schindler A.K. (2006). The Effect of Test Cylinder Size on the
Compressive Strength of Sulfur Capped Concrete Specimens. Highway Research Centre,
Department of Civil Engineering, Auburn University.
Website:<http://www.eblsecurities.com/AM_Resources/AM_ResearchReports/SectorReport/
A Comprehensive Review of the Bangladesh Cement Industry> , on 7th September, 2017
Page 108
90
Website :< https://www.statista.com/statistics/219343/cement-production-worldwide/> , on
February, 2017
Yakkali S.S., and Reddy V.S. (2015). Developed of Compressive Strength Conversion
Factors for Concrete. International journal & Management of Engineering, Technology,
Management and Research, Vol. 02, Issue No.11, pp.89-94.
Zabihi N. (2012). Effect of Specimen Size and Shape on Strength of Concrete. Submitted to
the Institute of Graduate Studies and Research. Eastern Mediterranean University,
Gazimagusa, North Cyprus.
Zheng, J. J., & Li, C. Q. (2002). Three-Dimensional Aggregate Density in Concrete With
Wall Effect. ACI Materials Journal , Vol. 99, No.6, pp.568-575.


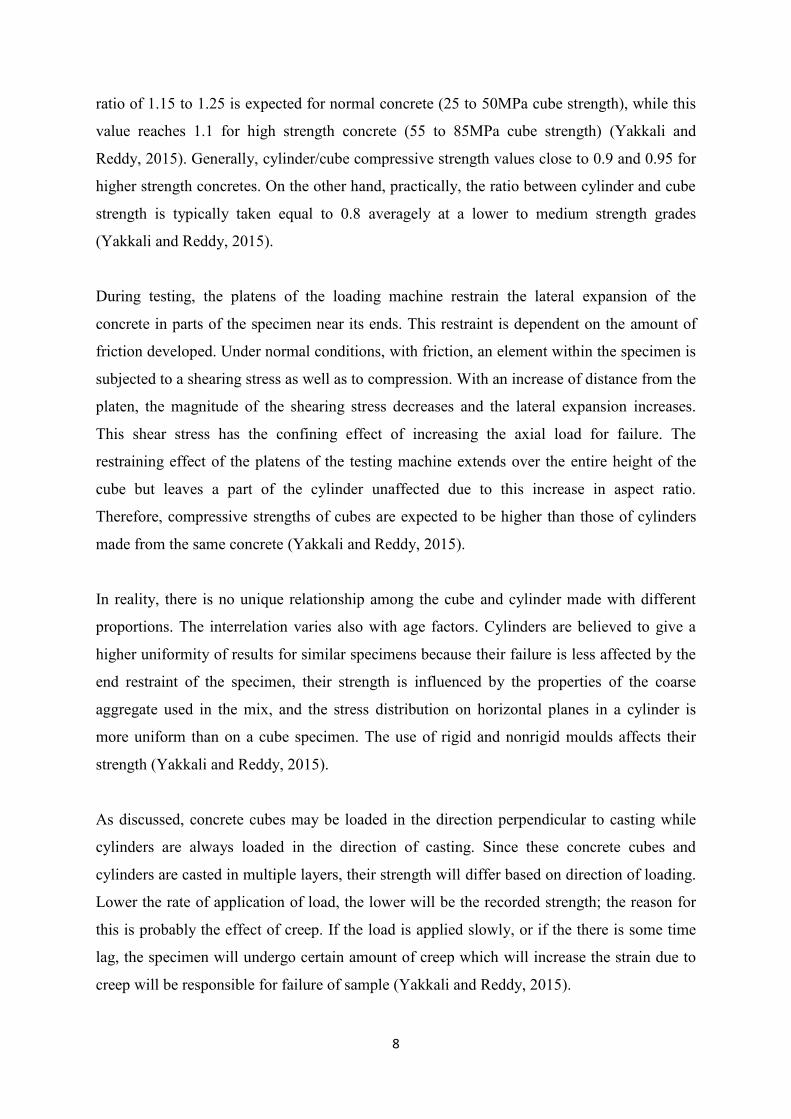
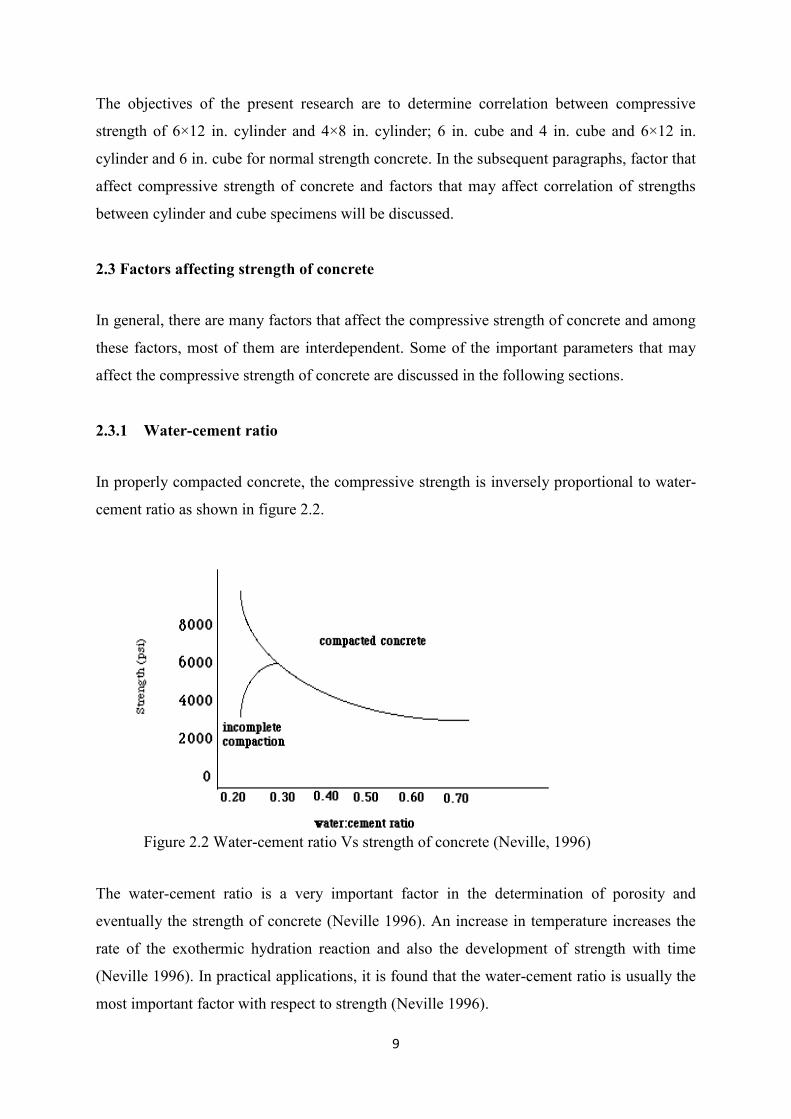


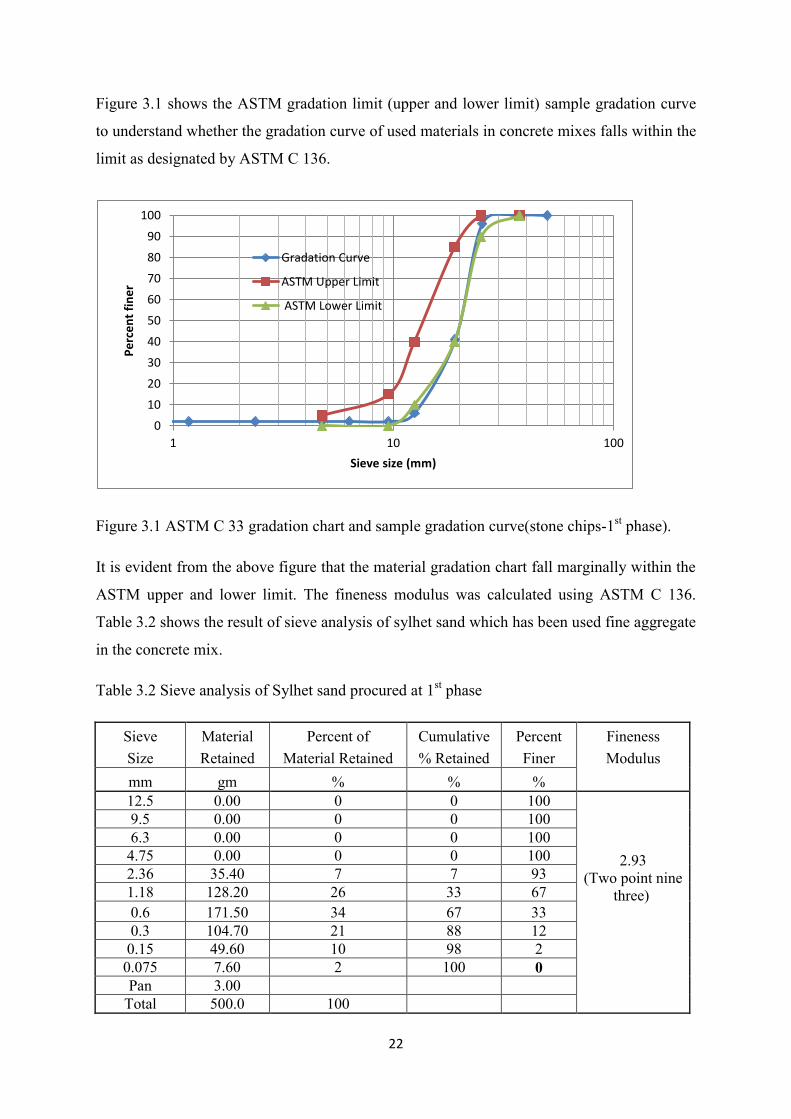


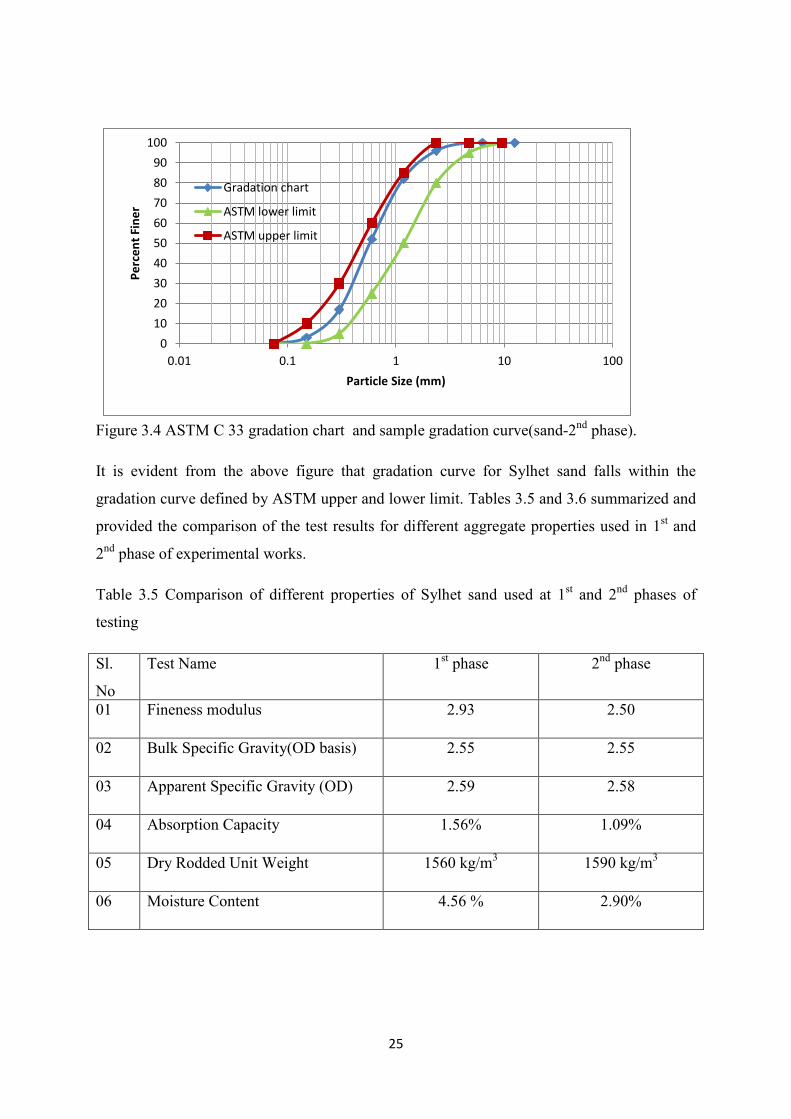


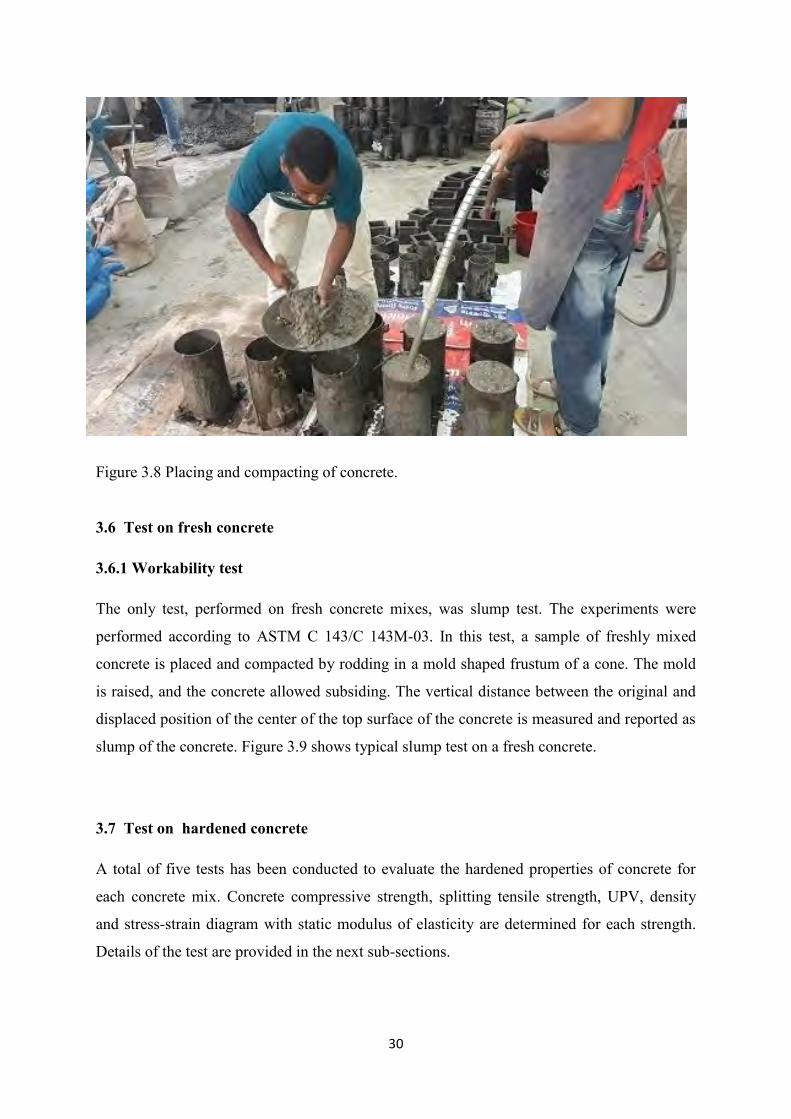


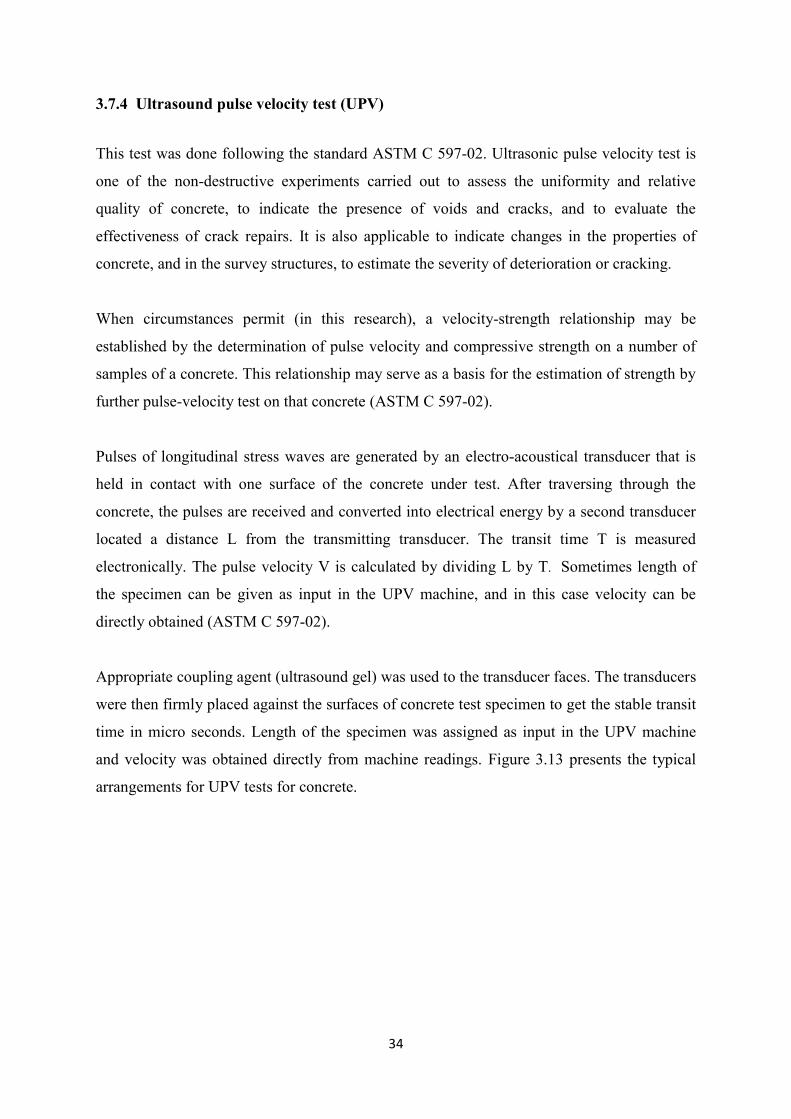

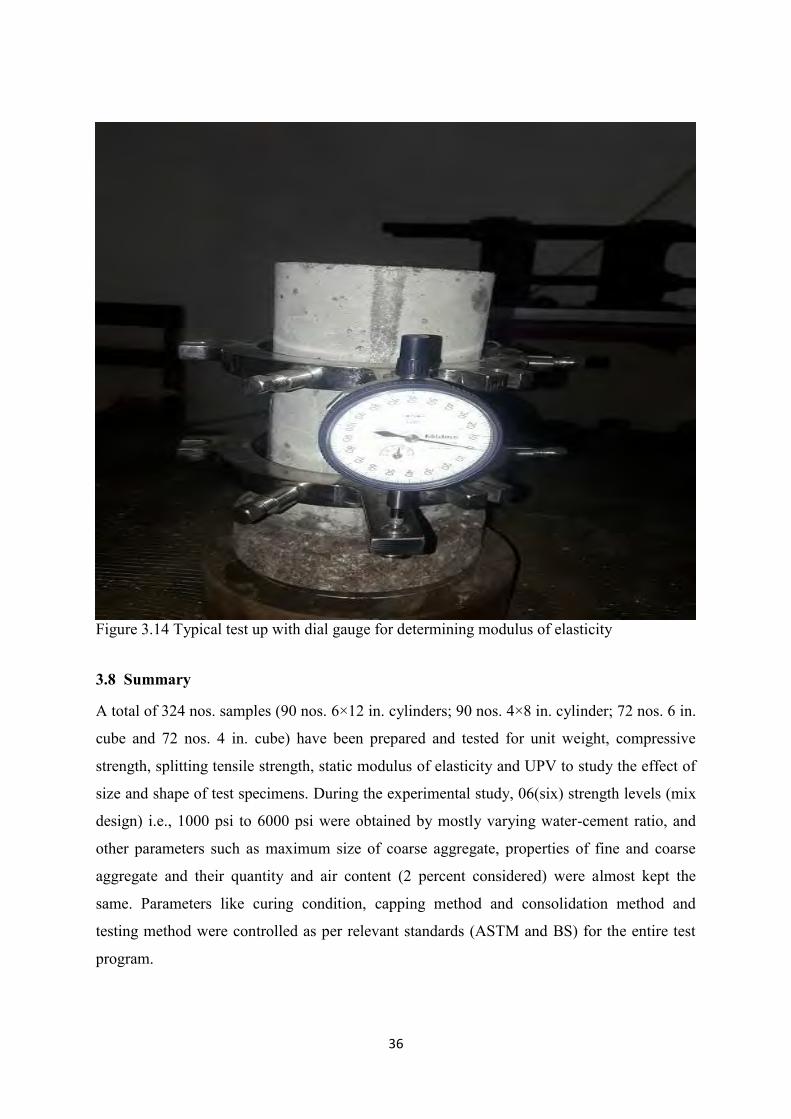


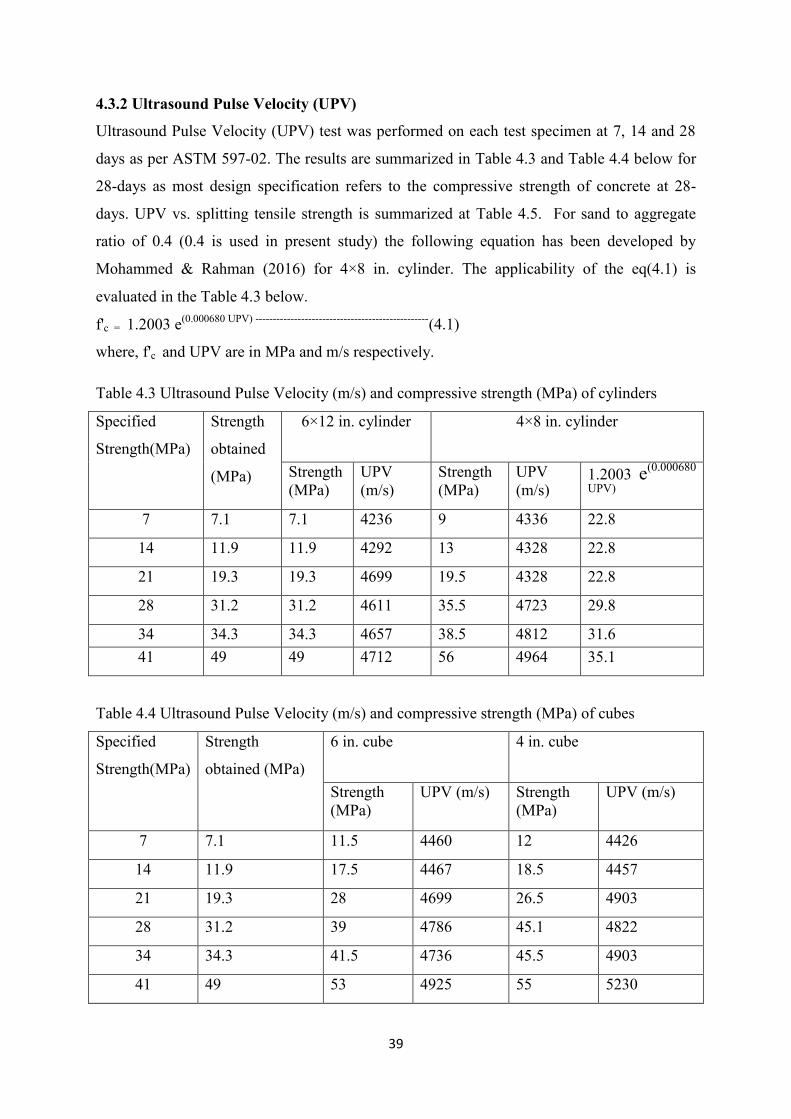
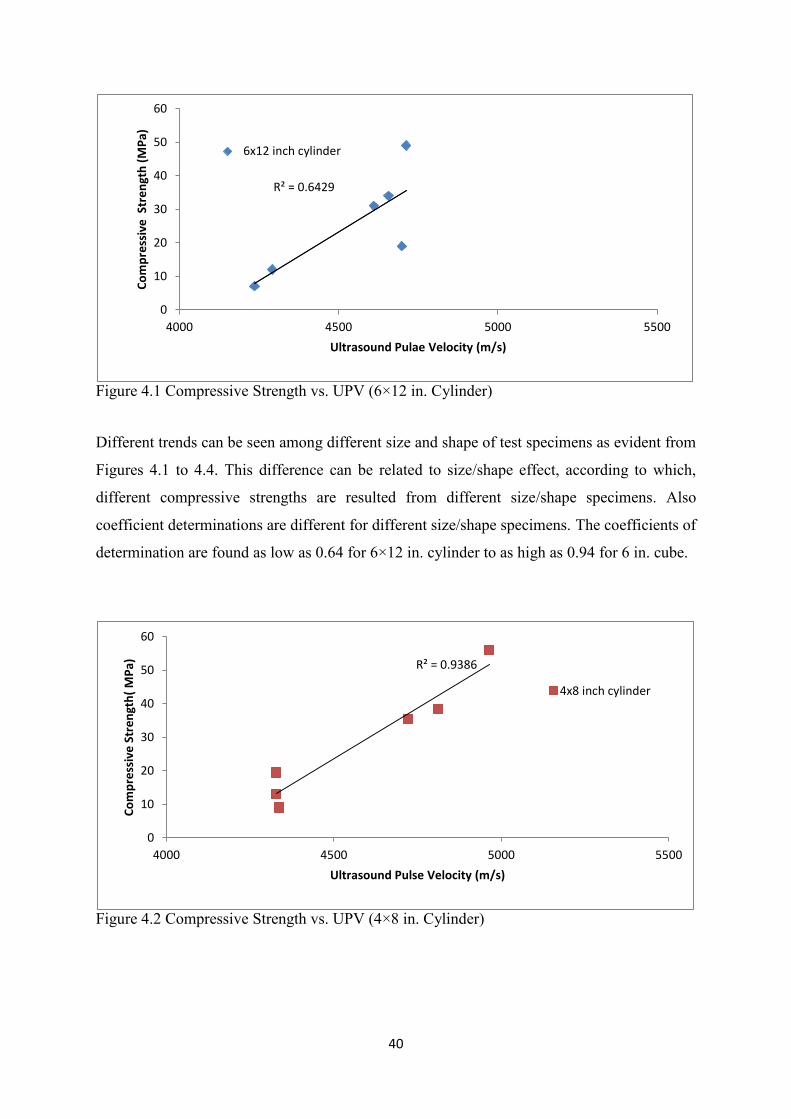

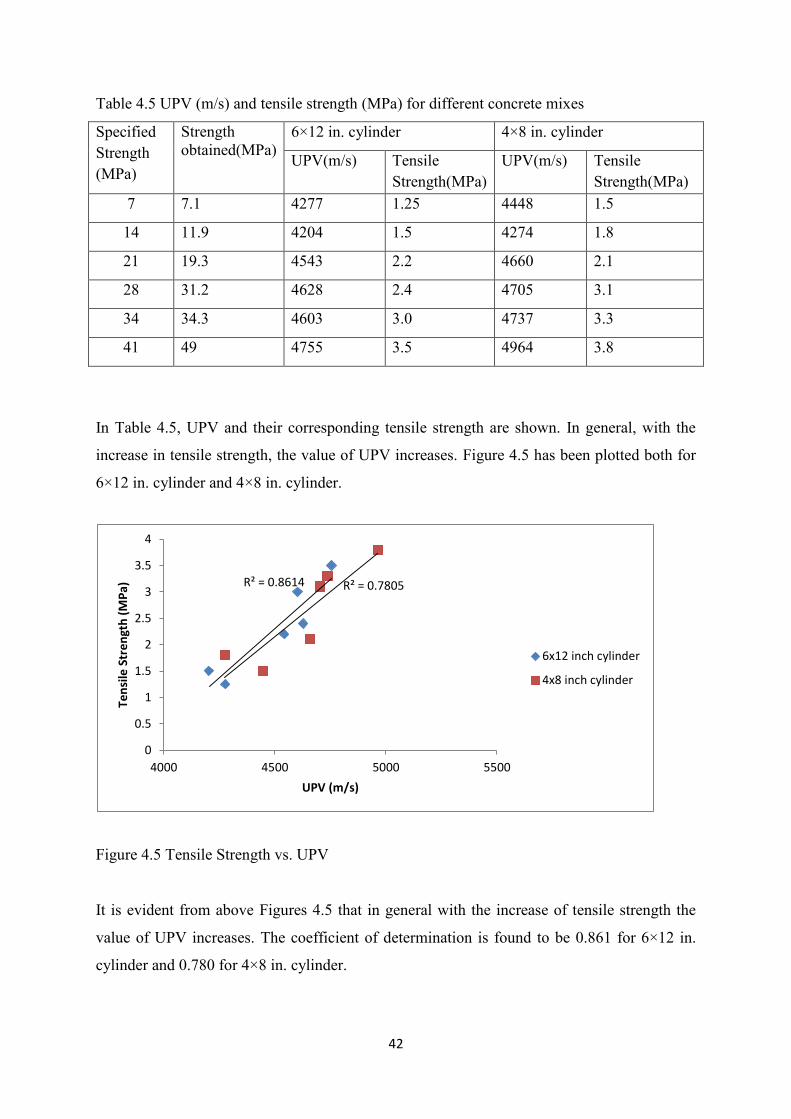

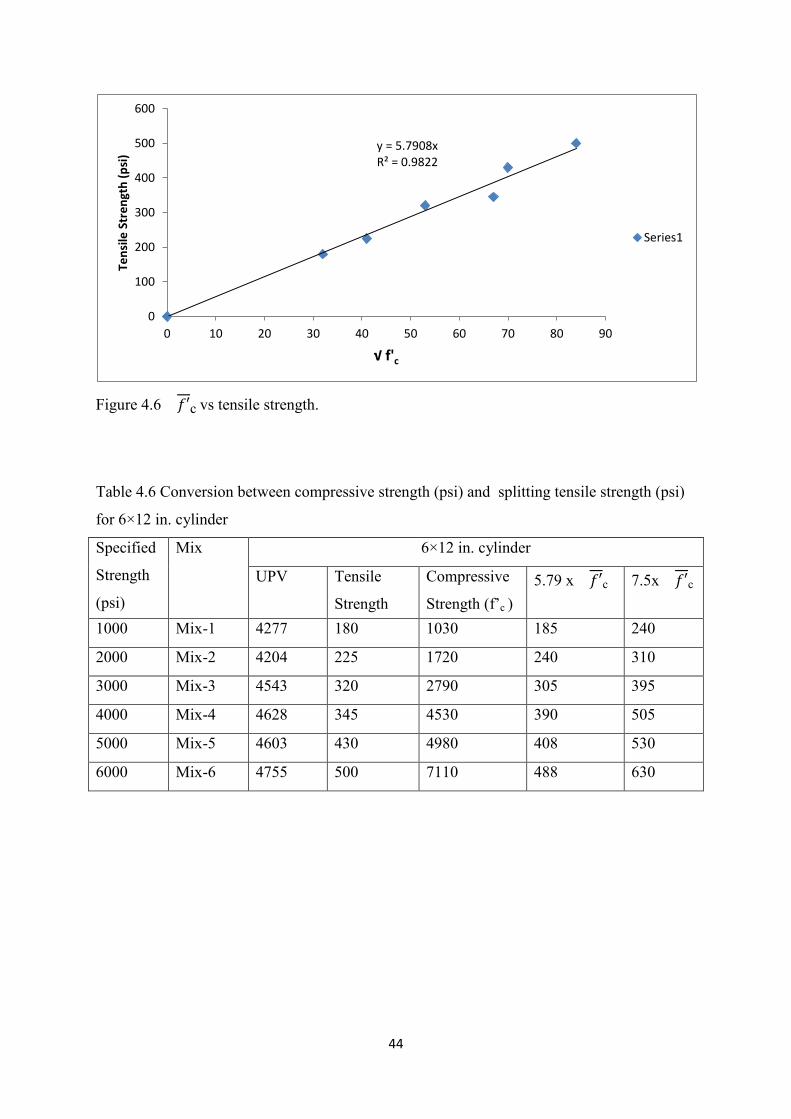


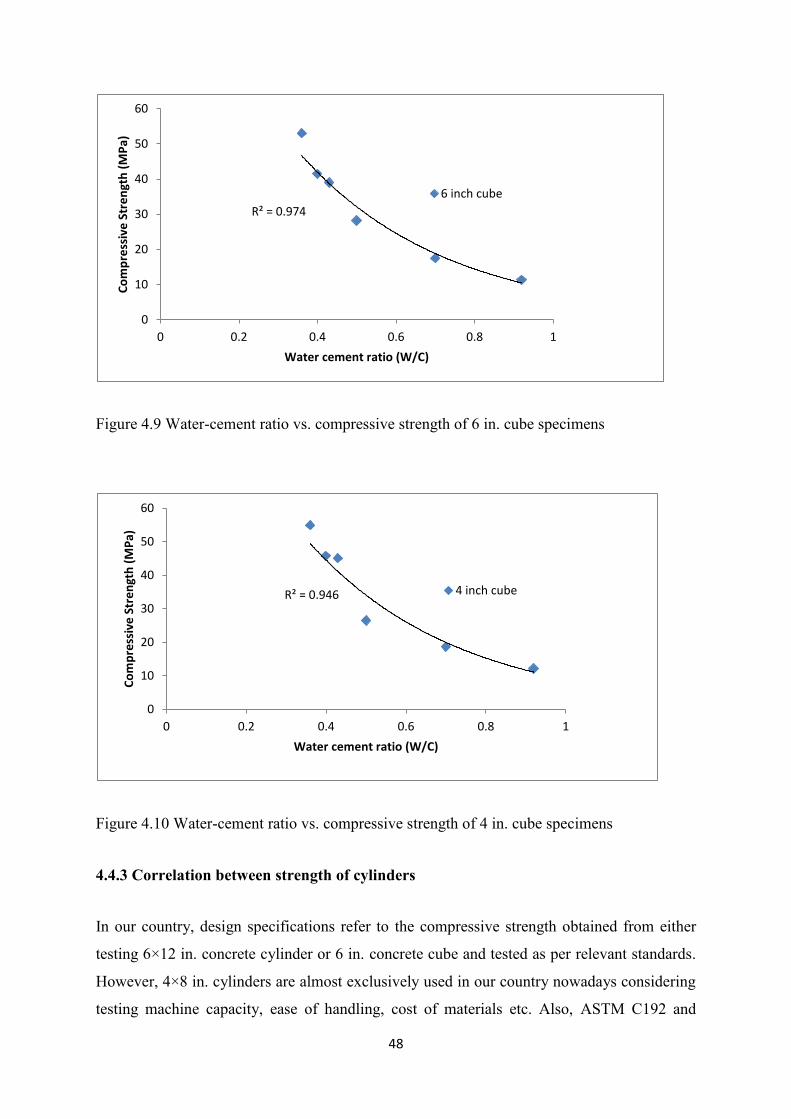
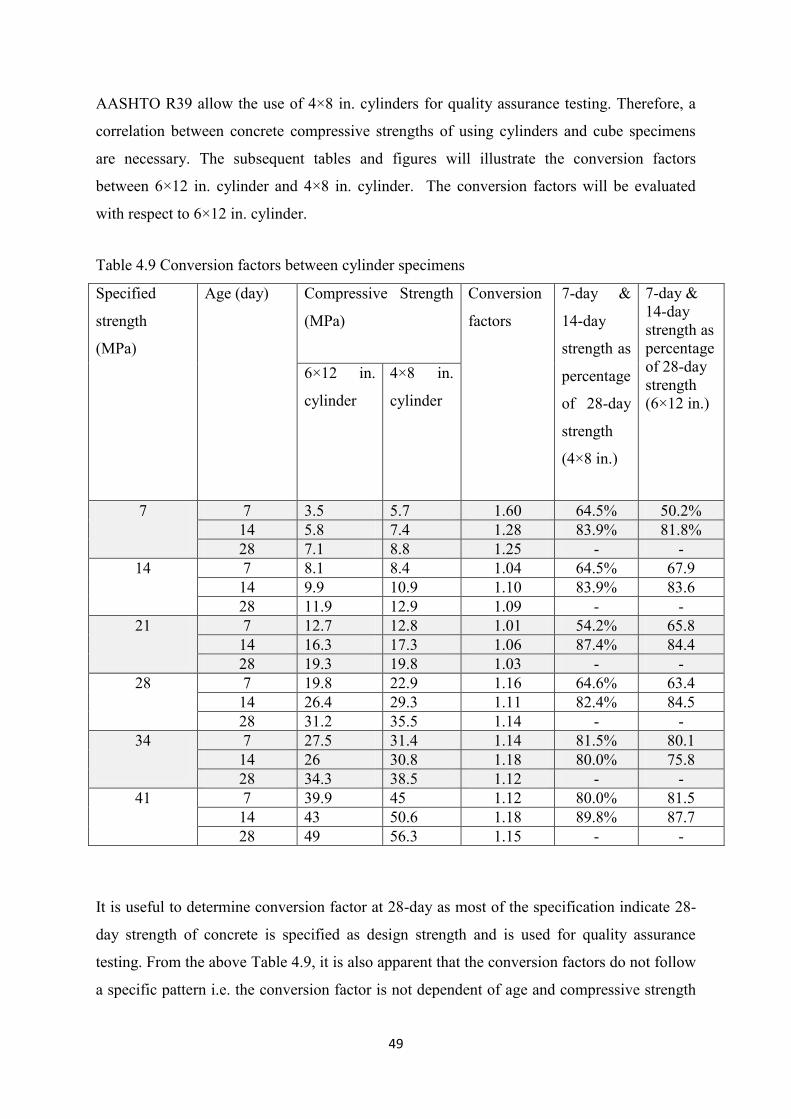
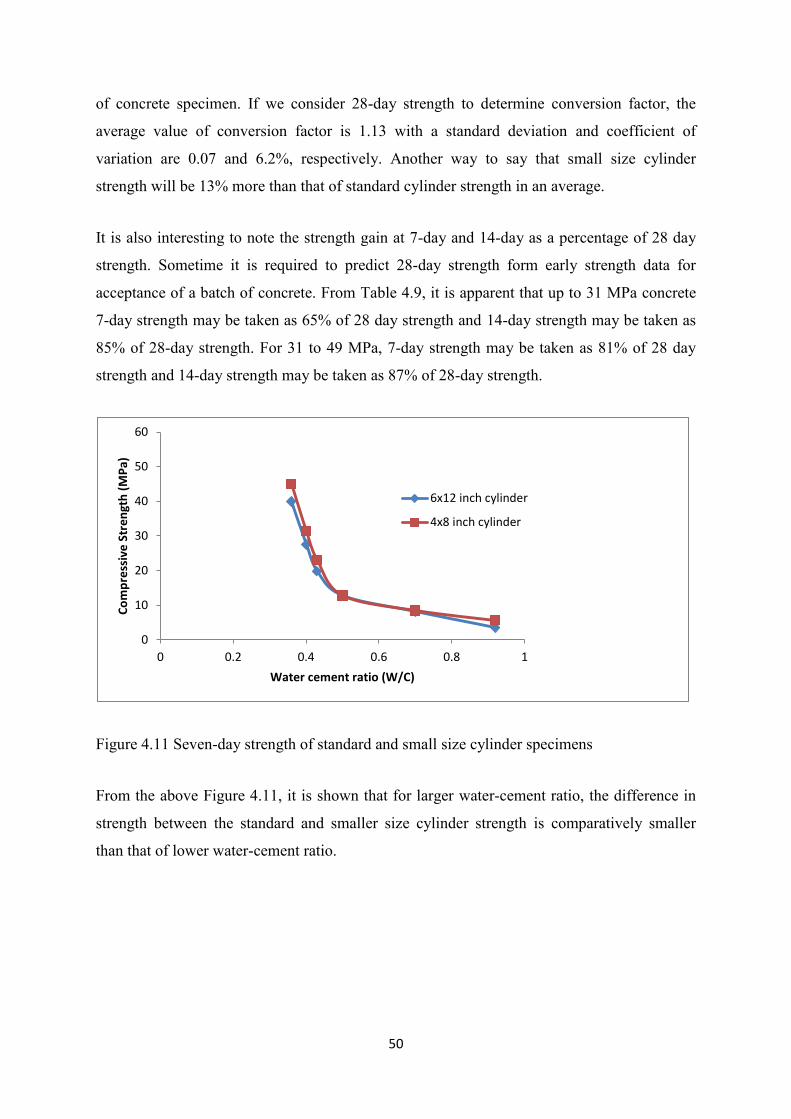

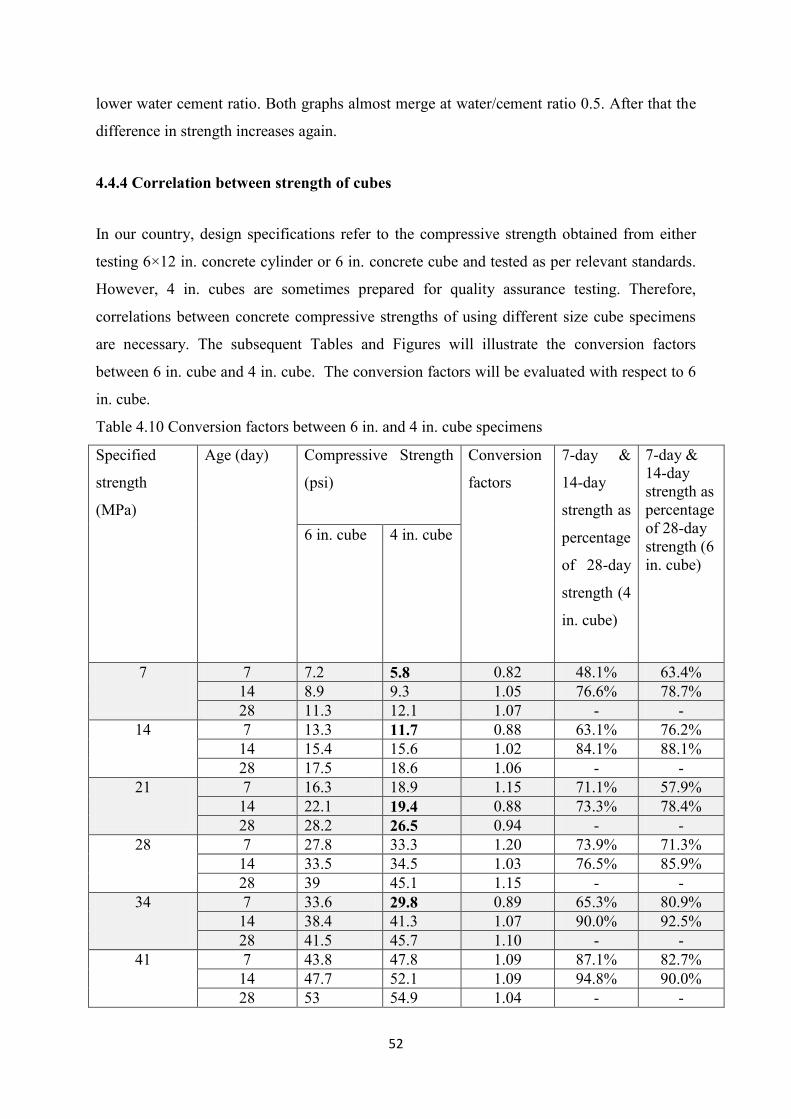


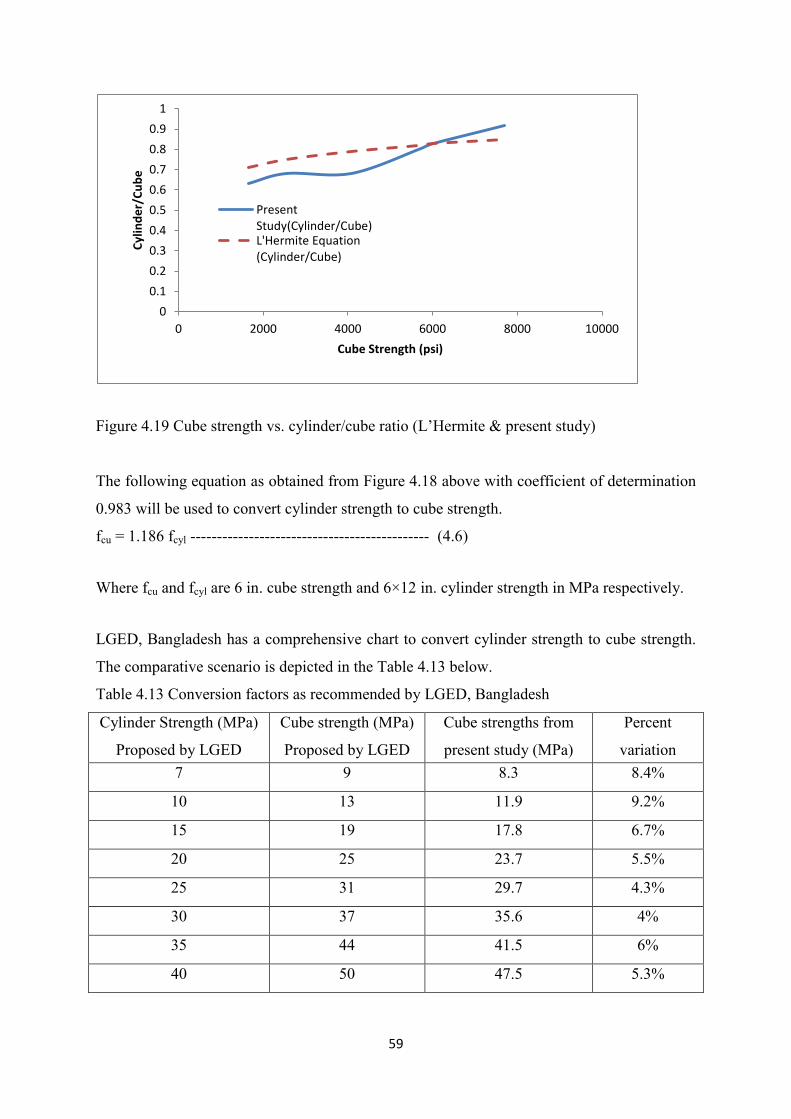


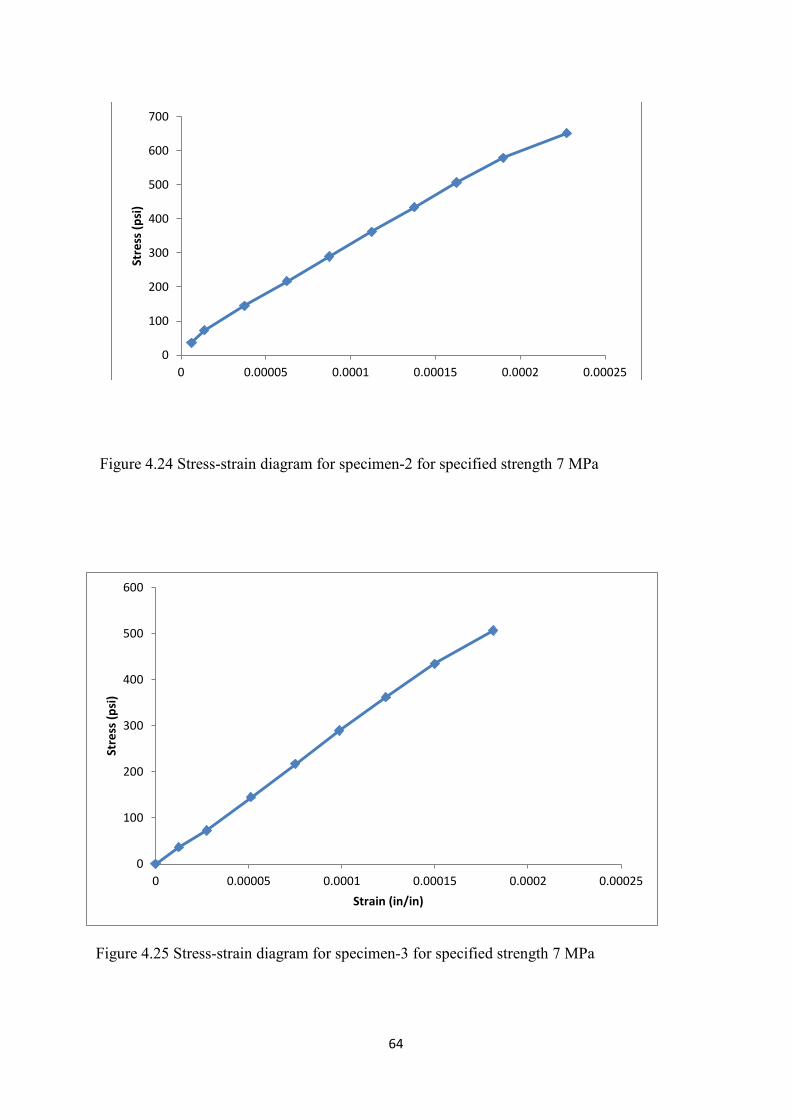


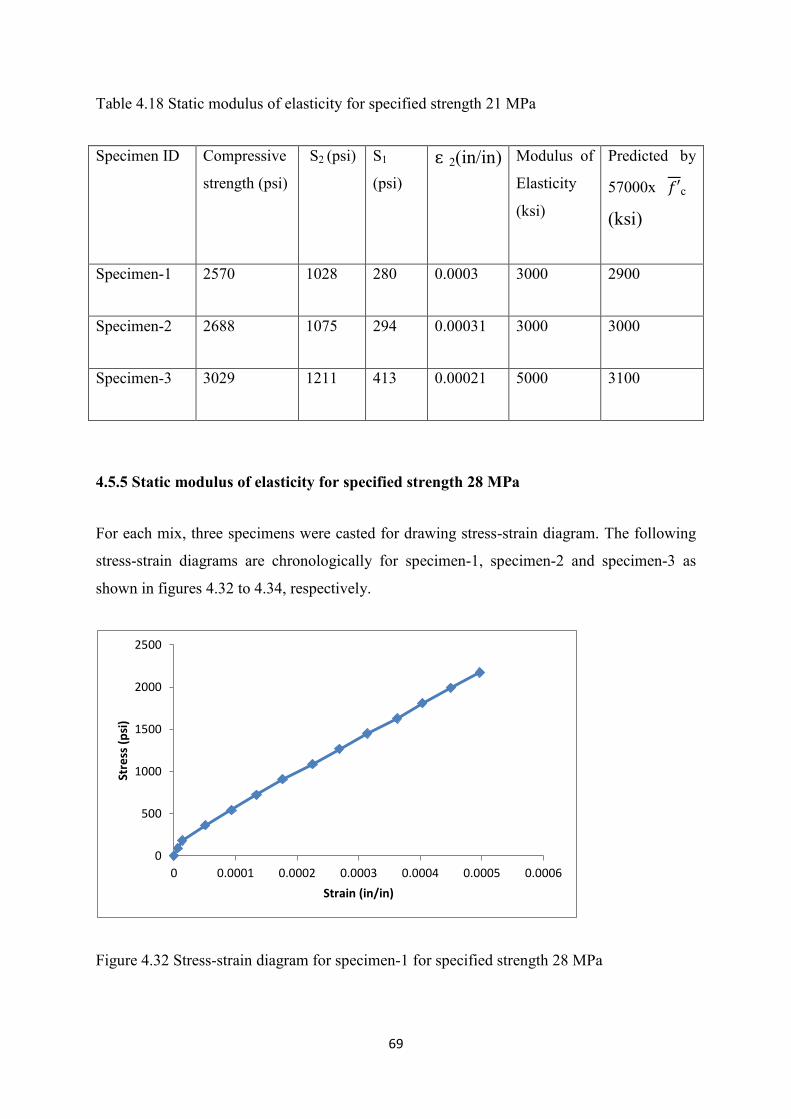

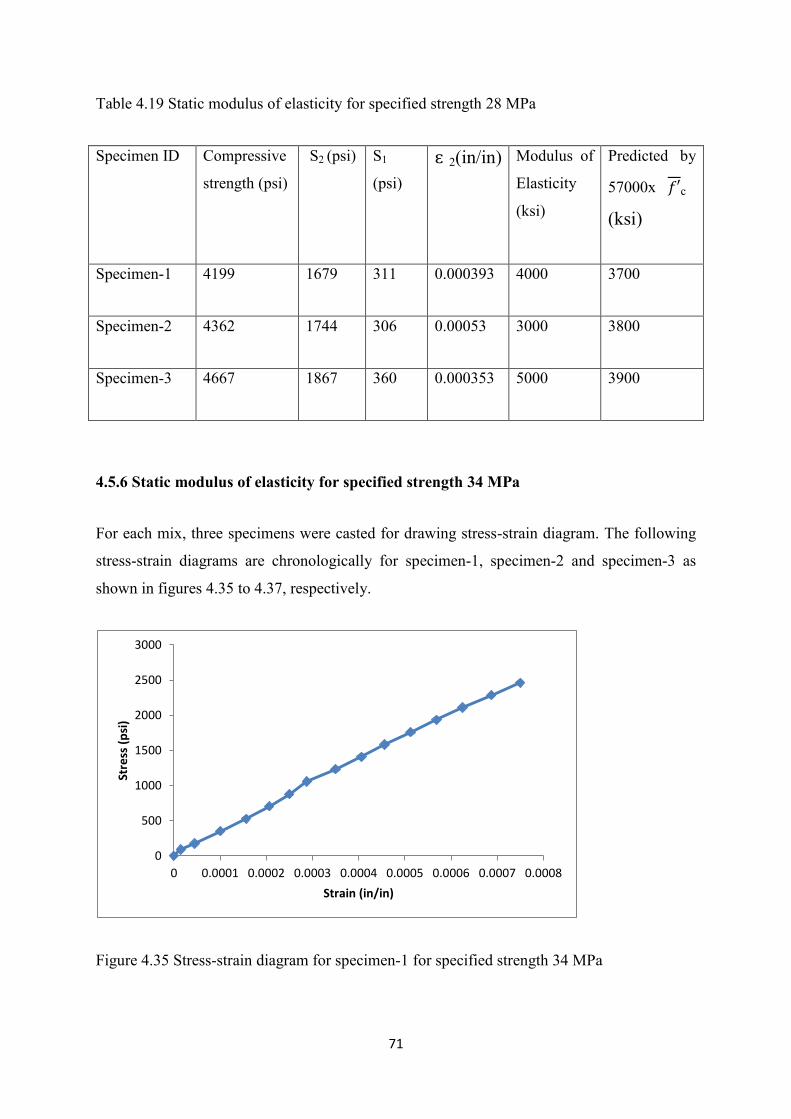
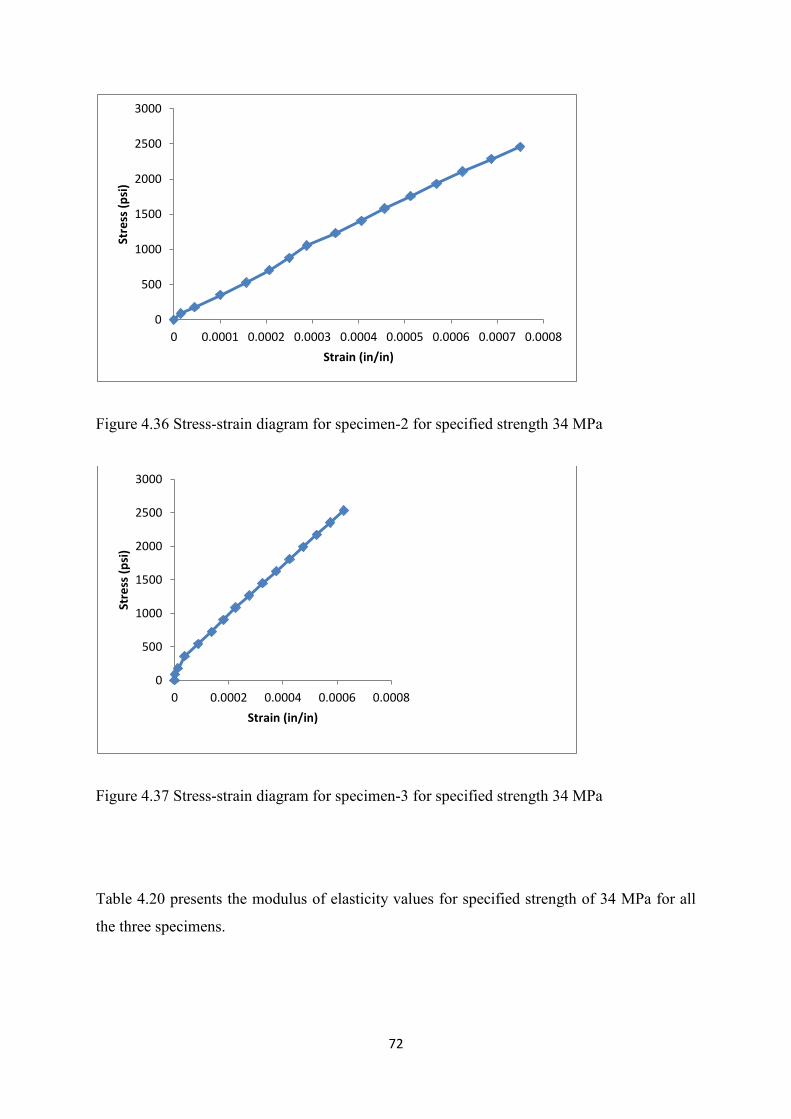


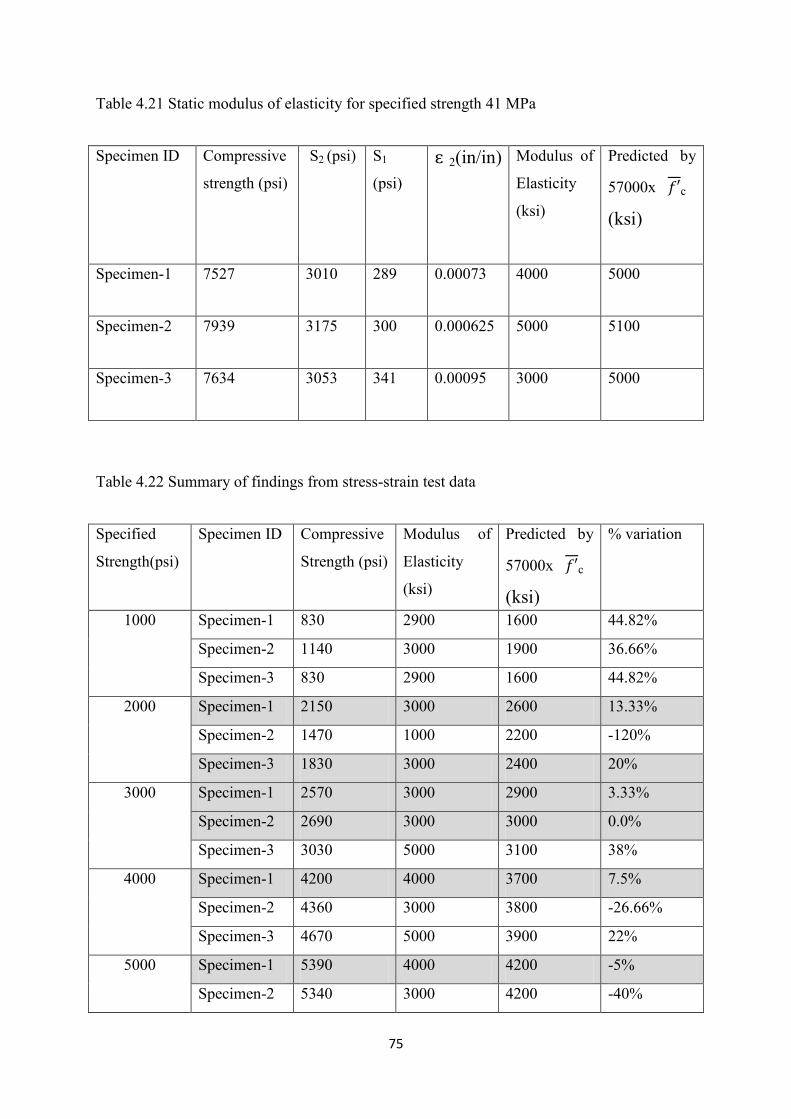
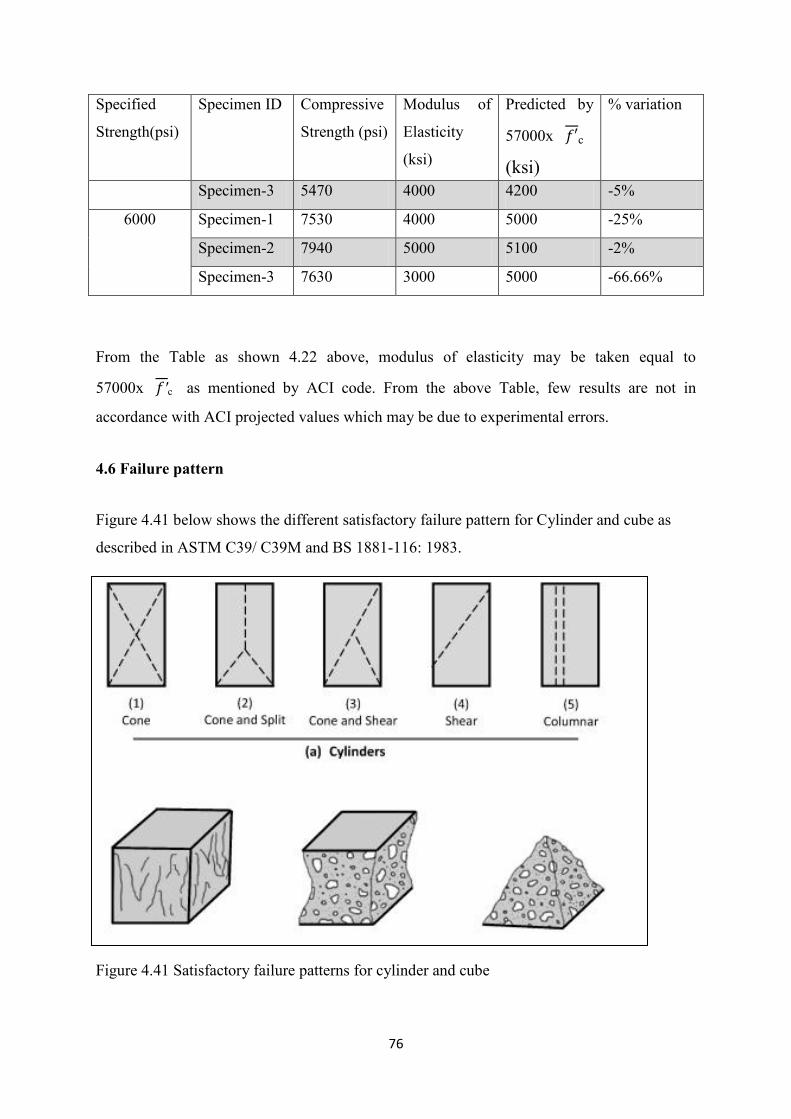
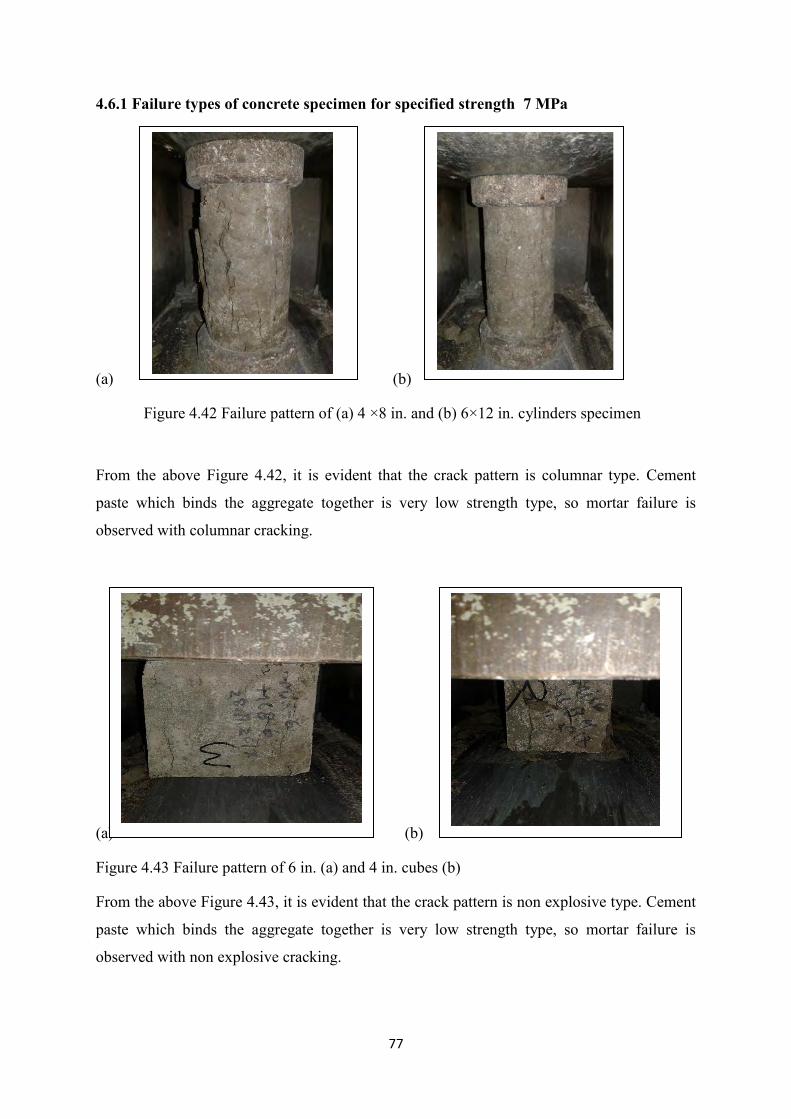
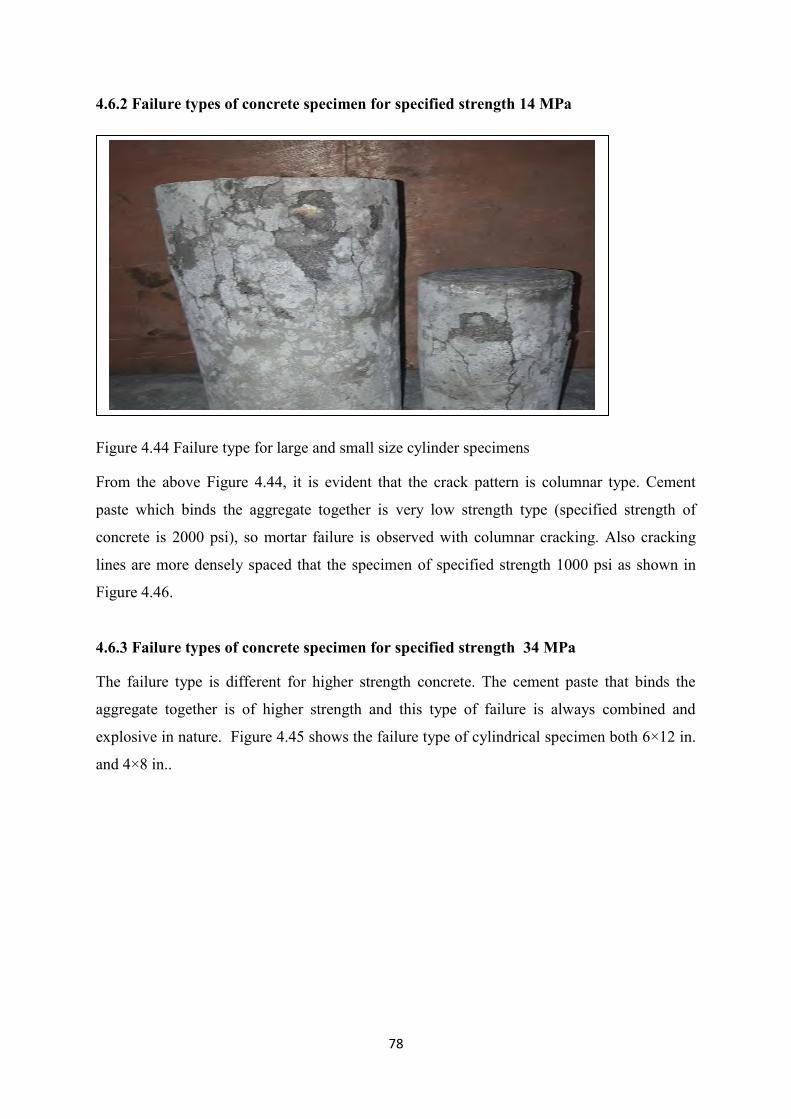
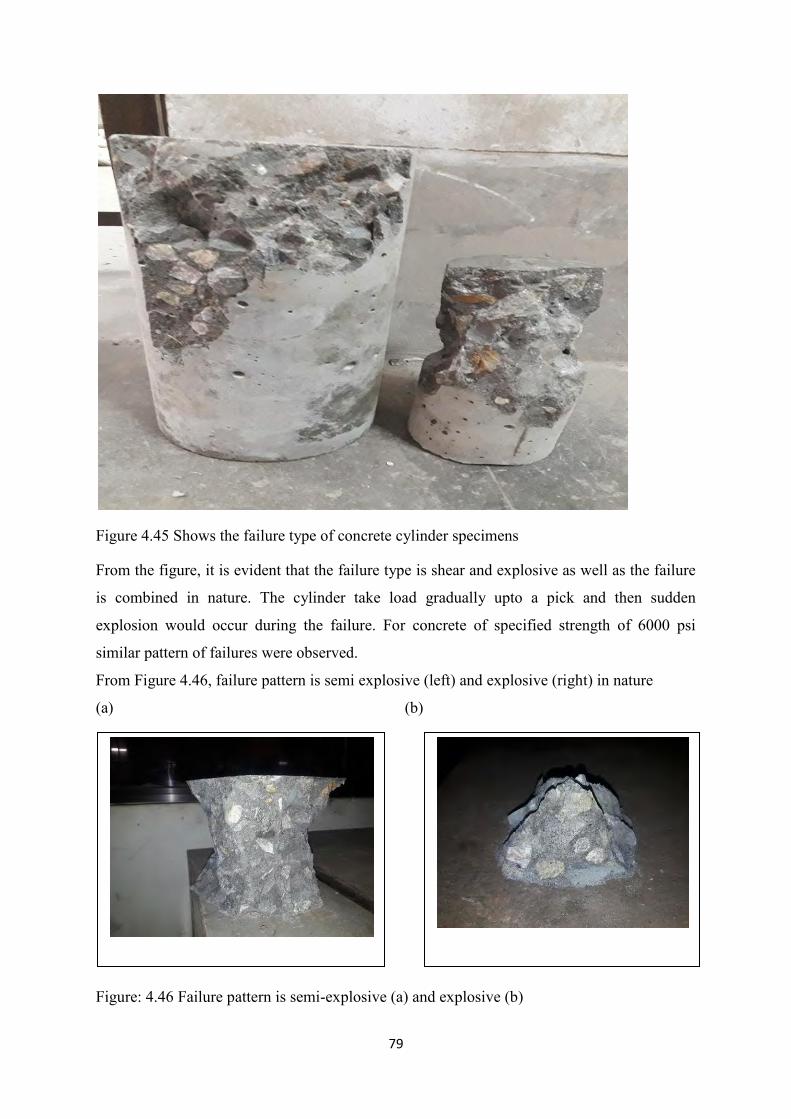


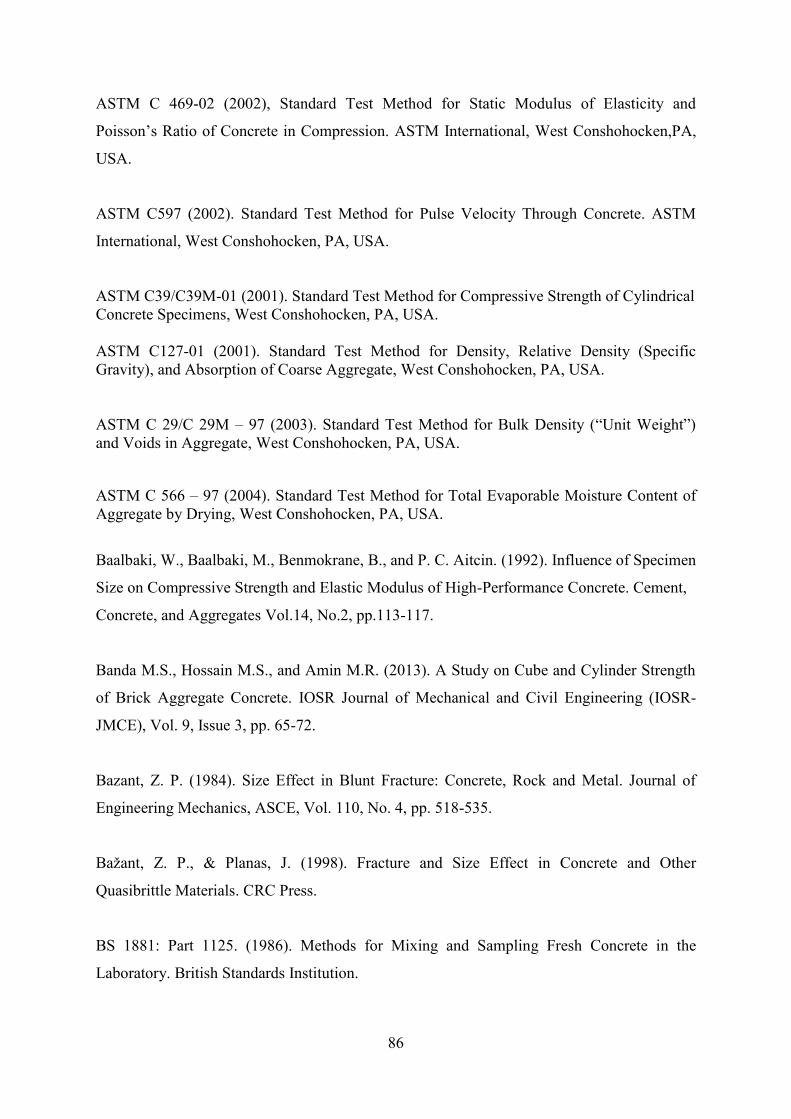


![Experimental Investigation and Gaussian Process Emulation ... · compressive strength went up about 70%. Malvern L E, et al. [7] conducted ∅=76 mm SHPB tests to concrete specimens](https://static.documents.pub/doc/80x56/5feccee907b6dd7dd44fcdee/experimental-investigation-and-gaussian-process-emulation-compressive-strength.jpg)


