EFFECT OF SODIUM NITRATE TREATMENT ON WATER AND SEDIMENT QUALITY IN LABORATORY AND POND STUDIES Except where reference is made to the work of others, the work described in this dissertation is my own or was done in collaboration with my advisory committee. This dissertation does not include proprietary or classified information. ___________________________ Suwanit Chainark Certificate of Approval: ___________________________ ___________________________ Yolanda J. Brady Claude E. Boyd, Chair Associate Professor Professor and Butler/Cunningham Fisheries and Allied Aquacultures Eminent Scholar Fisheries and Allied Aquacultures ___________________________ ___________________________ Jesse A. Chappell John W. Odom Assistant Professor Associate Professor Fisheries and Allied Aquacultures Agronomy and Soils ___________________________ George T. Flowers Dean Graduate School
Transcript
EFFECT OF SODIUM NITRATE TREATMENT ON WATER AND SEDIMENT
QUALITY IN LABORATORY AND POND STUDIES
Except where reference is made to the work of others, the work described in this dissertation is my own or was done in collaboration with my advisory committee.
This dissertation does not include proprietary or classified information.
___________________________ Suwanit Chainark
Certificate of Approval: ___________________________ ___________________________ Yolanda J. Brady Claude E. Boyd, Chair Associate Professor Professor and Butler/Cunningham Fisheries and Allied Aquacultures Eminent Scholar Fisheries and Allied Aquacultures ___________________________ ___________________________ Jesse A. Chappell John W. Odom Assistant Professor Associate Professor Fisheries and Allied Aquacultures Agronomy and Soils ___________________________ George T. Flowers Dean Graduate School
EFFECT OF SODIUM NITRATE TREATMENT ON WATER AND SEDIMENT
QUALITY IN LABORATORY AND POND STUDIES
Suwanit Chainark
A Dissertation
Submitted to
the Graduate Faculty of
Auburn University
in Partial Fulfillment of the
Requirements for the
Degree of
Doctor of Philosophy
Auburn, Alabama December 19, 2008
iii
EFFECT OF SODIUM NITRATE TREATMENT ON WATER AND SEDIMENT
QUALITY IN LABORATORY AND POND STUDIES
Suwanit Chainark
Permission is granted to Auburn University to make copies of this dissertation at its discretion, upon request of individuals or institutions and at their expense. The author
reserves all publication rights.
_______________________________ Signature of Author
_______________________________ Date of Graduation
iv
VITA
Suwanit Chainark, son of Suchai and Lianteng Chainark, was bone on June 11,
1970, at Phangnga, Thailand. He graduated from Thongmapround Vitaya School in
1985. He received Advanced Certificate from Tinsulanon Songkhla Fisheries College,
Songkhla in March 1991. He entered Rajamangala Institute of Technology at Bangpra,
Chonburi and earned Bachelor of Science Degree in Fisheries with Second-Class Honors
in March 1993. He continued his study by enrolling in the graduate school, Kasetsart
University and received Master of Science in Aquaculture in April 1997. Following his
graduation, he was appointed to the staff of the Faculty of Agricultural Technology,
Phuket Rajabhat University, Phuket. In 2004, he was admitted to the graduate school,
Auburn University, to study in Ph.D. Program at Department of Fisheries and Allied
Aquacultures, College of Agriculture funded by Thai Government. He graduated from
Auburn University in December 2008 and returned to work in the same position in
Thailand. He married Pitchaya Chainark, daughter of Senior Captain Boonchun
Chinupravat and Chomchuen Chinupravat.
v
DISSERTATION ABSTRACT
EFFECT OF SODIUM NITRATE TREATMENT ON WATER AND SEDIMENT
QUALITY IN LABORATORY AND POND STUDIES
Suwanit Chainark
Doctor of Philosophy, December 19, 2008
(M.S., Kasetsart University, 1997) (B.S., Rajamangala Institute of Technology, 1993)
80 Typed Pages
Directed by Claude E. Boyd
Sodium nitrate (NaNO3) has been widely used in shrimp aquaculture ponds as a
fertilizer, a water quality enhancer and a bottom soil oxidant. This study was conducted
to determine whether or not treatment with sodium nitrate can improve water quality,
bottom soil condition, phytoplankton abundance and community structure and fish yield
in freshwater channel catfish ponds. The study consisted of a pond study and a
laboratory study. In the pond study, sodium nitrate was applied at 2 mg/L NO3--N at 2-
week intervals to rectangular ponds of 400-m2 water surface area stocked with 400
channel catfish Ictalurus punctatus fingerings and 10 grass carp Ctenopharyngodon
idella. Water quality, phytoplankton communities, sediment condition and fish
vi
production were compared between triplicate treatment and control ponds. The results
showed that catfish production and survival rate did not differ (P>0.1) between treated
and control ponds. There were higher mean concentrations of nitrate nitrogen, total
nitrogen, soluble reactive phosphorus, total phosphorus, turbidity and chlorophyll a in
sodium nitrate-treated ponds than in control ponds (P<0.1). Transparency was greater in
control ponds (P<0.1). The pH and concentration of total alkalinity, ammonia nitrogen,
and dissolved oxygen were not different between treated and control ponds (P>0.1).
There were also no differences in pH and organic matter concentration of sediment
(P>0.1) between control and treated ponds. However, application of sodium nitrate
caused a decline in redox potential between the beginning and the end of grow-out period
in sediment (P<0.1), and upon draining, sediment in treated ponds was lighter colored
than that of control ponds. This suggests that nitrate treatment enhanced oxidation at the
sediment surface.
In the laboratory study, sodium nitrate was further investigated to determine if it
would influence redox potential, denitrification rate, and the rate of organic matter
decomposition when added to sediment. Results revealed no differences (P>0.05) in
redox potential and organic matter concentration in sediment treated with 0 to 32 mg/kg
of NO3--N. There was no increase in denitrification (P>0.05) in sediment to which
nitrate was applied at 0 to 10 mg/L to the water. Dissolved oxygen declined at similar
rates in water samples held in BOD bottles and treated with 0 to 8 mg/L NO3--N. Nitrate
and ammonium also were compared as nitrogen source for phytoplankton. Uptake rate of
ammonium by green algae was greater than that of nitrate. However, diatom and blue-
green algae communities appeared to use both forms of nitrogen.
vii
ACKNOWLEDGMENTS
The author would like to thank committee chairman, Professor Claude E. Boyd
and committee members Drs. Yolanda J. Brady, Jesse A. Chappell, and John W. Odom
for their guidance and assistance throughout the study.
Financial support of the experiment by SQM, Inc., Santiago, Chile through its
U.S. office in Atlanta, Georgia is greatly appreciated. SQM also provided sodium nitrate
for use in the ponds. The interest and encouragement of Mr. Alejandro Ponce of SQM
also is appreciated.
Thanks to Commission on Higher Education, Ministry of Education, Thailand for
the financial support; Phuket Rajabhat University for giving opportunity to pursue the
program; and Dr. Yont Musig, Faculty of Fisheries, Kasetsart University, Thailand for his
support.
Special thanks are expressed to his parents, Mr. Suchai and Mrs. Lianteng
Chainark; sisters; wife, Mrs. Pitchaya Chainark, and her parents for their love and
encouragement throughout his educational career.
viii
Style manual or journal used Journal of the World Aquaculture Society
Computer software used Microsoft Word 2007, Microsoft Excel 2007, SigmaPlot 10, SAS 9.1.3, EndNote X1
ix
TABLE OF CONTENTS
LIST OF TABLES ............................................................................................................ xii
LIST OF FIGURES ......................................................................................................... xiv
Total alkalinity - Titration to methyl orange endpoint with standard sulfuric acid
(Franson and Eaton, 2005).
Chlorophyll a - Acetone-methanol extraction as described by Pechar (1987).
Turbidity - Orbeco-Hellige Turbidimeter Model 965-10A and Secchi disk
visibility.
Algal identification and enumeration
A 50-mL of water from each pond was put in a graduated, plastic, conical
centrifuge tube when water samples were colleced for chemical analyses. These samples
were preserved with 0.15 mL of Lugol’s solution (Boyd and Tucker, 1992).
Phytoplankters (colonies, filamantens, trichomes, or single cell) were counted using a
Sedgwick-Rafter counting cell (50 mm X 20 mm X 1 mm deep or 1,000 mm3) under an
inverted compound microscope using an ocular fitted with the Whipple ocular grid and
the 10 X ocular. The grid is about 1 mm on a side, delimiting an area of about 1 mm2
(Hasle and Sournia, 1978, Boyd and Tucker, 1992, Franson and Eaton, 2005). Algae
were identified to genus according to Whitford and Schumacher (1984).
21
Bottom soil analyses
Sediment samples collected at the beginning of the experiment before starting
sodium nitrate treatment and at the end before draining pond for harvest of fish. Each
time, samples were collected to depth of 5-cm from five places in each pond using a
diameter plastic core sample tube as described by Wudtisin and Boyd (2006). Redox
potential of the samples was determined at once using a Orion Model 230 meter with
combination ORP electrode. The samples were then dried at 60 ˚C in a mechanical
convection oven, pulverized and analyzed for organic carbon and pH (Boyd and Tucker,
1992).
Catfish data
The following data were recorded related to fish production: date fish stocked;
number fish stocked; average weight fish stocked; number fish harvested; weight
distribution of sample of fish from each pond harvested; total weight of fish harvested;
total amount of feed applied to each pond; feed conversion ratio.
Laboratory Study
The laboratory study was separated into five experiments.
Nitrate as oxygen source
Oxygen demand of sediment. - Sediment samples were taken from Pond B-2 at
the EWS Fisheries Center. A 2-g layer of sediment was then put into bottoms of BOD
22
bottles, and bottles were filled carefully with clear tap water containing the following
nitrate concentration, 0, 0.5, 1, 2, 4 and 8 mg/L NO3--N. Each concentration was
replicated 5 times. Samples were incubated in the dark at 25 ˚C and dissolved oxygen
concentration was measured with a polarographic oxygen meter (YSI Model 57 and YSI
5905 BOD Probe) at 0 hr, 12 hr and every day until oxygen was depleted.
Oxygen demand of plankton. - This trial was carried out in the same way as the
previous trial, however, water from Pond E-24 at the EWS Fisheries Center containing a
moderate plankton bloom was used instead of tap water and no sediment was added to
the BOD bottles.
Denitrification
Sediment was taken from Pond F-5 on the EWS Fisheries Center. Exactly 2.0-g
of fresh sediment were put into BOD bottles containing pond water to which 0, 1, 5, and
10 mg/L NO3-
Sediment samples were collected from Ponds B-2, B-3 and B-4 at the EWS
Fisheries Center. These ponds were being used to raise channel catfish at the time and
were thought to contain relatively large amount of fresh organic matter. Soil samples
were put in to shallow pans (5-cm depth of sediment with 5-cm layer of water above) and
mixed with enough crushed fish feed to give a feed concentration of 0.1 %. Sodium
-N had been added. The three samples of each concentration were
removed to measure nitrate concentration remaining after 1, 2, 4, 6, 8, 12, 16, 20, 24 and
28 days.
Redox potential
23
nitrate fertilizer was added into sediments to acquire the following concentrations: 0, 1, 2,
4, 8, 16 and 32 mg/kg NO3--N. Pans were held at room temperature, and pH and redox
potential were measured with a Orion Model 230 pH/Redox meter using a combination
glass electrode and a combination ORP electrode, respectively. The measurement were
made at five places in each pan after 1, 2, 4, 8, 12, 16, 20, 24, 28 and 32 days.
Organic matter decomposition
Sediment samples from Ponds B-2, B-3 and B-4 also were placed in pans and
treated with sodium nitrate to give concentrations of 0, 1, 2, 4, 8, 16 and 32 mg/kg NO3-
The four samples of pond water containing different densities of plankton were
obtained from Pond M-16, F-24, N-1, and H-41 at the EWS Fisheries Center. The
samples were analyzed for chlorophyll a concentration (Pechar, 1987) to provide an
estimate of plankton abundance. There were three treatments of this experiment: addition
of 0.5 mg/L NH
-N.
Samples were removed immediately after treatment (0 day) and after 1, 2, 4 and 8 weeks.
These samples were oven-dried at 60 ˚C in a mechanical convection oven and crushed to
pass a 0.85-mm screen. Organic matter concentration was determined using the Walkley
Black potassium dichromate-sulfuric acid oxidation method (Nelson and Sommers, 1996,
Boyd, 1995a)
Uptake of nitrate and ammonium by phytoplankton
4+-N; addition of 0.5 mg/L NO3
--N; addition of a mixture of 0.5 mg/L of
both nutrients. The study was conducted in 1-liter flasks of pond water using five
replications per treatment. The flasks were exposed to sunlight for 12 hrs on clear days,
24
and concentrations of nitrate-nitrogen and ammonia-nitrogen remaining after 12 hours
were measured.
Data Analysis
Catfish, water quality, bottom soil and phytoplankton data were analyzed by t-test
with a probability level of 0.1. All laboratory trial data were tested with the analysis of
variance followed by Tukey’s Studentized Range (HSD) for identifying differences
among treatment means. The probability used for rejection of null hypothesis was set at
0.05 for laboratory studies. All data were analyzed with the SAS 9.1.2 statistical analysis
software (SAS Institute, 2004).
25
RESULTS AND DISCUSSION
Pond Study
Water quality
The concentrations of each water quality variable in nitrate-treated ponds and in
control ponds were averaged across the three replications and standard errors of the mean
(𝑠𝑠𝑥𝑥) computed. The data were plotted for each variable (Figs. 1 to 11). In addition,
grand means for each water quality variable were determined in treatment and control
ponds, means were tested for significance, and the results presented in Table 1. Each
variable is discussed below.
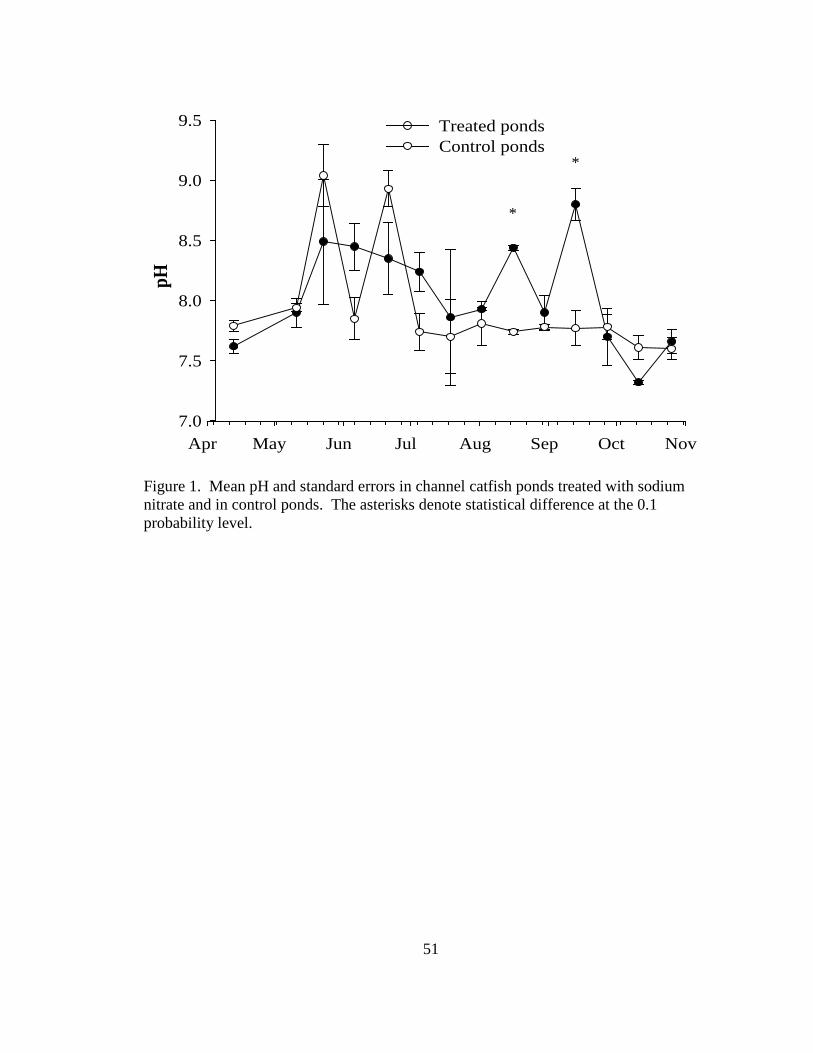
Mean values for pH varied between 7.5 and 9.0 (Fig. 1). The control ponds had
two peaks in pH near 9 – one in late May and the other in late June. Except for these two
peaks, pH was between 7.6 and 7.9 on all sampling dates in control ponds. The pH of
nitrate-treated pond waters increased to near 8.5 by late May and then declined slightly
until early August. There were two dates, one in mid August and one in mid September,
when pH reached 8.5 and 8.8, respectively, to exceed the pH of the control ponds
(P<0.1). Although pH was greater in nitrate-treated ponds on two sampling dates, the
grand mean for pH was not different between nitrate-treated and control ponds (Table 2).
26
These pH values are similar to those typically encountered in channel catfish production
experiments at the EWS Fisheries Center (Boyd, 1990).
The pH of pond water increases during the daytime in response to removal of
carbon dioxide for use by phytoplankton in photosynthesis, and it declines at night when
photosynthesis stops but respiration continues (Boyd and Tucker, 1998). Daytime peaks
in pH observed in this study were related to increases in photosynthetic rate by
phytoplankton rather than from sodium nitrate additions.
The total alkalinity concentration increased from near 30 mg/L at the beginning of
the experiment to around 50 mg/L in both nitrate-treated and control ponds (Fig. 2). An
increase in alkalinity in channel catfish ponds at the EWS Fisheries Center often occurs
between spring and fall (Boyd, 1974, Boyd and Tucker, 1998). This increase is thought
to result from the alkaline reaction of denitrification and from concentration of ions by
evaporation. During the period July through September, total alkalinity concentration
tended to be higher in treated ponds than in control ponds, but neither means for
individual sampling dates (Fig. 2) or grand means (Table 2) differed (P>0.1).
One rationale for applying sodium nitrate to aquaculture ponds is to oxidize
bottom soils (Boyd, 1995a). Nitrate is used by denitrifying bacteria, and as long as
nitrate is present at the sediment surface and in sediment pore water, the redox potential
should remain poised at a level conducive to denitrification. The denitrification reaction
produces hydroxide and thereby contributes to alkalinity. Much of the nitrate applied to
the ponds obviously was denitrified because the nitrate-nitrogen concentration never
reached 2 mg/L (Fig. 3), but the total amount of sodium nitrate applied was equivalent to
a concentration of 32 mg/L of nitrate-nitrogen. Nevertheless, periodic application of
27
sodium nitrate to ponds in this study did not result in a greater concentration of total
alkalinity than found in control ponds.
Nighttime aeration of ponds was effective in avoiding excessively low dissolved
oxygen concentration (Fig. 4). Early morning concentrations of dissolved oxygen in both
treated and control ponds usually were above 6 mg/L. Only on the last sampling date in
the treated ponds did average dissolved oxygen concentration fall slightly below 4 mg/L.
Most commercial channel catfish producers strive to avoid early morning dissolved
oxygen concentrations below 3 to 4 mg/L (Boyd and Tucker, 1998). Dissolved oxygen
concentrations tended to decline as the study progressed and fish standing crop and
feeding rate increased. There was no clear difference in dissolved oxygen concentration
as a result of nitrate treatment. There were differences (P<0.1) between control and
treatment ponds on five dates (Fig. 4) – concentrations were higher in treated ponds on
two of these dates. The grand means for dissolved oxygen concentration were 6.84 mg/L
in control ponds and 6.85 mg/L in treated ponds (P>0.1) (Table 2).
Total ammonia-nitrogen concentration in nitrate-treated ponds averaged below
0.1 mg/L until September and then increased to about 0.2 mg/L during September and
early October (Fig. 5). In the control ponds, total ammonia-nitrogen concentrations were
about 0.1 mg/L until July when they increased to more than 0.3 mg/L. Concentrations in
controls then declined to values numerically less than those of the treated ponds. No
differences in total ammonia-nitrogen were observed for individual sampling dates (Fig. 5)
or for grand means (Table 2).
The main source of ammonia was excretion by fish. Ammonia is lost from the
water by diffusion to the atmosphere, uptake by phytoplankton, and oxidation to nitrate
28
by nitrifying bacteria (Tucker and Hargreaves, 2004). Nevertheless, concentrations of
total ammonia-nitrogen up to 2 mg/L sometimes are observed in ponds on the EWS
Fisheries Center (Boyd, 1990). There are two likely reasons for the low concentrations of
ammonia-nitrogen found in this study. Ponds were stocked at a modest rate, and feed
was applied conservatively. This reduced nitrogen input and favored effective
conversion of nitrogen in feed to nitrogen in fish. Mechanical aeration was used at night,
and low concentrations of dissolved oxygen did not occur. The oxidation of ammonia to
nitrate by nitrifying bacteria is more effective in ponds where dissolved oxygen is not low
(Boyd and Tucker, 1998).
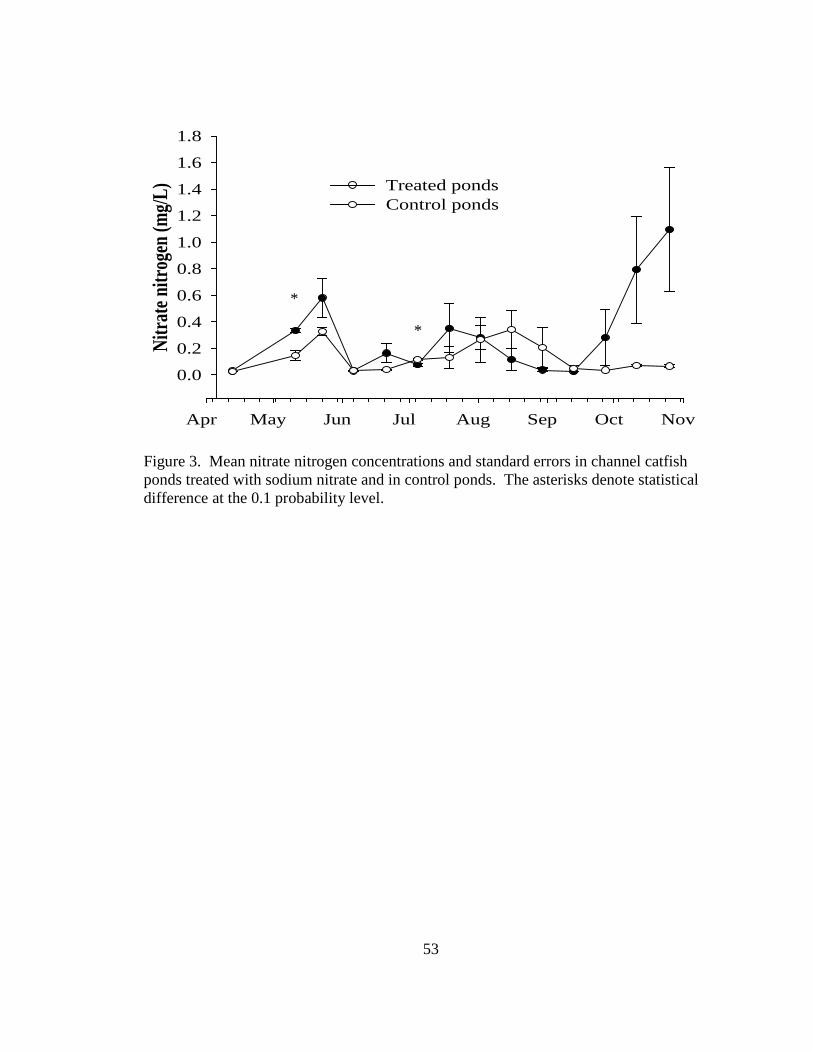
As expected, mean nitrate-nitrogen concentrations were numerically greater in
treated ponds than in control ponds on several dates (Fig. 3). However, there was much
variability in nitrate-nitrogen concentrations, and on only one date did sodium nitrate-
treated ponds contain more nitrate-nitrogen (P<0.1) than control ponds. The grand mean
for nitrate-nitrogen was higher (P<0.1) in the treated ponds than in the control ponds
(Table 2). The greatest nitrate-nitrogen concentrations in treated ponds were observed in
October. A maximum, average concentration of slightly above 1 mg/L was achieved on
the last sampling date. The sodium nitrate-treatment rate was 2 mg/L nitrate-nitrogen at
2-week intervals. Concentrations were measured in the ponds 1 week after application.
Nitrate is not absorbed by soil or sediment (Brady, 2002), and water discharge did not
occur through the drain pipe during the study. This suggests that the loss of nitrate
resulted primarily from phytoplankton uptake or denitrification.
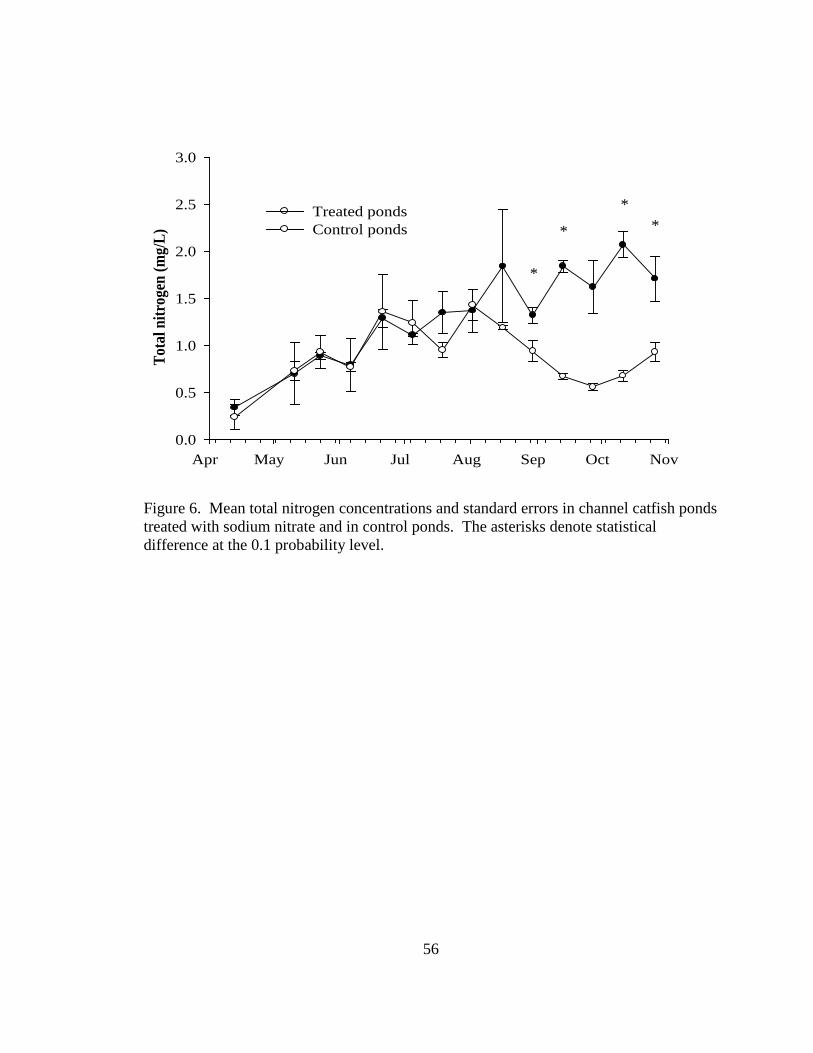
Total nitrogen concentration followed a trend of change similar to nitrate-nitrogen
concentration. It increased to a peak in control ponds during July and August with
29
maximum average concentration of 1.4 mg/L (Fig 6). There was a trend of increasing
total nitrogen concentration from the beginning to end of the study in the treated ponds,
and on the last five sampling dates, total nitrogen was at higher concentration (P<0.1) in
the treated ponds than in the control ponds (Fig. 6). This pattern probably resulted from
the continuing input of sodium nitrate to treated ponds. The grand mean for total
nitrogen was greater (P<0.1) in treated ponds than in the controls.
Soluble reactive phosphorus concentrations (Fig. 7) and total phosphorus
concentrations (Fig. 8) were higher (P<0.1) on several dates, and the grand means for
these variables were greater (P<0.1) in treated ponds than in control ponds (Table 2).
This was unexpected, for Masuda and Boyd (1994b) suggested that application of sodium
nitrate to ponds should increase the redox potential of sediment, lessen the solubility of
iron phosphate in the sediment, and result in a lower soluble reactive phosphorus
concentration in the water. This unexpected finding cannot be explained from data
available in this study. Both treatment ponds and control ponds received similar
quantities of feed, and phosphorus fertilizers were not applied to any of the ponds. Water
for initially filling ponds and for maintaining water levels in them was from the same
source.
All ponds were somewhat turbid with sediment particles suspended by erosion
within ponds caused by aerator-generated water currents. Aerators of less than 0.5 hp are
not available at the EWS Fisheries Center and the ponds used in this study were only 0.04
ha in area. The aeration rate was quite high – 12.5 hp/ha. Nevertheless, the turbidity was
greater (P<0.1) in treated ponds than in control ponds on five sampling dates (Fig. 9), and
the grand mean for turbidity also was higher (P<0.1) in the treated ponds (Table 2).
30
Treatments and control ponds were aerated at the same rate, and the greater turbidity in
treatment ponds is thought to have resulted from greater plankton biomass in them. The
converse was true for Secchi disk visibility (Fig. 10; Table 2), because increasing
turbidity causes the Secchi disk visibility to decline. The treated ponds had especially
high turbidity and low Secchi disk visibility during late summer and fall.
Chlorophyll a concentration often is used as an indicator of phytoplankton
biomass (Franson and Eaton, 2005). Chlorophyll a concentrations (Fig. 11) were higher
in treated ponds (P<0.1) on four sampling dates between mid July and November and
numerically higher on several other dates. The grand mean for chlorophyll a
concentration also was higher (P<0.1) in treated ponds. This finding confirms that there
was greater phytoplankton biomass in treated ponds, and this likely is the reason for the
greater turbidity and a lower Secchi disk visibility. The greater concentration of
phosphorus in treated ponds favors phytoplankton growth. Nitrate also is a plant nutrient,
and greater concentrations of this nutrient in the treated ponds might have stimulated
phytoplankton growth.
Previous studies at the EWS Fisheries Center have revealed that organic nitrogen
accumulates in bottom of ponds, and mineralization of organic matter provides enough
nitrogen to support abundant phytoplankton growth in older ponds (Swingle et al. 1963).
However, many ponds, including the ones in this study, were recently renovated with the
removal of sediment. A study by Yuvanatemiya and Boyd (2006) revealed that sediment
removal greatly reduced the concentration of labile organic matter in pond bottoms, and
Boyd et al. (2008) reported a large response to nitrogen fertilization in renovated ponds.
31
Nitrate applied to the treatment ponds may have stimulated phytoplankton growth beyond
that possible from nitrogen entering ponds from feeding waste and other sources.
Phytoplankton communities
Cells, colonies, or filaments of each phytoplankton species were counted. The
results of the counts were reported as the number of phytoplankton individuals, i.e., cells,
colonies, or filaments per milliliter. The abundance of phytoplankton individuals did not
differ between treatments on individual dates (P>0.1), but the number of individuals was
numerically larger in treated ponds than in control ponds on nine or 14 sampling dates
(Fig. 12). The grand means for total abundance of phytoplankton were 266, 916
individuals/mL in control ponds and 331,845 individuals/mL in treated ponds (Fig. 13).
However, variation in phytoplankton abundance was great and the grand means did not
differ (P>0.1).
This observation does not necessarily conflict with the conclusion based on
chlorophyll a concentration that there was greater phytoplankton biomass in nitrate-
treated ponds than in control ponds. Phytoplankton species vary greatly in size (Wetzel,
2001, Boyd and Tucker, 1998). Two species may be present in the phytoplankton
community in equal abundance, but the larger of the two species would constitute the
greater biomass. Phytoplankton cells tend to contain an amount of chlorophyll a that
increases in direct proportion with their biomass (Boyd, 1990). For this reason,
chlorophyll a concentration is considered more reliable than phytoplankton abundance as
a way of assessing phytoplankton biomass.
32
Secchi disk visibility and turbidity frequently are used to roughly estimate the
relative abundance of phytoplankton in aquaculture ponds (Almazan and Boyd, 1978).
However, suspended soil particles and non-living organic matter also contribute to
turbidity and influence Secchi disk visibility (Boyd and Tucker, 1998). Thus, chlorophyll
a concentration also is considered a better index of phytoplankton biomass than Secchi
disk visibility or turbidity.
The phytoplankton community (Fig. 14) in control ponds consisted largely of
genera of Cyanophyta (blue-green algae), or as some prefer to call them, cyanobacteria.
The abundance of blue-green algae was similar in sodium nitrate-treated and control
ponds, but the treated ponds contained more (P<0.1) Chlorophyta (green algae). The
percentage of blue-green algae in phytoplankton communities was about 75% in treated
ponds and roughly 92% in control. Diatoms were not common in either treated or control
ponds as indicated by the low abundance of Chrysophyta (Fig. 14).
The most abundant blue-green algae in control and treated ponds were species of
Microcystis, Oscillatoria, and Anabaena (Figs. 15 and 16). According to Jüttner and
Watson (2007), all three of these genera have been associated with production of the
odorous compounds geosmin (trans-1, 10-dimethyl-trans-9-decalol) and MIB (methyl-
isoborneol). These compounds are excreted into the water by algae and absorbed by fish
to impart an off-flavor in fish flesh (Tucker, 2000, 1996, Tucker and van der Ploeg,
1999). Off-flavor makes fish less acceptable in the market and is a serious problem in
channel catfish culture (Tucker, 2007, Hanson and Schrader, 2006).
Three other genera of blue-green algae were common. The genus Trichodesmium
was found in both sodium nitrate-treated ponds and control ponds; this genus has not
33
been associated with production of odorous compounds. Treated ponds contained
Raphidiophis, another genus not associated with production of odorous compounds,
while Lyngbya, a genus containing species capable of producing odorous compounds,
was present in the control ponds.
Complete lists of all planktonic algal genera found in control and sodium nitrate-
treated ponds are provided in Table 3. A total of 27 genera were found in treated ponds,
and 28 genera were observed in the control ponds. A total of 42 samples each were
collected from treatment and control ponds (14 sampling dates × three replications).
Only Microcystis was found in every sample from treatment and control ponds. The
genera Gleocystis, Coelastrum, and Oscillatoria were found in at least 20 samples from
both control and treatment ponds. Melosira also was common occurring in 11 samples
from treated ponds and 17 samples from control ponds. The desmid, Pediastrum,
occurred in 20 samples from treatment ponds, but only four samples from control ponds.
It was the only genus that appeared to be favored by sodium nitrate treatment. Although
Anthrodesmus, Closterium, and Lyngbya were found only in control ponds, and
Selenastrum and Euglena were found only in control ponds, these occurrences were only
in one to three samples and not considered indicative of a treatment effect.
Phytoplankton communities in which several genera (or species) are rather
common are considered to have a greater diversity than communities in which most
individuals are of one or a few genera. Highly diverse phytoplankton communities are
considerably more stable than less diverse ones and are favored by aquaculturists (Boyd
and Tucker, 1998). Margalef (1958) presented a simple equation for estimating diversity
as follows:
34
H = 𝑆𝑆−1ln 𝑁𝑁
Where H = the Margalef diversity index; S = the number of species (or other taxonomic
group) of phytoplankton; N = the total number of phytoplankton individuals.
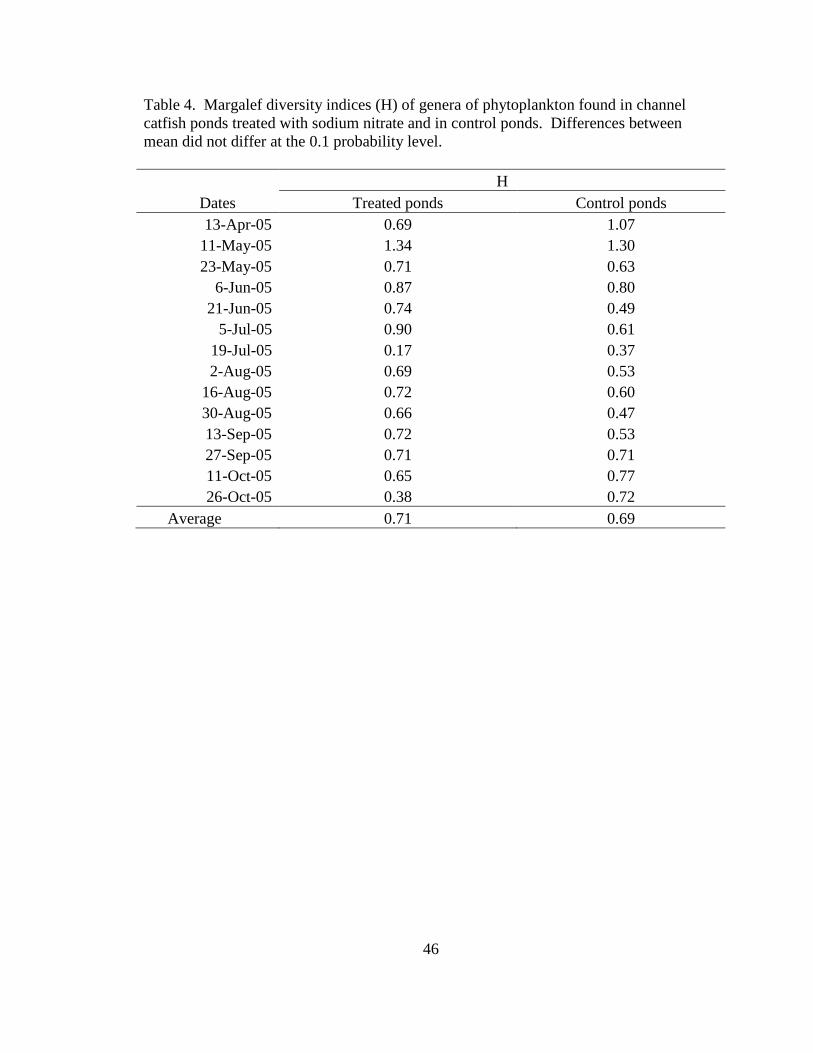
Diversity indices (Table 4) ranged from 0.17 on 17 July to 1.34 on 11 May in
sodium nitrate-treated ponds, and from 0.37 on 19 July to 1.30 on 11 May in control
ponds (Table 3). The average diversity index was 0.69 in control ponds and 0.71 in
treated ponds. There were no differences between treated and control ponds with respect
to average diversity on any sampling date or for the grand means (P>0.1).
The analysis of the algal count data suggests that treatment with sodium nitrate
did not cause changes in phytoplankton composition. Although there was a slightly
lower percentage of blue-green algae in treated ponds, nitrate stimulated phytoplankton
growth and the abundance of blue-green algae was equal to that of the treated ponds.
Sodium nitrate treatment does not seem to be a promising means of lessening the
abundance of phytoplankton species responsible for off-flavor. At least in these
freshwater ponds, nitrate treatment did not increase the abundance of diatoms. However,
an earlier study by Daniels and Boyd (1993) showed that nitrate fertilization stimulated
diatom abundance in brackishwater ponds. Similar results also were achieved in farm
trials with sodium nitrate fertilization of marine shrimp ponds in Thailand (Thailand
Department of Fisheries, unpublished report).
35
Sediment
The results of sediment analyses made before stocking ponds with fish and at the
end of the culture period (Table 5) revealed that the changes in sediment organic matter
concentration and pH during the production period did not differ (P>0.1) between the
treatment and control ponds. The redox potential, however, exhibited a greater decline
during the crop in the control ponds than in the treated ponds. The higher pH in the
sediment of treated ponds is most likely the result of increased denitrification caused by
the addition of nitrate.
When drained for harvest, the newly exposed bottoms of the nitrate-treated ponds
were a lighter color than those of the control ponds. Reduced sediment has a darker color
than oxidized sediment (Boyd, 1995a). Thus, the visual evidence supports the redox
potential data in Table 4 and provides additional evidence that sodium nitrate application
enhanced the oxidation of pond bottoms.
Fish production
Feed input to the ponds was almost identical, but fish survival was numerically
greater in the nitrate-treated ponds than in the control ponds (Table 6). The numerically
greater production and better feed conversion ratio (FCR) in the treated ponds resulted
primarily from greater survival of fish in treated ponds than in control ponds. Had
survival in the control been equal to that of the treatment and the fish been of the same
weight, average production in the control ponds would have been similar to that of the
treatment ponds.
36
Fish production was equivalent to 3,388 kg/ha in the control ponds and 3,860
kg/ha in the treated ponds. The corresponding FCR values were 1.48 and 1.25,
respectively. However, neither production nor FCR differed (P>0.1) between control and
treatment ponds. The production in this experiment was lower than that normally
achieved by channel catfish farmers, because fewer fish were stocked (10,000 kg/ha as
compared to 12,500 to 15,000 kg/ha) and feed was applied conservatively. The FCR was
excellent in both control and treatment ponds, when compared to FCRs of 2.0 to 3.0
typically achieved by farmers (Greg Whitis, personal communications). Boyd et al.
(2000) made a survey of 25 channel catfish ponds in Alabama and reported an average
FCR of 1.88 with a range of 1.25 to 2.5.
Assessment of sodium nitrate treatment
The results of this study indicate that sodium nitrate treatment of channel catfish
ponds did not lead to significant improvement in bottom soil or water quality. The
treatment did not cause a greater total alkalinity concentration, a higher concentration of
dissolved oxygen, a reduction in the abundance of blue-green algae, or an increased
diversity of the phytoplankton community. Sodium nitrate treatment did result in a
slightly higher concentration of both soluble reactive and total phosphorus, a greater
availability of nitrogen for plants, and a slightly higher phytoplankton biomass. The
increase in phosphorus cannot be explained, but the most likely source of increased
nitrogen was the sodium nitrate treatment. An increase in phytoplankton biomass in
aquaculture ponds with feeding is not necessarily a desirable outcome, because it may
lead to greater nighttime depletion of dissolved oxygen concentration.
37
With respect to bottom soil, nitrate treatment did result in less decline
in redox potential between the beginning and end of the grow-out period. This effect
also was obvious at pond draining, for freshly-drained pond bottoms of nitrate-treated
ponds had a lighter color than those in control ponds. A similar observation was made by
Drs. Noel Morrissey and Craig Lawrence when nitrate-treated ponds for yabbie culture
(Cherax destructor) in Western Australia were compared with control ponds (Boyd,
1995a).
The increase in redox potential at the soil-water interface is considered desirable
for it lessens the opportunity for reduced organic and inorganic substances from diffusion
from anaerobic zones in the pond bottom into the pond water.
There was no significant improvement in fish production variables as a result of
sodium nitrate treatment. Thus, the few differences in water quality, phytoplankton
biomass, and soil chemistry observed in this study did not have an effect on fish survival
and growth.
Two earlier pond studies of sodium nitrate treatment, one in channel catfish ponds
(Pavek, 1998) and the other in marine shrimp ponds in Thailand (Thailand Department of
Fisheries, unpublished report) produced results similar to this study. Few differences in
pond water or sediment quality were observed and production was not better in treated
ponds than in control ponds. Nevertheless, at harvest, lighter-colored sediment was
observed in both studies suggesting that nitrate treatment oxidized the sediment-water
interface. This effect alone might make sodium nitrate treatment beneficial in highly
intensive aquaculture ponds. The effect might be especially beneficial in intensive
marine shrimp ponds where high sulfate concentrations in the water are normal and favor
38
hydrogen sulfide production in anaerobic zones. Hydrogen sulfide is very toxic to shrimp
and fish (Boyd and Tucker, 1998). However, at moderate stocking and feeding rates,
there does not appear to be any significant benefit of treatment freshwater ponds for
channel catfish production with sodium nitrate.
Laboratory Study
Dissolved oxygen and nitrate depletion trials
Several concentrations of nitrate-nitrogen were added to BOD bottles containing
clear, dechlorinated tap water and 2-g pond sediment. The dissolved oxygen
concentration declined rapidly for 6 days in both control and treated bottles as illustrated
for 0 and 8 mg/L nitrate-nitrogen treatments (Fig. 17). The average, daily depletion of
dissolved oxygen concentration over the first 6 days of incubation was as follows: 0
mg/L NO3--N, 0.775 mg/L; 0.5 mg/L NO3
--N, 0.770 mg/L; 1 mg/L NO3--N, 0.790 mg/L;
2 mg/L NO3--N, 0.780 mg/L; 4 mg/L NO3
--N, 0.795 mg/L; 8 mg/L NO3-
The experiment was repeated in BOD bottles containing pond water with a
moderate plankton bloom. Again, there was little difference among nitrate-nitrogen
additions and dissolved oxygen concentration as illustrated in Fig. 18 for 0 and 8 mg/L
NO
-N, 0.785 mg/L.
Thus, the addition of nitrate to the sediment-water systems in the BOD bottles did not
have a measurable effect on the dissolved oxygen concentration.
3-N treatments. The decline in dissolved oxygen concentration was more rapid than
in the trial with tap water (Fig. 17). The average, daily rates for dissolved oxygen decline
over the first 6 days were as follows: 0 mg/L NO3--N, 1.49 mg/L; 0.5 mg/L NO3
--N,
39
1.45 mg/L; 1 mg/L NO3--N, 1.44 mg/L; 2 mg/L NO3
--N, 1.44 mg/L; 4 mg/L NO3--N,
1.50 mg/L; 8 mg/L NO3-
In this study, the redox potential and pH were measured in wet sediment covered
with a thin layer of water. The redox potential was initially lower in sediment samples
treated with greater amounts of nitrate-nitrogen (Fig. 19). However, by day 3, redox
-N, 1.55 mg/L. These findings reveal that there was no decline
in the rate of dissolved oxygen disappearance from the water in the BOD bottles as a
result of nitrate addition.
The dissolved oxygen depletion trials were repeated using more bottles so that
nitrate-nitrogen concentrations could be measured at intervals. The results (Table 7)
show that nitrate-nitrogen concentrations did not decline during the trials. This
observation suggests that denitrification did not occur in BOD bottles.
The dissolved oxygen depletion studies revealed that nitrate treatment did not
reduce the rate of dissolved oxygen decline in aerobic systems of water or sediment. The
studies also cast doubt on the assumption that adding nitrate will spare dissolved oxygen
in ponds by stimulating denitrification (Boyd, 1995b). As long as there is dissolved
oxygen in the water above the sediment, the sediment-water interface will be aerobic and
denitrification will not occur. Nitrate in water might diffuse or move with infiltrating
waters into deeper layers of sediment to stimulate denitrification. However, denitrifying
bacteria do not use molecular oxygen, so this action would not spare dissolved oxygen.
The dissolved oxygen would be used by non-chemotrophic bacteria in processes
unrelated to denitrification.
Redox potential and pH
40
potential was similar at all nitrate-nitrogen rates. The redox potential tended to increase
in all treatments and control over time reaching peak values after about 3 weeks as
illustrated in Fig. 20. The final redox potential values ranged from 126 mv in the 32
mg/kg treatment to 196 mv in the 4 mg/kg treatment, but none of the means differed
(P>0.05).
The pH tended to fluctuate between 6.6 and 6.9 over time in all treatments and
control. The average initial pH in all treatments was 6.87 while the final average pH was
6.79. The pH, nevertheless, tended to increase with increasing nitrate-nitrogen rate as
illustrated for days 1 and 32 (Fig. 21). This rise in pH with respect to sodium nitrate
addition likely resulted from the alkaline nature of the denitrification process.
The initial decline in redox potential caused by increasing the nitrate application
dose was not expected. It has been suggested many times that nitrate addition will poise
the redox potential at the level conducive to denitrification (Boyd, 1995b). However, the
added nitrogen apparently stimulated the decomposition of organic matter by non-
denitrifying bacteria causing the redox potential to fall before the denitrification process
began.
It was extremely difficult to make redox potential measurements in sediment in
the shallow trays. The redox probe is fairly large, and it takes at least 2 or 3 minutes to
reach a stable reading. Thus, when it is inserted into the sediment, oxygenated water
from above the sediment entered the space opened into the sediment around the
circumference of the probe. The introduction of the oxygenated water likely caused the
redox potential to increase.
41
Organic matter decomposition
Contrary to common belief, the organic matter in pond sediment tends to be fairly
stable (Boyd, 1995a) and it decomposes slowly. The Walkley-Black procedure used for
measuring sediment organic carbon is not highly precise (Boyd, 1995a). Thus, it is not
surprising that the soil incubation study (Table 8) did not reveal a significant reduction in
soil organic carbon concentration over an 8-week period. Moreover, nitrate application
would only stimulate decomposition of organic matter by denitrifying bacteria. It could
be that the overall rate of sediment organic carbon mineralization is unrelated to the
amount of nitrate present.
Nitrogen uptake by phytoplankton
The lowest abundance of phytoplankton (5 mg/m3 chlorophyll a) consisted
primarily of unidentified diatom species. These algae absorbed nitrate-nitrogen better
than ammonia-nitrogen when provided in individual solutions. However, they actually
absorbed ammonia-nitrogen better than nitrate-nitrogen from a mixed solution, but the
total uptake of nitrogen from the mixed solution was less than for the nitrate solution
(Fig. 22).
The next lowest abundance of phytoplankton was in a sample with 34 mg/m3 of
chlorophyll a (Fig. 22). This sample contained a mixture of green algae. These algae
absorbed ammonia-nitrogen better than nitrate-nitrogen when provided single sources of
the two nutrients. They did not absorb nitrate from the mixed solution, but absorbed
about the same amount of ammonia-nitrogen as from the solution containing only
ammonia-nitrogen.
42
The two samples with the greatest abundance of phytoplankton contained
primarily a single species of Anabaena (a blue-green algae). The uptake of ammonia -
nitrogen was roughly twice that of nitrate-nitrogen in the sample with 242 mg/m3 of
chlorophyll a (Fig. 22). The uptake of nitrogen in ammonium and nitrate were
approximately in the same proportion in the mixture as in the individual solutions. In the
sample with 812 mg/m3
Several authors have assumed that sodium nitrate treatment increased sediment
redox potential (Ripl, 1976, Boyd, 1995b, Avnimelech and Zohar, 1986). It also seems
logical that nitrate additions would stimulate denitrification, a process in which hydroxyl
ion is produced in proportion to the amount of nitrate reduced, resulting in a greater
sediment pH. There have not been studies to verify these assumptions, and laboratory
results reported here do not support them. However, the findings of the pond study lend
chlorophyll a, the uptake of nitrogen in the two forms was nearly
equal from individual solutions and in the same proportion in the mixture.
The results suggest that the community of green algae used ammonium in
preference to nitrate. However, diatom and blue-green algae communities appeared to
use both forms.
Assessment of laboratory study
The laboratory studies did not reveal any appreciable effect of sodium nitrate
treatment on the depletion rate of dissolved oxygen in sediment-water systems.
Treatment with this substance did not have an influence on redox potential, pH, or
organic carbon concentration in sediment samples.
43
some credence to the assumption that nitrate additions will increase redox potential and
pH of sediment.
INVE Technologies provided the results from a laboratory study in which sodium
nitrate treatment of sediment from shrimp ponds greatly accelerated the decline in
sediment chemical oxygen demand concentration during a 4-week incubation period
(Boyd et al., 2007). In the sediment incubation trial of the present study, sodium nitrate
treatment did not accelerate the decline in sediment organic carbon concentration.
44
Table 2. Grand means ± standard errors of water quality variables in channel catfish ponds treated with sodium nitrate and in control ponds. Water quality parameters Control Nitrate
pH 7.98 ±0.08 8.00 ±0.09
Alkalinity (mg/L) 51 ±2 53 ±3
Turbidity (NTU) 112 ±10 175 a ±15
Soluble reactive phosphorus (mg/L)
b
0.022 ±0.001 0.041 a ±0.004
Total phosphorus (mg/L)
b
0.12 ±0.01 0.20 a ±0.02
Ammonia-nitrogen (mg/L)
b
0.106 ±0.027 0.073 ±0.016
Nitrate-nitrogen (mg/L) 0.133 ±0.024 0.299 a ±0.07
Total nitrogen (mg/L)
b
0.90 ±0.06 1.30 a ±0.11
Secchi disk visibility (cm)
b
25 ±2 19 b ±2
Dissolved oxygen (mg/L)
a
6.84 ±0.19 6.85 ±0.29
Chlorophyll a (mg/m3) 27 ±3 75 a ±18b
Means in horizontal represented by the different superscript letters were statistical difference at the 0.1 probability level.
45
Table 3. The number of samples containing different genera of algae found in sodium- nitrate treated ponds and control ponds. There were three replications and 14 sampling dates for a trial of 42 samples from both treatment and control. Phylum Genus Nitrate Control Chlorophyta Chlamydomonas 4 1
Table 4. Margalef diversity indices (H) of genera of phytoplankton found in channel catfish ponds treated with sodium nitrate and in control ponds. Differences between mean did not differ at the 0.1 probability level.
H
Dates Treated ponds Control ponds 13-Apr-05 0.69 1.07
Table 5. Means ± standard errors of organic carbon concentration, redox potential and pH of sediment in ponds treated with sodium nitrate and in control ponds before stocking (beginning) and before harvest (end). Variables Control Nitrate
The different superscript letters between Δ of control and sodium nitrate treatment indicate statistical difference at the 0.1 probability level.
48
Table 6. Means ± standard errors of channel catfish production, amount of feed used, survival rate, and feed conversion ratio from ponds treated with sodium nitrate and in control ponds.
Variables Control Nitrate
Initial fingering weight (kg/ha)
418 ±0.2 420 ±0.2
Feed used (kg/ha)
5,014 ±4.5 4825 ±6
Survival rate (%)
79 ±4 86 ±3
Catfish production (kg/ha)
3,388 ±9.5 3,860 ±7.7
Feed conversion ratio 1.48 ±0.13 1.25 ±0.13
Means did not differ between control and treated ponds at the 0.1 probability level.
49
Table 7. Mean nitrate-nitrogen concentrations (mg/L) remaining in BOD bottles that contained 2 g of sediment and different, initial nitrate-nitrogen concentrations.
Days Nitrate-nitrogen concentrations (mg/L)
0 1 5 10
1 0.0 0.9 d 5.4 c 10.5 b a
2 0.0 1.0 d 5.9 c 11.0 b
4
a
0.0 1.1 d 6.3 c 11.7 b
6
a
0.0 1.2 d 6.5 c 11.6 b
8
a
0.0 1.3 d 7.1 c 12.2 b
12
a
0.1 1.7 d 7.5 c 12.6 b
16
a
0.1 1.7 d 7.5 c 13.0 b
20
a
0.0 1.8 d 7.9 c 13.6 b
24
a
0.3 2.0 d 7.9 c 13.2 b
28
a
0.4 1.8 d 7.2 c 12.4 b a
Means in horizontal represented by the different superscript letters were statistical difference at the 0.05 probability level.
50
Table 8. Mean organic carbon concentration (%) in sediment treated with different nitrate-nitrogen concentrations for different time periods.
Weeks Nitrate-nitrogen concentrations (mg/L)
0 1 2 4 8 16 32
0 1.02 1.06 1.03 1.05 1.06 1.09 1.05
1 1.04 1.03 0.97 1.04 1.05 1.08 1.05
2 1.06 1.07 1.07 1.09 1.09 1.08 1.10
4 0.99 1.00 1.00 1.02 1.00 1.01 1.00
8 1.05 1.00 1.03 1.01 1.03 1.01 1.01
Means did not differ between nitrate-nitrogen concentration and times at the 0.05 probability level.
51
Apr May Jun Jul Aug Sep Oct Nov
pH
7.0
7.5
8.0
8.5
9.0
9.5 Treated ponds Control ponds
Figure 1. Mean pH and standard errors in channel catfish ponds treated with sodium nitrate and in control ponds. The asterisks denote statistical difference at the 0.1 probability level.
*
*
52
Apr May Jun Jul Aug Sep Oct Nov
Tota
l alk
alin
ity (m
g/L)
20
30
40
50
60
70
80
Treated ponds Control ponds
Figure 2. Mean total alkalinity concentrations and standard errors in channel catfish ponds treated with sodium nitrate and in control ponds. The asterisk denotes statistical difference at the 0.1 probability level.
*
53
Apr May Jun Jul Aug Sep Oct Nov
Nitra
te nit
roge
n (mg
/L)
0.0
0.2
0.4
0.6
0.8
1.0
1.2
1.4
1.6
1.8
Treated ponds Control ponds
Figure 3. Mean nitrate nitrogen concentrations and standard errors in channel catfish ponds treated with sodium nitrate and in control ponds. The asterisks denote statistical difference at the 0.1 probability level.
*
*
54
Apr May Jun Jul Aug Sep Oct Nov
Disso
lved
oxyg
en (m
g/L)
2
4
6
8
10
12Treated ponds Control ponds
Figure 4. Mean dissolved oxygen concentrations and standard errors in channel catfish ponds treated with sodium nitrate and in control ponds. The asterisks denote statistical difference at the 0.1 probability level.
*
* * *
*
55
Apr May Jun Jul Aug Sep Oct Nov
Amm
onia
nitro
gen (
mg/L
)
0.0
0.1
0.2
0.3
0.4
0.5
0.6
Treated ponds Control ponds
Figure 5. Mean ammonia nitrogen concentrations and standard errors in channel catfish ponds treated with sodium nitrate and in control ponds.
56
Apr May Jun Jul Aug Sep Oct Nov
Tota
l nitr
ogen
(mg/
L)
0.0
0.5
1.0
1.5
2.0
2.5
3.0
Treated ponds Control ponds
Figure 6. Mean total nitrogen concentrations and standard errors in channel catfish ponds treated with sodium nitrate and in control ponds. The asterisks denote statistical difference at the 0.1 probability level.
*
* *
*
57
Apr May Jun Jul Aug Sep Oct Nov
Solub
le re
activ
e pho
spho
rus (
mg/L
)
0.00
0.02
0.04
0.06
0.08
0.10
0.12
Treated ponds Control ponds
Figure 7. Mean soluble reactive phosphorus concentrations and standard errors in channel catfish ponds treated with sodium nitrate and in control ponds. The asterisks denote statistical difference at the 0.1 probability level.
* *
*
*
*
*
58
Apr May Jun Jul Aug Sep Oct Nov
Total
phos
phor
us (m
g/L)
0.00
0.05
0.10
0.15
0.20
0.25
0.30
0.35
0.40 Treated ponds Control ponds
Figure 8. Mean total phosphorus concentrations and standard errors in channel catfish ponds treated with sodium nitrate and in control ponds. The asterisks denote statistical difference at the 0.1 probability level.
*
* *
*
59
Apr May Jun Jul Aug Sep Oct Nov
Turb
idity
(NTU
)
0
50
100
150
200
250
300
350
400
Treated ponds Control ponds
Figure 9. Mean turbidity concentrations and standard errors in channel catfish ponds treated with sodium nitrate and in control ponds. The asterisks denote statistical difference at the 0.1 probability level.
* *
*
*
*
60
Apr May Jun Jul Aug Sep Oct Nov
Secc
hi di
sk vi
sibili
ty (c
m)
0
10
20
30
40
50
60
Treated ponds Control ponds
Figure 10. Mean secchi disk visibility and standard errors in channel catfish ponds treated with sodium nitrate and in control ponds. The asterisks denotes statistical difference at the 0.1 probability level.
* *
61
Apr May Jun Jul Aug Sep Oct Nov
Chl
orop
hyll
a (m
g/m
3)
0
100
200
300
400
500
Treated ponds Control ponds
Figure 11. Mean chlorophyll a concentrations and standard errors in channel catfish ponds treated with sodium nitrate and in control ponds. The asterisks denote statistical difference at the 0.1 probability level.
*
*
* *
Chl
orop
hyll
a (m
g/m
3 )
62
Apr May Jun Jul Aug Sep Oct Nov
Tota
l alg
al c
ount
(cel
ls/m
l)
0
20x103
40x103
60x103
80x103
100x103
120x103
Treated ponds Control ponds
Figure 12. Mean total abundance of phytoplankton individuals in sodium nitrate-treated and control ponds during the period of study. Means did not differ statistically between treated and control ponds (P>0.1).
63
Figure 13. Grand mean total algae abundance in channel catfish ponds treated with sodium nitrate and in control ponds. There was no statistically significant difference between treated and control ponds (P>0.1).
0
50000
100000
150000
200000
250000
300000
350000
Treated ponds Control ponds
331,845266,916
Tota
l alg
ae (i
ndiv
idua
ls/m
l) 35x104
30x104
25x104
20x104
15x104
10x104
5x10⁴
0
64
Figure 14. Grand mean abundance of major algal taxons in sodium nitrate-treated and control ponds during the study. The asterisk denotes statistical difference at the 0.1 probability level.
Figure 15. Mean abundance of genera of blue-green algae found in sodium nitrate-treated ponds during the period of study. The different superscript letters indicate statistical difference among grand mean for abundance of genera of blue-green algae at the 0.1 probability level.
Figure 16. Mean abundance of genera of blue-green algae found in control ponds during the period of study. The different superscript letters indicate statistical difference among grand mean for abundance of genera of blue-green algae at the 0.1 probability level.
ab ab
b
b
a
67
Days
0 2 4 6 8 10 12 14 16 18
Diss
olve
d ox
ygen
(mg/
L)
0
1
2
3
4
5
6
7
8
Nitrate 0 mg/LNitrate 8 mg/L
Figure 17. Mean dissolved oxygen concentrations in tap water containing 0 and 8 mg/L of nitrate-nitrogen for different incubation periods in BOD bottles to which a 2-g layer of sediment had been added.
68
Days
0 2 4 6 8 10 12
Diss
olve
d ox
ygen
(mg/
L)
0
2
4
6
8
10
12
Nitrate 0 mg/LNitrate 8 mg/L
Figure 18. Mean dissolved oxygen concentrations in pond water containing a moderate plankton bloom at 0 and 8 mg/L of nitrate-nitrogen in BOD bottles for different incubation periods.
69
Nitrate-nitrogen (mg/L)
0 5 10 15 20 25 30 35
Redo
x po
tent
ial (
mV)
-300
-250
-200
-150
-100
-50
0
50
100
1 Day 2 Days 3 Days
Figure. 19. Mean redox potential in laboratory water-sediment systems at 1, 2, and 3 days at different concentrations of nitrate-nitrogen.
70
Dates
0 5 10 15 20 25 30 35
Redo
x po
tent
ial (
mV)
-300
-200
-100
0
100
200
300
Nitrate 0 mg/L Nitrate 8 mg/L Nitrate 32 mg/L
Figure 20. Mean redox potential in laboratory water-sediment systems following addition of 0, 8, and 32 mg/L of nitrate-nitrogen.
71
Nitrate-nitrogen (mg/L)0 5 10 15 20 25 30 35
pH
6.70
6.75
6.80
6.85
6.90
6.95
1 day 32 days
Figure 21. Mean pH in laboratory water-sediment systems at 1 and 32 days after treatment with different concentrations of nitrate-nitrogen.
72
Figure 22. Rate of nitrogen uptake from solution containing 0.5 mg/L ammonium-nitrogen, 0.5 mg/L nitrate-nitrogen, or 0.5 mg/L ammonium-nitrogen + 0.5 mg/L nitrate-nitrogen (mixture) during 12 hr exposure in natural daylight.
0 0.1 0.2 0.3 0.4 0.5 0.6 0.7 0.8 0.9 1
MixNitrate
AmmoniumMix
NitrateAmmonium
MixNitrate
AmmoniumMix
NitrateAmmonium
812
242
345
Nitrogen uptake (mg/L per 12 hrs)
Chlorophyll a(mg/m3)
AmmoniumNitrate
5
34
242
812
Mixture
Mixture
Mixture
Mixture
73
LITERATURE CITED
Almazan, G. and C. E. Boyd. 1978. An evaluation of Secchi disk visibility for
estimating plankton density in Fish ponds. Hydrobiologia 61(3):205-208.
Avnimelech, Y., G. Ritvo and M. Kochva. 2004. Evaluating the active redox and
organic fractions in pond bottom soils: EOM, easily oxidized material.
Aquaculture 233(1-4):283-292.
Avnimelech, Y. and G. Zohar. 1986. The effect of local anaerobic conditions on growth
retardation in aquaculture systems. Aquaculture(Amsterdam) 58(3-4):167-174.
Ayub, M., C. E. Boyd and D. Teichert-Coddington. 1993. Effects of urea application,
aeration, and drying on total carbon concentrations in pond bottom soils. The
Progressive Fish-Culturist 55(3):210-213.
Boyd, C. A., P. Pengseng and C. E. Boyd. 2008. New nitrogen fertilization
recommendations for bluegill ponds in the southeastern United States. North
American Journal of Aquaculture 70(3):303-313.
Boyd, C. E. 1974. Water quality in catfish ponds. Journal of Marine Science of Alabama
2:19-30.
Boyd, C. E. 1990. Water quality in ponds for aquaculture. Alabama Agricultural
Experiment Station, Auburn University, Alabama, USA.
74
Boyd, C. E. 1995a. Bottom soils, sediment, and pond Aquaculture. Chapman & Hall,
New York, USA.
Boyd, C. E. 1995b. Potential of sodium nitrate to improve environmental conditions in
aquaculture ponds. World Aquaculture 26(2):38-39.
Boyd, C. E. 1997. Practical aspects of chemistry in pond aquaculture. The Progressive
Fish-Culturist 59(2):85-93.
Boyd, C. E., O. Decamp, R. Crab and W. Verstraete. 2007. Improving conditions in
shrimp and fish ponds. Aqua Culture AsiaPacific Magazine 3(5):27-28.
Boyd, C. E., J. Queiroz, J. Lee, M. Rowan, G. N. Whitis and A. Gross. 2000.
Environmental assessment of channel catfish Ictalurus punctatus farming in
Alabama. Journal of the World Aquaculture Society 31(4):511-544.
Boyd, C. E., M. E. Tanner, M. Madkour and K. Masuda. 1994. Chemical
characteristics of bottom soils from freshwater and brackishwater aquaculture
ponds. Journal of the World Aquaculture Society 25(4):517-534.
Boyd, C. E. and C. S. Tucker. 1992. Water quality and pond soil analyses for