Page 1
ORIGINAL PAPER
Effect of soil-applied calcium carbide and plant derivativeson nitrification inhibition and plant growth promotion
M. Kaleem Abbasi • M. Manzoor
Received: 29 July 2011 / Revised: 8 February 2012 / Accepted: 3 August 2012 / Published online: 29 March 2013
� Islamic Azad University (IAU) 2013
Abstract The aim of this study was to evaluate the rel-
ative performance of three nitrification inhibitors (NIs) viz.
calcium carbide (CaC2), and plant derivatives of Pongamia
glabra Vent. (karanj) and Melia azedarach (dharek) in
regulating N transformations, inhibiting nitrification and
improving N recovery in soil–plant systems. In the first
experiment under laboratory incubation, soil was amended
with N fertilizer diammonium phosphate [(NH4)2HPO4] at
a rate of 200 mg N kg-1, N ? CaC2, N ? karanjin, and
N ? M. azedarach and incubated at 22 �C for 56 days
period. Changes in total mineral N (TMN), NH4?–N and
NO3-–N were examined during the study. A second
experiment was conducted in a glasshouse using pots to
evaluate the response of wheat to these amendments.
Results indicated that more than 92 % of the NH4? initially
present had disappeared from the mineral N pool by the
end of incubation. Application of NIs i.e., CaC2, karanjin,
and M. azedarach resulted in a significant reduction in the
extent of NH4? disappearance by 49, 32, and 13 %,
respectively. Accumulation of NO3-–N was much higher
in N amended soil 57 % compared to 11 % in N ? CaC2,
13 % in N ? karanjin, and 18 % in N ? M. azedarach.
Application of NIs significantly increased growth, yield,
and N uptake of wheat. The apparent N recovery in
N-treated plants was 20 % that was significantly increased
to 38, 34, and 37 % with N ? CaC2, N ? karanjin, and
N ? M. azedarach, respectively. Among the three NIs
tested, CaC2 and karanjin proved highly effective in
inhibiting nitrification and retaining NH4?–N in the min-
eral pool for a longer period.
Keywords Nitrification � Nitrification inhibitor � N
recovery � NH4? retention � NO3
- accumulation � N losses
Introduction
Nitrogen is an essential nutrient controlling the diversity,
dynamics, and functioning of many terrestrial, freshwater,
and marine ecosystems. Agricultural ecosystems depend
heavily on large inputs of N fertilizer to sustain produc-
tivity, as naturally fixed N is seldom adequate for high-
production systems (Dinnes et al. 2002; Subbarao et al.
2006a; Abbasi and Khizar 2012). However, N is a highly
dynamic and mobile element and significant N losses occur
as a result of NO3- leaching, denitrification, runoff, NH3
volatilization and gaseous emissions of N2O, and NO to the
atmosphere (Zaman et al. 2009). These losses of N have
long-term adverse ecological and environmental effects
contributing to eutrophication, loss of aquatic biodiversity,
and increased N2O emissions (Warneke et al. 2011).
Most of the fertilizer N applied to soils (90 %) for
agriculture production is in the form of ammonium
(NH4?), or NH4
?-producing compounds. According to IFA
report, world apparent ammonia consumption for the Year
2010 was about 121 million tonnes (IFA 2012). Much of
this NH4? is usually oxidized quite rapidly to NO3
-, a
highly mobile form of N, providing a much greater
potential for N to be lostbeyond the rooting zone (leaching)
and into the atmosphere as gaseous molecules (N2O, NO,
and N2) through denitrification (Subbarao et al. 2006a).
It is estimated that nearly 70 % of the applied N from
managed ecosystems is lost through nitrification and
M. Kaleem Abbasi (&) � M. Manzoor
Department of Soil and Environmental Sciences,
Faculty of Agriculture, The University of Poonch,
Rawalakot Azad Jammu and Kashmir, Pakistan
e-mail: [email protected]
123
Int. J. Environ. Sci. Technol. (2013) 10:961–972
DOI 10.1007/s13762-013-0225-0
Page 2
subsequent processes (Raun and Johnson 1999; Glass
2003). These losses result in serious environmental con-
sequences and inefficient use of both soil and applied N
(Raun and Johnson 1999; Subbarao et al. 2006a).
Controlling the process of nitrification through inhibi-
tion or suppression of nitrifiers in soil is perhaps one of the
most effective strategies to reduce N losses by NO3-
leaching and by gaseous N emissions that occur in nitrifi-
cation (Rodgers 1986; Prasad and Power 1995; Subbarao
et al. 2006b). Field evaluations suggested that if nitrifica-
tion rates are reduced in agricultural systems, plants have
more time to take up available N, thereby improving N
recovery and uptake and reducing NO3- leaching and
associated off farm environmental impacts(Rodgers 1986;
Subbarao et al. 2006b).
The losses of applied N associated with nitrification
could be controlled or reduced by applying nitrification
inhibitors (NIs). Rapid nitrification or oxidation of NH4? to
NO3- in soil catalyzed by microbes had been found to be
inhibited by NIs included nitrapyrin (2-chloro-6-tricholoro
methyl pyridine), sodium azide, sodium chlorate, dicyan-
diamide (DCD), ATC (4-amino-1-2-4-triazole), N-serve,
and certain other compounds (McCarty 1999; Abbasi et al.
2003; Fangueiro et al. 2009; Khalil et al. 2009; Zaman
et al. 2009; Souri 2010; Pereira et al. 2010). The use of
these synthetic NIs has been restricted to the academic
experimental levels because of high cost, lack of avail-
ability, and adverse side effects (Patra and Sukhma 2009).
Apart from these chemically synthesized NIs, nitrifica-
tion inhibitory properties of some inexpensive compounds
like calcium carbide (CaC2) and several plants materials
like Karanji (Pongamia glabra), Neem (Azaddirachta
indica), and tea (Camellia sinensis) waste have been
evaluated by many researchers and their advantages and
disadvantages have been reported (Freney et al. 2000,
Kiran and Patra 2003; Majumdar 2002; Abbasi et al. 2011).
Among these NIs, acetylene (C2H2) has been shown to be a
potent inhibitor of nitrification (Freney et al. 2000). How-
ever, C2H2 is a gas, therefore, it is difficult to apply and
maintain at the required concentration in soil to inhibit the
oxidation of ammonium. This problem can be overcome by
coating calcium carbide with wax (as acetylene is a product
of calcium carbide hydrolysis), or by forming a matrix with
an insoluble material, to slow down its reaction with water,
and produce acetylene in situ in soil (Freney et al. 1992;
Smith et al. 1993; Freney et al. 2000).
The plant karanji is a source of furanoflavonoid
‘‘karanjin’’ which has been identified as having nitrifica-
tion inhibitory properties. The nitrification inhibition by
karanjin was observed to remain high for a period of
approximately 6 weeks, with inhibition ranging between 9
and 76 % for a range of soils studied (Majumdar et al.
2004). Similarly, fruits of dharek (Melia azedarach) are
poisonous to humans and these are chemically related to
Azadirachtin, the primary insecticidal compound in the
commercially important neem oil. These compounds are
probably antibacterial in action and display insecticidal
properties; however, their effects on soil fertility and plant
mineral uptake are not clear. In fact, a positive effects of
fresh melia ground leaves on growth and mineral compo-
sition of plum hybrids during their acclimatization, was
observed (Marino et al. 2009). Similarly, Toselli et al.
(2010) recently reported that freshly ground melia deriva-
tives did not inhibit nitrification in the soil but, rather, they
stimulated mineral N release, N leaf concentration, root N
uptake, and peach plant growth.
As compared to synthetic NIs, the natural NIs are eco-
friendly, easily available, implying lower cost of produc-
tion and can be included in the farming systems (Upadhyay
et al. 2011). However, the use of these inhibitors for
inhibiting nitrification, reducing N losses and increasing
NUE in agriculture ecosystem is still not common. Keeping
in view, this study was designated to evaluate the relative
efficiency of karanjin (P. glabra Vent.), dharek (M. azed-
arach) (plant materials), and CaC2 (a chemical) to inhibit
nitrification, improve N recovery in soil–plant system and
enhance the growth and yield of wheat. This research has
been carried out in the Department of Soil and Environ-
mental Sciences, University of Azad Jammu and Kashmir-
Pakistan (Rawalakot), from November 2010 to May 2011.
Materials and methods
Soil sampling/collection
Soil was collected from an arable field located at the
research farm, Faculty of Agriculture Rawalakot Azad
Jammu and Kashmir. The study area lies between the
altitude of 1,800–2,000 m above sea level and latitude
33–36� in the north–east of Pakistan under the foothills of
the great Himalayas at Rawalakot district, Poonch division,
AJK, Pakistan. The soil in the study site was loam in
texture, classified as a Humic Lithic Eutrudepts (Incepto-
sols). The field was barren at the time of sampling but
previously maize and wheat were cultivated during the
growing season. Soil samples were collected from the 0 to
15 cm depth at random from 5 different locations and
mixed well. The field-moist soil was passed through a
4 mm sieve to eliminate coarse rock and plant material,
thoroughly mixed to insure uniformity and stored at 4 �C
prior to use. A sub–sample of about 500 g was taken, air
dried and passed through 2 mm sieve and used for studying
physical and chemical characteristics. The main physio-
chemical properties of the soil were determined on dry
weight basis were: bulk density: 1.35 g cm-1 (intact soil
962 Int. J. Environ. Sci. Technol. (2013) 10:961–972
123
Page 3
core method); pH: 7.1; total C: 4.81 g kg-1; total N:
0.89 g kg-1; total mineral N: 8.8 mg kg-1, available P:
7.6 mg kg-1 and available K: 87 mg kg-1.
Laboratory incubation
Field-moist soil samples were placed into polyethylene
bags and pre-incubated at 22 �C to stabilize the microbial
activity. Ten days after pre-incubation, 30 g of soil was
weighed and transferred into glass jars of about 100 mL
capacity. The initial moisture content of soil was adjusted
to a water-filled pore space (WFPS) of approximately 58 %
that was maintained throughout the incubation. WFPS was
calculated as follows: WFPS = (soil gravimetric water
content X bulk density)/[1– (bulk density/particle density)].
There were four N treatments with and without NIs
i.e., N without NIs; N ? CaC2, N ? karanjin and N ? M.
azedarach and a control (no N); eight sampling times: 0, 7,
14, 21, 28, 35, 42, and 56 days and three replicates.
Altogether, a total of 120 experimental units were used at
the start of the experiment. An aqueous solution of diam-
monium phosphate [(NH4)2HPO4] i.e., DAP was applied as
the N source to all pots except control to supply
200 mg N kg-1 soil. A basal dose of 90 mg P2O5 kg-1 soil
as single super phosphate (SSP) and 60 mg K2O kg-1 soil
as potassium sulfate was well mixed into the soil.
For the treatments subjected to inhibitors, CaC2 was
obtained in powder form from Marij Scientific Traders,
Rawalpindi Pakistan. Seeds/fruits of karanja (P. glabra
Vent.) and M. azedarach were collected locally. Seeds
were crushed and seed powder (500 g) was defatted by
boiling in hexane (2 L) in a soxhlet apparatus for 24 h.
Karanjin and dharek (M. azedarach) was precipitated out
on cooling the hexane extract in a refrigerator. After 72 h,
the precipitate was collected and crystallized in ethanol and
its melting point was observed. It was re-crystallized a
number of times in ethanol to yield the final product
(Majumdar et al. 2004). A solution of karanjin and dharek
was prepared by dissolving crystals of karanjin and M.
azedarach in acetone, and the solution was added to the
soil containing DAP (200 mg kg-1 soil) at the rate of 20 %
of applied N (Majumdar et al. 2004).
The soil was homogeneously mixed with the respective
amendments in 100 ml glass pots. The mass of each pot
was recorded. Pots were covered with parafilm with 3–4
small holes on the top to allow O2 exchange. Pots were
incubated in an incubator at 22 �C and arranged in a
completely randomized design. Soil moisture was checked/
adjusted after every 2 days by weighing the pots and
adding the required amount of distilled water when the loss
was greater than 0.05 g. During this process, care was
taken not to disturb the soil either through stirring or
shaking.
Soil extraction and analysis
Samples of all the treatments incubated at different timings
were analyzed for total mineral nitrogen (TMN) and
ammonium-N (NH4?–N). Initial concentrations of TMN
and NH4?–N at day 0 were determined by extracting soil
samples with 200 ml of 1 M KCl added directly to the flask
immediately after adding each amendment. Thereafter,
triplicate samples from each treatment were removed ran-
domly from the incubator at different incubation periods
and extracted by shaking for 1 h with 200 ml of 1 M KCl
followed by filtration through Whatman’s No. 40 filter
paper.
The mineral N contents of the extract were determined
with steam distillation and the titration method (Keeney
and Nelson 1982) using microkjeldahl’s distillation appa-
ratus prepared locally. Aliquots (40 ml) of the extracts
were pippetted into a distillation flask and steam distillation
was carried out after adding MgO for NH4?–N determi-
nations while for the determination of TMN, magnesium
oxide (MgO) ? Deverda’s alloy was added. Distillates
were collected in 5 ml of boric acid containing bromoc-
resol green/methyl red mixed indicator and titrated against
0.05 M HCl. Nitrate–N was calculated by subtracting
NH4?–N from TMN. Any NO2 present would have been
included in the NO3- fraction.
The inhibition of nitrification by NIs was calculated as
reported by Sahrawat (1996) and Majumdar et al. (2001):
Inhibition of nitrification %ð Þ ¼ NN�NI
NN
� 100
where NN = nitrified N, i.e., NO3-–N as percent of total
mineral N, i.e., (NH4?–N ? NO3
-–N) in soil amended
with N alone; NI = nitrified N, i.e., NO3-–N as percent of
total mineral N, i.e., (NH4?–N ? NO3
-–N) in soil amen-
ded with N combined with an inhibitor.
Nitrified N (%) was calculated at different stages of the
incubation according to Majumdar et al. (2001):
Nitrified N %ð Þ ¼ NO�3 �N
Total mineral N NHþ4 �N þ NO�3 �N� �
� 100
To calculate nitrified N by the above formula, initial soil
NO3-–N and total mineral N at day 0 and the concentration
in the control were subtracted from their respective
content.
Wheat growth and N-uptake
A separate experiment was conducted in pots in the
greenhouse at the Faculty of Agriculture, Rawalakot Azad
Jammu and Kashmir. Wheat (Triticum aestivum L.) variety
Int. J. Environ. Sci. Technol. (2013) 10:961–972 963
123
Page 4
‘‘Inqalab-91’’ was used as a test crop. Thoroughly cleaned
earthen pots of 38 cm height and 18 cm width were used in
the experiment. The same soil used in the laboratory
incubation experiment was also used in this experiment
after sieving to\4 mm. Each pot contained approximately
12 kg soil. There were six N treatments with and without
NIs and a control, with three replicates, comprising 21 pots
in total. The treatments included: T1 = control T2 = N
alone; T3 = N ? CaC2 at the rate 15 mg kg-1; T4 = N ?
CaC2 at the rate 30 mg kg-1; T5 = N ? CaC2 at the
rate 45 mg kg-1; T6 = N ? karanjin, and T7 = N ? M.
azedarach. An aqueous solution of diammonium phosphate
[(NH4)2HPO4] i.e., DAP was applied as N source to all
pots except control to supply 200 mg N kg-1 soil. A
200 mg l-1 solution of karanjin and M. azedarach was
prepared by dissolving crystals of karanjin and dharek in
acetone and the solution was added to the soil containing
DAP (200 mg kg-1 soil) at the rate of 20 % of applied N
(Majumdar et al. 2004). A basal dose of 90 mg P2O5 kg-1
soil as SSP and 60 mg K2O kg-1 soil as potassium sulfate
was well mixed into the soil before sowing. The pots were
arranged in a completely randomized design.
The soil was moistened with water and maintained at
58 % water-filled pore space. In each pot, eight seeds were
sown at a depth of about 4 cm on November 06, 2010. Pots
were kept under shade to reduce evapo-transpiration during
the course of germination. After complete germination,
plants were thinned to six plants per pot. All pots were
equally irrigated when needed. Two plants from each
treatment were sampled at Vn, milking and maturity stages.
At each sampling time data were collected for shoot length,
root length, shoot dry weight, and root dry weight. At
maturity, number of grains per spike, 1 000-grain weight
and grain yield per plant was also recorded. Bulked plant
parts (shoot ? leave) were washed, and cleaned. The
cleaned plant parts and grains were oven dried at 70 �C for
48 h. For analysis of the N content in grain and straw,
oven-dried plant material (grain and straw) from each plot
were ground separately with a grinder (Polymix PX-MFC
90D; Switzerland) to pass through a 2 mm-mesh sieve. The
N contents in samples were determined by the Kjeldahl
method (Jackson 1962).
Statistical analysis
All data were statistically analyzed by multifactorial
analysis of variance (ANOVA) using the software pack-
age Statgraphics (1992). Least significant differences
(LSD) are given to indicate significant variations between
the values of either treatments or time intervals. Confi-
dence values (P) are given in the text for the significance
between treatments, manures, time interval and their
interactions. A probability level of B0.05 was considered
significant.
Results and discussion
Changes in NH4?–N
The NH4?–N concentration in the un-amended control was
quite low (\11 mg kg-1) at the start (day 0), continued to
decrease with time and was negligible by the end of
incubation (day 56) (Fig. 1). The low N concentration in
Fig. 1 Changes in the
concentration of NH4?–N and
accumulation of NO3-–N in a
soil collected from an arable
filed, amended with fertilizer N
with and without nitrification
inhibitors and incubated at
22 �C under controlled
laboratory conditions. The
legends indicate: T1 = control;
T2 = N without nitrification
inhibitors (NIs);
T3 = N ? CaC2;
T4 = N ? karanjin;
T5 = N ? M. azedarach
964 Int. J. Environ. Sci. Technol. (2013) 10:961–972
123
Page 5
the control soil throughout the incubation indicated low
mineralization which was unusual because the soil col-
lected from an arable field cultivated for crop production.
These results were in contrast to our previous study, where
the available N of an arable control soil was 39 mg kg-1
during a 50 day incubation (Abbasi et al. 2011).
The NH4?–N concentration of N treated soils (with and
without NIs) was between 97 and 110 mg N kg-1 at day 0,
with the difference between the N treatments being non-
significant (Fig. 1). Despite adding 200 mg NH4?–N per
kg soil, only about 106 mg (mean) of the added N was
recovered as NH4?–N just after N application (day 0).
Under similar experimental conditions, Souri (2008) also
reported less NH4?–N recovery than the applied N and
explained that the N unaccounted for may be due to NH4?
fixation by clay minerals, volatilization as NH3, or ineffi-
cient extraction of NH4?, which has been done with 1 M
KCl. The concentration of KCl used for extraction was 1 M
that might be a major factor for inefficient extraction of
NH4?.
In the soil to which N was added (without NIs), initial
NH4? concentration significantly (P B 0.05) decreased
with time and very little NH4? was left in the mineral N
pool by the end of incubation (9.2 mg kg-1 soil) (Fig. 1).
Results showed that 96 % of the applied N had disappeared
over a period of 56 days. During this NH4? disappearance,
concentrations of NO3-–N increased to a maximum of
41 mg of NO3-–N kg-1 at day 21 (Fig. 1), indicating that
nitrification was also occurring. However, the buildup of
NO3–N was lower than the rate of NH4? depletion. The
pattern of changes in NH4?–N and NO3
-–N observed here
was almost similar to that observed in our previous study
where more than 58 % of applied N had been disappeared
over a period of 50 days and only 21 % of depleted N was
accumulated as NO3-–N (Abbasi et al. 2011). We had
earlier concluded that under the experimental conditions
reported here nitrification–denitrification occurred simul-
taneously (Abbasi and Adams 2000a, b). Produced NO3-
can simply be diffused into adjacent microsites of denitri-
fication, therefore, a substantial accumulation of NO3–N
would not be expected where both nitrification and deni-
trification occur simultaneously (Abbasi and Adams 1998).
Remde and Conrad (1991) reported that depletion of NH4?
in the soil was apparently not balanced by the production of
NO2 and NO3-, and this discrepancy may be due to the
simultaneous nitrification and denitrification. However, the
soil incubated under aerobic conditions with moisture
content of about 60 % WFPS, denitrification may not be
considered the only loss mechanism of N unaccounted for.
Therefore, further investigations are suggested to explore
the routes of N losses occurred even under controlled
conditions without crop uptake and leaching loss.
A significant reduction in NH4?-N concentration was
also observed in soils treated with NIs i.e., karanjin and M.
azedarach but the rate and amount of NH4? depletion was
slower than the soil treated with N (without NIs). For
example, only about 9.2 mg kg-1 of NH4? was left in the
mineral N pool of N treated soil by the end of incubation,
while 60.3, and 35.0 mg kg-1 of NH4?-N was persisted and
retained until the end in the soil treated with N ? karanjin
and N ? M. azedarach, respectively (Fig. 2). The NH4?–N
concentration in the treatment receiving N ? karanjin
showed temporary increase and decrease between days 14
and 42. The reasons for the development of this trend are
Fig. 2 Over all changes
(average over 56 days
incubation) in NH4?-N and
accumulation/inhibition of
NO3-–N in a soil collected from
an arable filed, amended with
fertilizer N with and without
nitrification inhibitors and
incubated at 22 �C under
controlled laboratory
conditions. The symbols on
X-axis indicate: T1 = Control;
T2 = N without nitrification
inhibitors (NIs);
T3 = N ? CaC2;
T4 = N ? karanjin;
T5 = N ? M. azedarach
Int. J. Environ. Sci. Technol. (2013) 10:961–972 965
123
Page 6
not known. The response of NH4? turnover to soil with
N ? CaC2 was quite different and except day 7, concen-
tration of NH4? was significantly increased throughout the
incubation (Fig. 1). However, in response to the total N
applied (200 mg kg-1), about 12 % of NH4? had been
unaccounted for by the end of incubation. These results
indicated that CaC2 and karanjin were highly effective in
retaining NH4?–N in mineral pool at higher concentration
and for longer period. It appeared that addition of NIs
inhibited nitrification and consequently denitrification by
restricting the supply of NO3- to the denitrifying organisms
(Souri 2010; Pereira et al. 2010; Abbasi et al. 2011),
resulting in relatively higher concentration of NH4? in these
treatments. However, it is likely to mention that under
arable soil deficient in organic matter, denitrification and
N2O may not be the sole cause of NH4? depletion. It is
important to explore other possible loss routes of added
NH4? in the soil.
Results indicated that instead of decreasing NH4? to the
initial value recorded at day 0, concentration of NH4? in
N ? CaC2 treated soil was significantly increased over
time (Fig. 1). The tendency of NH4? turnover observed
here was in accordance with the previous studies. For
example, when CaC2 was applied with urea N, the NH4?
concentration in soil remained at high level for 36 days and
increased from 30 mg kg-1 to about 38 mg kg-1 (Keer-
thisinghe et al. 1993). Similarly, in another experiment the
concentration of NH4? was increased by 27 and 34 %
when CaC2 was applied to urea N (Keerthisinghe et al.
1996). However, the mechanism involved in CaC2 action in
increasing NH4? level is not understood. It may possible
that CaC2 application to a soil resulted in the priming of
mineralization of residual soil organic matter.
Accumulation of NO3-–N
The concentration of NO3-–N in the control without N was
low (\5 mg kg-1), remained consistent till day 42 and
thereafter further decreased (Fig. 1). The NO3-–N in N
amended soil (without NIs) increased (P B 0.05) during
incubation to a maximum concentration of 40.9 mg kg-1
on day 21. The concentration remained stable until day 35
and thereafter significantly decreased to a minimum of
23 mg kg-1 by the end of the 56 days. The extent and rate
of NO3-–N accumulation in NIs treated soils was much
lower compared to N treated soil (without NIs). For
example, the concentrations of NO3-–N in N ? CaC2,
N ? karanjin and N ? M. azedarach ranged between 15
and 31, 15 and 20 and 13 and 21 mg kg-1, respectively
compared to the 23 and 41 mg kg-1 in N treated soil
Table 1 Net rates of nitrification (NO3-–N mg kg-1 day-1) in soil amended with N (200 mg N kg-1 soil) with and without nitrification
inhibitors over 56 days of laboratory incubation
Treatments NO3-–N (mg kg-1 day-1 soil)
Days after N application
7 14 21 28 35 42 56 LSD (P B 0.05)
T1 0.00 -0.03 0.09 0.07 -0.05 -0.03 -0.05 0.01
T2 2.61 1.95 1.47 1.02 0.70 0.45 0.23 0.23
T3 0.69 0.51 0.50 0.36 0.55 0.39 0.38 0.14
T4 0.88 0.50 0.26 0.18 0.10 0.14 0.04 0.09
T5 0.19 0.03 0.07 0.05 0.23 0.14 0.00 0.06
LSD (P B 0.05) 0.46 0.27 0.21 0.16 0.12 0.13 0.13
Treatments effect (average over 0–56 days; mg kg-1 soil)
T1 T2 T3 T4 T5 LSD (P B 0.05)
0.00 1.20 0.48 0.30 0.10 0.174
Timings effect (average over T1–T5; mg kg-1 soil)
7 14 21 28 35 42 56 LSD (P B 0.05)
0.87 0.59 0.48 0.34 0.31 0.22 0.12 0.116
T1, control; T2, N without nitrification inhibitors (NIs); T3, N? CaC2; T4, N? karanjin; T5, N? M. azedarach
966 Int. J. Environ. Sci. Technol. (2013) 10:961–972
123
Page 7
without NIs. Averaged across different timings, accumu-
lation of NO3- in the treatments receiving N, N ? CaC2,
N ? karanjin and N ? M. azedarac was 30, 21, 17, and
15 mg kg-1, respectively (Fig. 2). These values indicated
that NIs included CaC2, karanjin and M. azedarach were
able to inhibit nitrification by 69, 67, and 57 %,
respectively.
Net rates of nitrification showed a similar trend to that
observed for NO3-–N accumulation. Net rates of nitrifi-
cation for N amended soil without NIs were significantly
higher (P B 0.05) than the rates recorded for soils with NIs
(Table 1). Comparative analysis indicated that net rates of
nitrification for N amended soil (without NIs) ranged
between 1.02 and 2.61 mg kg-1 day-1 between 7 and
28 day with a maximum rate in the initial stage of incuba-
tion (day 7). Thereafter, rates declined to a minimum of
0.23 mg kg-1 day -1 on day 56. In contrast, net rates of
nitrification in soil with NIs were much lower and the highest
rates of 0.88 mg kg-1 day -1 recorded on day 7 for the
N ? karanjin treatment. The average net rates of nitrification
in soil with N, N ? CaC2, N ? karanjin and N ? M. azed-
arach were 1.20, 0.48, 0.30 and 0.10 mg kg-1 day-1,
respectively showing a substantial inhibition of nitrification
by NIs.
The extent of nitrified N (NO3-–N) as percent of
total mineral N [NH4?–N ? NO3
-–N] was much higher
in N treated soil without NIs (average 57 %) compared
to N ? CaC2 (11 %), N ? karanjin (13 %) and N ?
M. azedarach (18 %) (Fig. 3), confirmed the inhibitory
effects of tested NIs on nitrification. Percent inhibition
of nitrification was calculated to find out the effective-
ness of three inhibitors used in the study. The percent
inhibition of nitrification by CaC2, karanjin and
M. azedarach ranged between 69, 67, and 57 %,
respectively indicating CaC2 and karanjin were superior
to M. azedarach.
Several previous studies clearly indicated nitrification
inhibitory properties of CaC2 (Freney et al. 1992; Freney
et al. 2000; Keerthisinghe et al. 1993, 1996). The inhibitory
effect of CaC2 is attributed to its capacity to release acet-
ylene which is considered a potent nitrification inhibitor
(Smith et al. 1993). The effect of karanjin reported here is
in accordance with that reported earlier by Majumdar
(2002) under laboratory conditions where karanjin inhib-
ited nitrification by 62–75 % and mitigated N2O emission
by 92–96 %. In another experiment conducted under lab-
oratory incubation, nitrification inhibition by karanjin
ranged between 9 and 76 %, remained high for a period of
approximately 6 weeks and decreased with time (Majum-
dar et al. 2004). Similarly, in this study, the plant product
M. azedarach inhibited nitrification by 57 %. However, the
potential of M. azedarach to retain NH4? in mineral N pool
and its persistence to inhibit nitrification for longer period
was lower when compared with CaC2 and karanjin. In
contrast to our findings, Toselli et al. (2010) reported that
M. azedarach did not inhibit soil NO3-–N, rather stimu-
lated the release of mineral N.
Recovery of applied N in soil
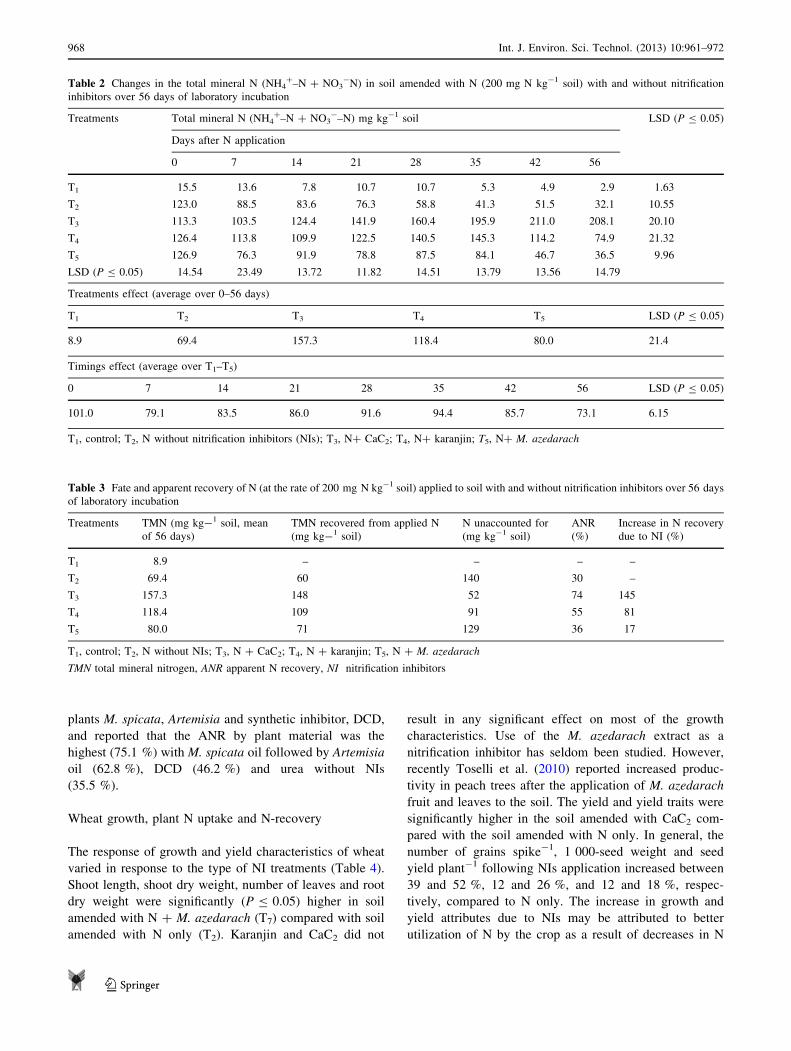
Effects of NIs on changes in TMN indicated that applied N
started to disappear shortly after application (Table 2). By
the end of incubation, 70 % of the applied N had been
depleted from the mineral N pool. In the soils amended
with NIs, the extent and rate of depletion was much lower
and the loss of applied N from N ? CaC2, N ? karanjin
and N ? M. azedarach was 26, 45, and 64 %, respectively.
With regard to soil N recovery, CaC2 proved highly
effective in increasing N recovery of applied N followed by
karanjin while M. azedarach was found less effective
(Table 3). When N was applied without NIs, the ANR was
30 %. Addition of the NIs CaC2, and karanjin substantially
increased of N by 74, and 55 %, respectively, while the
ANR by M. azedarach was 36 %, close to that of the N
only treatment. Thus, of the total amount of N applied,
6–44 % more N was recovered when NIs were added to the
soil. Keerthisinghe et al. (1993) found 84 % recovery of
applied N from a CaC2 treatment compared with 43 % for
the nitrapyrin and control treatments. A 46 % greater
recovery of applied N was recorded in soil–plant system
when CaC2 was applied to irrigated wheat (Freney et al.
1993). Apparent N recovery of soil amended with neem
seedcake (a plant material) was 83 % compared with 63 %
for soil amended with urea N without NIs (Abbasi et al.
2011). Kiran and Patra (2003) used essential oil bearing
Fig. 3 The amount of NO3-–N nitrified (%) as percent of total
mineral N affected by NIs during 56 days incubation. The legends
indicate: T1 = Control; T2 = N without nitrification inhibitors (NIs);
T3 = N ? CaC2; T4 = N ? karanjin; T5 = N ? M. azedarach
Int. J. Environ. Sci. Technol. (2013) 10:961–972 967
123
Page 8
plants M. spicata, Artemisia and synthetic inhibitor, DCD,
and reported that the ANR by plant material was the
highest (75.1 %) with M. spicata oil followed by Artemisia
oil (62.8 %), DCD (46.2 %) and urea without NIs
(35.5 %).
Wheat growth, plant N uptake and N-recovery
The response of growth and yield characteristics of wheat
varied in response to the type of NI treatments (Table 4).
Shoot length, shoot dry weight, number of leaves and root
dry weight were significantly (P B 0.05) higher in soil
amended with N ? M. azedarach (T7) compared with soil
amended with N only (T2). Karanjin and CaC2 did not
result in any significant effect on most of the growth
characteristics. Use of the M. azedarach extract as a
nitrification inhibitor has seldom been studied. However,
recently Toselli et al. (2010) reported increased produc-
tivity in peach trees after the application of M. azedarach
fruit and leaves to the soil. The yield and yield traits were
significantly higher in the soil amended with CaC2 com-
pared with the soil amended with N only. In general, the
number of grains spike-1, 1 000-seed weight and seed
yield plant-1 following NIs application increased between
39 and 52 %, 12 and 26 %, and 12 and 18 %, respec-
tively, compared to N only. The increase in growth and
yield attributes due to NIs may be attributed to better
utilization of N by the crop as a result of decreases in N
Table 2 Changes in the total mineral N (NH4?–N ? NO3
-N) in soil amended with N (200 mg N kg-1 soil) with and without nitrification
inhibitors over 56 days of laboratory incubation
Treatments Total mineral N (NH4?–N ? NO3
-–N) mg kg-1 soil LSD (P B 0.05)
Days after N application
0 7 14 21 28 35 42 56
T1 15.5 13.6 7.8 10.7 10.7 5.3 4.9 2.9 1.63
T2 123.0 88.5 83.6 76.3 58.8 41.3 51.5 32.1 10.55
T3 113.3 103.5 124.4 141.9 160.4 195.9 211.0 208.1 20.10
T4 126.4 113.8 109.9 122.5 140.5 145.3 114.2 74.9 21.32
T5 126.9 76.3 91.9 78.8 87.5 84.1 46.7 36.5 9.96
LSD (P B 0.05) 14.54 23.49 13.72 11.82 14.51 13.79 13.56 14.79
Treatments effect (average over 0–56 days)
T1 T2 T3 T4 T5 LSD (P B 0.05)
8.9 69.4 157.3 118.4 80.0 21.4
Timings effect (average over T1–T5)
0 7 14 21 28 35 42 56 LSD (P B 0.05)
101.0 79.1 83.5 86.0 91.6 94.4 85.7 73.1 6.15
T1, control; T2, N without nitrification inhibitors (NIs); T3, N? CaC2; T4, N? karanjin; T5, N? M. azedarach
Table 3 Fate and apparent recovery of N (at the rate of 200 mg N kg-1 soil) applied to soil with and without nitrification inhibitors over 56 days
of laboratory incubation
Treatments TMN (mg kg-1 soil, mean
of 56 days)
TMN recovered from applied N
(mg kg-1 soil)
N unaccounted for
(mg kg-1 soil)
ANR
(%)
Increase in N recovery
due to NI (%)
T1 8.9 – – – –
T2 69.4 60 140 30 –
T3 157.3 148 52 74 145
T4 118.4 109 91 55 81
T5 80.0 71 129 36 17
T1, control; T2, N without NIs; T3, N ? CaC2; T4, N ? karanjin; T5, N ? M. azedarach
TMN total mineral nitrogen, ANR apparent N recovery, NI nitrification inhibitors
968 Int. J. Environ. Sci. Technol. (2013) 10:961–972
123
Page 9
losses. Yaseen et al. (2006) reported that application of
CaC2 with N fertilizer significantly increased the number
of tillers (up to 45.5 %), straw (up to 32.8 %), and grain
yield (up to 37.3 %) of wheat over the N fertilizer alone.
Similarly, a 37 % increase in green pod yield of Okra was
observed after CaC2 application equivalent to 60 kg ha-1
along with N fertilizer (Kashif et al. 2008). Karanjin has
also been reported to increase grain and straw yield, total
N uptake and grain protein content of rice (Sahrawat
1996).
Results indicated that N concentration and N uptake in
plant shoot and grains were significantly increased in the
treatments supplemented with NIs (Fig. 4). The relative
increase in shoot and grain N concentration due to NIs was
between 23 and 40 %, and 52 and 73 %, respectively over
N fertilizer only. Similarly, the relative increase in
shoot and grains N uptake due to NIs was between 41
and 76 %, and 66 and 87 %, respectively. Response of total
N uptake to different amendments is presented in Fig. 5.
The total N uptake in N fertilizer treatment was 46 mg N
plant-1 that significantly (P B 0.05) increased to 94, 75,
74 mg N plant-1 (mean 81 mg N plant-1) with CaC2, 73
and 79 mg N plant-1 with karanjin and M. azedarach,
respectively. Application of CaC2 at the rate of 30
mg kg-1 soil exhibited the highest N uptake of 94 mg N
plant-1.
The N concentration in shoots and grains of wheat was
significantly increased with NIs compared to N application
alone (Fig. 4). The relative increase in shoot and grain N
concentration due to NIs was between 23 and 40 %, and 52
and 73 %, respectively over N fertilizer without NIs.
Among the three NIs tested, CaC2 showed the highest
response. Application of lower rate of CaC2 i.e.,
15 mg kg-1 showed significantly higher N concentration
both in shoot and grains of wheat.
Results indicated that N uptake in plant shoot and grains
was significantly increased in the treatments supplemented
with NIs (Fig. 4). The relative increase in shoot and grains
N uptake due to NIs was between 41 and 76 %, and 66
and 87 %, respectively over the N treatment without
NIs. Similarly, response of total N uptake to different
amendments is presented in Fig. 5. The total N uptake in
N fertilizer treatment was 46 mg N plant-1 that signifi-
cantly (P B 0.05) increased to 94, 75, 74 mg N plant-1
(mean 81 mg N plant-1) with CaC2, 73 and 79 mg N
plant-1 with karanjin and M. azedarach, respectively. The
relative increase in N uptake due to CaC2, karanjin, and
Table 4 Effect of nitrification inhibitors i.e., calcium carbide, karanjin and M. azedarach applied with N fertilizer on growth and yield
contributing parameters of wheat (average of three repeats) grown in pots under greenhouse conditions
Treatments Shoot
length (cm)
Shoot dry
weight (g)
No. of Leaves
plant-1Root
length (cm)
Root dry
weight (g)
No. of grains
spike-11,000-grain
weight (g)
Grain yield
plant-1 (g)
T1 23.8c 0.51c 5.2d 7.6c 0.07c 11.0d 14.2d 0.28e
T2 53.7b 1.17b 14.3bc 12.0ab 0.23b 26.2c 22.7c 1.77d
T3 54.7b 1.23b 13.0c 12.1ab 0.25ab 33.5ab 29.5a 2.28a
T4 56.1ab 1.41ab 15.8ab 12.4a 0.27ab 32.7b 30.1a 1.86 cd
T5 56.1ab 1.274b 15.8ab 10.8b 0.24ab 37.6a 25.8bc 2.11ab
T6 59.7a 1.32b 14.0bc 11.6ab 0.23b 31.5b 25.4bc 1.73d
T7 59.1a 1.61a 17.7a 11.8ab 0.30a 32.3b 28.7ab 1.99bc
LSD (P B 0.05) 3.99 0.28 2.13 1.41 0.06 4.36 3.6 0.19
T1, control; T2, N without nitrification inhibitors (NIs); T3, N ? CaC2 at the rate of 15 mg kg-1; T4, N ? CaC2 at the rate of 30 mg kg-1; T5,
N ? CaC2 at the rate of 45 mg kg-1; T6, N ? karanjin; T7, N ? M. azedarach
Fig. 4 Effect of nitrification inhibitors i.e., calcium carbide, karanjin
and M. azedarach applied with N fertilizer on shoot and grain N
contents and N uptake of wheat (average of three repeats) grown in
pots under greenhouse conditions. The symbols on X-axis indicate:
T1 = control; T2 = N without nitrification inhibitors (NIs);
T3 = N ? CaC2 at the rate of 15 mg kg-1; T4 = N ? CaC2 at the
rate of 30 mg kg-1; T5 = N ? CaC2 at the rate of 45 mg kg-1;
T6 = N ? karanjin; T7 = N ? M. azedarach
Int. J. Environ. Sci. Technol. (2013) 10:961–972 969
123
Page 10
M. azedarach over N fertilizer was 76, 59, and 72 %,
respectively. Application of CaC2 at the rate of 30 mg kg-1
soil exhibited the highest N uptake of 94 mg N plant-1.
Mahmood et al. (2007) reported a 14 and 24 % increase
in total N uptake (over the N only treatment) in wheat due
to the application of 30 and 45 mg kg-1 CaC2, respec-
tively. Freney et al. (1992) reported that CaC2 when
applied with N fertilizer limited NH4? oxidation and pre-
vented N loss thereby increasing accumulation of N both in
shoot and grains of wheat. Application of M. azedarach to
Peach increased shoot N concentration by 24 and 33 %
over N treatment applied alone (Toselli et al. 2010).
Results indicated that the plants supplemented with
N ? NIs recovered more N than those which received N
only (Fig. 5). The apparent N recovery (ANR) of N
amended plants was 20 % which was significantly
increased to 44, 35, 35 % (mean 38 %) with CaC2, 34 and
37 % with karanjin and M. azedarach, respectively. The
increase in the recovery of applied N due to NIs may be
due to the inhibition of nitrification (less chance of N
losses) thereby retaining NH4?–N in mineral pool that may
be utilized by the plants for longer period. Our results are
in agreement with the previous findings (Freney et al. 1992;
Kiran and Patra 2003; Mahmood et al. 2007). Yaseen et al.
(2006) reported that application of encapsulated CaC2
resulted in greater N use efficiency (NUE) (up to 61.1 %)
by both wheat and cotton crops than that observed with the
same rates of N fertilizer alone.
Conclusion
The present study exhibited higher rate of NH4?–N
disappearance from the mineral N pool over a short
period of time under moisture and temperature conditions
(temperature 22 �C; 58 % WFPS) which normally exist in
the field during kharif (summer) season. These findings
suggested that N use efficiency and N recovery is critical in
soil–plant systems because of the possible losses and N
disappearance from the system. The applied N in this study
was nitrified rapidly with 70 % of the total mineral N
converted to NO3-–N within 56 days of incubation. This
accumulated NO3- is real concern for the environment, N
recovery and crop productivity. Results of this study dem-
onstrated that NIs calcium carbide, karanjin and M. azed-
arach when applied with N fertilizer DAP, significantly
reduced NO3- accumulation and maintained NH4
? in the
mineral pool at higher concentration and for a longer period.
By delaying and decreasing the extent of NH4? oxidation,
NIs were able to increase N recovery in soil–plant systems
possibly because of reducing N losses associated with
nitrification. Calcium carbide and karanjin were found
effective in reducing NO3- accumulation and increasing N
recovery in soil while M. azedarach was equally effective in
plant growth promoting ability. On the basis of these results,
it is imperative to exploit and introduce NIs especially those
which are efficient, cost-effective, and suitable for both
tropical and temperate production systems. Since this study
was conducted in the laboratory scale, the benefits found
here need to be further investigated in field scale experi-
ments to assess the N use efficiency and N balances of these
NIs in soil–crop systems.
Acknowledgments We are grateful to our colleague Mr. Hamid of
the Department of Eastern Medicine and Surgery, The University of
Poonch, Rawalakot Azad Jammu and Kashmir for providing Karanjin
for this experiment. The work reported here was financially supported
by the University of Azad Jammu and Kashmir through the grant
‘‘Promotion of Research.’’
Fig. 5 Effect of nitrification
inhibitors i.e., calcium carbide,
karanjin and M. azedarach
applied with N fertilizer on total
N uptake and apparent N
recovery by wheat grown in
pots under greenhouse
conditions. The symbols on
X-axis indicate: T1 = control;
T2 = N without nitrification
inhibitors (NIs);
T3 = N ? CaC2 at the rate of
15 mg kg-1; T4 = N ? CaC2
at the rate of 30 mg kg-1;
T5 = N ? CaC2 at the rate of
45 mg kg-1;
T6 = N ? karanjin;
T7 = N ? M. azedarach
970 Int. J. Environ. Sci. Technol. (2013) 10:961–972
123
Page 11
References
Abbasi MK, Adams WA (1998) Loss of nitrogen in compacted
grassland soil by simultaneous nitrification and denitrification.
Plant Soil 200:265–277
Abbasi MK, Adams WA (2000a) Gaseous N emission during
simultaneous nitrification-denitrification associated with mineral
N fertilization to a grassland soil under field conditions. Soil Biol
Biochem 32:1251–1259
Abbasi MK, Adams WA (2000b) Estimation of simultaneous
nitrification and denitrification in grassland soil associated with
urea-N using 15N and nitrification inhibitor. Biol Fertil Soils
31:38–44
Abbasi MK, Khizar A (2012) Microbial biomass carbon and nitrogen
transformations in a loam soil amended with organic–inorganic
N sources and their effect on growth and N-uptake in maize.
Ecol Eng 123:132–139
Abbasi MK, Shah Z, Adams WA (2003) Effect of the nitrification
inhibitor nitrapyrin on the fate of nitrogen applied to a soil
incubated under laboratory condition. J Plant Nutr Soil Sci
166:513–518
Abbasi MK, Hina M, Tahir MM (2011) Effect of Azadirachta indica
(neem), sodium thiosulphate and calcium chloride on changes in
nitrogen transformations and inhibition of nitrification in soil
incubated under laboratory conditions. Chemosphere 82:1629–1635
Dinnes DL, Karlen DL, Jaynes DB, Kaspar TC, Hatfield JL, Colvin
TS, Cambardella CA (2002) Nitrogen management strategies to
reduce nitrate leaching in tile drained midwestern soils. Agron J
94:153–171
Fangueiro D, Fernandes A, Coutinho J, Moreira N, Trindade H (2009)
Influence of two nitrification inhibitors (DCD and DMPP) on
annual ryegrass yield and soil mineral N dynamics after
incorporation with Cattle Slurry. Commun Soil Sci Plant Anal
40:3387–3398
Freney JR, Smith CJ, Mosier AR (1992) Effect of a new nitrification
inhibitor (wax coated calcium carbide) on transformations and
recovery of fertilizer nitrogen by irrigated wheat. Fert Res
32:1–12
Freney JR, Chen DL, Mosier AR, Rochester IJ, Constable GA, Chalk
PM (1993) Use of nitrification inhibitors to increase fertilizer
nitrogen recovery and lint yield in irrigated cotton. Fert Res
34:37–44
Freney JR, Randall PJ, Smith JWB, Hodgkin J, Harrington KJ,
Morton TC (2000) Slow release sources of acetylene to inhibit
nitrification in soil. Nutr Cycl Agroecosyst 56:241–251
Glass ADM (2003) Nitrogen use efficiency of crop plants: physio-
logical constraints upon nitrogen absorption. Crit Rev Plant Sci
22:453–470
IFA (2012) International Fertilizer Association—Statistics. www.
fertilizer.org/HomePage/STATISTICS
Jackson ML (1962) Soil chemical analysis. Prentice-Hall Inc.,
Englewood Cliffs
Kashif SR, Yaseen M, Arshad M, Ayub M (2008) Response of okra
(Hibiscus esculentus L.) to soil given encapsulated calcium
carbide. Pak J Bot 40:175–181
Keeney, Nelson DW (1982) Nitrogen-inorganic forms. In: Page AL,
Miller RH, Keeney (eds) Methods of soil analysis, chemical and
microbiological properties, part 2. SSSA, Madison, pp 643–693
Keerthisinghe DG, Freney JR, Mosier AR (1993) Effect of wax-
coated calcium carbide and nitrapyrin on nitrogen loss and
methane emission from dry-seeded flooded rice. Biol Fertil Soils
16:71–75
Keerthisinghe DG, Xin-Jian L, Qi-Xiang L, Mosier AR (1996) Effect
of encapsulated calcium carbide and urea application methods on
denitrification and N loss from flooded rice. Fert Res 45:31–36
Khalil MI, Gutser R, Schmidhalter U (2009) Effects of urease and
nitrification inhibitors added to urea on nitrous oxide emissions
from a loess soil. J Plant Nutr Soil Sci 172:651–660
Kiran U, Patra DD (2003) Medicinal and aromatic plant materials as
nitrification inhibitors for augmenting yield and nitrogen uptake
of Japanese mint (Mentha arvensis L. Var. Piperascens).
Bioresour Technol 86:267–276
Mahmood R, Yaseen M, Arshad M (2007) Effect of rate and time of
calcium carbide application on nitrogen use efficiency of applied
urea and growth of wheat. Pak J Bot 39:497–502
Majumdar D (2002) Suppression of nitrification and N2O emission by
karanjin—a nitrification inhibitor prepared from karanja (Pong-
amia glabra Vent.). Chemosphere 47:845–850
Majumdar D, Dutta A, Kumar S, Pathak H, Jain MC (2001)
Mitigation of N2O emission from an alluvial soil by application
of karanjin. Biol Fertil Soils 33:438–442
Majumdar D, Pandya B, Arora A, Dhara A (2004) Potential use of
karanjin (3-methoxy furano-20, 30, 7, 8-flavone) as a nitrifica-
tion inhibitor in different soil types. Arch Agron Soil Sci
50:455–465
Marino G, Toselli M, Baldi E, Marangoni B (2009) Effect of soil-
applied ground leaves of Melia azaderach L. on acclimatization
of bacteria-contaminated rooted plum shoot. Acta Hort 812:
447–453
McCarty GW (1999) Mode of action of nitrification inhibitors. Biol
Fertil Soils 29:1–9
Patra DD, Sukhma C (2009) Natural nitrification inhibitors for
augmenting nitrogen use efficiency in soil-plant system. The
Proceedings of the International Plant Nutrition Colloquium
XVI, UC Davis. http://escholarship.org/uc/item/4h30z8tg
Pereira J, Fangueiro D, Chadwick DR, Misselbrook TH, Coutinho J,
Trindade H (2010) Effect of cattle slurry pre-treatment by
separation and addition of nitrification inhibitors on gaseous
emissions and N dynamics: a laboratory study. Chemosphere
79:620–627
Prasad R, Power JF (1995) Nitrification inhibitors for agriculture,
health, and the environment. Adv Agron 54:233–281
Raun WR, Johnson GV (1999) Improving nitrogen use efficiency for
cereal production. Agron J 91:357–363
Remde A, Conrad R (1991) Role of nitrification and denitrification for
NO metabolism in soil. Biogeochem 12:189–205
Rodgers GA (1986) Nitrification inhibitors in agriculture. J Environ
Sci Health A 21:701–722
Sahrawat KL (1996) Nitrification inhibitors, with emphasis on natural
products, and the persistence of fertilizer nitrogen in soil. In:
Ahmed N (ed) Nitrogen economy in tropical soils. Kluwer,
Dordrecht, pp 379–388
Smith C, Freney J, Mosier AR (1993) Effect of acetylene provided
by wax-coated calcium carbide on transformations of urea
nitrogen applied to an irrigated wheat crop. Biol Fertil Soils
16:86–92
Souri MK (2008) Characterisation of natural and synthetic nitrifica-
tion inhibitors and their potential use in tomato cultivation. Ph.D.
Dissertation, Institute of Plant Nutrition, Faculty of Agricultural
Sciences, the University of Hohenheim, Germany
Souri MK (2010) Effectiveness of chloride compared to 3, 4-dimeth-
ylpyrazole phosphate on nitrification inhibition in soil. Commun
Soil Sci Plant Anal 41(14):1769–1778
StatGraphics Manugistics (1992) Statistical graphics system by
statistical graphics corporation, reference manual, vol 6. Manu-
gistics, Rockville
Subbarao GV, Ishikawa T, Ito O, Nakahara K, Wang HY, Berry WL
(2006a) A bioluminescence assay to detect nitrification inhibitors
released from plant roots: a case study with Brachiaria humid-
icola. Plant Soil 288:101–112
Int. J. Environ. Sci. Technol. (2013) 10:961–972 971
123
Page 12
Subbarao GV, Ito O, Sahrawat KL, Berry WL, Nakahara K, Ishikawa
T, Watanabe T, Suenaga K, Rondon M, Rao IM (2006b) Scope
and strategies for regulation of nitrification in agricultural
systems—challenges and opportunities. Crit Rev Plant Sci
25:303–335
Toselli M, Baldi E, Sorrenti G, Quartieri M, Marangoni B (2010)
Evaluation of the effectiveness of soil-applied plant derivatives
of Meliaceae species on nitrogen availability to peach trees. Sci
Hort 124:183–188
Upadhyay RK, Patra DD, Tewaris SK (2011) Natural nitrification
inhibitors for higher nitrogen use efficiency, crop yield, and for
curtailing global warming. J Trop Agric 49:19–24
Warneke S, Schipper LA, Bruesewitz DA, McDonald I, Cameron S
(2011) Rates, controls and potential adverse effects of nitrate
removal in a denitrification bed. Ecol Eng 37:511–522
Yaseen M, Arshad M, Khalid A (2006) Effect of acetylene and
ethylene gases released from encapsulated calcium carbide on
growth and yield of wheat and cotton. Pedobiologia 50:405–411
Zaman M, Saggar S, Blennerhassett JD, Singh J (2009) Effect of urease
and nitrification inhibitors on N transformation, gaseous emissions
of ammonia and nitrous oxide, pasture yield and N uptake in grazed
pasture system. Soil Biol Biochem 41:1270–1280
972 Int. J. Environ. Sci. Technol. (2013) 10:961–972
123


![INDEX []€¦ · BORON CARBIDE 42 BORON NITRIDE 34 BRINELL 22 BURNT REFRACTORIES 30 CALCIUM ALUMINATE 2 ... TITANIUM DIOXIDE 26 TITANIUM SLAG 39 TUNDISH SLAG 40 TUNGSTEN CARBIDE 42](https://static.documents.pub/doc/80x56/60670eb2f72be5794e2aa264/index-boron-carbide-42-boron-nitride-34-brinell-22-burnt-refractories-30-calcium.jpg)

