Page 1
EFFECT OF SPAN 80 - TWEEN 80 MIXTURE COMPOSITIONS ON THE STABILITY
OF SUFLOWER OIL-BASED EMULSIONS
A THESIS SUBMITTED IN PARTIAL FULFILLMENT
OF THE REQUIREMENTS FOR THE DEGREE OF
Bachelor of Technology In
Biotechnology
Submitted
By
ANKURMAN SHRESTHA
107BT003
Under the Guidance of
Prof. Kunal Pal
Department of Biotech & Medical Engineering National Institute of Technology
Rourkela 769008 2011
Page 2
National Institute of Technology
Rourkela
CERTIFICATE
This is to certify that this thesis entitled, “EFFECT OF SPAN 80 - TWEEN 80
MIXTURE COMPOSITIONS ON THE STABILITY OF SUNFLOWER OIL-BASED
EMULSIONS” submitted by Mr. ANKURMAN SHRESTHA in partial fulfillment for the
requirements for the award of Bachelor of Technology Degree in Biotechnology at National
Institute of Technology, Rourkela is an authentic work carried out by him under my guidance.
To the best of my knowledge, the matter embodied in the thesis has not been submitted to
any other University / Institute for the award of any Degree or Diploma.
Date: 13-05-2011 Prof. Kunal Pal
Assistant Professor
Department of Biotech & Medical Engineering
National Institute of Technology
Rourkela- 769 008
Page 3
ACKNOWLEDGEMENTS
I owe a great many thanks to great many people who helped and supported me for the
completion of this project effectively and moreover in time.
My deepest and sincere thanks to Prof. Kunal Pal, Assistant Professor, Department of Biotech
& Medical Engineering, National Institute of Technology Rourkela for giving me an opportunity
to carry out this project under his supervision. He has been very kind and patient to me while
suggesting the outlines of the project and has also been very helpful in the successful completion
of the same. I thank him for his overall support.
I am equally thankful to the Ph.D scholars, Mr. Sateesh Sai and Ms. Beauty Behera, Department
of Biotech & Medical Engineering, National Institute of Technology Rourkela for their support
and guidance.
Finally, let me say “Thank You” to my friend Mr. Sarada Prasanna Mallick, B.Tech
(Biotechnology) 2007-2011, National Institute of Technology Rourkela for his encouraging
words and motivation.
May, 2011 Ankurman Shrestha
Page 4
CONTENTS
Page No.
Abstract i
List of Figures ii
List of Tables iii
Chapter 1 INTRODUCTION 1-2
1.1 Introduction 1
1.2 Objective of the report 1
Chapter 2 MATERIALS & METHODS 3-7
2.1 Materials 4
2.2 Preparation of emulsions 4
2.3 pH variation of the emulsions 7
2.4 Determination of emulsion type 7
2.5 Accelerated thermal stability test 7
2.6 Microscopy 7
Chapter 3 RESULTS AND DISCUSSIONS 8-22
3.1 Preparation of emulsions 9
3.2 pH measurement 11
3.3 Determination of emulsion type 12
3.4 Accelerated thermal stability test 13
3.5 Microscopic studies conducted on the emulsions 14
Chapter 4
CONCLUSION 23-26
4.1 Conclusion 24
References 25
Page 5
i
Abstract
The study describes the effect of span 80-tween 80 surfactant mixtures on the stability of the
sunflower oil based emulsions. The emulsification was carried out in various proportions of span
80-tween 80 mixtures so as to have a HLB range varying from 6.4 to 13.8. Attempts were made
to prepare both W/O and O/W emulsions by using oil: water fractions at 4:1 and 1:4 ratios,
respectively. The emulsions which were stable for 24 h, were further observed for 56 h to have
an insight on their long-term stability. The emulsions which showed signs of destabilization,
during the period of 24 h to 56 h, were analyzed microscopically and measuring pH to
understand the mechanism of destabilization. The stable samples were thoroughly characterized
by light microscopy, pH measurement and accelerated stability test by thermocycling method.
The micrographs of the samples were analyzed using Image J and Vision Assistant softwares.
All samples stable up to 24 h were found to be W/O emulsions by dye solubility test. The
unstable and short-term stable samples indicated cracking and creaming/sedimentation,
respectively, as the destabilization phenomena. The pH of the short-term stable samples
decreased with time whereas the pH of the long-term stable samples was almost constant
throughout the 56 h time period. The long-term stable emulsions did not show any change in the
particle size along the time scale.
Keywords: Span 80, Tween 80, Sunflower oil, Emulsion, Stability, Image J, Vision Assistant
Page 6
ii
List of Figures Page No.
Figure 1 Sunflower oil & water based emulsions 10
Figure 2 Short-term stable emulsions showing sedimentation 11
Figure 3 Long-term stable emulsion samples 11
Figure 4 pH variation of emulsions 12
Figure 5 Dye solubility test for the long-term stable emulsions 13
Figure 6 Light micrographs of stable emulsion samples 15
Figure 7 Steps involved in Image analysis using ImageJ and Vision Assistant 16
Figure 8 Normalized frequency distribution of the droplets 17
Figure 9 Variation of the highest proportion of droplet sizes as a function of
HLB
18
Figure 10 Light micrographs of E10 taken regular intervals of 8 h 19
Figure 11 Normalized frequency distribution of the droplets of E10 on a time
scale
20
Figure 12 Micrographs of the short-term stable emulsions 21
Page 7
iii
List of Tables Page No.
Table 1 Resultant HLB values 5
Table 2 Emulsion composition 6
Table 3 Accelerated thermal stability test 14
Page 8
1
Chapter 1
INTRODUCTION
Page 9
2
1.1 Introduction
Emulsions are defined as the biphasic systems consisting of two immiscible liquids where one of
the liquid phases is dispersed in the other[1]. They can be categorized into two types, viz. oil-in-
water (O/W) and water-in-oil (W/O) emulsions. O/W emulsion has water as the external phase
while oil forms the internal phase whereas W/O emulsion consists of water droplets dispersed
within oil continuous phase[2]. Emulsions have found numerous applications in the food,
cosmetics and pharmaceutical industries. Emulsions, in general, have a cloudy appearance and
are basically white in color due to the scattering of light passing through it. The emulsions are
inherently thermodynamically unstable. The long term stability of emulsions is one of the major
issues associated with its commercial applications[3]. To improve its stability, various
emulsifiers (e.g. emulsifying wax, cetearyl alcohol, polysorbate 20 and ceteareth 20) are used.
The emulsifiers help in reducing the interfacial tension amongst the two phases and help in
making the system a thermodynamically stable one [4].
1.2 Objective of the report
The current study deals with the evaluation of the stability of the emulsions prepared by varying
the composition of the emulsions. The sunflower and water based emulsions were prepared
having sunflower oil: water proportions of 1:4 and 4:1. Span 80-tween 80 surfactant mixtures,
both being elastic film-forming surfactants, of varying proportions were used as emulsifiers. In-
depth analysis of the emulsion was done by using image processing software (Image J and
Vision Assistant 2010) apart from the accelerated stability tests [5]. The pH of the stable and
destabilized samples was compared with respect to time.
Page 10
3
Chapter 2
MATERIALS & METHODS
Page 11
4
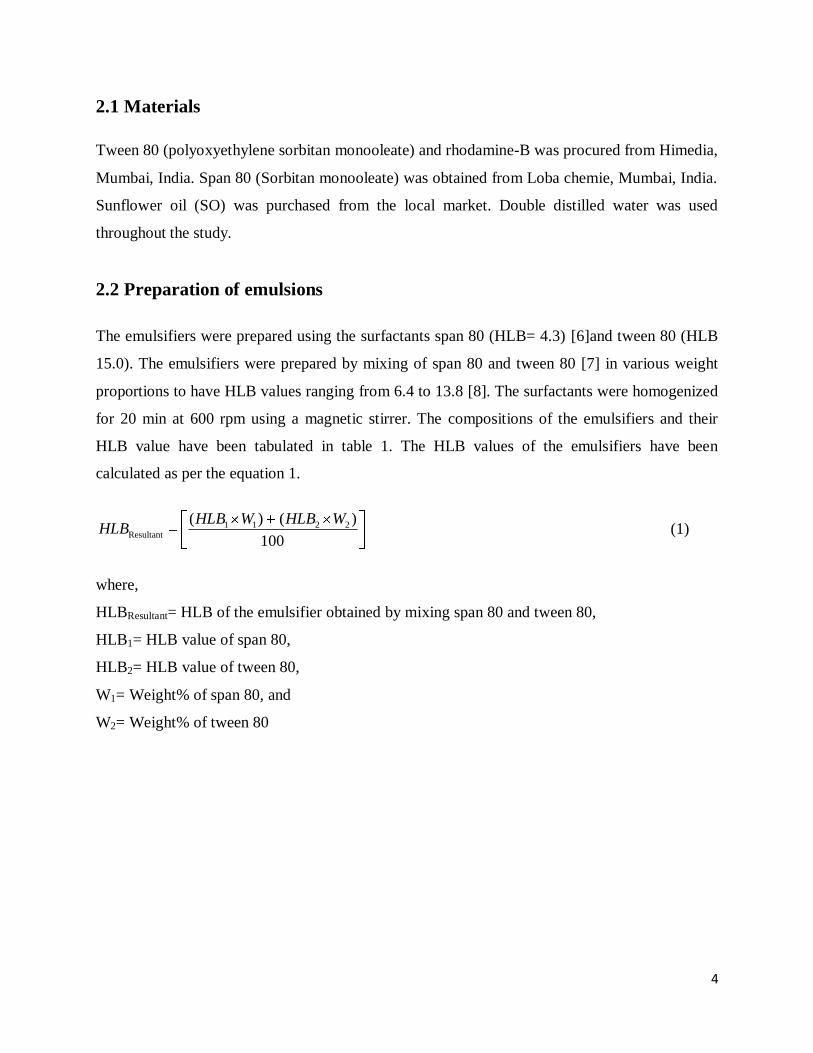
2.1 Materials
Tween 80 (polyoxyethylene sorbitan monooleate) and rhodamine-B was procured from Himedia,
Mumbai, India. Span 80 (Sorbitan monooleate) was obtained from Loba chemie, Mumbai, India.
Sunflower oil (SO) was purchased from the local market. Double distilled water was used
throughout the study.
2.2 Preparation of emulsions
The emulsifiers were prepared using the surfactants span 80 (HLB= 4.3) [6]and tween 80 (HLB
15.0). The emulsifiers were prepared by mixing of span 80 and tween 80 [7] in various weight
proportions to have HLB values ranging from 6.4 to 13.8 [8]. The surfactants were homogenized
for 20 min at 600 rpm using a magnetic stirrer. The compositions of the emulsifiers and their
HLB value have been tabulated in table 1. The HLB values of the emulsifiers have been
calculated as per the equation 1.
1 1 2 2Resultant
( ) ( )
100
HLB W HLB WHLB (1)
where,
HLBResultant= HLB of the emulsifier obtained by mixing span 80 and tween 80,
HLB1= HLB value of span 80,
HLB2= HLB value of tween 80,
W1= Weight% of span 80, and
W2= Weight% of tween 80
Page 12
5
Table 1: Resultant HLB values
Serial
No.
Span 80: Tween 80
[w/w]
HLBResultant
1 4:1 6.4
2 2:1 7.8
3 4:3 8.9
4 2:3 10.7
5 1:2 11.5
6 1:4 12.9
7 1:8 13.8
The emulsions were prepared by varying the SO: water ratios so as to have 1:4 and 4:1 fractions.
The emulsifiers were homogenized either with water or SO with continuous vortexing for 1 min.
This was followed by the addition of the second phase and subsequent vortexing for another 1
min. The compositions of the emulsions have been tabulated in table 2. The prepared emulsions
were observed at room-temperature for 24 h. If no phase separation was observed, then the
emulsion was used for further analysis. As per the reported literature, the emulsions stable for the
first 24 h is usually stable for several days[9]. The stable emulsions were kept at room-
temperature for an extended period of 56 h to figure out any visual destabilization indicator. The
samples which showed any signs of destabilization during this period were regarded as short-
term stable samples while samples which did not destabilize in this period were regarded as
long-term stable emulsions [10].
Page 13
6
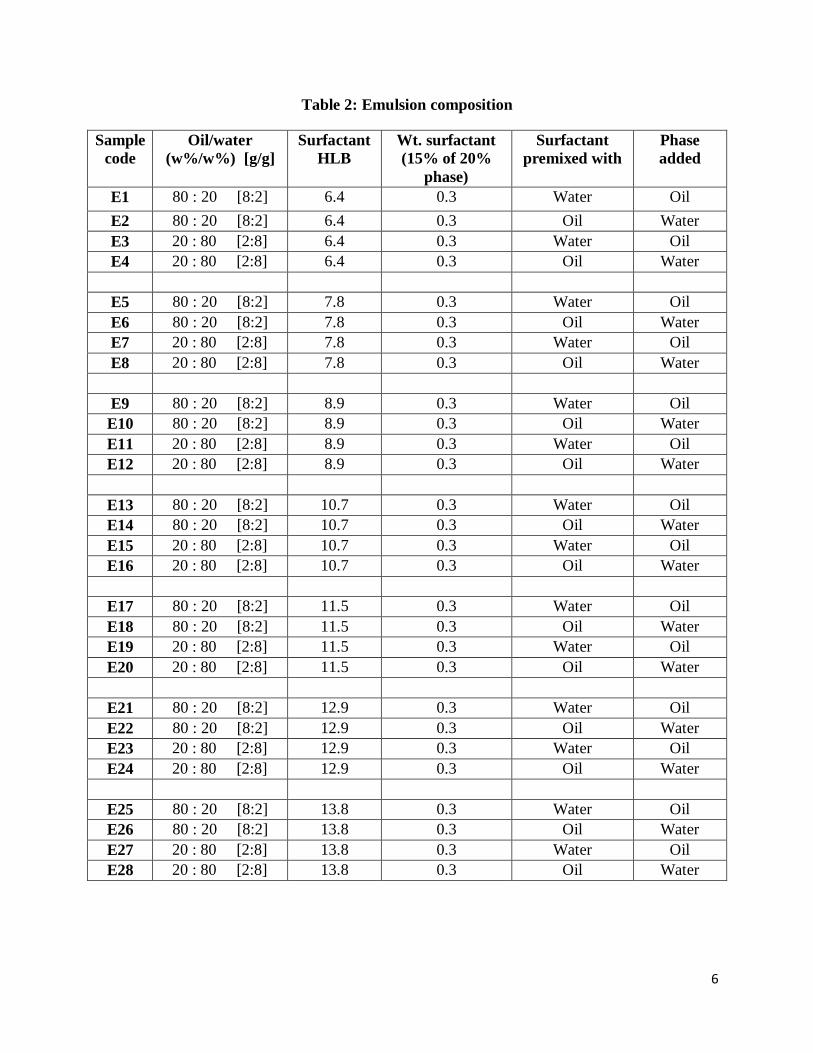
Table 2: Emulsion composition
Sample
code
Oil/water
(w%/w%) [g/g]
Surfactant
HLB
Wt. surfactant
(15% of 20%
phase)
Surfactant
premixed with
Phase
added
E1 80 : 20 [8:2] 6.4 0.3 Water Oil
E2 80 : 20 [8:2] 6.4 0.3 Oil Water
E3 20 : 80 [2:8] 6.4 0.3 Water Oil
E4 20 : 80 [2:8] 6.4 0.3 Oil Water
E5 80 : 20 [8:2] 7.8 0.3 Water Oil
E6 80 : 20 [8:2] 7.8 0.3 Oil Water
E7 20 : 80 [2:8] 7.8 0.3 Water Oil
E8 20 : 80 [2:8] 7.8 0.3 Oil Water
E9 80 : 20 [8:2] 8.9 0.3 Water Oil
E10 80 : 20 [8:2] 8.9 0.3 Oil Water
E11 20 : 80 [2:8] 8.9 0.3 Water Oil
E12 20 : 80 [2:8] 8.9 0.3 Oil Water
E13 80 : 20 [8:2] 10.7 0.3 Water Oil
E14 80 : 20 [8:2] 10.7 0.3 Oil Water
E15 20 : 80 [2:8] 10.7 0.3 Water Oil
E16 20 : 80 [2:8] 10.7 0.3 Oil Water
E17 80 : 20 [8:2] 11.5 0.3 Water Oil
E18 80 : 20 [8:2] 11.5 0.3 Oil Water
E19 20 : 80 [2:8] 11.5 0.3 Water Oil
E20 20 : 80 [2:8] 11.5 0.3 Oil Water
E21 80 : 20 [8:2] 12.9 0.3 Water Oil
E22 80 : 20 [8:2] 12.9 0.3 Oil Water
E23 20 : 80 [2:8] 12.9 0.3 Water Oil
E24 20 : 80 [2:8] 12.9 0.3 Oil Water
E25 80 : 20 [8:2] 13.8 0.3 Water Oil
E26 80 : 20 [8:2] 13.8 0.3 Oil Water
E27 20 : 80 [2:8] 13.8 0.3 Water Oil
E28 20 : 80 [2:8] 13.8 0.3 Oil Water
Page 14
7
2.3 pH variations of the emulsions
The variation in the pH of the stable emulsions was measured with the help of a digital pH meter
(model 132E, EI products, India). The pH values were noted down at intervals of 8 h for 56 h.
2.4 Determination of emulsion type
Dye solubility test was performed on the long-term stable emulsions to find out the emulsion
type. The dye solubility test involves the addition of a pinch of rhodamine-B dye on to the
surface of the emulsions. If the emulsion is of W/O type, then the rhodamine-B dye will float on
the emulsion surface, else the dye will dissolve thoroughly causing a change in the color of the
emulsion from white to pink.
2.5 Accelerated thermal stability test
The accelerated thermal stability tests were carried out on the long-term stable emulsions by
thermocycling method. The stability of the pharmaceutical products may be carried out by
thermo-cycling process. The samples which were stable for the first 24 h, were used to conduct
accelerated stability test. Alternate heating and cooling of emulsions for a particular period can
help estimating the stability of the emulsions. The emulsions were alternatively incubated for 15
min at temperatures of 50oC and -20
oC. The samples were regarded as stable samples, if the
emulsions withstand at least 5 cycles of the thermo-cycling process. The study was extended for
16 cycles to have an idea on the long-term stability of the emulsion.
2.6 Microscopy
The microstructures of the emulsions were studied under compound light microscope (CH20i,
Olympus, India). The microstructures of the emulsions were analyzed using ImageJ and NI
Vision Assistant softwares. All the stable samples were examined under microscope for 56 h at
an interval of 8 h.
Page 15
8
Chapter 3
RESULTS AND DISCUSSIONS
Page 16
9
3.1 Preparation of emulsions
The emulsions were prepared in 10 ml glass culture bottles (figure 1). The emulsions were then
kept aside without disturbing, at room temperature, for 24 h. All the emulsion with SO: water
ratio of 1:4 (E3, E4, E7, E8, E11, E12, E15, E16, E19, E20, E23, E24, E27 and E28) showed
phase separation, immediately after vortexing, for all HLB values indicating that the emulsifiers
did not promoted O/W emulsion formation. The emulsions E21 and E22, whose SO: water ration
is 4:1, also destabilized immediately. The destabilization of the emulsions may be attributed to
the cracking of the emulsions [11]. This may be due to the merging of smaller droplets to a
bigger one, which results in the removal of the continuous phase from the space available within
the two droplets and subsequent rupture of the emulsifier barrier (due to the hydrodynamic
pressure exerted by the continuous phase) leading to the coalescence of the smaller droplets. This
process continues till the oil and water phase separates to form distinct layers[12]. This kind of
destabilization has been accounted to the inability of the emulsifiers to prevent the merger of the
smaller droplets [13]. Twelve emulsions were found to be stable for 24 h. They were
subsequently kept undisturbed at room-temperature up to 56 h. Six emulsions (E5, E9, E13, E17,
E21 and E26) showed destabilization which may be attributed to the process of sedimentation or
creaming (figure 2). This happens when dispersed phase forms floccules, which then either settle
down or moves up due to the influence of the gravity on the phase with higher density. Since
these emulsions are forming sediments, they are W/O emulsions[14]. Water being higher density
phase settles down[15]. These short-term stable emulsions were discarded after preliminary
examination to understand the mechanism of destabilization. The rest of the samples (E2, E6,
E10, E14, E18 and E25) were found to be stable for even after 9 months of storage at room-
temperature (figure 3).
Page 17
10
Figure 1. Sunflower oil & water based emulsions. (a) E1-E4 (HLB 6.4) (b) E5-E8 (HLB 7.8)
(c) E9-E12 (HLB 8.9) (d) E13-E16 (HLB 10.7) (e) E17-E20 (HLB 11.5) (f) E21-E24 (HLB
12.9) (g) E25-E28 (HLB 13.8)
Page 18
11
Figure 2: Short-term stable emulsions showing sedimentation. (a) E5 (b) E9 (c) E13 (d) E17
(e) E21 (f) E26
Figure 3: Long-term stable emulsion samples. (a) E2 (b) E6 (c) E10 (d) E14 (e) E18 (f) E25
3.2 pH measurement
The pH of the freshly prepared emulsions, which were found to be stable for the first 24 h, was
measured for 56 h at an interval of 8 h (figure 4). The results indicate that the pH of the long-
term stable emulsions (E2, E6, E10, E14, E18 and E25) were constant, within a certain limit,
whereas the short-term stable emulsions (E5, E9, E13, E17, E21 and E26) indicated a continuous
decrease in the pH values.
Page 19
12
0 10 20 30 40 50 606.6
6.8
7.0
7.2
7.4
7.6
7.8
8.0p
H
Time (h)
E5
E9
E13
E17
E21
E26
0 10 20 30 40 50 60
7.1
7.2
7.3
7.4
7.5
7.6
7.7
7.8
pH
Time (h)
E2
E6
E10
E14
E18
E25
(a) (b)
Figure 4: pH variation of emulsions. (a) Short-term stable emulsions, and (b) Long-term
stable emulsions.
3.3 Determination of emulsion type
To figure out the type of the emulsions, the long-term stable emulsions were subjected dye
solubility tests [16]. The test suggested that the long-term stable emulsions were W/O type of
emulsion, which showed that the rhodamine-B dye did not get dissolved in the external phase,
but remained as powdered clusters on the surface of the emulsions (figure 5). The results present
an interesting finding. In general, surfactants having HLB values of 0-8.6 promote W/O
emulsion[17] whereas surfactant with HLB values > 9.6 promote O/W emulsions. In the present
study, when the HLB value was modulated, in the range of 6.4 to 13.8, by mixing various
proportions of span 80 and tween 80, the resultant emulsifier promoted W/O emulsion
irrespective of the HLB value.
Page 20
13
Figure 5: Dye solubility test for the long-term stable emulsions. (a) E2 (b) E6 (c) E10 (d)
E14 (e) E18 (f) E21 (g) E25
3.4 Accelerated thermal stability testing
The accelerated thermal stability testing of emulsions were carried out on the long-term stable
emulsions. Emulsions are often regarded as complex systems due to the presence of various
factors which might affect the stability of the emulsion [18]. Due to this reason, the Arrhenius
relationship cannot be used to predict stability of the emulsions though it has been successful in
predicting the stability of a number of simple pharmaceutical, nutraceutical and cosmetics
formulations. Instead of this, freeze-thaw method has become popular for predicting the stability
of the emulsion formulations. The method employs continuous exposure of the samples to a
freeze-thaw cycle at short intervals of time with the minimum temperature being ≤ -5 oC and the
higher temperature being dependent on the type of formulation. In general, the higher
temperature is set at ≥ 50 oC. The thermocycling method is only a predictive method and do not
return with the exact time interval of destabilization. The testing considers the probable change
in the properties of the surfactants at elevated temperatures, which in turn may alter the
partitioning property of the surfactant, and the probable rupture of the surfactant layer in the
presence of ice crystals at lower temperatures [19]. In either of the case, the samples will become
unstable. In general, it is considered that the samples should withstand at least 5 cycles of freeze-
thawing process. The long-term stable emulsions (E2, E6, E10, E14, E18 and E25) were able to
Page 21
14
sustain much more than 5 cycles indicating the inherent stability of the long-term stable
emulsions (table 3).
Table 3: Accelerated thermal stability test
Emulsion
code
No. of stable
cycles
Time of
Destabilization
(h)
E2 9 4.5
E6 8 4
E10 13 6.5
E14 10 5
E18 8 4
E25 9 4.5
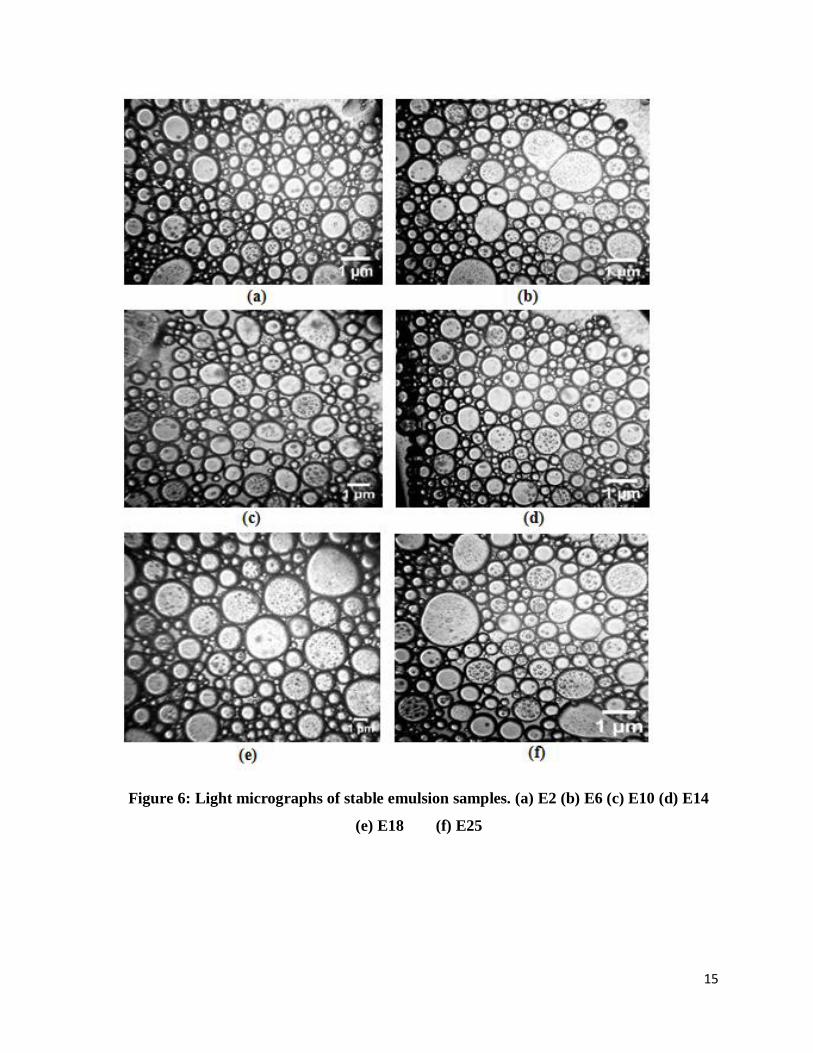
3.5 Microscopic studies conducted on the emulsions
The long-term stable emulsions were observed under a compound optical microscope (figure 6).
The micrographs of the emulsions indicated that most of the dispersed phase was present as
circular droplets and had a range of sizes rather than droplets of a particular size. This generally
occurs for the emulsions, which are prepared by physical methods like vortexing and mechanical
homogenizers [20].
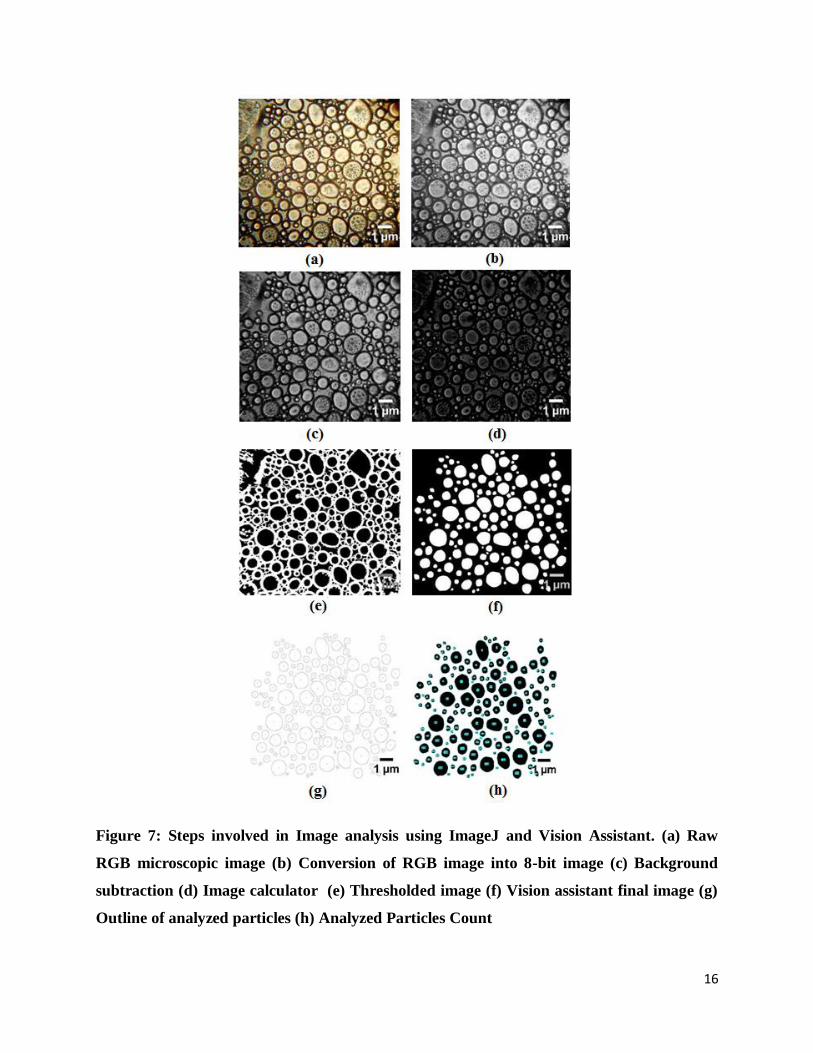
The sizes of the circular droplets were calculated using ImageJ and NI Vision Assistant
softwares from the micrographs. Figure 7 identifies the different steps used for the determination
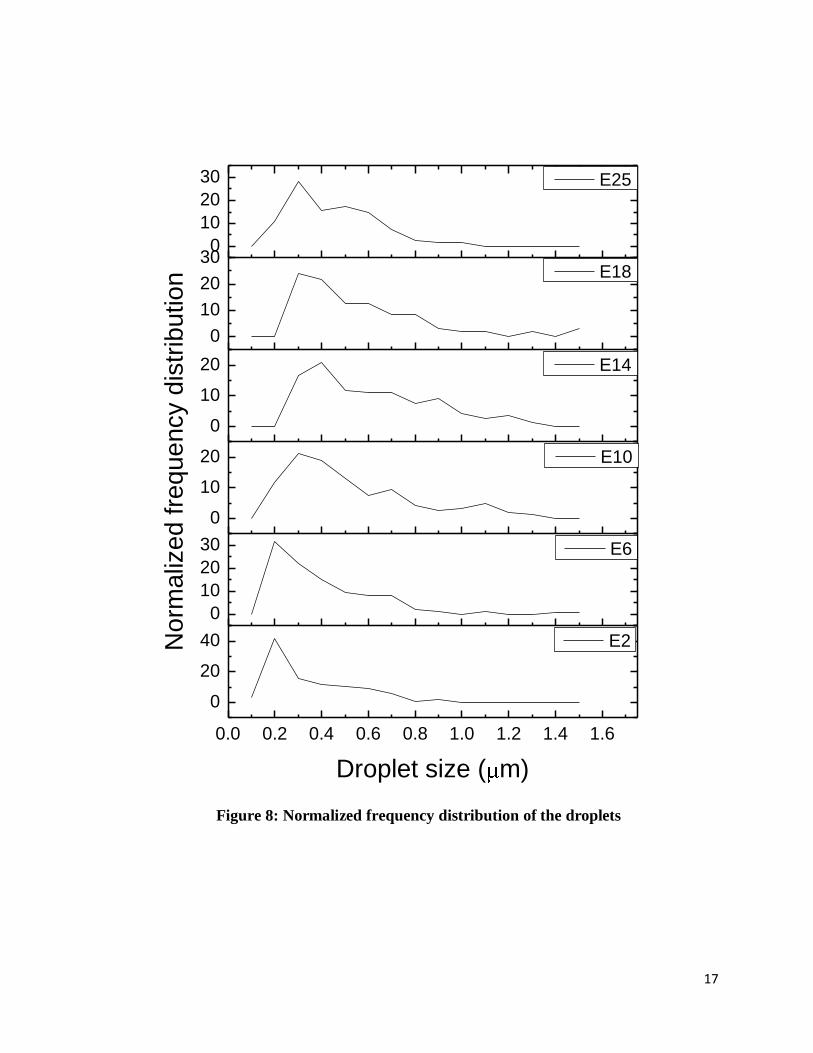
of the droplet sizes. Figure 8 shows the frequency droplet distribution graph. The results support
the visual examination of the micrographs indicating the presence of a broad range of droplet
size distribution rather than a narrow size range. It showed that the droplet sizes varied from 0.1
to 1.5 µm with a greater number of droplets being clustered in the range of 0.2-0.5 µm.
Page 22
15
Figure 6: Light micrographs of stable emulsion samples. (a) E2 (b) E6 (c) E10 (d) E14
(e) E18 (f) E25
Page 23
16
Figure 7: Steps involved in Image analysis using ImageJ and Vision Assistant. (a) Raw
RGB microscopic image (b) Conversion of RGB image into 8-bit image (c) Background
subtraction (d) Image calculator (e) Thresholded image (f) Vision assistant final image (g)
Outline of analyzed particles (h) Analyzed Particles Count
Page 24
17
0.0 0.2 0.4 0.6 0.8 1.0 1.2 1.4 1.6
0
20
40
0
10
20
30
0
10
20
0
10
20
0
10
20
300
10
20
30
No
rma
lize
d fre
qu
ency d
istr
ibutio
n
Droplet size ( m)
E2
E6
E10
E14
E18
E25
Figure 8: Normalized frequency distribution of the droplets
Page 25
18
6 7 8 9 10 11 12 13 14
0.8
0.9
1.0
1.1
1.2
1.3
1.4
1.5
1.6
1.7
Ma
xim
um
Dro
ple
t D
iam
ete
r (
m)
H.L.B value
Figure 9: Variation of the highest proportion of droplet sizes as a function of HLB
Figure 9 shows the variation of the highest proportion of droplet sizes as a function of HLB
value of the emulsifier [13]. The results indicate a bimodal distribution pattern. This suggests
that as the HLB is increased from 6.4 to 7.8, there is an increase in the droplet size of the
emulsions followed by a decrease in the droplet size as the HLB is increased to 8.9. With the
subsequent increase in the HLB value to 11.5, there was an initial increase in the droplet
size[21]. Thereafter, the droplet sizes of the emulsions decreased with the increase in the HLB
value up to 13.8[22].
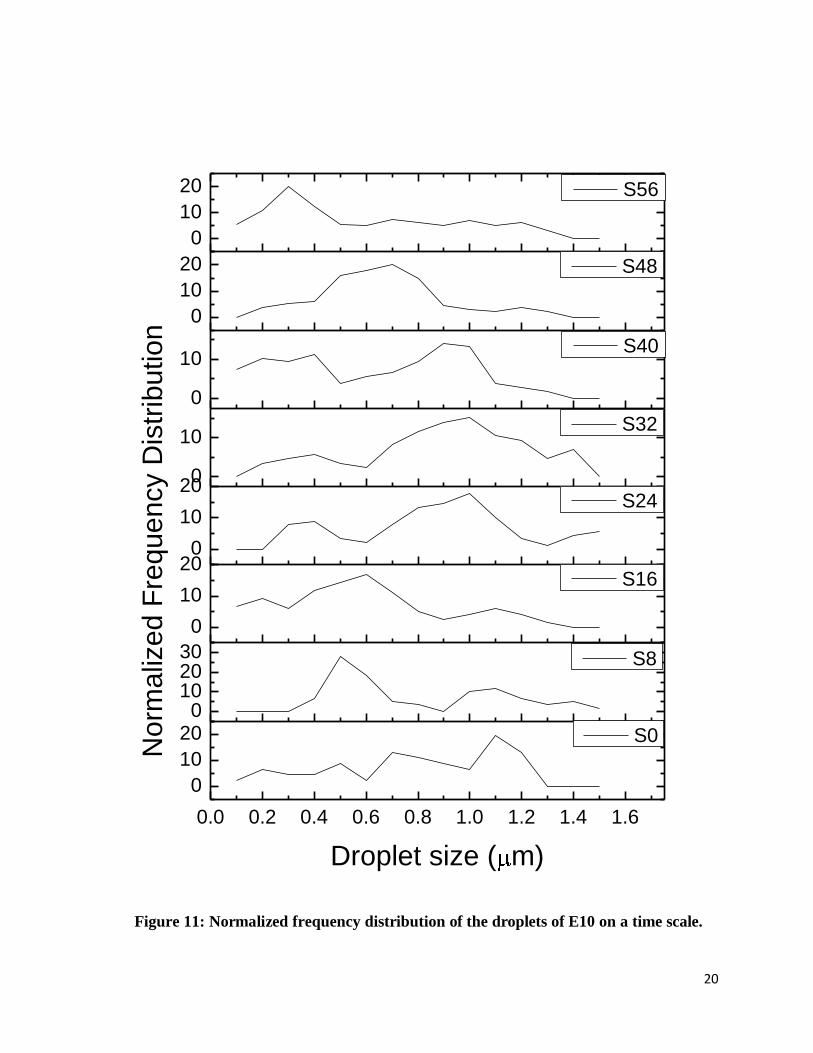
Figure 10 shows the micrographs of the E10 sample, taken as the representative sample for the
long-term stable emulsions, sampled at an interval of 8 h for a period of 56 h. The samples were
named as SX, X being the time of sampling in hours, e.g. S0 means sample withdrawn at 0 h and
S56 means sample withdrawn at 56 h. Micrographs indicated that the droplets did not change its
morphological shape and were circular in nature throughout the studies. The normalized
frequency distribution pattern of the droplets indicated that there was insignificant change in the
droplet sizes of the E10 emulsion even after 56 h (figure 11).
Page 26
19
Figure 10: Light micrographs of E10 taken regular intervals of 8 h. (a) S0 (b) S8 (c)
S16 (d) S24 (e) S32 (f) S40 (g) S48 (h) S56
Page 27
20
0.0 0.2 0.4 0.6 0.8 1.0 1.2 1.4 1.6
0
10
200
102030
0
10
200
10
200
10
0
10
0
10
20
0
10
20
Norm
aliz
ed F
requency D
istr
ibutio
n
Droplet size ( m)
S0
S8
S16
S24
S32
S40
S48
S56
Figure 11: Normalized frequency distribution of the droplets of E10 on a time scale.
Page 28
21
Figure 12: Micrographs of the short-term stable emulsions. (a) E5, (b) E9, (c) E13, (d)
E17, (e) E21, and (f) E26
Page 29
22
Figure 12 shows the microstructure of the short-term stable emulsions after 56 h reveals that the
possible reason of destabilization is flocculation. The micrographs supports our previous
assumption that the short-term stable emulsions were forming floccules, thereby behaving as
single large entities. As these large entities are formed, they are being affected by the
gravitational force and follows Stoke’s law of sedimentation [15].
Page 30
23
Chapter 4
CONCLUSION
Page 31
24
4.1 Conclusion
The study reports the successful development of stable sunflower oil-water emulsions by simple
vortexing method. The study indicated that as the HLB value was changed by mixing various
proportions of span 80 and tween 80 in the range of 6.4 and 13.8, the emulsifier supported the
formation of W/O emulsions even at higher HLB values. Cracking and sedimentation is the main
reason of destabilization of the unstable and short-term stable emulsions, respectively. The long-
term stable samples are stable even after 9 months of observation. The droplet size of the
aqueous phase of the long-term stable emulsions was found to be in the range of 0.1-1.4 µm, thus
making it suitable for controlled drug delivery [23].
Page 32
25
References
1. Bovey, F.A., Emulsion polymerization. 1955: Interscience Publishers.
2. Lorant, R., W/O EMULSION. 2007, US Patent App. 20,080/145,436.
3. Pouton, C.W., Formulation of self-emulsifying drug delivery systems. Advanced drug
delivery reviews, 1997. 25(1): p. 47-58.
4. Shinoda, K. and H. Saito, The stability of O/W type emulsions as functions of temperature
and the HLB of emulsifiers: the emulsification by PIT-method. Journal of Colloid and
Interface Science, 1969. 30(2): p. 258-263.
5. Constantinides, P.P., Lipid microemulsions for improving drug dissolution and oral
absorption: physical and biopharmaceutical aspects. Pharmaceutical research, 1995.
12(11): p. 1561-1572.
6. Pasche Koo, F., et al., High sensitization rate to emulsifiers in patients with chronic leg
ulcers. Contact Dermatitis, 1994. 31(4): p. 226-228.
7. Shinoda, K., T. Yoneyama, and H. Tsutsumi, Evaluation of emulsifier blending. Journal
of Dispersion Science and Technology, 1980. 1(1): p. 1-12.
8. Boyd, J., C. Parkinson, and P. Sherman, Factors affecting emulsion stability, and the
HLB concept. Journal of Colloid and Interface Science, 1972. 41(2): p. 359-370.
9. Meisen, L., Study on the effect of emulsifiers (HLB> 7) on the quality of soft lee cream
[J]. Science and Technology of Food Industry, 2006. 2.
10. Vander Kloet, J. and L.L. Schramm, The effect of shear and oil/water ratio on the
required hydrophile-lipophile balance for emulsification. Journal of surfactants and
detergents, 2002. 5(1): p. 19-24.
11. Levine, S., B.D. Bowen, and S.J. Partridge, Stabilization of emulsions by fine particles I.
Partitioning of particles between continuous phase and oil/water interface. Colloids and
surfaces, 1989. 38(2): p. 325-343.
12. Denkov, N., et al., A possible mechanism of stabilization of emulsions by solid particles.
Journal of Colloid and Interface Science, 1992. 150(2): p. 589-593.
13. Mine, Y., M. Shimizu, and T. Nakashima, Preparation and stabilization of simple and
multiple emulsions using a microporous glass membrane. Colloids and Surfaces B:
Biointerfaces, 1996. 6(4-5): p. 261-268.
Page 33
26
14. Roland, I., et al., Systematic characterization of oil-in-water emulsions for formulation
design. International journal of pharmaceutics, 2003. 263(1-2): p. 85-94.
15. Eccleston, G.M., Emulsions and microemulsions. Encyclopedia of pharmaceutical
technology. 2: p. 1066-1085.
16. Le Denmat, M., M. Anton, and V. Beaumal, Characterisation of emulsion properties and
of interface composition in O/W emulsions prepared with hen egg yolk, plasma and
granules. Food hydrocolloids, 2000. 14(6): p. 539-549.
17. Macierzanka, A., et al., Phase transitions and microstructure of emulsion systems
prepared with acylglycerols/zinc stearate emulsifier. Langmuir, 2006. 22(6): p. 2487-
2497.
18. Flanagan, J. and H. Singh, Microemulsions: a potential delivery system for bioactives in
food. Critical reviews in food science and nutrition, 2006. 46(3): p. 221-237.
19. Ktistis, G., A viscosity study on oil-in-water microemulsions. International journal of
pharmaceutics, 1990. 61(3): p. 213-218.
20. Clausse, D., et al., Morphology characterization of emulsions by differential scanning
calorimetry. Advances in colloid and interface science, 2005. 117(1-3): p. 59-74.
21. Szelg, H. and B. Pauzder, Rheological properties of emulsions stabilized by acylglycerol
emulsifiers modified with sodium carboxylates. Colloids and Surfaces A:
Physicochemical and Engineering Aspects, 2003. 219(1-3): p. 87-95.
22. Stabilization of emulsions. 1944, Google Patents.
23. Benita, S., Submicron emulsions in drug targeting and delivery. 1998: CRC.