Effect of subcutaneous fat on organ dose in radiography and computed tomography: A Monte Carlo calculational study Choonsik Lee , Daniel Lodwick, and Wesley E. Bolch Department of Nuclear and Radiological Engineering University of Florida
Transcript
Effect of subcutaneous fat on organ dose in radiography and computed tomography: A
Monte Carlo calculational study
Choonsik Lee, Daniel Lodwick, and Wesley E. BolchDepartment of Nuclear and Radiological Engineering
University of Florida
Background
• Radiation dose distributions within the human body from internally deposited radiation source have been calculated by the Monte Carlo method coupled with anthropomorphic computational phantoms.
+ +⎛ ⎞ ⎛ ⎞⎛ ⎞+ + ≤⎜ ⎟⎜ ⎟ ⎜ ⎟⎝ ⎠⎝ ⎠ ⎝ ⎠
≥
≤ ≤ < ≤
2 220 0
0
1 2 2 1
1
and
if and , then R R R R
x x z zya b cz z
z z z y y x x
Stylized (mathematical) phantomSince 1960s
Left lung of ORNL newborn phantom
Voxel (tomographic) phantomSince 1980s
Segmented from MR or CT data0.562x0.562x0.989 mm3 voxel
Left lung of UF voxel newborn phantom
Background
Revised ORNL adult and pediatric stylized phantoms (Han et al. 2006)
Non-uniform scaling – difficult but possible Uniform scaling is achievable
Posture change – difficult but possible Difficult to change posture
• Two classes of computational phantoms have both advantages and disadvantages.
Background
• Current stylized/voxel phantoms are based on reference human, but there are few ‘reference-like’ individuals in the world!
– Weight and height variability– Body shape variability (fat distribution)
• How to estimate ‘individual-specific’ organ dose?
– Approach 1: Make a library of voxel phantoms from lots of individuals– Approach 2: Do CT scan and automatic segmentation– Approach 3: Make flexible template phantoms and deform to individual
Background
• Hybrid approach taking advantages of stylized and voxel phantoms– Based on realistic CT data (anatomic realism of voxel phantoms)– Employ flexible Non-uniform rational B-spline (NURBS) surface
Anatomical Realism(CT images of patient)
Flexibility(NURBS surface)
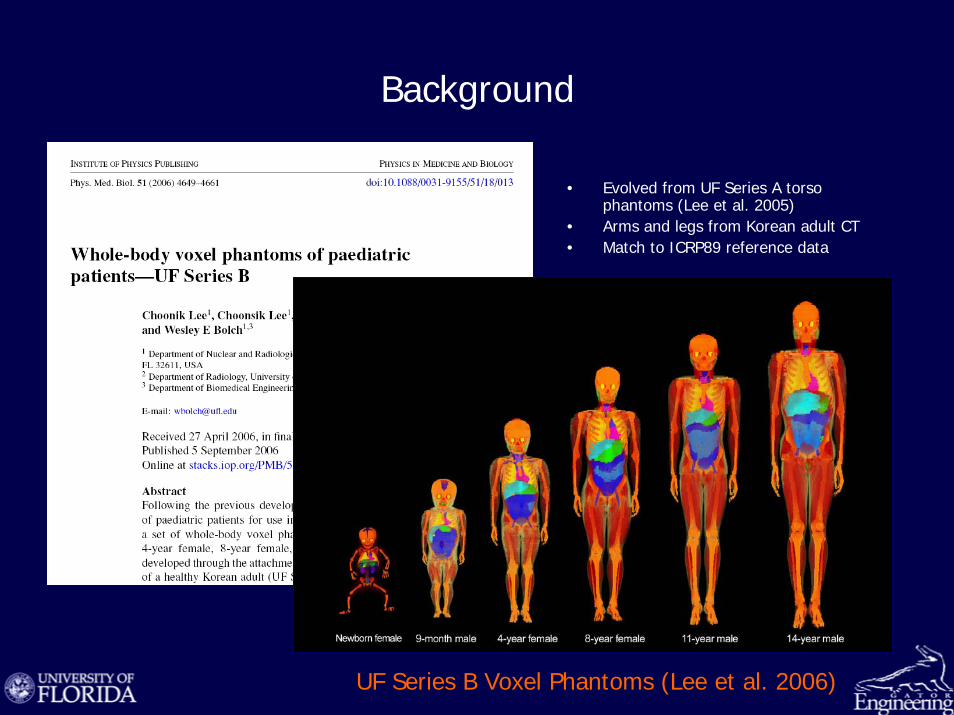
Materials and MethodsMethodology for hybrid phantom established (Lee et al. 2007)
UF hybrid female (left) and male (right) newborns
Materials and Methods
Segmentation Polygonization
NURBS modeling Voxelization
Segment CT slices using 3D-DOCTOR, 3D segmenting and
rendering software
Convert segmented model into polygon mesh using built-in function of 3D-DOCTOR
Make NURBS model from polygon mesh model using Rhinoceros, 3D
NURBS modeling software, and
Match to ICRP89 reference organ mass
Convert NURBS model into voxel model using Voxelizer, in-house MATLAB code
Materials and Methods – source anatomy
UF 14-year male voxel phantom
14-year female torso CT
14-year female head CT
15-year hybrid male phantom 15-year hybrid female phantom
18-year male arm and leg CT
Materials and Methods – standardization
ICRP89 reference organ data
NHANES reference anthropometric data
• Standing height• Sitting height• Arm length• Circumference
– Head– Neck– Waist– Buttock
• Biacromial breadth
• 60 organs and tissues• 38 bone sites
Materials and Methods – different body shape
• “Adiposity for male and female children is predominantly subcutaneous fat.”
• “In males, fat typically accumulates in the upper segment of the body, both subcutaneously and intra-abdominally. This is apparent visually as a bulging abdomen in an apple-shaped distribution. In females, adipose tissue accumulates subcutaneously, particularly over the thighs in a pear-shaped gluteal distribution.”(Arnold H. Slyper, Pediatrics Vol. 102, No. 1, 1998)
10th percentile body contour
50th percentile body contour
90th percentile body contour
Intra-abdominal fat
Subcutaneous fat
Materials and Methods – applications
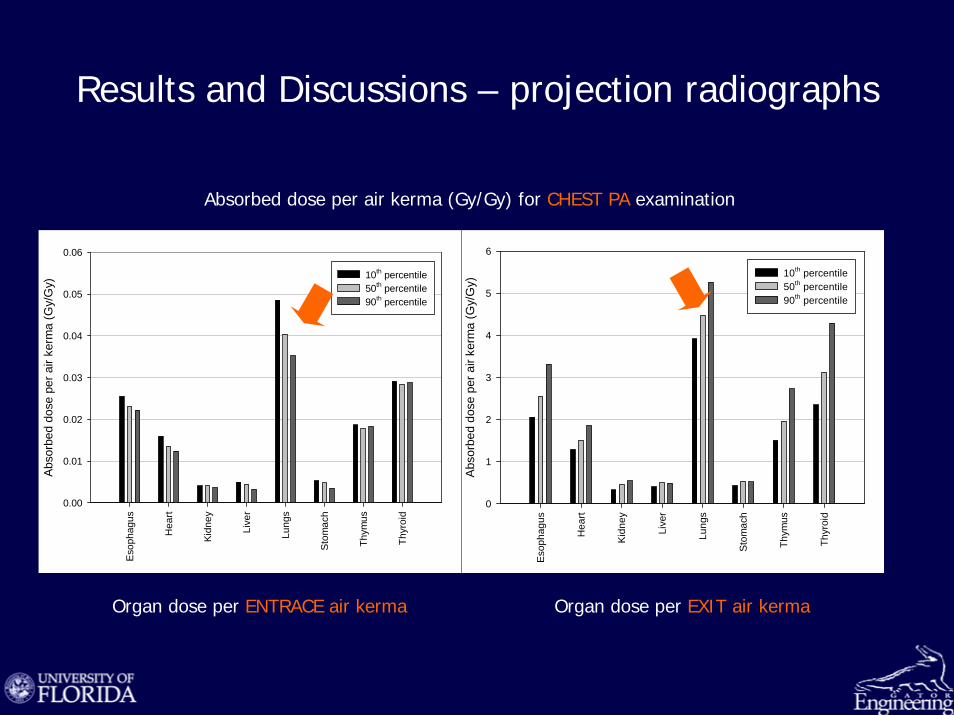
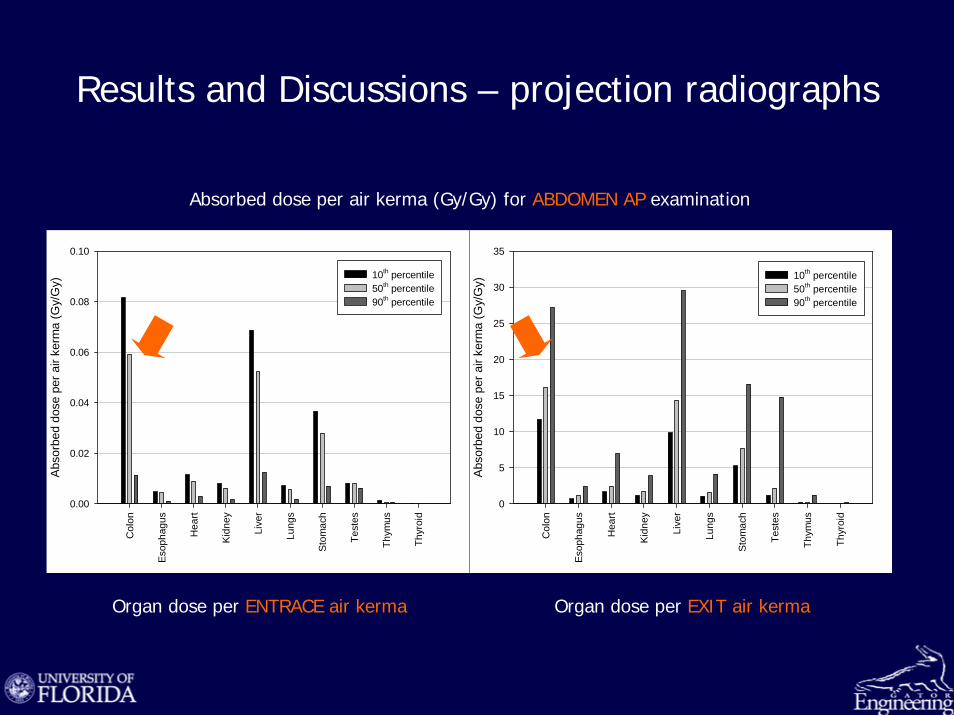
• Calculate dose conversion coefficients for projection radiographs– 66 kVp tube potential, 1.05 mm of Al filtration, and 12 degree of anode angle– Simulate chest PA and abdomen AP examinations (MCNPX2.5)– Calculate organ absorbed doses per entrance and exit air kerma
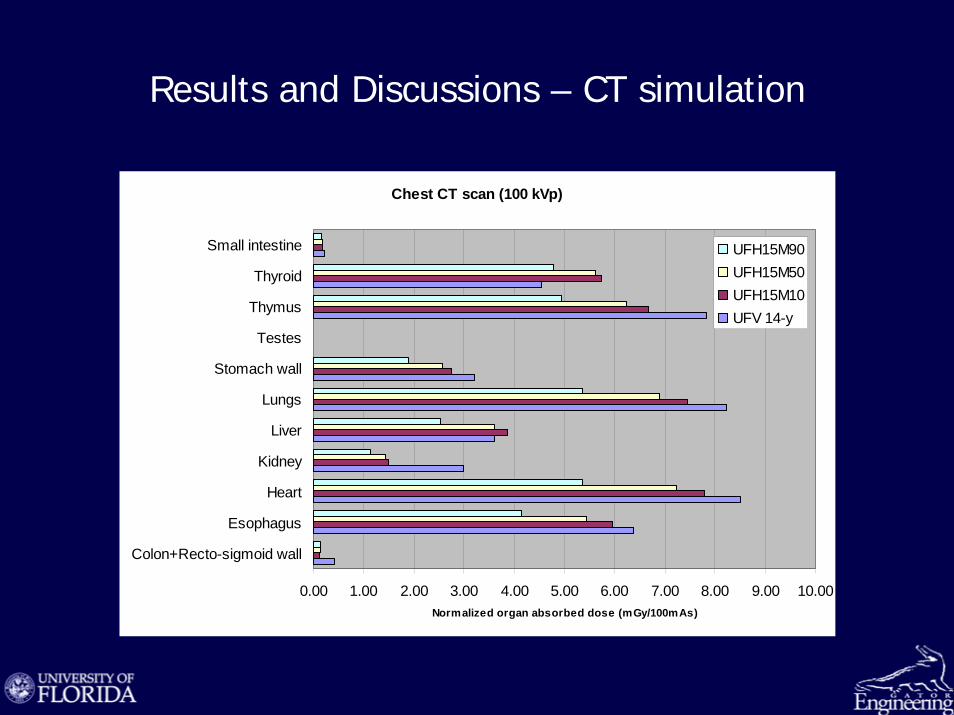
• Calculate organ absorbed dose for CT scans– Simulate SOMATOM Sensation 16 helical multi-slice CT scanner– MCNPX2.5 source routine was recompiled to incorporate helical CT beams– 100 kVp tube potential and 1.2 mm collimator width– Simulate chest and abdomen CT scans– Calculate organ absorbed doses normalized to 100 mAs
Materials and Methods – applications
Example of modified arm structure of UFH15M50th for CT calculation