Effect of Surface Morphology on Crack Growth at a Sol-Gel Reinforced Epoxy/Aluminum Interface Jiong Liu Manoj K. Chaudhury Department of Chemical Engineering, Lehigh University, Bethlehem, Pennsylvania, USA Douglas H. Berry Jill E. Seebergh Joseph H. Osborne Kay Y. Blohowiak Boeing Company, Seattle, Washington, USA The Boeing sol-gel conversion coating (Boegel-EPII), derived from an acid- catalyzed aqueous solution of organofunctional silane and zirconium alkoxide precursors, is being used as an adhesion promoter for adhesive bonding and paint- ing applications in the aerospace industry. A unique advantage of the sol-gel process is that strong and durable bonds are produced without the hazardous chemical usage and rinse-water requirements of conventional anodizing or etching processes. In this study, a fracture mechanics method was used to investigate the adhesion properties of sol-gel-reinforced epoxy=aluminum joints. The Hugh Brown asymmetric double cantilever beam (ADCB) wedge test was employed, which allowed the measurements of the critical energy-release rate, subcritical crack-growth kinetics, and threshold energy-release rate on a single sample in a reasonably short period of time. These experiments were carried out with aluminum substrates on which the surface morphology was systematically varied by polishing, sanding, grit-blasting, and chemical etching. X-ray photoelectron spectroscopy (XPS) and scanning electron microscopy (SEM) were used to identify the locus of failure. The surface morphology of the substrates was characterized with SEM, optical profilometry, and spreading kinetics. The macrorough structures drive the crack to within a thin epoxy layer close to the polymer=metal interface, which enhances the initial strength of the sol-gel-reinforced interface. The microroughness of the substrate is, however, more effective than the Received 29 December 2005; in final form 15 March 2006. One of a collection of papers honoring Hugh R. Brown, who received The Adhesion Society Award for Excellence in Adhesion Science, Sponsored by 3M, in February 2006. Address correspondence to Manoj K. Chaudhury, Department of Chemical Engineer- ing, Iacocca Hall, 111 Research Drive, Lehigh University, Bethlehem, PA 18015, USA. E-mail: [email protected]The Journal of Adhesion, 82:487–516, 2006 Copyright # Taylor & Francis Group, LLC ISSN: 0021-8464 print=1545-5823 online DOI: 10.1080/00218460600713725 487
Transcript
Effect of Surface Morphology on Crack Growthat a Sol-Gel Reinforced Epoxy/Aluminum Interface
Jiong LiuManoj K. ChaudhuryDepartment of Chemical Engineering, Lehigh University,Bethlehem, Pennsylvania, USA
Douglas H. BerryJill E. SeeberghJoseph H. OsborneKay Y. BlohowiakBoeing Company, Seattle, Washington, USA
The Boeing sol-gel conversion coating (Boegel-EPII), derived from an acid-catalyzed aqueous solution of organofunctional silane and zirconium alkoxideprecursors, is being used as an adhesion promoter for adhesive bonding and paint-ing applications in the aerospace industry. A unique advantage of the sol-gelprocess is that strong and durable bonds are produced without the hazardouschemical usage and rinse-water requirements of conventional anodizing or etchingprocesses. In this study, a fracture mechanics method was used to investigate theadhesion properties of sol-gel-reinforced epoxy=aluminum joints. The Hugh Brownasymmetric double cantilever beam (ADCB) wedge test was employed, whichallowed the measurements of the critical energy-release rate, subcriticalcrack-growth kinetics, and threshold energy-release rate on a single sample in areasonably short period of time. These experiments were carried out withaluminum substrates on which the surface morphology was systematically variedby polishing, sanding, grit-blasting, and chemical etching. X-ray photoelectronspectroscopy (XPS) and scanning electron microscopy (SEM) were used to identifythe locus of failure. The surface morphology of the substrates was characterizedwith SEM, optical profilometry, and spreading kinetics. The macroroughstructures drive the crack to within a thin epoxy layer close to the polymer=metalinterface, which enhances the initial strength of the sol-gel-reinforced interface.The microroughness of the substrate is, however, more effective than the
Received 29 December 2005; in final form 15 March 2006.One of a collection of papers honoring Hugh R. Brown, who received The Adhesion
Society Award for Excellence in Adhesion Science, Sponsored by 3M, in February 2006.Address correspondence to Manoj K. Chaudhury, Department of Chemical Engineer-
ing, Iacocca Hall, 111 Research Drive, Lehigh University, Bethlehem, PA 18015, USA.E-mail: [email protected]
The Journal of Adhesion, 82:487–516, 2006
Copyright # Taylor & Francis Group, LLC
ISSN: 0021-8464 print=1545-5823 online
DOI: 10.1080/00218460600713725
487
macroroughness in enhancing the durability. Lastly, an attempt has been made tocorrelate the energy-release rate with the fractal dimension for sol-gel-reinforcedjoints with macrorough substrates.
Although adhesive bonding is increasingly finding applications inaerospace, automotive, and other industries, its use in key structuralapplications is rather limited. A major concern is that the mechanicalperformance of the adhesive joints involving inorganic substrates maydeteriorate upon exposure to aggressive service environments [1–3].To improve the initial adhesion strength and durability of theadhesive joints, surface preparation is critical.
In the aerospace industry, the strongest and most durable adhesivebonds to metallic substrates involve etching and anodizing processes[4]. The disadvantage of these processes stems from the fact thatstrong acids, bases, and other toxic materials, such as chromates,are used. Because of the growing demands from government andenvironmental agencies to eliminate such substances from materialsand manufacturing processes, significant research and developmentefforts have been directed toward organofunctional silane approachesas potential surface-preparation methods [5–10].
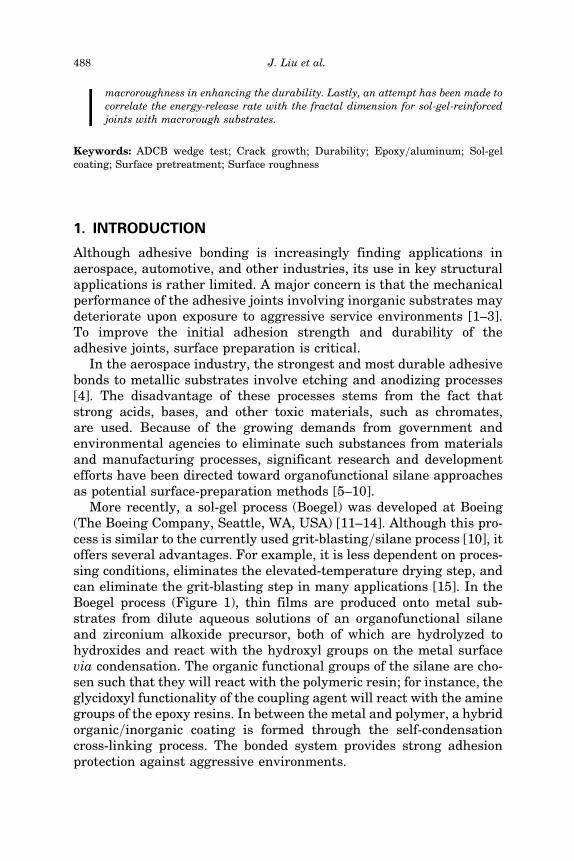
More recently, a sol-gel process (Boegel) was developed at Boeing(The Boeing Company, Seattle, WA, USA) [11–14]. Although this pro-cess is similar to the currently used grit-blasting=silane process [10], itoffers several advantages. For example, it is less dependent on proces-sing conditions, eliminates the elevated-temperature drying step, andcan eliminate the grit-blasting step in many applications [15]. In theBoegel process (Figure 1), thin films are produced onto metal sub-strates from dilute aqueous solutions of an organofunctional silaneand zirconium alkoxide precursor, both of which are hydrolyzed tohydroxides and react with the hydroxyl groups on the metal surfacevia condensation. The organic functional groups of the silane are cho-sen such that they will react with the polymeric resin; for instance, theglycidoxyl functionality of the coupling agent will react with the aminegroups of the epoxy resins. In between the metal and polymer, a hybridorganic=inorganic coating is formed through the self-condensationcross-linking process. The bonded system provides strong adhesionprotection against aggressive environments.
488 J. Liu et al.
Recent studies [11] have shown that the sol-gel process can produceadhesive joints with equivalent or superior strength and durability tothe phosphoric acid anodizing (PAA) process, which is considered the‘‘gold standard.’’ Nevertheless, although the performance is promising,little is known about the precise adhesion-promoting mechanisms ofthe sol-gel-derived coatings. An issue of particular interest is howthe surface pretreatment affects the adhesion strength and durabilityof the sol-gel-reinforced joints. Work done by Blohowiak et al. [13,15]and McCray et al. [17,18] demonstrated a large difference in hot=wetperformance of the sol-gel coatings on substrates with a variety ofpretreatment methods when assessed using the peel and DCB (doublecantilever beam) wedge tests. Although valuable information has beenobtained from these studies, the kinetics of the bond degradationupon exposure to hygrothermal and loading cycles is not completelyunderstood.
The main objective of this study is to determine the effect of the sur-face pretreatment on adhesion strength and hydrolytic stability of thesol-gel-reinforced adhesive joint. For this purpose, a wedge test
FIGURE 1 Schematic of a sol-gel adhesion promoting coating. The sol-gelfilm (typically 50–200 nm) is derived from the condensation reactions of a solprepared from a mixture of glycidoxyl functional silane and zirconium alkox-ide. An inorganic=organic gradient is created to achieve good adhesion. Vari-able-angle XPS studies indicate that the interface near the metal substrateis zirconia rich and the top film surface is silane rich [16].
Surface Morphology and Crack Growth 489
employing an asymmetric double cantilever beam (ADCB) specimenwas used to measure the crack-growth kinetics in humid environ-ments along an epoxy=aluminum interface reinforced with sol-gelcoating. The ADCB test was originally developed by Hugh Brown[19] and has been widely used [20–23] to measure the fracture energyof polymer=polymer interfaces. The advantage of the ADCB test is thatwith suitable design of the modulus and thickness of the two adher-ends, the crack can be forced to propagate close to the interface so thatthe effects of the surface pretreatment and sol-gel processing con-ditions can be directly evaluated. Our previous studies [24] demon-strated the applicability of the ADCB test method to investigate thetoughness of the sol-gel-reinforced epoxy=aluminum interface. In thecurrent study, the ADCB wedge test was slightly modified such thatstable crack growth is ensured in a humid environment. X-ray photo-electron spectroscopy (XPS) and scanning electron microscopy (SEM)were used to identify the locus of failure. These studies were carriedout with aluminum substrates for which the surface morphology wassystematically varied by polishing, sanding, grit-blasting, and chemi-cal etching. The surface roughness of the substrates was characterizedwith SEM, optical profilometry, and spreading kinetics. The corre-lation between the surface morphology and energy-release rate wasexamined.
2. EXPERIMENTAL
2.1. Materials
Clad 2024-T3 aluminum alloy (supplied by the Boeing Company,Seattle, WA, USA) was used as the substrate. The room temperature–curable epoxy system used in this study is based on diglycidyl ether ofbisphenol-A (DGEBA) with an epoxide equivalent weight of 187.5(EPON
3200, AirProducts and Chemicals, Inc., Allentown, PA, USA) (Figure 2). Fiveparts carboxylterminated butadiene acrylonitrile (Hycar
1
CTBN1300X8, Noveon, Inc., Cleveland, OH, USA) per hundred partsDGEBA were used as toughener. CTBN was prereacted with the epoxyresin by mixing them at 140�C for 4 h to make an adduct. The resinadduct and curing agent were mixed thoroughly at the stoichiometricratio, and the mixture was degassed by centrifugation. After applyingonto the sol-gel-treated substrates, the resin was postcured accordingto the following protocol. The specimen was ramped from room tem-perature to 100�C in 4 h, held at 100�C for 2 h, and then cooled down
490 J. Liu et al.
to room temperature in 6 h. This cure procedure minimizes theresidual thermal stress in the cured samples. The fracture behaviorand toughening mechanisms for the bulk material of the present epoxysystem were studied by Bagheri and Pearson [25,26]. The Tg of thisepoxy as measured by differential scanning calorimetry was determ-ined to be 105�C.
The sol-gel solutions were prepared following the proceduresdescribed in the literature for Boegel EPII [11–15]. Glycidoxypropyl-trimethoxysilane (GPTMS, 97%, Gelest, Inc., Morrisville, PA, USA),zirconium tetrapropoxide (68–70%, Strem Chemicals, Inc., Newbury-port, MA, USA), glacial acetic acid (Aldrich Chemical Co., Inc.,St. Louis, MO, USA), and Antarox
1
BL-240 (Rhodia Inc., Cranbury,NJ, USA) were used as received. The resultant sol-gel solution wasapplied to the substrates within 2 h.
2.2. Surface Pretreatment
The as-received clad 2024-T3 aluminum alloy of thickness 1.6 mmwas cut into 10 mm� 63.5 mm coupons. The substrates were wipedwith methyl ethyl ketone and acetone, alkaline cleaned using Iso-prep
1
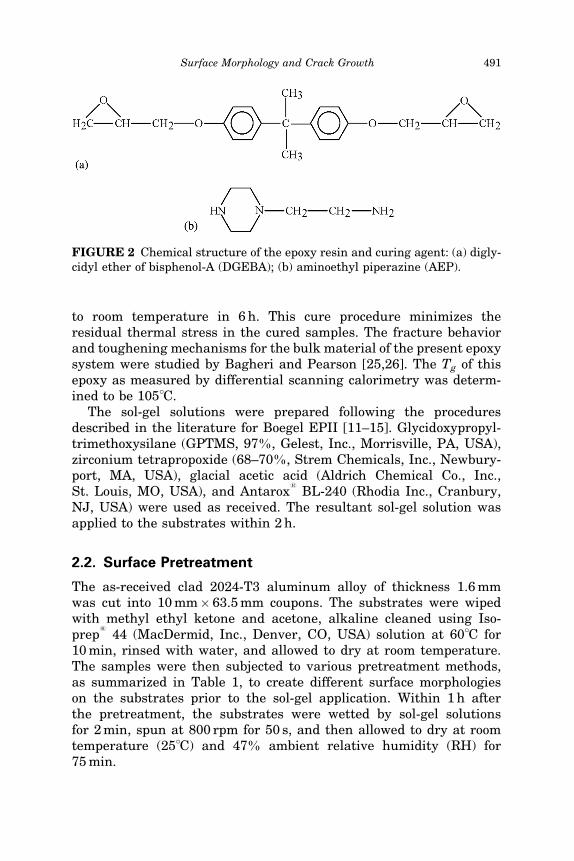
44 (MacDermid, Inc., Denver, CO, USA) solution at 60�C for10 min, rinsed with water, and allowed to dry at room temperature.The samples were then subjected to various pretreatment methods,as summarized in Table 1, to create different surface morphologieson the substrates prior to the sol-gel application. Within 1 h afterthe pretreatment, the substrates were wetted by sol-gel solutionsfor 2 min, spun at 800 rpm for 50 s, and then allowed to dry at roomtemperature (25�C) and 47% ambient relative humidity (RH) for75 min.
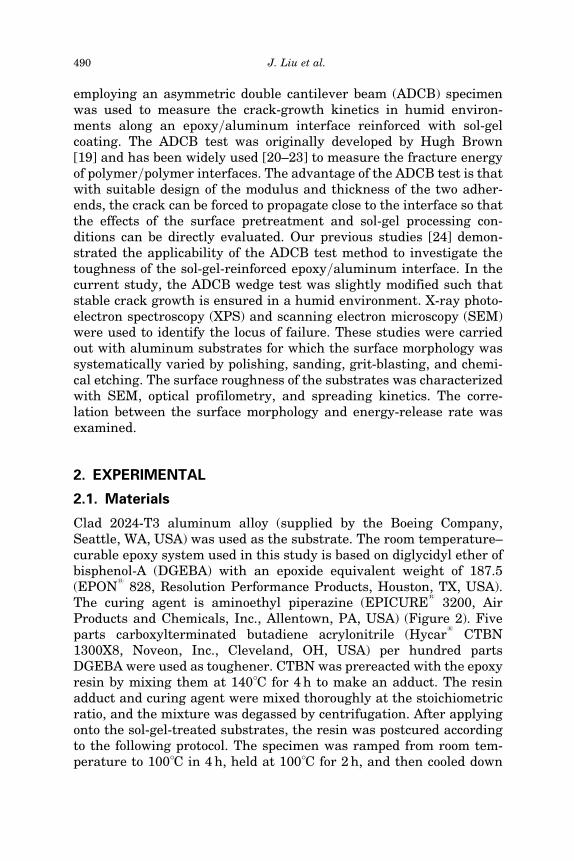
FIGURE 2 Chemical structure of the epoxy resin and curing agent: (a) digly-cidyl ether of bisphenol-A (DGEBA); (b) aminoethyl piperazine (AEP).
Surface Morphology and Crack Growth 491
2.3. Specimen Preparation
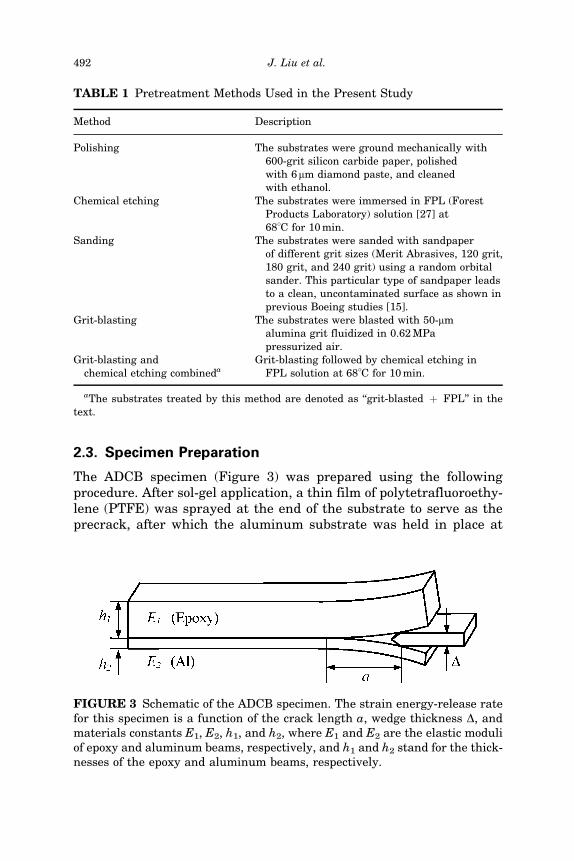
The ADCB specimen (Figure 3) was prepared using the followingprocedure. After sol-gel application, a thin film of polytetrafluoroethy-lene (PTFE) was sprayed at the end of the substrate to serve as theprecrack, after which the aluminum substrate was held in place at
TABLE 1 Pretreatment Methods Used in the Present Study
Method Description
Polishing The substrates were ground mechanically with600-grit silicon carbide paper, polishedwith 6mm diamond paste, and cleanedwith ethanol.
Chemical etching The substrates were immersed in FPL (ForestProducts Laboratory) solution [27] at68�C for 10 min.
Sanding The substrates were sanded with sandpaperof different grit sizes (Merit Abrasives, 120 grit,180 grit, and 240 grit) using a random orbitalsander. This particular type of sandpaper leadsto a clean, uncontaminated surface as shown inprevious Boeing studies [15].
Grit-blasting The substrates were blasted with 50-mmalumina grit fluidized in 0.62 MPapressurized air.
Grit-blasting andchemical etching combineda
Grit-blasting followed by chemical etching inFPL solution at 68�C for 10 min.
aThe substrates treated by this method are denoted as ‘‘grit-blasted þ FPL’’ in thetext.
FIGURE 3 Schematic of the ADCB specimen. The strain energy-release ratefor this specimen is a function of the crack length a, wedge thickness D, andmaterials constants E1, E2, h1, and h2, where E1 and E2 are the elastic moduliof epoxy and aluminum beams, respectively, and h1 and h2 stand for the thick-nesses of the epoxy and aluminum beams, respectively.
492 J. Liu et al.
the bottom of a silicone rubber mold, the width and length of whichwere exactly the same as those of the substrate. The uncured epoxywas then poured onto the substrate, and a glass slide bearing a thinPTFE film was placed on the top to squeeze out the extra epoxy.The thickness of the epoxy slab was controlled by the height of themold. After the complete cure of the epoxy, the cover glass wasdetached and extra epoxy was cut off.
2.4. Crack-Growth Rate Measurement
The energy-release rate G for the ADCB specimen (Figure 3) is calcu-lated using Kanninen’s model of beams on elastic foundation [28],which has been validated by both boundary element and finite elementanalysis [29,30]. G is given by
G ¼ 3D2E1h31E2h3
2
8a4
E1h31C2
2 þ E2h32C2
1
ðE1h31C3
2 þ E2h32C3
1Þ2
" #; ð1Þ
where C1 ¼ 1þ 0:64 h1=a; C2 ¼ 1þ 0:64 h2=a; D is the wedge thick-ness, E is the elastic modulus, h is the beam thickness, a is the cracklength, and subscripts 1 and 2 refer to epoxy beam and aluminumbeam, respectively. Previous studies [20,24] have shown that thethickness ratio h1=h2 has a significant effect on the measuredenergy-release rate. The thickness ratio hAl=hepoxy in this study is heldconstant at � 0.25. This condition corresponds to a minimum energy-release rate, and the numerically estimated phase angle is �4� [24].
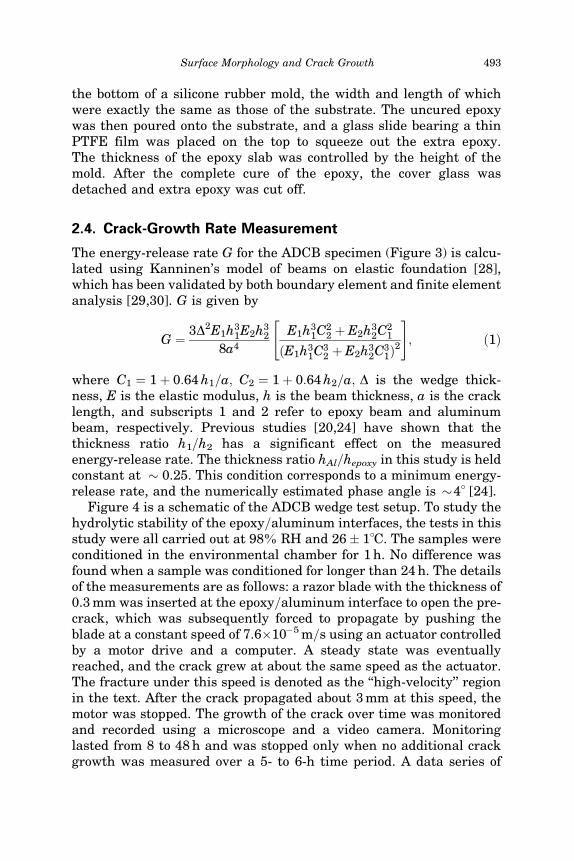
Figure 4 is a schematic of the ADCB wedge test setup. To study thehydrolytic stability of the epoxy=aluminum interfaces, the tests in thisstudy were all carried out at 98% RH and 26� 1�C. The samples wereconditioned in the environmental chamber for 1 h. No difference wasfound when a sample was conditioned for longer than 24 h. The detailsof the measurements are as follows: a razor blade with the thickness of0.3 mm was inserted at the epoxy=aluminum interface to open the pre-crack, which was subsequently forced to propagate by pushing theblade at a constant speed of 7.6�10�5 m=s using an actuator controlledby a motor drive and a computer. A steady state was eventuallyreached, and the crack grew at about the same speed as the actuator.The fracture under this speed is denoted as the ‘‘high-velocity’’ regionin the text. After the crack propagated about 3 mm at this speed, themotor was stopped. The growth of the crack over time was monitoredand recorded using a microscope and a video camera. Monitoringlasted from 8 to 48 h and was stopped only when no additional crackgrowth was measured over a 5- to 6-h time period. A data series of
Surface Morphology and Crack Growth 493
crack length as a function of time was obtained afterward andconverted to crack growth velocity as a function of energy-release rateusing the relationship given by Equation (1). After the test, the fracturesurfaces were obtained by carefully applying an impact load from athick wedge and a hammer. The fracture surfaces on both the alumi-num and epoxy sides at the ‘‘high-velocity’’ and ‘‘crack-tip’’ regions wereanalyzed by XPS and SEM to identify the locus of failure. The ‘‘crack-tip’’ region represents the fracture surface produced at very low crackvelocities, which is close to the crack tip when crack growth stops.
2.5. Characterization
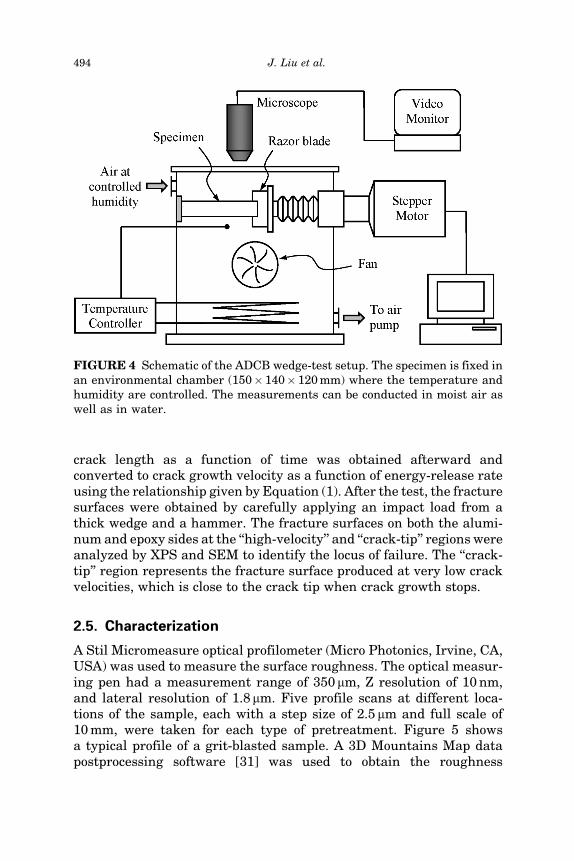
A Stil Micromeasure optical profilometer (Micro Photonics, Irvine, CA,USA) was used to measure the surface roughness. The optical measur-ing pen had a measurement range of 350 mm, Z resolution of 10 nm,and lateral resolution of 1.8 mm. Five profile scans at different loca-tions of the sample, each with a step size of 2.5 mm and full scale of10 mm, were taken for each type of pretreatment. Figure 5 showsa typical profile of a grit-blasted sample. A 3D Mountains Map datapostprocessing software [31] was used to obtain the roughness
FIGURE 4 Schematic of the ADCB wedge-test setup. The specimen is fixed inan environmental chamber (150� 140� 120 mm) where the temperature andhumidity are controlled. The measurements can be conducted in moist air aswell as in water.
494 J. Liu et al.
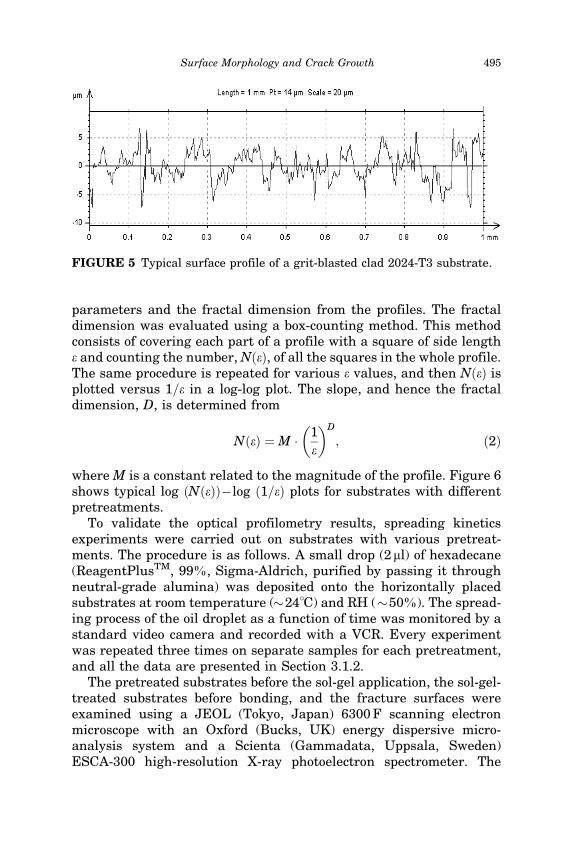
parameters and the fractal dimension from the profiles. The fractaldimension was evaluated using a box-counting method. This methodconsists of covering each part of a profile with a square of side lengthe and counting the number, NðeÞ, of all the squares in the whole profile.The same procedure is repeated for various e values, and then NðeÞ isplotted versus 1=e in a log-log plot. The slope, and hence the fractaldimension, D, is determined from
NðeÞ ¼M � 1
e
� �D
; ð2Þ
where M is a constant related to the magnitude of the profile. Figure 6shows typical log ðNðeÞÞ�log ð1=eÞ plots for substrates with differentpretreatments.
To validate the optical profilometry results, spreading kineticsexperiments were carried out on substrates with various pretreat-ments. The procedure is as follows. A small drop (2 ml) of hexadecane(ReagentPlusTM, 99%, Sigma-Aldrich, purified by passing it throughneutral-grade alumina) was deposited onto the horizontally placedsubstrates at room temperature (�24�C) and RH (�50%). The spread-ing process of the oil droplet as a function of time was monitored by astandard video camera and recorded with a VCR. Every experimentwas repeated three times on separate samples for each pretreatment,and all the data are presented in Section 3.1.2.
The pretreated substrates before the sol-gel application, the sol-gel-treated substrates before bonding, and the fracture surfaces wereexamined using a JEOL (Tokyo, Japan) 6300 F scanning electronmicroscope with an Oxford (Bucks, UK) energy dispersive micro-analysis system and a Scienta (Gammadata, Uppsala, Sweden)ESCA-300 high-resolution X-ray photoelectron spectrometer. The
FIGURE 5 Typical surface profile of a grit-blasted clad 2024-T3 substrate.
Surface Morphology and Crack Growth 495
excitation radiation for the XPS was provided by a monochromatic AlKa X-ray source operated at a constant power of 4.5 kW and passenergy of 150 eV. The FWHM (Full width at half minimum) of theAg 3d line was �0.53 eV. The spot size was 3 mm� 0.5 mm. A floodgun was used to compensate the charging on the polymer samples.All spectra were taken at a 90� take-off angle. A survey scan was takenfor each specimen to identify the elements on the surface, followed by adetailed high-resolution scan, to obtain the quantitative informationfor each element.
3. RESULTS AND DISCUSSION
3.1. Surface Morphology of the Pretreated AluminumSubstrates
3.1.1. Optical Profilometry and SEMSurface pretreatment is a very important procedure before the sol-
gel application in that it activates the alloy surface with a fresh oxidelayer as well as provides appropriate surface morphology. Figure 7
FIGURE 6 Typical log(N(E)) vs. log(1=E) plots for substrates with differentpretreatments. The fractal dimension D is given by the slope of the straightlines.
496 J. Liu et al.
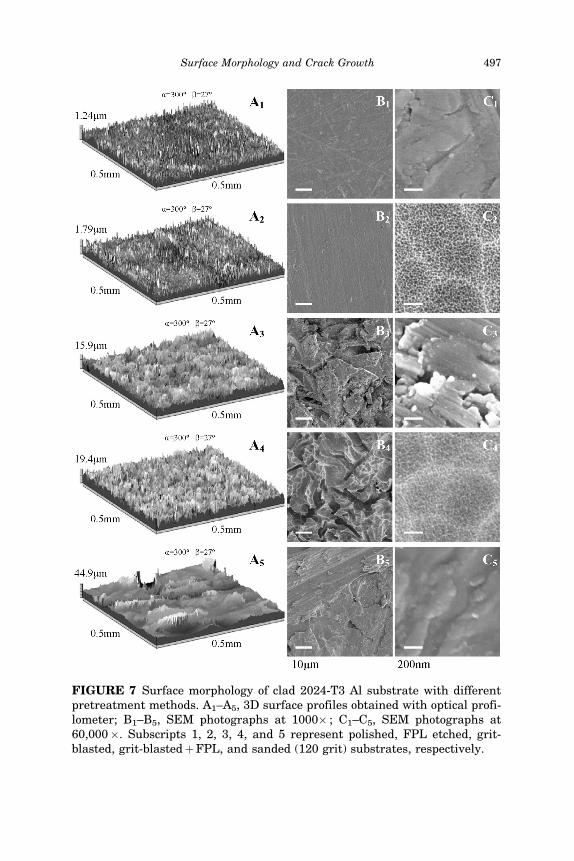
FIGURE 7 Surface morphology of clad 2024-T3 Al substrate with differentpretreatment methods. A1–A5, 3D surface profiles obtained with optical profi-lometer; B1–B5, SEM photographs at 1000� ; C1–C5, SEM photographs at60,000�. Subscripts 1, 2, 3, 4, and 5 represent polished, FPL etched, grit-blasted, grit-blastedþFPL, and sanded (120 grit) substrates, respectively.
Surface Morphology and Crack Growth 497
shows the surface morphology of clad 2024-T3 aluminum substratewith different pretreatment methods. The 3D surface profiles obtainedwith profilometry and SEM photographs show that the dimensions ofthe roughness features are at different scales and the topography ofthe surfaces varies significantly with the pretreatment.
Table 2 gives a quantitative view of these surfaces. The listed tworoughness parameters, average roughness, Ra, and peak-to-valleyparameter, Rt, show similar trends as the pretreatment varies.Although the surface morphology differs drastically for the polishedand FPL-etched substrates at the nanoscale (Figure 7C1, C2), at themicron scale the Ra and Rt values for these two substrates show onlyslight difference. Visually, both polished and FPL-etched substratesare macroscopically flat as compared with the grit-blasted and sandedsubstrates. Grit-blasting and sanding produce macrorough surfaces,1
of which the Ra and Rt values are about one order of magnitude higherthan that of the polished and FPL-etched substrates. Combining grit-blasting with FPL etching results in a surface with higher Ra, Rt
values than those by grit-blasting only. For the sanded substrates,the macroroughness increases as the grit size of the sandpaperincreases. Here the grit number is inversely proportional to thegrit size.
TABLE 2 Roughness Parameters and Fractal Dimension Measured withOptical Profilometry for Different Pretreatment Method
aRa is the arithmetical mean deviation of the assessed profile. Ra ¼ ð1=lÞR l
0 yðxÞj jdx,where l is the sampling length and y is the altitude of the profile. Rt is the total heightof profile, which is the sum of the height of the largest profile peak height and the largestprofile valley depth within the evaluation length [32].
1The most generally accepted definition of macroroughness and microroughness isgiven by Venables [27], where he defines macrorough surfaces as having characteristicbumps and jagged features about 1.0mm or greater and microrough surfaces as havingfine structure with dimensions 0.1mm or less.
498 J. Liu et al.
Although the roughness parameters Ra and Rt reveal the dimensionof the roughness features on the surface, they give little informationabout the spatial distribution of the topography. The topography ofmost engineering surfaces is fractal in nature, exhibiting self-similaror self-affine scaling over a range of length scales [33,34]. Chemicallyetched surfaces have long been recognized as fractal at least over arange of dimensions smaller than the grain structure of the material[35]. Amada et al. [36–38] found that the grit-blasted surfaces havea self-affine property and evaluated their fractal dimension using abox-counting method. Mannelqvist and Groth [39] studied the surfacescreated by several mechanical abrasion techniques and found thatthese surfaces show fractal behavior that can be characterized byfractal geometry.
In the present work, the fractal characteristics were investigatedfor the macrorough substrates based on the profile data obtained bythe optical profilometer. The grit-blasted, sanded, and ‘‘grit-blastedþFPL’’ substrates all have fractal characteristics as confirmed bythe linear relation between logðNðeÞÞ and log(1=e) values (Figure 6).Unlike Ra and Rt, the fractal dimensions of the sanded substratesare independent of grit size and are distinctly lower than that of thegrit-blasted substrate. The ‘‘grit-blasted þFPL’’ substrate has thehighest fractal dimension among all the substrates investigated.
It should be noted here that the fractal dimension of the polishedand FPL-etched substrates could not be evaluated reliably with opticalprofilometry because of the limitations of the instrument. On the onehand, the optical profilometry only highlights the roughness featuresat the micron scale because of the limitation on lateral resolution. Themicrorough structures at the nanoscale were not captured by theinstrument. Indeed, the surface morphologies of the polished andFPL-etched substrates were not distinguished by the optical profilo-metry (Figures 7A1, 7A2). Both substrates exhibit extremely randomstructures at the micron scale under the profilometer, even thoughthe FPL-etched substrate is a well-known microrough surface thatconsists of a network of shallow pores and protrusions or whiskers[27] (Figure 7C2, these structures can also be seen on the ‘‘grit-blastedþ FPL’’ substrate in Figure 7C4). On the other hand, the optical profi-lometer conducts an indirect altitude measurement, which consists indetecting the distance changes using an optical sensor. The sensitivityof the sensor depends on the roughness level of the substrate. As aconsequence, an unreasonably high sensitivity was used for thepolished and FPL-etched substrates because the micron-scale rough-ness features on these surfaces have dimensions comparable withthe lateral resolution of the instrument (1.8 mm). For this reason, the
Surface Morphology and Crack Growth 499
fractal dimensions obtained for polished and FPL-etched surfaces arenot comparable with those of the macrorough surfaces, on which thesensitivity used was much lower.
3.1.2. Spreading KineticsSpreading kinetics of a wetting liquid on a solid substrate may
provide direct information about surface topography that would beuseful for interpreting adhesion kinetics. Different kinetic regimeshave already been identified in previous studies [40,48]. For example,a small liquid drop spreads on a perfectly smooth surface, in whichthe radius (r) of the drop increases with time (t) according to the fol-lowing power law: r � t0.1. As the roughness of the surface increases,the power law exponent increases. Thus, for a very rough surface,the power law may be expressed as r � t0.25. For a fully rough surfacewhere the spreading exponent of 0.25 is observed, the pre-exponentialfactor further increases with the ratio of the actual surface area to its
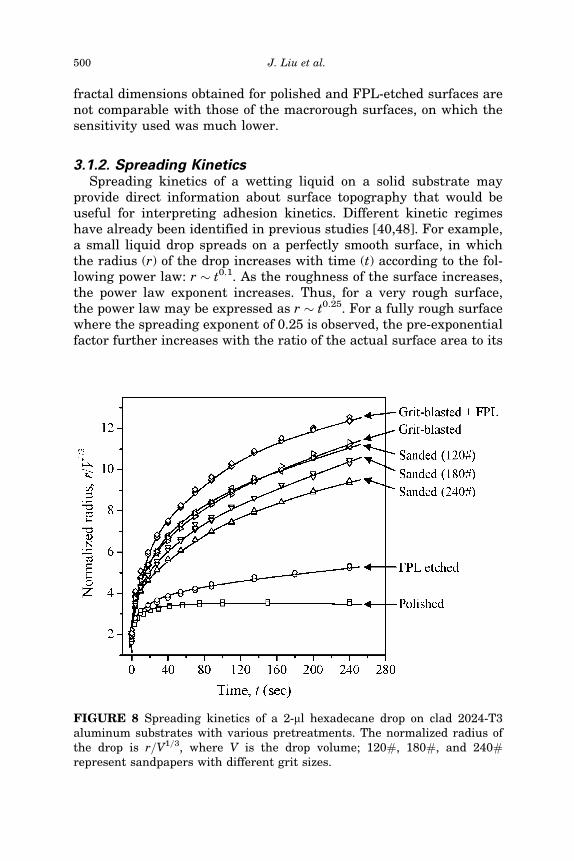
FIGURE 8 Spreading kinetics of a 2-ml hexadecane drop on clad 2024-T3aluminum substrates with various pretreatments. The normalized radius ofthe drop is r=V1=3, where V is the drop volume; 120#, 180#, and 240#represent sandpapers with different grit sizes.
500 J. Liu et al.
geometric projection. Thus, from both the power law exponent and thepre-exponential factor, the surface roughness can be assessed.
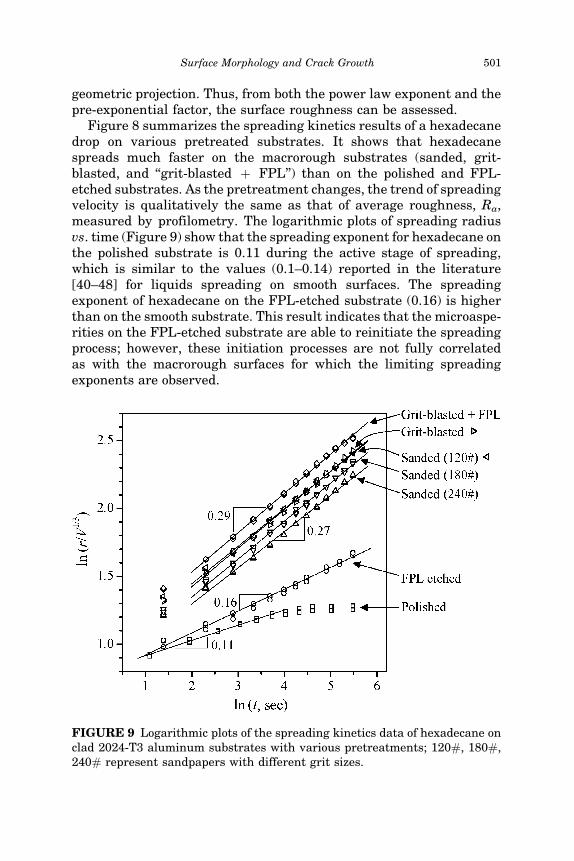
Figure 8 summarizes the spreading kinetics results of a hexadecanedrop on various pretreated substrates. It shows that hexadecanespreads much faster on the macrorough substrates (sanded, grit-blasted, and ‘‘grit-blasted þ FPL’’) than on the polished and FPL-etched substrates. As the pretreatment changes, the trend of spreadingvelocity is qualitatively the same as that of average roughness, Ra,measured by profilometry. The logarithmic plots of spreading radiusvs. time (Figure 9) show that the spreading exponent for hexadecane onthe polished substrate is 0.11 during the active stage of spreading,which is similar to the values (0.1–0.14) reported in the literature[40–48] for liquids spreading on smooth surfaces. The spreadingexponent of hexadecane on the FPL-etched substrate (0.16) is higherthan on the smooth substrate. This result indicates that the microaspe-rities on the FPL-etched substrate are able to reinitiate the spreadingprocess; however, these initiation processes are not fully correlatedas with the macrorough surfaces for which the limiting spreadingexponents are observed.
FIGURE 9 Logarithmic plots of the spreading kinetics data of hexadecane onclad 2024-T3 aluminum substrates with various pretreatments; 120#, 180#,240# represent sandpapers with different grit sizes.
Surface Morphology and Crack Growth 501
For all the macrorough substrates (sanded, grit-blasted, and ‘‘grit-blasted þ FPL’’), the observed exponents during the active stage ofspreading range from 0.27 to 0.29, which is close to 0.25 expected ofmacrorough surfaces [48]. Although the spreading exponents essen-tially do not change for different macrorough surfaces, the surfaceroughness is distinguished by the different intercepts of the logarith-mic plot. For example, the intercept increases with the grit size of thesandpaper for the sanded substrates, which implies that the surfaceroughness increases with the grit size because a higher interceptmeans a higher ratio of the actual surface area to its geometric projec-tion [48]. In addition, the ‘‘grit-blastedþFPL’’ surface shows the high-est intercept, and thus the highest surface roughness, among all thepretreated surfaces. Those results agree with the optical profilometrymeasurements.
To summarize, the spreading kinetics results provide a supplemen-tary view of the surface morphology of the substrates after variouspretreatments. A fairly good correlation between the spreadingkinetics and optical profilometry measurements further validatesthe surface profile data.
3.2. Crack Growth in Humid Environment
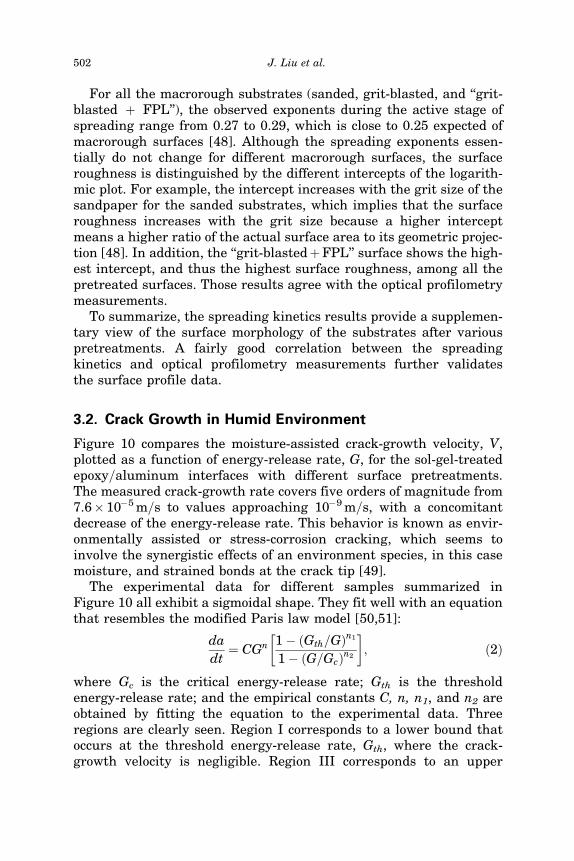
Figure 10 compares the moisture-assisted crack-growth velocity, V,plotted as a function of energy-release rate, G, for the sol-gel-treatedepoxy=aluminum interfaces with different surface pretreatments.The measured crack-growth rate covers five orders of magnitude from7.6� 10�5 m=s to values approaching 10�9 m=s, with a concomitantdecrease of the energy-release rate. This behavior is known as envir-onmentally assisted or stress-corrosion cracking, which seems toinvolve the synergistic effects of an environment species, in this casemoisture, and strained bonds at the crack tip [49].
The experimental data for different samples summarized inFigure 10 all exhibit a sigmoidal shape. They fit well with an equationthat resembles the modified Paris law model [50,51]:
da
dt¼ CGn 1� Gth=Gð Þn1
1� G=Gcð Þn2
� �; ð2Þ
where Gc is the critical energy-release rate; Gth is the thresholdenergy-release rate; and the empirical constants C, n, n1, and n2 areobtained by fitting the equation to the experimental data. Threeregions are clearly seen. Region I corresponds to a lower bound thatoccurs at the threshold energy-release rate, Gth, where the crack-growth velocity is negligible. Region III corresponds to an upper
502 J. Liu et al.
bound, Gc, which signifies the critical energy-release rate. Region IIrepresents the linear region between regions I and III, where signifi-cant subcritical crack growth occurs. The exponent n is given by theslope of the linear region. Ritter [52] pointed out that n is a measureof the sensitivity of crack growth to the applied G; a higher n signifiesa greater resistance to ‘‘stress-corrosion’’ crack growth. The curvatureof the threshold ‘‘Region I’’ and the fast-fracture ‘‘Region III’’ aredetermined by n1 and n2 respectively.
The values of the parameters obtained from curve fitting usingEquation (2) from Figure 10 are summarized in Table 3. An interestingobservation for the sol-gel-treated epoxy=aluminum joints is that thetrends on Gc and Gth are different as pretreatment changes. Amongthe four single pretreatments (polished, sanded, grit-blasted, andFPL etched), the grit-blasted substrate has the highest Gc, whereasthe highest Gth is obtained on the FPL-etched substrate. A combination
FIGURE 10 Crack growth velocity (26�C, 98% RH) as a function of energy-release rate for the sol-gel-treated aluminum=epoxy joints prepared withvarious surface pretreatments. The symbols represent the experimental dataand the solid curves are the fitting results with a modified Paris law as givenby Equation (2). Square: polished; circle: sanded with 120-grit sandpaper; dia-mond: grit-blasted; up triangle: FPL etched; down triangle: grit-blastedþFPL.
Surface Morphology and Crack Growth 503
of grit-blasting and FPL etching results in Gc and Gth values both sig-nificantly higher than all other pretreatments. The kinetics of thecrack growth shows several intriguing features. In the linear regionII, the value of the exponent n seems to be insensitive to pretreatmentmethod. The coefficient C corresponding to the linear region II variessignificantly as pretreatments changes, covering several orders of mag-nitude. In addition, the curve-fitting constant n1 of region I appears tobe insensitive to the pretreatment, whereas the curve-fitting constantn2 corresponding to the fast-fracture region III varies considerably.
Unlike with the bulk glass-like materials [53–57] where crack-tipplasticity does not occur, the detailed kinetics of environmentallyassisted crack growth along polymer=metal interfaces is poorly under-stood because of the complexity at the crack tip. The current systemincludes a toughened epoxy, which involves nonlinear energy dissi-pation processes such as cavitation and shear yielding [58]. Themacrorough substrates lead to the inhomogeneous interfacial stressdistribution [2] and crack-surface contact [59]. In addition, crack-tipblunting may also take place because of the plasticity on the epoxy sidefor the strong interfaces; thus the situation becomes further compli-cated. Therefore, a theoretical prediction of the relation between crackvelocity and energy-release rate seems to be too uncertain at thispoint. Nevertheless, the observed strong dependence of the energy-release rate on crack-growth velocity reveals that certain chemicalreactions involving water at the crack tip must be responsible forthe degradation of the epoxy=aluminum joints; presumably these reac-tions may be assisted by the stress acting at the crack tip.
3.3. Analysis of Locus of Failure
3.3.1. Crack-Tip RegionVisual inspection of the fracture surfaces on the aluminum side at
the crack-tip region suggests that the failure is interfacial for all
TABLE 3 Values of the Parameters Obtained from Curve Fitting usingEquation (2) based on Figure 10 Data
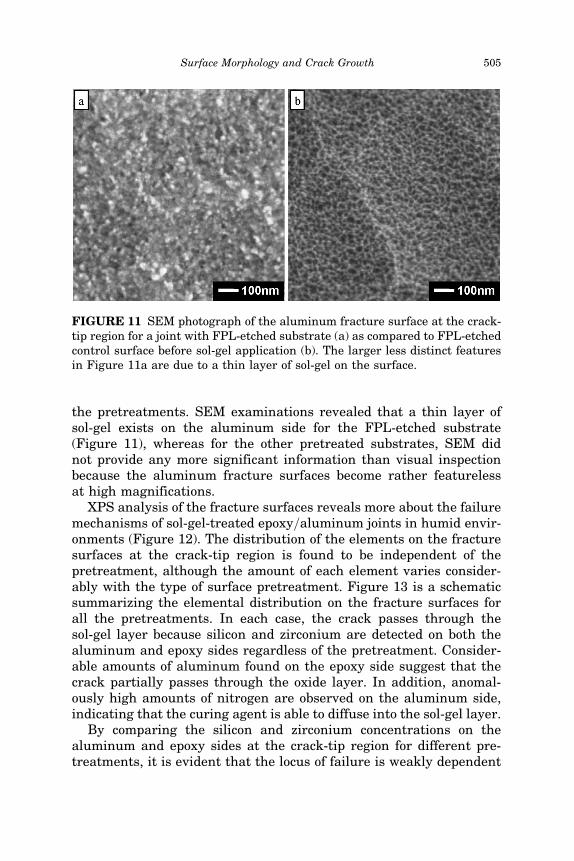
the pretreatments. SEM examinations revealed that a thin layer ofsol-gel exists on the aluminum side for the FPL-etched substrate(Figure 11), whereas for the other pretreated substrates, SEM didnot provide any more significant information than visual inspectionbecause the aluminum fracture surfaces become rather featurelessat high magnifications.
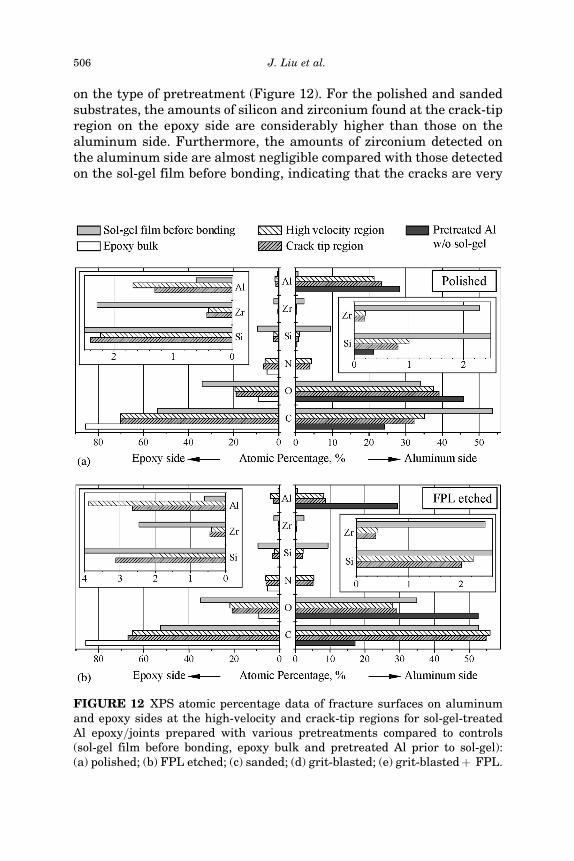
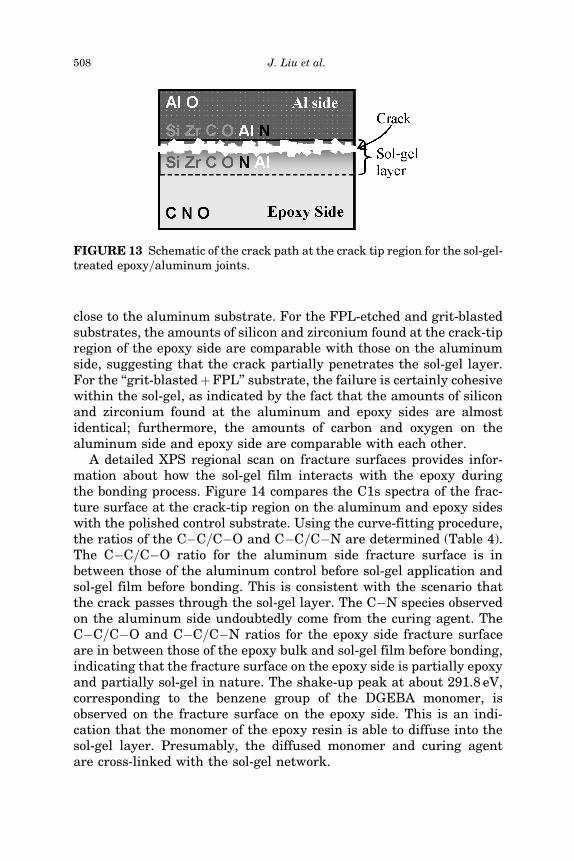
XPS analysis of the fracture surfaces reveals more about the failuremechanisms of sol-gel-treated epoxy=aluminum joints in humid envir-onments (Figure 12). The distribution of the elements on the fracturesurfaces at the crack-tip region is found to be independent of thepretreatment, although the amount of each element varies consider-ably with the type of surface pretreatment. Figure 13 is a schematicsummarizing the elemental distribution on the fracture surfaces forall the pretreatments. In each case, the crack passes through thesol-gel layer because silicon and zirconium are detected on both thealuminum and epoxy sides regardless of the pretreatment. Consider-able amounts of aluminum found on the epoxy side suggest that thecrack partially passes through the oxide layer. In addition, anomal-ously high amounts of nitrogen are observed on the aluminum side,indicating that the curing agent is able to diffuse into the sol-gel layer.
By comparing the silicon and zirconium concentrations on thealuminum and epoxy sides at the crack-tip region for different pre-treatments, it is evident that the locus of failure is weakly dependent
FIGURE 11 SEM photograph of the aluminum fracture surface at the crack-tip region for a joint with FPL-etched substrate (a) as compared to FPL-etchedcontrol surface before sol-gel application (b). The larger less distinct featuresin Figure 11a are due to a thin layer of sol-gel on the surface.
Surface Morphology and Crack Growth 505
on the type of pretreatment (Figure 12). For the polished and sandedsubstrates, the amounts of silicon and zirconium found at the crack-tipregion on the epoxy side are considerably higher than those on thealuminum side. Furthermore, the amounts of zirconium detected onthe aluminum side are almost negligible compared with those detectedon the sol-gel film before bonding, indicating that the cracks are very
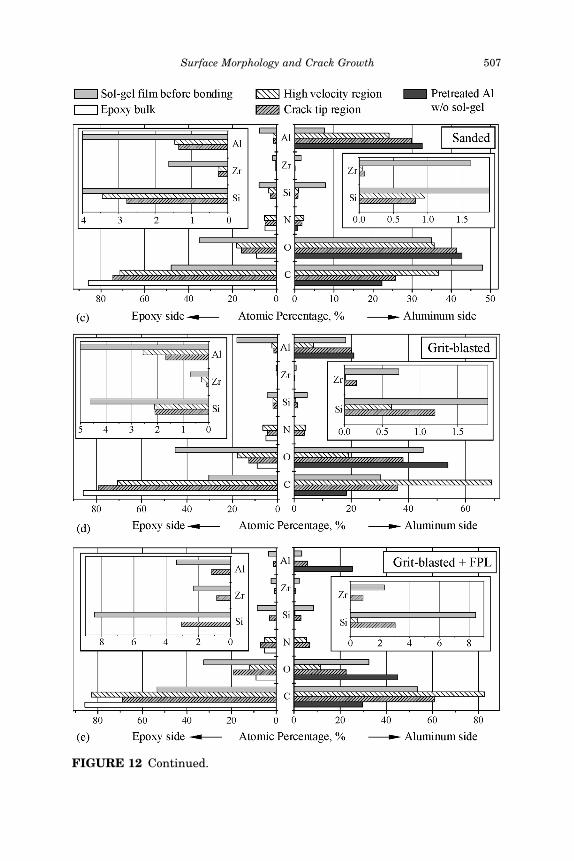
FIGURE 12 XPS atomic percentage data of fracture surfaces on aluminumand epoxy sides at the high-velocity and crack-tip regions for sol-gel-treatedAl epoxy=joints prepared with various pretreatments compared to controls(sol-gel film before bonding, epoxy bulk and pretreated Al prior to sol-gel):(a) polished; (b) FPL etched; (c) sanded; (d) grit-blasted; (e) grit-blastedþ FPL.
506 J. Liu et al.
FIGURE 12 Continued.
Surface Morphology and Crack Growth 507
close to the aluminum substrate. For the FPL-etched and grit-blastedsubstrates, the amounts of silicon and zirconium found at the crack-tipregion of the epoxy side are comparable with those on the aluminumside, suggesting that the crack partially penetrates the sol-gel layer.For the ‘‘grit-blastedþFPL’’ substrate, the failure is certainly cohesivewithin the sol-gel, as indicated by the fact that the amounts of siliconand zirconium found at the aluminum and epoxy sides are almostidentical; furthermore, the amounts of carbon and oxygen on thealuminum side and epoxy side are comparable with each other.
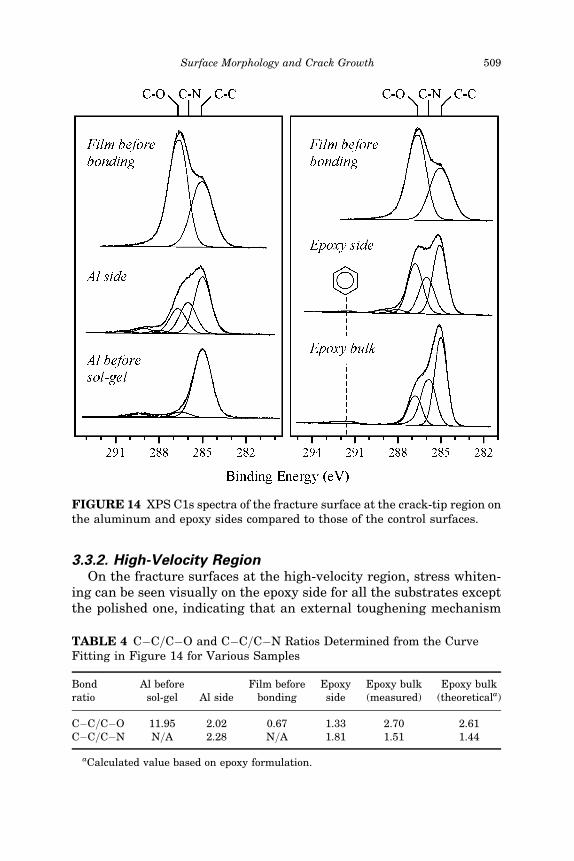
A detailed XPS regional scan on fracture surfaces provides infor-mation about how the sol-gel film interacts with the epoxy duringthe bonding process. Figure 14 compares the C1s spectra of the frac-ture surface at the crack-tip region on the aluminum and epoxy sideswith the polished control substrate. Using the curve-fitting procedure,the ratios of the C�C=C�O and C�C=C�N are determined (Table 4).The C�C=C�O ratio for the aluminum side fracture surface is inbetween those of the aluminum control before sol-gel application andsol-gel film before bonding. This is consistent with the scenario thatthe crack passes through the sol-gel layer. The C�N species observedon the aluminum side undoubtedly come from the curing agent. TheC�C=C�O and C�C=C�N ratios for the epoxy side fracture surfaceare in between those of the epoxy bulk and sol-gel film before bonding,indicating that the fracture surface on the epoxy side is partially epoxyand partially sol-gel in nature. The shake-up peak at about 291.8 eV,corresponding to the benzene group of the DGEBA monomer, isobserved on the fracture surface on the epoxy side. This is an indi-cation that the monomer of the epoxy resin is able to diffuse into thesol-gel layer. Presumably, the diffused monomer and curing agentare cross-linked with the sol-gel network.
FIGURE 13 Schematic of the crack path at the crack tip region for the sol-gel-treated epoxy=aluminum joints.
508 J. Liu et al.
3.3.2. High-Velocity RegionOn the fracture surfaces at the high-velocity region, stress whiten-
ing can be seen visually on the epoxy side for all the substrates exceptthe polished one, indicating that an external toughening mechanism
TABLE 4 C�C=C�O and C�C=C�N Ratios Determined from the CurveFitting in Figure 14 for Various Samples
FIGURE 14 XPS C1s spectra of the fracture surface at the crack-tip region onthe aluminum and epoxy sides compared to those of the control surfaces.
Surface Morphology and Crack Growth 509
such as cavitation took place during the fracture process. The whiten-ing fades away gradually in the direction of crack growth, in otherwords, as the energy-release rate decreases. Table 5 summarizes theresults of visual inspection of the fracture surfaces at the high-velocityregion and the corresponding energy-release rates for different pre-treatments. It can be seen that there is a critical point with energy-release rate greater than 400 J=m2, below which the stress whiteningdoes not occur.
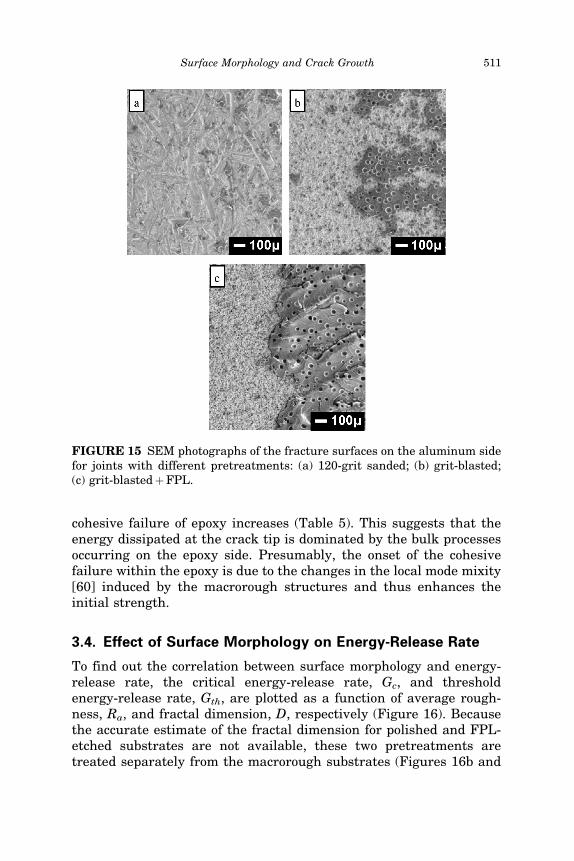
Visual inspection of the aluminum side at the high-velocity regionsuggested that fractured epoxy is left on several pretreated substrates.This observation was confirmed by SEM for the sanded, grit-blasted,and ‘‘grit-blastedþFPL’’ substrates (Figure 15). For these substrates,the elemental distribution on fracture surfaces at the high-velocityregion is very similar to that at the crack-tip region (Figures 12, 13), indi-cating that cracks at the visually interfacial areas pass through thesol-gel layer. For polished and FPL-etched substrates, no epoxy is seenwith SEM on the aluminum side in the high-velocity region. For thesetwo substrates, the XPS elemental percentage data show little variancefor the high-velocity and crack-tip regions (Figures 12a and 12b).
An intriguing observation regarding the locus of failure in the high-velocity region is that the amount of cohesive failure of epoxy changessignificantly as the pretreatment changes, from 0% on polished andFPL-etched substrates to 100% on the ‘‘grit-blasted þ FPL’’ substrate(Table 5, Figure 15). This indicates that there is a critical length scalefor the size of the roughness features on the substrates below whichthe cohesive failure of epoxy does not occur. In other words, the macro-rough structures on the substrate are essential to drive the fracture towithin the epoxy for the sol-gel-reinforced joints. It should be notedthat the energy-release rate increases significantly as the amount of
TABLE 5 Energy-Release Rate and Visual Inspection Results of the FractureSurfaces at the High-Velocity Region (V ¼ 7.6� 10�5 m=s) for Joints withDifferent Surface Preparation Methods
Note: Data were obtained on one sample for each surface preparation.
510 J. Liu et al.
cohesive failure of epoxy increases (Table 5). This suggests that theenergy dissipated at the crack tip is dominated by the bulk processesoccurring on the epoxy side. Presumably, the onset of the cohesivefailure within the epoxy is due to the changes in the local mode mixity[60] induced by the macrorough structures and thus enhances theinitial strength.
3.4. Effect of Surface Morphology on Energy-Release Rate
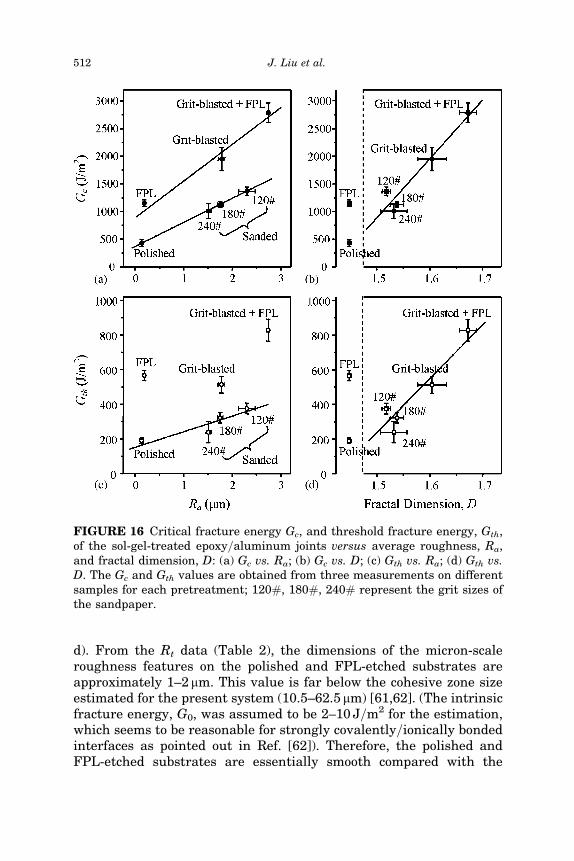
To find out the correlation between surface morphology and energy-release rate, the critical energy-release rate, Gc, and thresholdenergy-release rate, Gth, are plotted as a function of average rough-ness, Ra, and fractal dimension, D, respectively (Figure 16). Becausethe accurate estimate of the fractal dimension for polished and FPL-etched substrates are not available, these two pretreatments aretreated separately from the macrorough substrates (Figures 16b and
FIGURE 15 SEM photographs of the fracture surfaces on the aluminum sidefor joints with different pretreatments: (a) 120-grit sanded; (b) grit-blasted;(c) grit-blastedþFPL.
Surface Morphology and Crack Growth 511
d). From the Rt data (Table 2), the dimensions of the micron-scaleroughness features on the polished and FPL-etched substrates areapproximately 1–2 mm. This value is far below the cohesive zone sizeestimated for the present system (10.5–62.5mm) [61,62]. (The intrinsicfracture energy, G0, was assumed to be 2–10 J=m2 for the estimation,which seems to be reasonable for strongly covalently=ionically bondedinterfaces as pointed out in Ref. [62]). Therefore, the polished andFPL-etched substrates are essentially smooth compared with the
FIGURE 16 Critical fracture energy Gc, and threshold fracture energy, Gth,of the sol-gel-treated epoxy=aluminum joints versus average roughness, Ra,and fractal dimension, D: (a) Gc vs. Ra; (b) Gc vs. D; (c) Gth vs. Ra; (d) Gth vs.D. The Gc and Gth values are obtained from three measurements on differentsamples for each pretreatment; 120#, 180#, 240# represent the grit sizes ofthe sandpaper.
512 J. Liu et al.
macrorough substrates. For this reason, the Gc or Gth values forpolished and FPL-etched substrates are plotted to the left of all themacrorough substrates in Figures 16b and 16d.
A good correlation (Figure 16a) can be found between the Gc and Ra
for the substrates pretreated with abrasion techniques (polishing andsanding), showing that the Gc increases with Ra. A separate trend linecan be drawn for the rest of the pretreatments. A correlation cannot beunified for all the pretreatments, possibly because of the differences ofsurface topography created by different pretreatments, which are notcharacterized by the traditional roughness parameters such as Ra. Itmust also be pointed out that although the surface chemistry varieswith pretreatment, its role was not considered in the present study.
Although no unifying correlation between Gc and Ra has beenfound, a much better correlation is seen when Gc is plotted againstthe fractal dimension of all the macrorough substrates (Figure 16b).The existence of this correlation, however, is not easily understood,as the loci of failure at the high-velocity region are partially or totallywithin the bulk of epoxy. Nevertheless, the fact that the amount ofcohesive failure within the epoxy depends on the macroroughness sug-gests that further studies should be directed toward understandinghow the surface roughness affects the local stress field as well as themode mixity.
As far as the threshold energy-release rate is concerned, although alimited correlation between Gth and Ra is observed for the abradedsurfaces (Figure 16c), the correlation is not general for other surfaces.This lack of correlation is understandable because the Gth is signifi-cantly lower than the Gc and the locus of failure for the thresholdregion is closer to the aluminum substrates compared with the fastfracture region. On the other hand, the Gth correlates with the fractaldimension rather well (Figure 16d). This correlation is somewhatexpected as the locus of failure at the threshold region follows the con-tour of the substrates; in other words, no cohesive failure within epoxywas observed, and the fracture surface on the aluminum side isvisually identical to the substrate before bonding.
It is worth pointing out here that although the polished andFPL-etched substrates are both macroscopically flat, the energy-release rate on the FPL-etched substrate is significantly higher thanthat of the polished substrate. The Gc for FPL etched substrate is com-parable with the macrorough sanded substrates, whereas its Gth valueis even higher than that of the grit-blasted substrate. This is due to theinterlocking effect induced by the nanoscale pores, which are onlyobserved on the FPL-etched surfaces (Figure 7). The fracture surfaceon the aluminum side for FPL-etched substrates shows that part
Surface Morphology and Crack Growth 513
of the sol-gel film is trapped in the pores, suggesting that the crackdoes not exactly follow the contour of the substrate (Figure 11). Theenergy-release rate is thus enhanced by pinning of the crack. Thecrack-pinning effect has been demonstrated by Chung and Chaudhury[63] on a thin confined adhesive pad with designed discontinuity.Interestingly, a similar effect becomes more pronounced as the crackvelocity decreases, indicating that the nanoscale structures on thesubstrate are more important than the macroroughness in enhancingthe durability of the joints.
4. CONCLUSIONS
Using an ADCB wedge test, the moisture-assisted crack-growthkinetics of a sol-gel-reinforced epoxy=aluminum interface was studied.The fracture mechanics approach provides an effective way of study-ing the effect of surface pretreatment on adhesion. It is found thatthe surface morphology and topography affect the crack-growthkinetics significantly. The macrorough structures were found to beessential to drive the crack to within the epoxy and thus enhancethe initial strength of the sol-gel-reinforced interface. However, themicroroughness of the substrate is more important than the macro-roughness in enhancing the durability. Lastly, both the criticalenergy-release rate and threshold energy-release rate correlate withthe fractal dimension for sol-gel-reinforced joints with macroroughsubstrates.
ACKNOWLEDGMENTS
Financial support for this work, provided by the Boeing Company andthe Polymer Interface Center at Lehigh University, is gratefullyacknowledged. We also thank R. A. Pearson of Lehigh University forhelpful discussions, A. C. Miller of Lehigh University for his assis-tances in XPS studies, and Jacob Grob of the Boeing Company forhelpful discussions and training on processes.
REFERENCES
[1] Kinloch, A. J., in Adhesion Science and Engineering 1, The Mechanics of Adhesion,D. A. Dillard and A. V. Pocius (Eds.) (Elsevier Science, Amsterdam, The Nether-lands, 2002), pp. 661–698.
[2] Kinloch, A. J., Adhesion and Adhesives: Science and Technology (Chapman andHall, London, UK, 1987).
[3] Kinloch, A. J., in Polymer Surfaces and Interfaces, W. J. Feast and H. S. Munro(Eds.) (John Wiley & Sons, Ltd., New York, 1987), pp. 75–97.
514 J. Liu et al.
[4] Davis, G. D. and Venables, J. D., in Adhesion Science and Engineering 2, Surface,Chemistry and Applications, M. K. Chaudhury and A. V. Pocius (Eds.) (ElsevierScience, Amsterdam, The Netherlands, 2002), pp. 947–1008.
[5] Plueddemann, E. P., Silane Coupling Agents 2nd ed. (Plenum Press, New York,1991).
[6] Mittal, K. L. Ed., Silane and Other Coupling Agents, (VSP, Leiden, The Nether-lands, 1992), Vol. 1.
[7] Mittal, K. L., Ed., Silane and Other Coupling Agents, (VSP, Leiden, The Nether-lands, 2000), Vol. 2.
[8] Mittal, K. L., Ed., Silane and Other Coupling Agents, (VSP, Leiden, The Nether-lands, 2004), Vol. 3.
[9] Owen, M. J., in Adhesion Science and Engineering 2, Surface, Chemistry and Appli-cations, M. K. Chaudhury and A. V. Pocius (Eds.) (Elsevier Science, Amsterdam,The Netherlands, 2002), pp. 403–431.
[10] Abel, M.-L., Watts, J. F., and Digby, R. P., J. Adhes. 80, 291–312 (2004).[11] Blohowiak, K. Y., Osborne, J. H., and Krienke, K. A., US Patents 05 814 137 (1998),
[12] Osborne, J. H., Blohowiak, K. Y., Taylor, S. R., Hunter, C., Bierwagon, G., Carlson,B., Bernard, D., and Donley, M. S., Prog. Org. Coatings 41, 217–225 (2001).
[13] Blohowiak, K. Y., Krienke, K. A., Osborne, J. H., Mazza, J. J., Gaskin, G. B.,Arnold, J. R., DePiero, W. S., and Brescia, J., The Second Joint NASA=FAA=DoDConference on Aging Aircraft (Williamsburg, VA, 1998), pp. 313–320.
[14] Blohowiak, K. Y., Osborne, J. H., Krienke K. A., and Sekits, D. F., 28th Inter-national SAMPE Symposium (Seattle, WA, 1996), pp. 440–446.
[15] Blohowiak, K. Y., Cadwell-Stancin, L., Anderson, R. A., Mazzitelli, C. M., Preedy,K., Grob, J. W., and Glidden, M., 47th International SAMPE Symposium (LongBeach, CA, 2002), pp. 279–292.
[16] Greegor, R. B., Blohowiak, K. Y., Osborne, J. H., Krienke, K. A., and Cherian, J. T.,J. Sol-gel Sci. Technol. 20, 35–50 (2001).
[17] McCray, D. B. and Mazza, J. J., 45th International SAMPE Symposium (LongBeach, CA, 2000), pp. 42–56.
[18] Huber, K. E., McCray, D. B., and Srinivasan, R., Proc. Processing and Fabricationof Advanced Materials IX (St. Louis, MO, 2001), pp. 53–62.
[19] Brown, H. R., Macromolecules 22, 2859–2860 (1989).[20] Creton, C., Kramer, E. J., Hui, C.-Y., and Brown, H. R., Macromolecules 25, 3075–
3088 (1992).[21] Xiao, F., Hui, C.-Y., Washiyama, J., and Kramer, E. J., Macromolecules 27, 4382–
4390 (1994).[22] Bernard, B., Brown, H. R., Hawker, C. J., Kellock, A. J., and Russell, T. P., Macro-
molecules 32, 6254–6260 (1999).[23] Creton, C., Kramer, E. J., Brown, H. R., and Hui, C.-Y., Advances in Polymer
Science 156, 53–136 (2001).[24] Liu, J., Chaudhury, M. K., Berry, D. H., Seebergh, J. E., Osborne, J. H., and Bloho-
wiak, K. Y., J. Adhes. Sci. Technol., 20, 277–305 (2006).[25] Bagheri, R. and Pearson, R. A., Polymer 37, 4529–4538 (1996).[26] Bagheri, R. and Pearson, R. A., Polymer 41, 269–276 (2000).[27] Venables, J. D., J. Mater. Sci. 19, 2433–2453 (1984).[28] Kanninen, M. F., Int. J. Fracture 9, 83–92 (1973).[29] Xiao, F., Hui, C.-Y., and Kramer, E. J., J. Mater. Sci. 28, 5620–5629 (1993).[30] Zhang, S., Panat, R., and Hsia, K. J., J. Adhes. Sci. Technol. 17, 1685–1711 (2003).
Surface Morphology and Crack Growth 515
[31] Mountains Map Software Manual, Micro Photonics Inc., Irvine, CA (2005).[32] ISO 4287, Geometrical Product Specifications (GPS)—Surface Texture: Profile
Method—Terms, Definitions and Surface Texture Parameters, InternationalOrganization for Standardization, Geneva, Switzerland (1997).
[33] Mandelbrot, B. B., The Fractal Geometry of Nature (Freeman, San Francisco, CA,1982).
[34] Russ, J. C., Fractal Surfaces (Plenum Press, New York, 1994), pp. 227–265.[35] Sapoval, B., in Fractals and Disordered Systems, A. Bunde and S. Havlin (Eds.)
(Springer-Verlag, Berlin, Germany, 1991), pp. 207–227.[36] Amada, S. and Yamada, H., Surf. Coat. Technol. 78, 50–55 (1996).[37] Amada, S. and Hirose, T., Surf. Coat. Technol. 102, 132–137 (1998).[38] Amada, S. and Satoh, A., J. Adhes. Sci. Technol. 14, 27–41 (2000).[39] Mannelqvist, A. and Groth, M. R., Appl. Phys. A 73, 347–355 (2001).[40] Lopez, J., Miller, C. A., and Ruckenstein, E., J. Colloid Interface Sci. 56, 460–468
(1976).[41] Bascom, W. D. and Singleterry, C. R., J. Colloid Interface Sci. 66, 559–572 (1978).[42] Tanner, L. H., J. Phys. D 12, 1473–1484 (1979).[43] Marmur, A., Adv. Colloids Interface Sci. 19, 75–102 (1983).[44] de Gennes, P. G., Rev. Modern Phys. 57, 827–863 (1985).[45] Cazabat, A. M. and Cohen Stuart, M. A., J. Phys. Chem. 90, 5845–5849 (1986).[46] Lin, C. M., Ybarra, R. M., and Neogi, R., Adv. Colloids Interface Sci. 67, 185–204
(1996).[47] Marmur, A., Colloids and Surfaces A: Physicochem. Eng. Aspects 250, 409–414
(2004).[48] Chaudhury, M. K. and Chaudhury, A., Soft matter 1, 431–435 (2005).[49] Krausz, A. S. and Krausz, K., Fracture Kinetics of Crack Growth (Kluwer Academic
Publishers, Dordrecht, The Netherlands, 1988).[50] Martin, R. H. and Murri, G. B., in Composite Materials: Testing and Design, S. P.
Garbo (Ed.) (ASTM, STP 1059, 1990), Vol. 9 pp. 251–270.[51] Kinloch, A. J. and Osiyemi, S. O., J. Adhes. 43, 79–90 (1993).[52] Ritter, J. E., Fox, J. R., Hutko, D. I., and Lardner, T. J., J. Mater. Sci. 33, 4581–
4588 (1998).[53] Wiederhorn, S. M., J. Am. Ceram. Soc. 50, 407–414 (1967).[54] Wiederhorn, S. M. and Bolz, L. H., J. Am. Ceram. Soc. 53, 543–548 (1970).[55] Lawn, B. R., J. Mater. Sci. 10, 469–480 (1975).[56] Wiederhorn, S. M., Freiman, S. W., Fuller, E. R., and Simmons, C. J., J. Mater. Sci.
17, 3460–3478 (1982).[57] Michalske, T. A. and Bunker, B. C., J. Am. Ceram. Soc. 76, 2613–2618 (1993).[58] Kinloch, A. J. and Young R. J., Fracture Behaviour of Polymers (Elsevier Science,
New York, 1983).[59] Evans, A. G. and Hutchinson, J. W., Acta Metall. 37, 909–916 (1989).[60] Hutchinson, J. W. and Suo, Z., Adv. Appl. Mech. 29, 63–191 (1991).[61] Tvergaard, V. and Hutchinson, J. W., J. Mech. Phys. Solids 41, 1119–1135 (1993).[62] Kook, S.-Y. and Dauskardt, R. H., J. Appl. Phys. 91, 1293–1303 (2002).[63] Chung, J. Y. and Chaudhury, M. K., Journal of the Royal Society Interface 2, 55–61