Page 1
School of Sustainable Development of Society and Technology
Master Thesis in International Marketing
Effect of the Chinese acquisition on the brand image
of Volvo Cars
June 1, 2011
Course: EFO 705
Authors: Uliana Zakladna (850526)
Maximilian Ehrl (821120)
Supervisor: Leif Linnskog
Examiner: Ole Liljefors
Page 2
Abstract
Title: The Effect of the Chinese Acquisition on the Brand Image of Volvo Cars
Authors: Uliana Zakladna - 850526, Maximilian Ehrl - 821120
Supervisor: Leif Linnskog
Examiner: Ole Liljefors
Institution: Mälardalen University Sweden, School of Sustainable Development of Society and Technology
Course: Master Thesis in International Marketing, 15 ECTS-points
Problem Statement: Volvo is one of the most visible and famous symbols of Swedish engineering industry. After the recent world economic crisis the Chinese-based Geely Holding Group became the new owner of Volvo Cars. The question is whether the acquisition affects the image of the brand, and if so what is the character of this effect. Thus, this thesis provides the insight in the situation and attempts to give the answer to this question. It identifies the tendencies and provides an example of what changes in the brand image of Volvo have already occurred and what can be expected.
Purpose: The purpose of this research is to identify, describe and analyze the effect that the acquisition by Geely Holding Group had on the brand image of Volvo.
Method: Within this research a survey was conducted. The issues of concern regarding the change of the Volvo brand image were identified through literature study and observations in the specialized automobile on-line discussion panels. Based on the collected information and theoretical background, a questionnaire was designed and placed in the Volvo discussion forums in three countries – USA, Germany, and Great Britain. The total of 172 responses were received. The obtained data was processed statistically and theoretically on the basis of the theoretical framework.
Results The obtained results demonstrate that the brand image has been affected by the acquisition, and the character of this effect varies depending on the aspect of the brand image. Such attributes of Volvo, as safety, quality, and design have been influenced positively, whereas the associations with environment and family are found to be affected in a negative way. The image of a typical Volvo owner has been blurred too.
Page 3
i
Table of Content
1. INTRODUCTION .............................................................................................................................. 1
1.1 Purpose of the study ................................................................................................................ 1
1.2 Research question .................................................................................................................... 1
1.3 Target Group ............................................................................................................................ 1
2. BACKGROUND ................................................................................................................................ 3
2.1 Recent Acquisitions in the Car Industry ..................................................................................... 3
2.2 Volvo ........................................................................................................................................ 3
2.3 Geely ........................................................................................................................................ 4
2.4 The New Way of Volvo ............................................................................................................. 5
2.5 Volvo Brand .............................................................................................................................. 5
3. LITERATURE REVIEW ...................................................................................................................... 8
3.1 Brand ....................................................................................................................................... 8
3.2 Importance of Brands ............................................................................................................... 9
3.3 Brand Image and Brand Associations .......................................................................................10
3.4 Brand Vulnerability ..................................................................................................................12
3.5 Country of Origin .....................................................................................................................13
4. CONCEPTUAL FRAMEWORK ..........................................................................................................15
4.1 Main Model .............................................................................................................................15
4.2 Sub-model (Brand Image by Keller)..........................................................................................16
5. METHODOLOGY ............................................................................................................................17
5.1 Categorizing the Research .......................................................................................................17
5.2 The Research Approach ...........................................................................................................17
5.3 Methods of Data Collection .....................................................................................................17
5.4 Data Sources ...........................................................................................................................18
5.4.1 Secondary Data ................................................................................................................19
5.4.2 Primary Data.....................................................................................................................19
6. EMPIRICAL RESULTS AND ANALYSIS...............................................................................................29
6.1 Product-related attributes .......................................................................................................29
6.2 Non-Product-Related Attributes ..............................................................................................33
6.2.1 Brand personality .............................................................................................................33
6.2.2 User Imaginary .................................................................................................................36
6.2.3 Usage Imaginary ...............................................................................................................37
Page 4
ii
6.2.4 Feelings and Experiences ..................................................................................................39
6.2.5 Price .................................................................................................................................41
6.3 Benefits ...................................................................................................................................43
6.3.1 Functional Benefits ...........................................................................................................43
6.3.2 Experiential Benefits .........................................................................................................46
6.3.3 Symbolic Benefits .............................................................................................................47
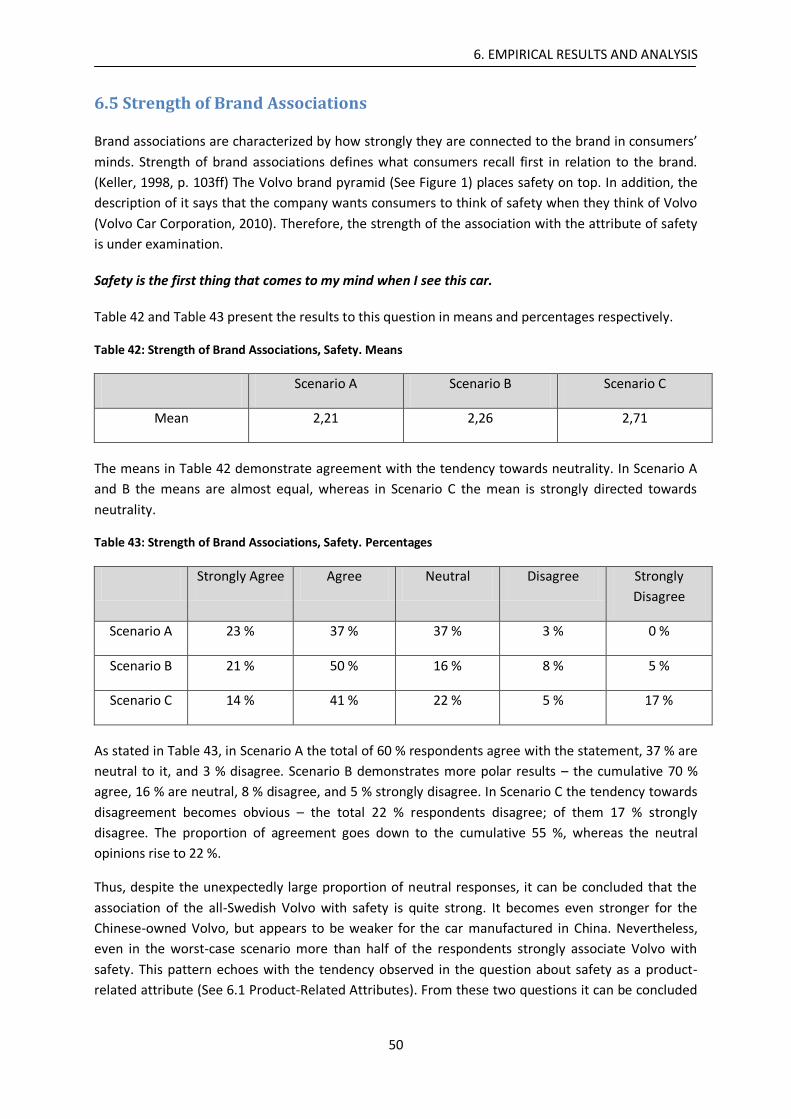
6.4 Attitude ...................................................................................................................................49
6.5 Strength of Brand Associations ................................................................................................50
6.6 Uniqueness of Brand Associations ...........................................................................................52
6.7 Favorability of Brand Associations ...........................................................................................53
7. CONCLUSION ................................................................................................................................55
REFERENCES .....................................................................................................................................57
Table of Figures
Figure 1: Brand pyramid of Volvo…………………………………………………………………………………………………..….6
Figure 2: Brand image structure……………………………………………………………………………………………………….11
Figure 3: Conceptual Framework…………………………………………………………………………………………………….15
List of Tables
Table 1: Number of responses per questionnaire per country ...........................................................26
Table 2: Product-related attributes, Safety. Means ...........................................................................29
Table 3: Product-related attributes, Safety. Percentages ...................................................................29
Table 4: Product-related attributes, Quality. Means ..........................................................................30
Table 5: Product-related attributes, Quality. Percentages .................................................................30
Table 6: Product-related attributes, Design. Means ...........................................................................31
Table 7: Product-related attributes, Design. Percentages ..................................................................31
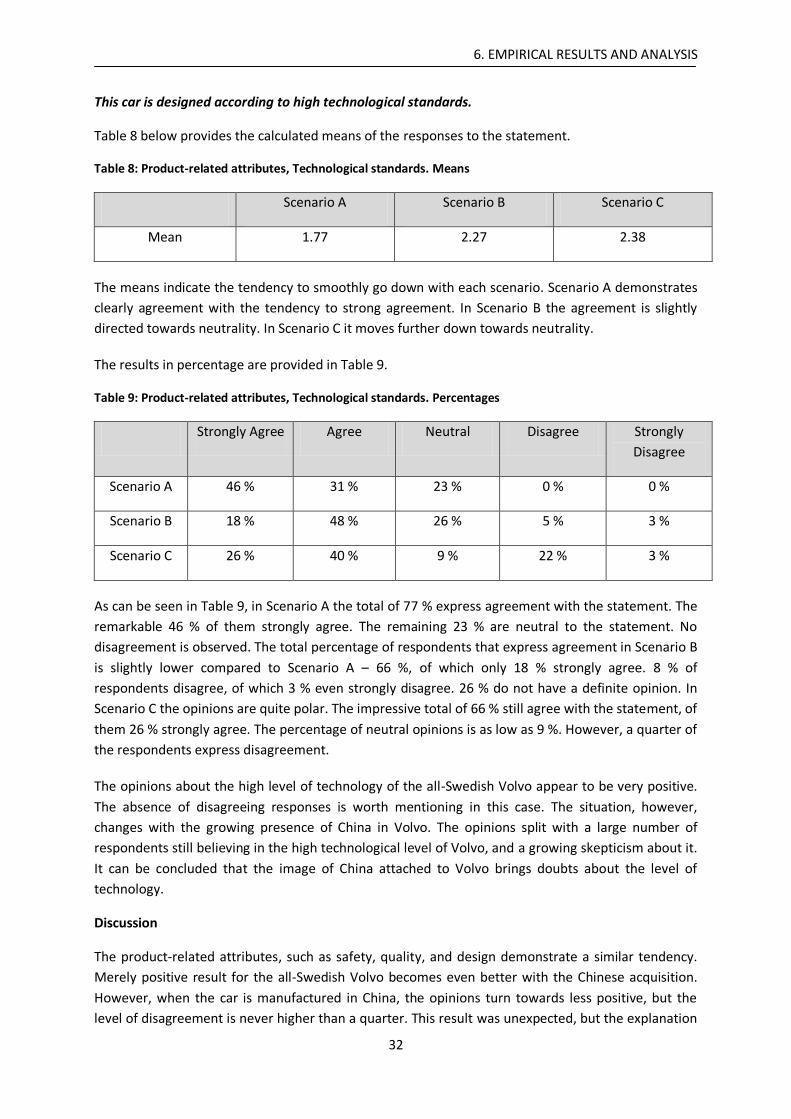
Table 8: Product-related attributes, Technological standards. Means ................................................32
Table 9: Product-related attributes, Technological standards. Percentages .......................................32
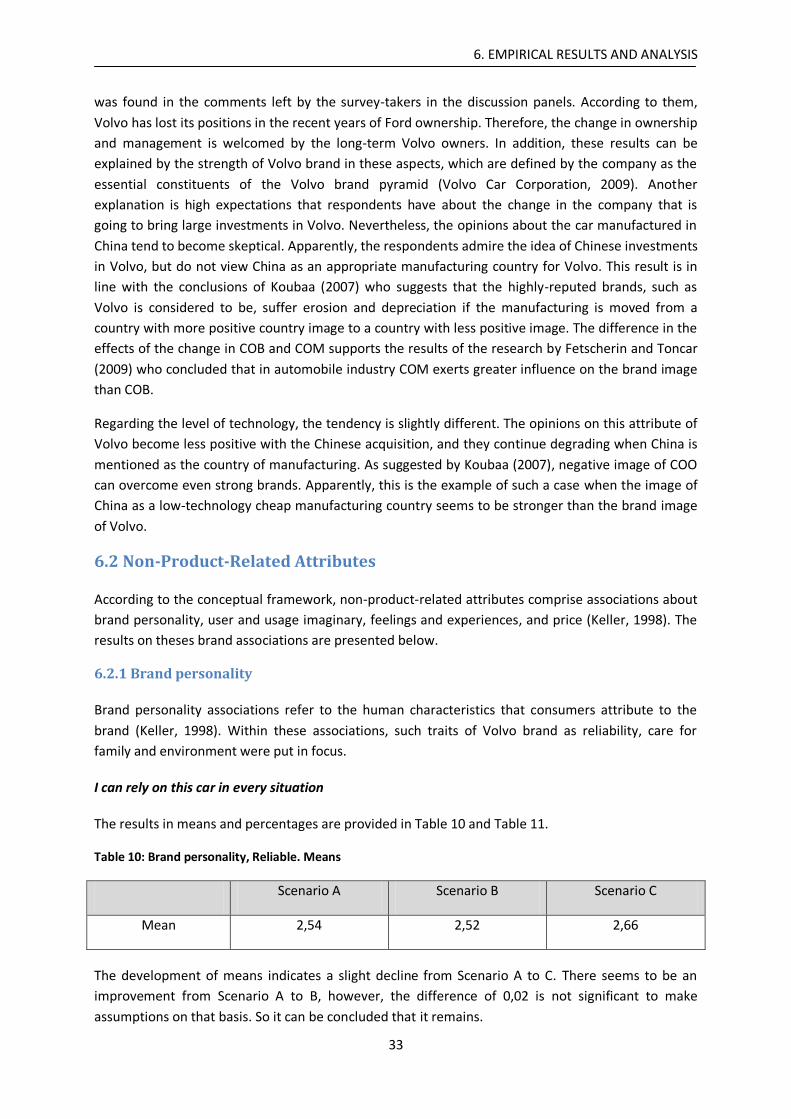
Table 10: Brand personality, Reliable. Means ....................................................................................33
Table 11: Brand personality, Reliable. Percentages ...........................................................................34
Page 5
iii
Table 12: Brand personality, Caring for family. Means .......................................................................34
Table 13: Brand personality, Caring for family. Percentages ..............................................................35
Table 14: Brand personality, Caring for environment. Means ............................................................35
Table 15: Brand personality, Caring for environment. Percentages ....................................................35
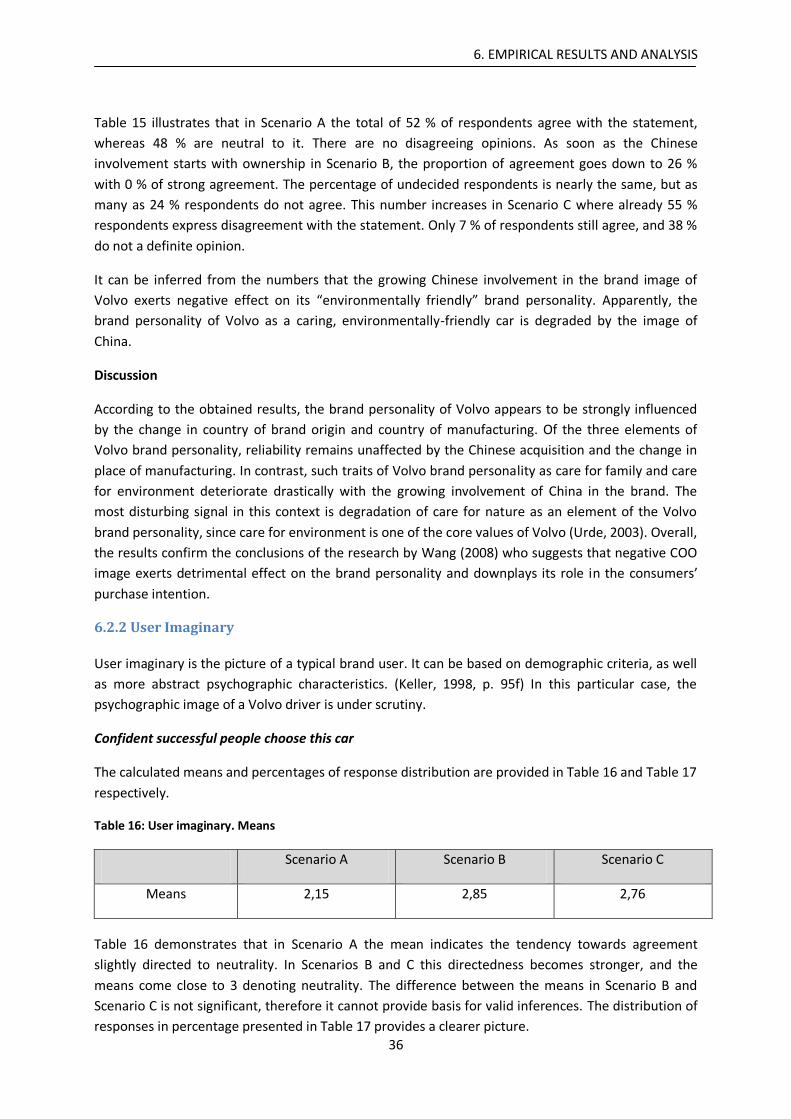
Table 16: User imaginary. Means ......................................................................................................36
Table 17: User imaginary. Percentages ..............................................................................................37
Table 18: Usage imaginary, Comfort. Means .....................................................................................37
Table 19: Usage imaginary, Comfort. Percentages .............................................................................38
Table 20: Usage imaginary, Harm to Environment. Means ................................................................38
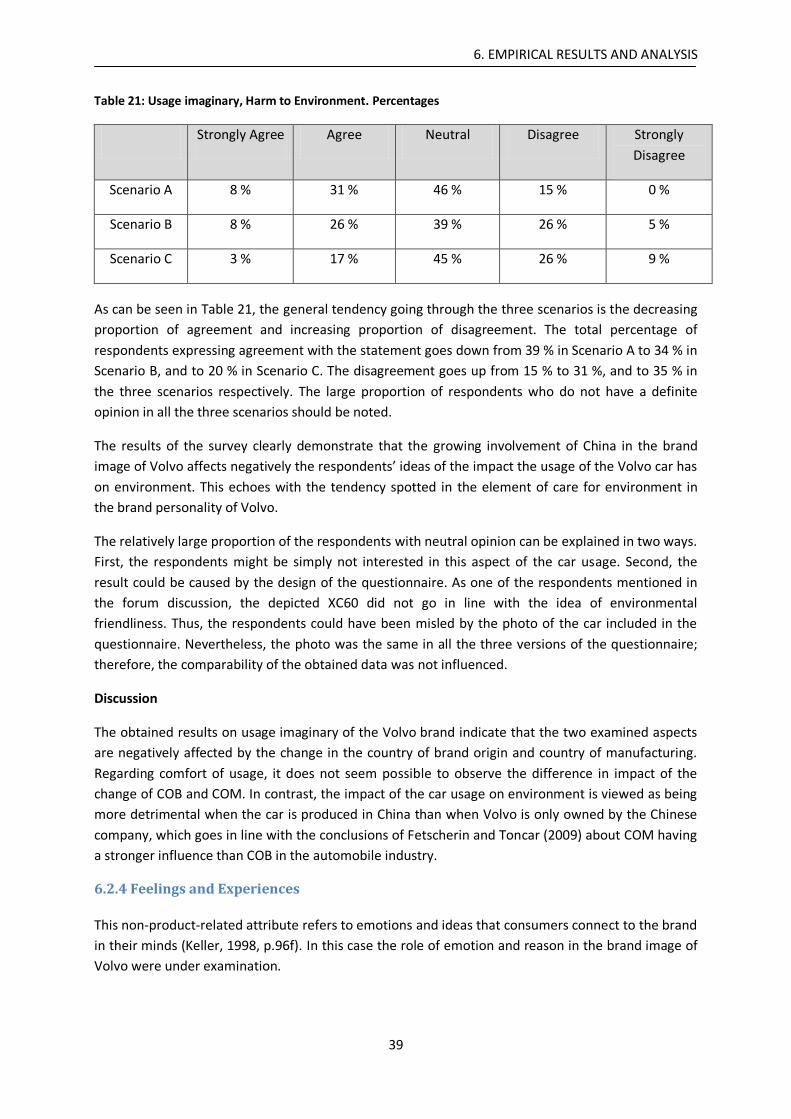
Table 21: Usage imaginary, Harm to Environment. Percentages ........................................................39
Table 22: Feelings and experiences, Excitement. Means ....................................................................40
Table 23: Feelings and experiences, Excitement. Percentages ...........................................................40
Table 24: Feelings and experiences, Reason. Means ..........................................................................41
Table 25: Feelings and experiences, Reason. Percentages .................................................................41
Table 26: Price. Means ......................................................................................................................42
Table 27: Price. Percentages .............................................................................................................42
Table 28: Functional Benefits, Space. Means .....................................................................................43
Table 29: Functional Benefits, Space. Percentages ............................................................................43
Table 30: Functional Benefits, Repairing. Means ...............................................................................44
Table 31: Functional Benefits, Repairing. Percentages .......................................................................44
Table 32: Functional Benefits, Technical support. Means ..................................................................44
Table 33: Functional Benefits, Technical support. Percentages ..........................................................45
Table 34: Experiential Benefits. Means ..............................................................................................46
Table 35: Experiential Benefits. Percentages .....................................................................................46
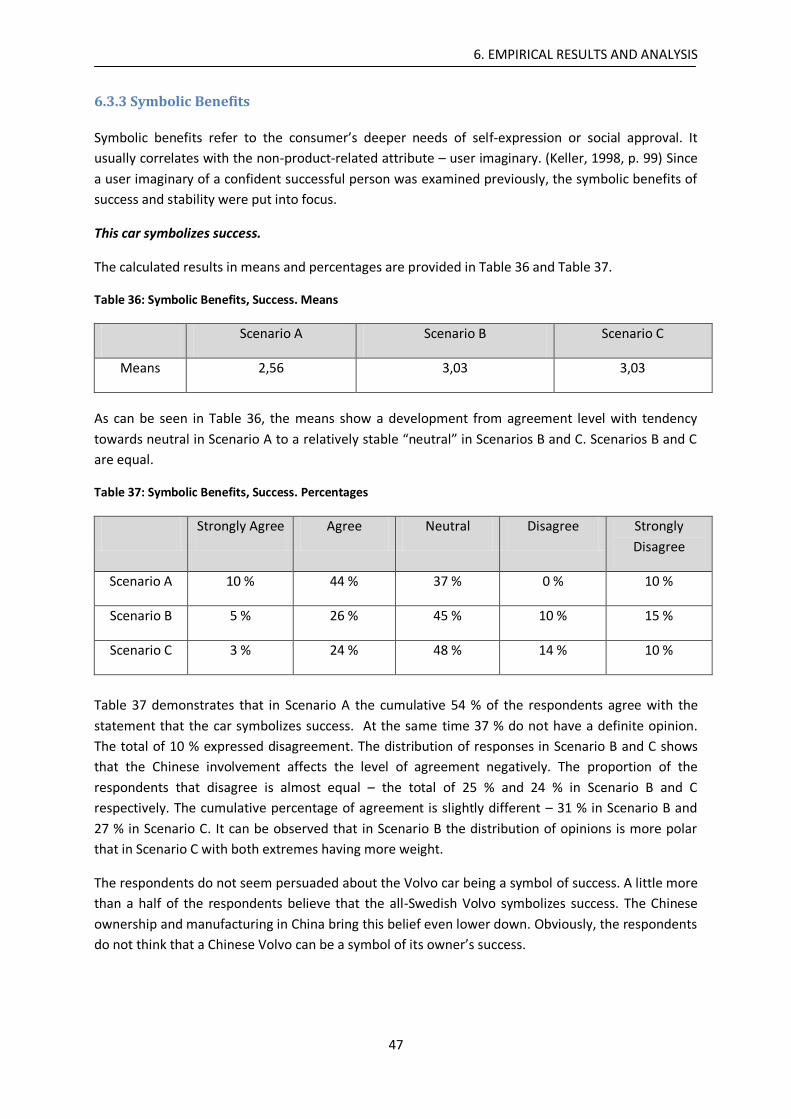
Table 36: Symbolic Benefits, Success. Means ....................................................................................47
Table 37: Symbolic Benefits, Success. Percentages ............................................................................47
Table 38: Symbolic Benefits, Stability. Means ....................................................................................48
Table 39: Symbolic Benefits, Stability. Percentages ...........................................................................48
Page 6
iv
Table 40: Attitude, means .................................................................................................................49
Table 41: Attitude, percentages ........................................................................................................49
Table 42: Strength of Brand Associations, Safety. Means...................................................................50
Table 43: Strength of Brand Associations, Safety. Percentages ..........................................................50
Table 44: Strength of Brand Associations, Quality. Means .................................................................51
Table 45: Strength of Brand Associations, Quality. Percentages.........................................................51
Table 46: Uniqueness of Brand Associations. Means .........................................................................52
Table 47: Uniqueness of Brand Associations. Percentages .................................................................52
Table 48: Favorability of brand associations. Means ..........................................................................53
Table 49: Favorability of brand associations. Percentages .................................................................53
Appendices
Appendix 1: Sales Figures of Volvo per Country in 2009……………………………………………………………………62
Appendix 2: Sales Figures of Volvo per Model in 2009……………………………………………………………………… 63
Appendix 3: Screenshot of the On-line Questionnaire……………………………………………………………………... 64
Appendix 4: Questionnaire………………………………………………………………………………………………………………. 65
Appendix 5: Examples on Forum Responses…………………………………………………………………………………….. 66
Page 7
1. INTRODUCTION
1
1. INTRODUCTION One of the big changes in the European automobile industry during the last years was the acquisition
of Volvo by the Hangzhou (China) based car manufacturer Geely Holding Group (Geely). Until then –
as shown later - takeovers between companies based the United States and/or Europe were more
common. Recently, the most remarkable transaction was the acquisition of Jaguar and Land Rover by
India-based Tata in 2007 (Millward, 2007). However, the acquisition of Volvo is the first time that
Chinese company dared such a step. Production facilities are already in construction (Reed, 2011)
even an export of vehicles manufactured there seems to be possible (Enjoji, 2011).
Here seem to be two worlds clashing. Thanasuta et al. (2009) figured out that perceived quality of
cars amongst customers is higher when the product is manufactured by European company than by
an Asian one. This is also common information that can be retrieved from online discussions and
indicates already the point of interest. Therefore, one can assume that there is an impact on the
brand image of a European car manufacturer when it is acquired by a Chinese company. Expressed in
an uncouth way it can be said: Lower quality on the one side might put down the higher one on the
other side. However, it might be possible that the combination is exactly what was necessary in order
to create a bright future for Volvo.
The reason why Volvo was chosen for this research is that this branch of the industry is of special
interest in the society and the brand itself, from the authors’ point of view, is one of the signboards
of Swedish technology and progress. It might also mark the beginning of a new era as described later
as far as industrial change is concerned.
1.1 Purpose of the study As indicated above there are different options about what can happen to the image of Volvo after
the acquisition by Geely and change in the manufacturing location to China. This thesis aims at
identifying if there is already an impact, and if so what is its character. In addition, in this research
the attempt is made to identify the effect that manufacturing in China can have on the brand image
of Volvo. Thus, the purpose is to describe and analyze the possible change of brand image of Volvo
Cars in these two cases as perceived by consumers.
1.2 Research question A stronger brand can be affected in some way once it is combined with a weaker brand within one
organization after merger or acquisition (Lee, 2011). Therefore, the research questions arising are:
How did the acquisition of Volvo Cars by Chinese Geely affect the brand image of Volvo?
How can the change in manufacturing location to China influence the brand image of
Volvo?
1.3 Target Group This research will make a contribution to the field of brand management. The results will have
practical implications for managers when considering brand image changes in the context of mergers
Page 8
1. INTRODUCTION
2
and acquisitions. The primary target group is management of Volvo Cars. The results can be
projected on other companies in similar situations. In addition, this thesis will contribute to the
academic research in the area of branding, and can be used by marketing students as reference.
Page 9
2. BACKGROUND
3
2. BACKGROUND
2.1 Recent Acquisitions in the Car Industry The recent decades were dominated by big changes in the world’s automotive landscape.
Consolidation was the name of that phenomenon. (Calabrese, 2001, 147ff) Spectacular fusions were
for example the acquisitions of Volvo (1999), Jaguar (1990), Aston Martin (1987) and Land Rover
(2000) by Ford (Bradsher, 1999; Doran, 2006; Glaberson, 1987; The Independent, 2000), the merger
between Daimler and Chrysler (Finkelstein, 2002) as well as the acquisition of Saab by GM in 1990
(50%) and 2000 (100%) (Garret, 2006). Achterholt & Schmid (2008, p. 9) predicted in the beginning of
the world financial and economic crisis that this trend will continue. However, what we saw until
now within the last time was a trend of more and more Asian companies taking control over Western
car manufacturers. (Amann, 2009) Examples for that are the takeovers of Jaguar and Land Rover by
Indian Tata (Millward, 2007) and the recent acquisition of Volvo by Geely (Fangfang, 2010).
2.2 Volvo Volvo was founded in 1927 by Assar Gabrielsson and Gustaf Larsson. The brand name is the Latin
word for “I roll”. The first Volvo car appeared just in the same year. From the beginning the work was
based on the principles of quality and safety that can still be found as values in Volvo brand strategy.
Through the years a lot of effort was put in the developments in the sector of safety. Volvo Amazon
and the PV544 were the first in world to be equipped with three-point safety belts. In the 1960s the
first models were introduced equipped with four disk brakes and a dual-circuit brake system. The
latter one enables the car still to be stopped even if one circle does not work. In 1985, Volvo
equipped its 400 series as first European car manufacturer with an anti-lock breaking system (ABS).
Furthermore, there was an air bag for the driver as well as a seat-belt tensioner. (Volvo Cars, 2011)
With the model 850, Volvo introduced in 1991 the Side-Impact-Protection-System (SIPS) and the
vertically adjustable seat belt. Since the beginning of the 1980s, Volvo moved more and more
towards the sector of exclusive cars. (Volvo Owners Club, 2011)
Volvo was acquired by Ford Motors Co. in 1999. The new owner integrated Volvo into a collection of
premium brand cars. The new division, located in London was then called Ford Premier Automotive
Group. (The Economist, 2010) The combination of the two company cultures was not easy as they
were very different. Ford is a company with a strictly-structured hierarchy, whereas Volvo was
historically very decentralized and based on teamwork. In addition, Volvo also worked closely with
unions. For Volvo the shift was especially difficult as the company constituted 51 % of the whole
Volvo Group which included several divisions, among which Volvo Buses, Volvo Trucks, and Volvo
Construction Equipment. After the acquisition Volvo Cars represented only 8 % of Ford’s business.
(Salarna et al. 2005) As the project did not prove to be successful and the financial crisis took its toll
on the American automobile industry, Ford decided to sell the companies and liquidate Ford Premier
Automotive Group. (The Economist, 2010) On this decision Volvo was sold to China’s Geely Holding
Group in March 2010. (Nicholson, 2010) After ten years of integrating the companies from the aspect
of part-sharing as well as development and design, there will be still many points of connection
between Ford and Volvo. (The Economist, 2010)
Under new management the plans were developed to produce and export Volvo cars from China. A
new plant will be opened within the next two years. The first one is to be followed by two more
Page 10
2. BACKGROUND
4
manufacturing facilities. In fact, Volvo already produces the models S40 and S80 for the Chinese
market in cooperation with a partner. This cooperation was established by Ford Motors. (The Local,
2010a) In January 2011, a new headquarters for China was opened in Shanghai. This includes also a
center for technological developments. (The Local, 2011b)
In April 2011, Volvo informed that the company was within a transition process and it was
conducting a redefinition of the brand. (The Local, 2011d) Against numerous rumors, Geely wants
Volvo to remain an independent brand that is also managed independently. (The Local, 2009) Instead
of placing own people in the Volvo administrative board, the new management hired people like
Håkan Samuelsson (former MAN AG Chairman and CEO), Herbert Demel (Executive Vice President of
Magna International) and Hans-Olov Olsson (former President and CEO of Volvo). Geely placed
Stefan Jacoby (former President and CEO of Volkswagen America) as new Volvo CEO. (Manager
Magazin, 2011; Volvo Car UK, 2010)
In the year 2010, Volvo was able to sell 373,525 cars. The figures indicate improvement of 11.2
percent compared to 2009. The sales in the U.S. are decreasing. If this tendency continues, Sweden
can soon overtake the U.S. as Volvo’s biggest market. After the acquisition by Geely, the sales in
China increased by 36.2 percent. The bestselling car is at the moment the SUV XC60, followed with
some distance by the station wagons V50 and the V70. The sales numbers for the largest markets
and for models are presented in Appendix 1 and Appendix 2 respectively. The company has informed
that in 2012 a plug-in hybrid version of the new S60 (sedan)/V60 (station wagon) will be introduced.
(The Local, 2011a) According to the announced plans, China is to become Volvo’s second home
market. By 2020 the annual sales are to increase to 800,000 cars worldwide. (The Local, 2011b) There
is still disaccord over the question whether Volvo should start to develop even bigger cars than at the
moment. While Li Shufu, the owner of Geely views it as a necessary thing, since according to his
belief Volvo could make an advance by introducing big-size models, as the tendency worldwide is
moving towards smaller cars with less fuel consumption. (The Local, 2010)
2.3 Geely Geely Holding Group (further referred to as “Geely”) is a young, privately owned (The Economist,
2011) company based in Shanghai, China (Geely company website, 2011). It was founded by Li Shufu
in 1986 (Manager Magazin, 2011) and concentrated first on the production of fridges and
motorbikes. (Geely, 2011) The company’s name comes from the Mandarin word for “lucky”. (The
Economist, 2011) In 1997, the company started producing cars. Today the offices are open in the CIS
states (The Commonwealth of Independent States, the term informally referred to the former Soviet
Union countries), the Middle East, Africa, Southeast-Asia as well as in Central and South America.
Outside China production facilities are located in Ukraine, Russia and Indonesia (Geely, 2011). In the
past years Geely got a lot of publicity due to alleged intellectual property violations when the
company had created a car that was obviously a copy of a Rolls-Royce Phantom. (The Economist,
2011)
In March 2010, Geely Holding Group acquired Volvo Cars from Ford Motors Co. (Geely, 2011) Since
2009 the company has had a plan to introduce the premium car brand in the world’s biggest car
market – China. This acquisition gives Geely access to around a hundred new markets in the world.
The opportunities in China are big. Mere five percent in market share would mean annual sales of
300,000 cars. (Handelsblatt, 2009) This shows the remarkable potential of the market if one
considers that Volvo sold 373 525 cars worldwide in 2010. The record sales amounted to 458 323
Page 11
2. BACKGROUND
5
cars in 2007. (The Local, 2011c) The aim 2020 is to sell an annual amount of 800 000 cars in 2020.
(The Local, 2011b)
2.4 The New Way of Volvo With the introduction of the new compact C30 in 2006 (Mepham & Hard, 2006) and the SUV XC60 in
2008 (AMS, 2008) Volvo started a new era as far as design was concerned. The former Volvos were
more famous for being good family cars, solidly engineered with more emphasis on “form follows
function” (McNamara, 2006; Foxhall, 2007). So it was appealing to a more rationally thinking
clientele. Now there seems to be a shift towards more emotion (Foxhall, 2007). This also marks a
shift in brand strategy (Chapman, 2010). The new middleclass models S40 and V50 continue with that
new way. The principle safety is preserved but the validity of usable space as a rational reason to buy
the cars seems to be dropped. This step leads towards more direct competition with brands like
Mercedes, BMW or Audi. Furthermore, with that new paradigm Volvo faces the danger of losing their
ancestrally group of customers. (Grünweg, 2010) In fact there are already the first voices which
criticize, that the new line would lead to more beauty, but for example in terms of space to even a
disadvantage compared with the competitors and even compared with smaller and cheaper Volvo
models. (Dietkirchen, 2010) In the field of alternative drive concepts, Volvo sees its future in the
combination of diesel and hybrid, which means a combination of a conventional diesel driven engine
as well as a set of electro motors. (AMS, 2011)
2.5 Volvo Brand In the discussion about the brand of Volvo it is crucial to define the borders within which the authors
will refer to Volvo through this paper. Volvo is a corporate brand shared by all the divisions of Volvo
Group, namely Volvo Trucks, Volvo Buses, Volvo Construction Equipment, Volvo Penta, Volvo Aero,
and Volvo Financial Services, and Volvo Cars (AB Volvo, 2011). In this paper Volvo brand is used as
referring to Volvo Cars only.
As a brand with history, Volvo has gone through decades of development. The overview of
specialized automobile periodicals makes it clear that Volvo had its strongest reputation in the field
of safety. (Leyrer, 1981; Auto Motor und Sport, 1978, p. 116; Motor Rundschau, 1960). In addition,
robustness (“…like a castle”), high quality (design and manufacturing), lots of available space, and
comfort for both a driver and a passenger were the attributes of Volvo cars. (Leyrer, 1975, p. 57ff)
Some argued that Volvo is something for special people (Auto Motor und Sport, 1978, p. 126), often
for those who can be characterized by higher income or, more abstract referring to the topic of
safety, by their level of sense of responsibility. Furthermore, Leyrer argues that customers tend to
have a high level of individuality. (Leyrer, 1981, 94ff)
However, there are also weaknesses that were constantly mentioned. While according to Spierer
(1960, p. 96) Volvo was famous in the 1950s and 1960s for its temperament and very good road
handling; later, however, the cars were criticized for having an undercarriage that was performing
under average in its class (Auto Motor und Sport, 1978, p. 126) with its low agility (Leyrer, 1975, p.
60). Moreover, Volvo was receiving critical reviews for the fact that its motors were on a lower level
of technical development than the ones of the competitors. This was in most cases reflected by
accelerating below and consuming above average. (Leyrer, 1981, p. 98; Leyrer, 1975, 58; Auto Motor
und Sport, 1978, p. 126) A final thing that was widely discussed is the design. In 1960, Spierer (p. 96)
was writing about the beauty of the Model P1800. However, already in the 1970s the design of Volvo
was viewed as being special but not attractive (Leyrer, 1975, p. 57; 1981, p. 94). At that time Volvo
Page 12
2. BACKGROUND
6
was seen as a direct competitor to Mercedes and BMW and was often compared with them (Leyrer,
1981, p. 94).
Up till the current moment safety remains the major issue for Volvo. On a par with safety, quality and
care environment are cited as the core values that serve as a basis for the corporate brand building
(Urde, 2003). They are an umbrella to the product brands of Volvo Group divisions and Volvo cars
(Urde, 2003; AB Volvo, 2011). For Volvo Cars as a product brand superior design is another building
brick (Urde, 2003). The Volvo Car Corporation presents a pyramid of values that create the brand
(See Figure 1).
Figure 1. Brand pyramid of Volvo
(Volvo Car Corporation, 2011)
The premium quality, customer experience, and driving dynamics are on the basic level as these are
common features of premium sector cars. Environmental care and modern Scandinavian design are
on the second level of the pyramid. These two are the factors that make Volvo different from other
brands in the sector. Safety stands on top as the unique attribute of the brand. (Volvo Car
Corporation, 2010)
Furthermore, according to Urde (2003) on a product brand level Volvo attempts to attribute human
features to its cars, thus creating the brand with a human face. The most commonly cited traits are
“informal”, “casual”, “responsible”, “generous” and “family-oriented”.
Another notable aspect of the Volvo brand is its strong association with Scandinavia and Sweden
(Shirouzu, 2011; Urde, 2003). Same idea echoes through on-line discussions where people mention
that they admired Volvo that was made by people “who know what they are doing”, “use the cars
themselves” and “are proud of Volvo”. Nevertheless, dissatisfaction and disappointment with the
current strategy of Volvo are often expressed by the participants of the on-line discussions. They
point out that the brand is losing the qualities that it was known for, namely functionality and
simplicity, and that it is drowning in the desire “to be like the rest”. The opinions about the Chinese
acquisition range from deep concern about the loss of brand’s identity with the change of ownership
and possible change of manufacturing facilities to indifference “because Volvo has been already
destroyed”. The consumers who show interest in the effect of the acquisition reveal their worries
about the possible change in the safety, quality, level of technology, and symbolic value of the Volvo
Page 13
2. BACKGROUND
7
cars under new management. On the other hand, some express hope that the change will bring
positive effects and return Volvo to its pre-Ford strategy.
Page 14
3. LITERATURE REVIEW
8
3. LITERATURE REVIEW
3.1 Brand Brands are complex intangibles whose character is formed by features that might seem unimportant
at first sight (Abrahams, 2008). According to Abrahams (2008), brand is a sum of all information
about a product, service or a company that is communicated through its name. Keller (1998) defines
brand as “name, term, sign, symbol, or design or a combination of them intended to identify the
goods and services of one seller or group of sellers and to differentiate them from those of
competition” (Keller, 1998, p. 2). Urde (2003) refers to brand as a “resource and strategic instrument
of competition”. He stresses that it has to be unique and difficult for competing companies to imitate
(Urde, 2003). Thanasuta at al. (2009) summarizes three definitions related to brand: “trademark” is a
logo with associated visual elements, “brand” is a trademark with related intellectual property rights,
and “branded business” refers to the whole organization.
In both industrial and consumer markets brands create emotional and value expressive benefits.
Therefore, every company with identity has a brand that it has to manage, develop and protect.
Strong brand stimulates demand for a company’s product, as well as desire of other companies to be
associated with or dissociated from the brand owner. Thus, a brand becomes a focal point not only
for the company’s customers, but also for other stakeholders, e.g. employees, partners, investors,
regulators, and communities. (Abrahams, 2008)
A strong well-managed brand is an intangible asset in three dimensions:
Legal asset, affording rights;
Relational asset, building affinities;
Economic asset, creating value. (Abrahams, 2008)
Unlike a company’s material assets, a brand does not lose value through utilization. It can be used to
create value by many generations of the company’s management. (Abrahams, 2008) Benefits of
strong brands comprise short-term advantage on recognition to long-term competitive advantage on
loyalty, which are eventually transformed into revenues and profits (Thanasuta et al., 2009).
The way that companies organize and manage their brands is referred to as brand architecture,
which largely defines the number of brands within one organization, their types, roles and internal
relationships. There are four basic brand architectures:
Corporate brand (brand of an organization shared by its constituting units);
Product brands (brands representing one product);
Corporate and product brands (brands shared by an organization and all of its products);
Product brands and corporate brand (separate brands representing an organization and each
of its products). (Urde, 2003)
Development of a brand takes between three and five years (Strach & Everet, 2006). According to
the model by Goodyear, there are six stages of brand development: unbranded, brand as a
Page 15
3. LITERATURE REVIEW
9
reference, brand as a personality, brand as an icon, brand as a company, and brand as a policy.
Unbranded are usually commodities and packaged goods in non-industrialized context. Brand as a
reference identifies the product and over time serves as a guarantee of quality. Brand as a
personality adds emotional appeal to the image; at this stage brand name becomes recognizable out
of the context. Further, brand as icon becomes a part of the society values, and establishes “close
relationship” with the consumer. Brand as company involves corporate benefits and values, and
develops complex identities of the brand. Finally, at the brand as policy stage both brand and the
company are enmeshed into social and political issues; they stand for causes and ideas, and
consumers express support to those by choosing the brands. (Strach & Everet, 2006)
Urde (2003) underlines the importance of values in the brand development. An effective brand must
comprise and represent values of both the organization and the target customer group. Brand
building process includes internal and external processes. The former describes the relationship
between the organization and the brand, the ultimate goal of which is “to get organization live its
brand”. The latter refers to relationship and interaction between the brand and the customers which
ideally result in creating value and relationship based on the customer’s identity. Urde (2003)
summarizes the process of external brand development in the following sequence. First, interest in
the product and importance of the choice of the brand has to be stimulated. This stage is referred to
as creation of brand sensitivity. Next brand awareness and positive brand associations need to be
formed (Aaker, 1992; Urde, 2003). Positive brand associations constitute a favorable brand image
(Keller, 1998; Koubaa, 2008) and create added values for the customer (Urde, 2003). These added
values might be of functional, emotional or symbolic character. The attractiveness of the brand
image to the customer’s own self-image lays the foundation for establishing a relationship between
the brand and the customer, which in its turn serves as a basis for brand loyalty (Urde, 2003).
3.2 Importance of Brands Brands are of paramount importance for companies’ performance (Abrahams, 2008). They affect the
value of the company, and often serve as a measure of the company’s success (Strach & Everet,
2006). Companies with strong brands usually outperform their competitors with weaker brands.
Success of business is endangered if such a valuable asset is not managed or protected properly.
(Abrahams, 2008)
The importance of brands can be viewed from two perspectives – consumers’ and manufacturers’.
For consumers brand identifies the manufacturer of the product and thus allows to assign
responsibility for it. Choosing familiar brands mitigates the risk entailed in a product decision. In
addition, it reduces search time and cost, and signals the quality and specific characteristics of the
product. Brands often serve as symbolic devices that extend the consumer’s self-concept. Finally, the
relationship between consumers and brands can be viewed as a type of agreement or pact where
consumers exchange their trust and loyalty to the brand’s consistent performance and adequate
pricing, promotion, and distribution actions. (Keller, 1998)
From the manufacturer’s perspective effective brands create value in several ways. They reduce
uncertainty about future demand and protect the industry from new competitors. (Abrahams, 2008)
Customers’ brand loyalty provides predictability of demand and creates higher entry barriers in the
mature markets (Keller, 1998, p. 9). In addition, strong brands can be viewed as a source of
sustainable competitive advantage (Urde, 2003). In new markets they facilitate access and
expansion. A strong corporate brand helps attract and retain employees, enhance their commitment
Page 16
3. LITERATURE REVIEW
10
and performance. It also gives the company more bargaining power, including cost of capital,
conditions of supply, leverage in negotiations and appointment of risk in joint ventures. In
relationships with regulators and communities a strong brand grants more freedom of action to its
owner. In emergency situations, such as natural disaster, brands survive reassuring customers,
employees and business partners in the fast recovery of the whole business. (Abrahams, 2008) In the
internal operations brands help simplify product handling, organize inventory, accounting, and other
records. Moreover, they are the means of legal protection of unique product features, the source of
competitive advantage and financial returns. (Keller, 2008, p. 9)
3.3 Brand Image and Brand Associations On a par with brand awareness brand image constitutes an integral part of brand knowledge. There
has not been agreement on the definition of this term and criteria to measure it. Keller (1998)
suggests a definition consistent with associative network memory model, which states that “brand
image can be defined as perceptions about a brand as reflected by the brand associations held in
consumer’s memory”. This definition is accepted and referred to by other authors (Koubaa, 2008).
Other definitions suggest that brand image is “an overall mental image that consumers have of a
brand and its uniqueness in comparison to other brands” (Lee, 2011), and “the reasoned and
emotional perceptions consumers attach to a specific brand” (Koubaa, 2008).
Brand image is the product of mental processing and analysis in the consumers’ minds. Therefore, it
can be influenced by two sets of factors – internal and external. Internal factors refer to the
consumer’s personal features. External factors include the products characteristics and image of the
country of origin. (Koubaa, 2008) Lee (2011) suggests that brand image comprises knowledge and
beliefs about the product’s product and non-product attributes. In addition, brand image is a form of
personal symbolism that consumers associate with the brand. It includes descriptive and evaluative
brand-related information.
As stated by several authors, brand image is made of associations. As Koubaa (2008) quotes Aaker,
he defines brand associations as “the category of brand’s assets and liabilities that include anything
“linked” in memory to a brand”. Keller (1998) in his turn defines brand associations as “informational
nodes linked to the brand node in memory and contain the meaning of the brand for consumers”.
(Keller, 1998, p. 93) Lee (2011) suggests that the most powerful brand associations are the ones
related to intangible or abstract properties of the brand. He also states that brand associations help
spontaneously recall information and form the basis for differentiation and brand extension. (Lee,
2011) On a par with perceived quality, brand associations play an important role in adding value to
the brand by improving customer satisfaction and customer experience (Aaker, 1992)
A relationship between favorability of brand image and increase in brand equity has been mentioned
in several studies (Lee, 2011; Aaker, 1992). Favorable brand image and brand associations in
particular, improve brand loyalty and provide reasons to buy the brand (Aaker, 1992). Furthermore,
positive brand image increases consumers’ willingness to pay (Lee, 2011), and allows the company to
get higher price premiums (Thanasuta et al, 2009).
As for classification of brand associations, Keller (1998) develops a brand image model. According to
it, brand image is made of several types of associations, namely attributes, benefits, and attitudes
that possess following characteristics: favorability, strength, and uniqueness (See Figure 2). Same
classification is supported by Koubaa (2008) as he reviews the works by Friedman and Lessing, and
Page 17
3. LITERATURE REVIEW
11
Kirmani and Zeothaml. According to their definitions, attributes are descriptive features that
characterize a product or service. Benefits embody value that consumers attribute to the product or
service; and overall attitude summarizes the consumers’ evaluation of the brand. Brand associations
can be distinguished by their level of abstraction, which means the amount of information
summarized in the association (Keller, 1998, p. 93). Koubaa (2008) brings in means-end theory as he
discusses the role of abstraction in classifying associations. According to him, this theory reflects the
memory linkages among attributes of the product (means), consequences, and attitudes (end). This
represents the hierarchy of linkages between the product and the customer’s self.
Brand image structure by Keller is presented in Figure 2 and discussed below.
Figure 2: Brand image structure (red lines added by the authors)
(Keller, 1998)
Attributes are descriptive features that characterize a product or service. The example is what a
consumer thinks the product is or how it has to be used. Urde (2003) suggests that product attributes
should reflect the values of the company and the brand, as in the example of Volvo and its core value
of safety. Attributes in their turn are divided into those directly related to the product or service –
product-related, and those constituting external aspects of the product or service, often connected
to its purchase and consumption – non-product related. (Keller, 1998, p. 93)
Product-related attributes refer to product’s physical characteristics or service’s requirements, and
make a basis for the product’s performance. Non-product related attributes affect the purchase and
consumption, but not directly the product performance. Price, user imaginary, usage imaginary,
feelings and experience, and brand personality are the most often distinguished types of non-
Characteristics of brand
associations
Page 18
3. LITERATURE REVIEW
12
product-related attributes. (Keller, 1998, p. 95) Among these, brand personality is the most widely
discussed concept. Wang (2008) refers to Aaker when he defines brand personality as the human
characteristics associated with a specific brand. The theory behind this concept is that brands are
intangible inanimate objects; however, consumers tend to view brands as possessing human
characteristics (Fetscherin & Toncar, 2009). Brand personality presents rather symbolic value than
utilitarian function. It helps the consumers to build social identity and express their actual self, ideal
self or social self (Wang, 2008).
Benefits are the personal value and meaning that consumers relate to the product or service
characteristics. This is the way consumers understand what the product features and characteristics
can do for them. (Keller, 1998, p.99) The classic way of identifying benefits is matching the features,
or attributes of the product with the needs of the target consumer group (Evans et al, 2010) In
regard to underlying motivation, benefits are classified into functional, experiential and symbolic.
Functional benefits are closely connected to product-related attributes. They are often linked to
basic motivations, such as physiological and safety needs. Experiential benefits are linked to the
experience of using a certain product or service, and correspond to both product-related and non-
product-related attributes. Symbolic benefits correspond to non-product related attributes,
especially user imaginary, that is – what kind of person uses this or that product. This type of benefits
relate to the needs of social approval or personal expression or outer-directed self-image. (Keller,
1998, p. 99-100)
Attitudes are the most abstract brand associations. They define the consumer’s overall evaluation of
the brand. Attitudes are of paramount importance since they form the basis for action and behavior
towards the brand. Consumer brand attitudes are largely based on attributes and benefits of a
particular brand. Multi-attribute attitude model suggests that brand attitudes depend on the
strength and favorability of associations between the brand and its attributes and benefits. (Keller,
1998, p. 100) Attitude defines the consumer’s predisposition to respond to a stimulus (object, action,
idea etc.) in a consistent and predictable manner (Evans et al, 2010).
As for characteristics of brand associations, strength, favorability and uniqueness have to be
discussed. Strength identifies what information is recalled by consumers first in connection to a
brand. This is critical in defining what influences their decision about the brand. Furthermore,
associations differ in the way they are assessed – favorably or not. In other words favorability
indicates how strongly consumers believe that certain attribute or benefit of the brand will serve
their needs in a positive way. Finally, uniqueness of brand associations indicates whether the brand
shares attributes and benefits with other competing brands or not. It is easier created in non-product
related attributes, such as usage and user imaginary, than in product related attributes, which refer
mainly to physical characteristics of the product. (Keller, 1998)
3.4 Brand Vulnerability Growing economic importance and value of brands increase vulnerability of brands for a number of
reasons. First, growth imperative encourages companies to extend their brands in new categories
and environments beyond their operating capabilities. Underperformance or even failure in the new
field weakens the brand together with the confidence in the company’s management. In addition,
with the spread of Internet blogs and forums where users openly discuss products and brands, the
accountability of companies’ to their customers increases drastically. Furthermore, corporate
misconduct can cause serious damage to the company’s image and, consequently, brand. The
Page 19
3. LITERATURE REVIEW
13
examples of such misconduct include use of child or slave labor, directors’ overcompensations,
corporate racism, alleged encouragement of child obesity etc. Finally, what is most important for this
research, brands are vulnerable to depreciation and corrosion after mergers and acquisitions in case
of insufficient attention and understanding of a brand that is being acquired. (Abrahams, 2008)
Already in the 80s the effect that strong brand names have on merger and acquisitions tendencies
was recognized. Large companies preferred to take over a mature premium brand to developing a
brand of its own. Then it was attributed to the low inflation rate that increased the demand for
premium goods, and high cost of new product introduction. One of the risks connected to the
acquisition of strong brands was unreasonable brand extension. The example of Coca-Cola’s failure
with its new formula proved the existence of limits to the brands’ immunity to extension. (Alter,
1985)
In the study of the effect mergers and acquisitions have on brand image Lee (2011) applies balance
theory to investigate the relationship within the triangle of a consumer, acquiring brand, and
acquired brand. This study particularly focuses on the cases when a superior or an average brand is
acquired by an inferior one. The results show that an inferior brand can improve its image
significantly by acquiring a superior or an average one. However, the image and associations of the
superior brand deteriorate, since with the transfer of ownership consumers become doubtful
whether the brand can maintain its product attributes, intangible assets, consumer benefits, and
even brand personality. (Lee, 2011)
3.5 Country of Origin Country of origin (COO) effect has been researched intensively since 1960s (Thanasuta et al, 2009).
The role of country of origin has been an important field of investigation in international marketing
(Fetscherin & Toncar, 2009). COO is often referred to the degree to which consumers use the country
of origin as an argument in a purchasing decision. COO can influence the purchasing decision in
different ways, including product evaluation, quality perception and purchasing intention. (Lin, 2006)
Often COO serves as a cognitive cue from which consumers infer beliefs and ideas about the product
based on their image of the country of origin. Studies suggest that brands from countries with
favorable images are more readily accepted that brands from countries with less favorable images.
(Fetscherin & Toncar, 2009) If a customer is not familiar with the brand, he or she is inclined to derive
its image from the halo effect of COO, which exerts indirect influence on the purchasing decision
(Wang, 2008).
Koubaa (2007) in his study of COO effect introduces the concept of umbrella brand-image, which
means that the brand image perception is largely affected by the country image perception.
Consumers tend to recall the information they have about a particular country and then relate a
brand name with country of origin to build a brand image and evaluate the brand. The results of the
research prove the existence of strong connection between the two images. Moreover, they indicate
that high-reputed brands are affected more than the low-reputed brands when production is moved
to a country different from the country of the brand origin. High-reputed brands suffer erosion and
depreciation. Thus, the author concludes that the country of origin effect is strong enough to
overcome the power of well-known brands in forming a brand image in consumers’ minds.
Research of the relation between COO and brand personality effect reveals that both largely depend
on the product category. For example, COO has very positive effect when we think about German
Page 20
3. LITERATURE REVIEW
14
cars, Italian shoes, or Japanese electronics. Overall, the studies confirm that the positive COO can
enforce the brand personality effect on purchase intention, whereas negative COO weakens the
impact of brand personality on purchase intention. Even though it was empirically proven that the
effect of negative COO is comparatively smaller than the effect of positive COO, the highest purchase
intention can be reached by brands with positive personalities, supported by positive COO image.
(Wang, 2008)
Thanasuta at al. (2009) conducts evaluation of the COO of car brands in monetary equivalent. The
results on the Thai car market reveal a strong relation between COO and consumers willingness to
pay. Thai consumers are ready to pay more for European brands, namely German, Swedish, and
French just for the positive image of the COO.
In the recent researches COO has acquired a complex structure. Fetscherin and Toncar (2009)
distinguish between country of brand origin (COB) and country of manufacturing (COM). They define
COB as the country where the brand originates from and where headquarters is located. COM is
defined as the country where the product is produced and assembled. As the results of their research
suggests, in automobile industry COM exerts more influence than COB.
Ahmed and d’Austus (2001) go further and develop the discussion about country of design (COD),
country of parts (COP) and country of assembly (COA), and their importance in the modern
globalized economy. Even though COD, COP and COA are provided as factual information, it is
consumers’ perception that matters the most. These perceptions are affected by brand familiarity,
level of involvement in the purchasing decision and level of involvement with a particular product
class, familiarity with countries, and preference of domestic products.
Page 21
4. CONCEPTUAL FRAMEWORK
15
4. CONCEPTUAL FRAMEWORK
Based on the analysis of the reviewed literature, the conceptual framework for the following
empirical study has to be developed. The discussion in this area of research, as well as purpose and
question under study, lead the authors to the conclusion that two models are required. The main
model serves the purpose of the research, whereas the sub-model enables the authors to
operationalize the central concept of the research – brand image.
4.1 Main Model
The main model was developed by the authors. It includes the concepts of brand image, country of
brand origin and country of manufacturing should be used as the constructs of the conceptual
framework. The interrelation between the concepts is illustrated in Figure 3.
Figure 3: Conceptual Framework
The constituents of the model are defined as following. Brand image in the definition by Keller (1998)
is accepted as the operational term in this paper. Thus, brand image is perceptions about a brand as
reflected by the brand associations held in consumer’s memory. Further, the definition of country of
origin given by Fetscherin and Toncar (2009) is adopted in this model. According to their view, the
country of origin is a complex concept that includes country of brand origin and country of
manufacturing. Country of brand origin is the country where the brand originates from. Country of
manufacturing is defined as the country where the product is produced and assembled.
(Fetscherin&Toncar, 2009)
The influence of the country of brand origin and the country of manufacturing on the brand image is
in the focus of this thesis. The model builds a basis for the empirical research, and enables the
authors to investigate the influence that the change in country of brand origin and the country of
manufacturing can have or already have on the brand image of Volvo. High-reputed brands, as Volvo
is considered to be, are strongly influenced by the change in the country of brand origin and the
country of manufacturing (Koubaa, 2007). In addition, in the automobile industry country of
manufacturing exerts stronger influence on the brand image than the country of brand origin
(Fetscherin & Toncar, 2009). Therefore, in this research the influence of the two factors on the brand
image of Volvo is investigated. First, the effect that the change in the country of brand origin from
Sweden to China is identified and described. Then the influence of the shift of the country of
manufacturing from Sweden to China is investigated.
Page 22
4. CONCEPTUAL FRAMEWORK
16
4.2 Sub-model (Brand Image by Keller)
In order to operationalize the concept of the brand image in the main model, the sub-model is
required. For this purpose the model of the brand image structure developed by Keller (1998) is
applied. The model is presented in Figure 2 and widely discussed in 3.3 Brand Image and Brand
Associations. The sub-model serves as a basis for further empirical research and data collection. In
order to keep the organization of the paper logical and avoid repetition the authors refer the readers
to the above-mentioned Figure and sub-chapter for detailed description.
Page 23
5. METHODOLOGY
17
5. METHODOLOGY In order to answer the question on the effect of the Chinese acquisition on Volvo brand Image, it is
necessary to get a wide scope of information. This is only possible by conducting a research. This
chapter provides a guideline how the research was done and why the ways were chosen.
5.1 Categorizing the Research According to Ghauri & Groenhaug (2005, p. 58f) there are three forms of research. These are
exploratory, descriptive and causal research. They aim at three different objectives. Exploratory
research is used to create understanding and awareness about changes, new developments or also
to get new ideas. In contrast, descriptive research covers a very clear field. For example the target
group is well defined so that the variation in the results is minimized. Causal research is usually
focused on a structured situation. Additionally, the author also faces “cause-and-effect” problems. In
this kind of research the extent of the impact created by a special cause is measured.
The case that was studied in this paper is going along with the descriptive research, as it aims at
identifying and describing the change of the brand image of Volvo after acquisition by the Chinese
Geely.
5.2 The Research Approach According to Ghauri & Groenhaug (2005, p. 109), there are two research approaches. These are the
qualitative and the quantitative approach. They mention that qualitative approach – in contrary to
quantitative one – usually does not apply statistical methods for data collection and processing.
However, they conclude that the approaches must not necessarily be separated from each other.
Qualitative methods put more emphasis on understanding from an informant’s point of view, try to
interpret and to explore, whereas a quantitative one focuses on results, testing and verifying them
and is more analytical with the aim of generalizing the result to a certain population. (Ghauri &
Groenhaug, 2005, p. 110)
As indicated in the previous part, a quantitative approach was planned. However in the process it
turned out that the results can just have descriptive/indicative character. Therefore it was conducted
to some extend as a qualitative one. This also corresponds with the recommendation by Ghauri &
Groenhaug (2005, p. 109) to choose the orientation that fits best the purpose.
5.3 Methods of Data Collection Fisher (2007, p. 61) names with
interviews,
questionnaires,
panels (including focus groups),
observation (including participant observation),
documents and
databases
six of the most common methods of research.
Interviews use structured approach where a researcher forms a list of questions to be answered.
Questionnaires employ structured approach too. Respondents are offered a number of options to
Page 24
5. METHODOLOGY
18
choose from. In this case the researcher looks mainly if certain defined patterns can be observed. An
example would be how often customers entering a supermarket turn first to the right. In panels the
Delphi technique is used. It means that questionnaires describing different scenarios are given to a
group of specialists. After answering, the averages of the reply are given to the specialists. After a
while another set is handed out to be answered again. This process can be seen as an iterations
process. Doing observation within these circumstances requires using a schedule. The highest form of
structure is in this case activity sampling. Documentary research means that one can analyze
documents in an open form to get understanding of a subject, as well as a pre-coded one to search
for particular things (for example keywords). This can also be a search in databases of for instance
libraries. (Fisher, 2007, p. 158ff)
The question if to use open or pre-structured methods is answered by the task that is faced. If the
aim is to get an idea of your field or of certain streams within the field of interest it is advisable to
take an open unstructured approach. However, if it is about quantifying special points of interest, or
get comparable results, pre-coded structured approach is the first choice. (Fisher, 2007, p 165)
In this research the two of the above-mentioned methods were used, namely search and analysis of
databases, and a questionnaire. The choice of the methods was conditioned by several factors. First,
theoretical basis had to be built on the basis of the existing researches in the field that could be
retrieved from scientific databases available at the university library. The search was pre-structured
with certain key-words provided. The authors did not have access to the company; therefore,
analysis of documents could not be included in the methods of the research. Second, questionnaire
was chosen for collection of empirical data. This choice was conditioned by the necessity of obtaining
comparable results, and quantitative method serves this purpose best. The details of the ways the
methods were applied are described in the following chapters.
5.4 Data Sources In a research two different kinds of data can be used – primary data and secondary data. (Ghauri &
Cateora, 2010, p. 157ff)
Primary data is the information that is collected for the special purpose of an ongoing research. This
can be done in a way that serves exactly the needs of the situation. Difficulties that can arise are
sampling, the willingness to respond, the language and comprehension, multicultural problems (does
every culture accept the same way of data collecting to the same extend?) or the ability to
communicate an opinion (do people see the use in a product that enables them to respond in a
proper way?). (Ghauri & Cateora, 2010, p. 160ff)
In contrast, secondary data is the information that was collected by another person/institution for a
different purpose. It is often easier to obtain than the primary data, but there is always concern
about its reliability and validity. There is a risk that this data can show a blurred or distorted picture
of the situation as it might have been collected to serve a certain purpose and was therefore
processed in a special way. (Ghauri & Cateora, 2010, p. 157f)
For this thesis both primary and secondary data was used. The secondary data was mainly for
theoretical basis and up-to-date information about the subject of the research. However, as it does
not provide the comprehensive answer to the research question, primary data was collected.
Page 25
5. METHODOLOGY
19
5.4.1 Secondary Data
In this research secondary data was used for building theoretical basis, as well as for collecting up-to-
date information about Volvo Cars and the brand. Among the sources of the data were scientific
journals, databases, online newspapers, web-pages, specialized printed magazines, and online
discussion panels.
Scientific papers was searched and reviewed according to their relevance to automobile industry and
the area of branding in context of mergers and acquisitions, and change of country of origin or
production. All the articles were retrieved from Mälardalen University databases, namely Emerald
and ABI. In addition, all of them are peer-reviewed, which is an indication of their reliability. Key
words used as search terms were “brand”, “brand image”, “Volvo”, “Car/Automobile Industry”,
“Country of Origin”, “Merger/Acquisition”.
For up-to-date information about the companies online newspapers were widely used. The authors
screened the information carefully including only facts and opinions from official and reputed
periodicals. The Local, The New York Times, Wall Street Journal, Die Welt, and Marketing Magazine
were among them. The articles in English and German languages were reviewed. The Volvo and
Geely company web-sites were used as the sources of statistics and official information.
The overview of the development of the Volvo brand required data from the previous decades,
which was impossible to obtain from the available researches and databases. Therefore, several
specialized printed magazines containing the necessary information were purchased through
www.ebay.de, namely Auto, Motor und Sport from 1975, 1978 and 1981 and Auto Rundschau from
1960. All the materials were in German.
The overview of the on-line discussions covered Volvo sections of specialized automobile forums, as
well as comments under the articles relevant to the topic of research.
5.4.2 Primary Data
Designing a Questionnaire
Fisher (2007, p. 192) recommends to keep a questionnaire as short as possible. He states
furthermore, that the structure should be logical. The limitation for a master thesis questionnaire is
seen by a maximum of four A4 sides. Personal questions should come in the last section, in the
beginning there should be questions that are easy to answer. Demographic questions are a tool to
check the representativeness. However, they should be limited in number. According to Ghauri &
Groenhaug (2005, p. 129ff) it is essential that the language is simple so that everyone is able to
understand it. Besides, they recommend checking the understandability by handing out
questionnaires to pre-test respondents. Each question should be specific and only contain one
aspect. They should be formulated polite but at the same time to mind and provocation of the
respondent as well as straightforward.
Choosing the Scale
Different scales can be used for measuring the constructs in a questionnaire. Dichotomous questions
offer two options (e.g. male/female, true/false). Multiple choice questions provide the respondents
with several possible answers. Multiple choice questions where the number of ticks is not limited are
named checklists. A scale with several numbers and named extremes are rating scales. On them, the
Page 26
5. METHODOLOGY
20
respondent is expected to mark the position between the extremes that corresponds best to his/her
opinion. Sometimes people are interested what is most and least essential for customers. In that
case ranking questions are used. They provide possible answers where the respondents can rank by
giving numbers, for example from 1 to 5. When the aim is to get information about peoples’ opinions
and attitudes, the Likert scale is commonly used. It provides statements (with positive or negative
tone) and while answering one has to decide to what extend he/she agrees with the statement
given. The semantic differential uses a bi-polar scale with adjectives that have opposite meaning and
each side (e.g. nothing/a lot). (Fisher, 2007, p. 193ff)
As already indicated by the topic of the thesis, it focuses on finding peoples’ attitudes towards the
brand. Therefore, Likert scale was chosen as the most suitable scale for the survey conducted within
this research.
How to Measure
There are four commonly known forms of measurement used in surveys. They are nominal, ordinal,
interval and the ratio scale. Nominal classifies objects by using numbers or objects. This is for
example used when classifying by gender, place of residence or religion. The average is formed by
using the mode (Ghauri & Groenhaug, 2005, p. 78f) which describes the value within those gathered
“that occurs most frequently” (Fink, 1995, p. 19). Ordinal scales are often used when it is known that
there is a relation between the elements but it is not possible to measure it in any form of a real
distance. To create an average, it is recommended to use the Median. (Ghauri & Groenhaug, 2005, p.
78f) To form this one the results have to be brought in order, starting with the lowest coming to the
highest value. The media lies exactly in the middle of the row of figures. The advantage is that it is
not very sensitive to extreme values. (Fink, 1995, p. 18f) The interval scale is the one where the
distances can be measured directly. Averages are produced with the mean (Ghauri & Groenhaug,
2005, p. 78f), in other words the arithmetic average. (Fink, 1995, p. 17) Ratio scale has an absolute
zero, for examples weight or altitude. Creating a valid average requires the use of mean. (Ghauri &
Groenhaug, 2005, p. 78f)
In the case of this thesis two forms of measurement were used. First, the nominal scale was used for
demographic questions like male/female. Averages have to be measured with the Mode. The
questions in the main part of the questionnaire were measured by ordinal scale.
Ethics within the Thesis
As we collect data we realize that ethical considerations should play a role in that work. To cope with
their demands we will follow recommendations given by Fisher (2007, 63ff), such as the right of
privacy. To respect that, the questionnaires were not personalized. Also the results in the analysis did
not draw any connection to any specific person. The results were only used within this thesis. The
authors do not see a possibility of the ethical problems arising as everything remains anonymous,
even to them.
Language and Comprehension
Creating a survey demands a good knowledge of the language in which it is carried out. In the case of
this research, German and English were used. The first one was covered by one of the authors as he
is a native speaker. The other one was translated by the other author as she was educated and has
Page 27
5. METHODOLOGY
21
working experience as a translator of the English language. To prevent mistakes and
misunderstandings, parallel translation was done, as recommended by Ghauri & Cateora. (2010, p.
161)
Validity and Reliability
The validity is a crucial factor in conducting a research. There are several forms of validity of which
two are relevant for us, namely internal and external.
Internal validity aims at the question if the results that were achieved within the study are true. This
if for example connected to the question if one thing is really influencing the other. Therefore, it
must not be the only influence, it is already enough if it is one amongst several. External validity asks
the question of whether the results that were achieved can be generalized. (Ghauri & Groenhaug,
2005, p. 65)
Several possible threats towards validity are known, such as history, maturation, test effect and
selection bias. History means that the case that is researched might have been influenced by an
external event that the study does not take in account. Maturation asks the question if the received
result is really a result from its suspected implication or if it is influenced by a side effect of the main
point. The test effect is the impact that the test situation itself could have on a response to a
question. The selection bias describes the situation that the group of people that was interviewed for
a study was not chosen by random. (Ghauri & Groenhaug, 2005, p. 65f)
Furthermore, there are groups that tend to use the extreme ends of the scale, whereas others tend
to make the cross in the middle of the scale. However, they can have the same or similar opinion.
Besides that, the result can be influences by personal factors such as the mood of the respondent. It
is also likely to happen that the respondents answer not according to their real opinion as there is
pressure or simply the marking of the scale was done in a not very comprehensible way. (Ghauri &
Groenhaug, 2005, p. 80)
To summarize, while validity answers the question if the observation can be seen as a real record of
the customers’ reaction that the researchers are interested in, reliability refers to the question
whether the same result can be achieved if the research is conducted by a different person in a
different place. (Sapsford & Jupp, 1996, 88ff)
This study cannot be free of threats towards validity, such as historical impact on the perception can
be seen the new design philosophy of Volvo (see 2.4 “The New Way of Volvo”). It is difficult to
measure the impact of this fact on the attitudes of the consumers. In addition, the authors
intentionally applied selection bias to the choice of respondents, since the research targeted people
who are likely to have better knowledge about and experience with the brand. Furthermore, it can
be expected that the test will be affected by people answering not completely according to their real
opinion. For example, participants can have an opinion and try to give it more weight by expressing it
in a more radical way. For this research it means that they put the cross more to the right or to the
left from what they would normally do. In addition, the authors did not have an opportunity to
handpick or control in any way the respondents; therefore, it can be assumed that the results of the
study represent the opinions of the most active part of the target group. The reliability of the
question is proved by a pre-test with several persons on how they understand the question.
Page 28
5. METHODOLOGY
22
Sampling
There are two categories of sampling – probability sampling and non-probability sampling. In
probability sample every unit has a non-zero chance of being included in the sample. In contrast,
non-probability sample does not enable the researcher to make conclusions about the whole
population. In other words, this kind of sampling is not representative. Nevertheless, it can be used
to get insight in a phenomenon or process, particularly in the qualitative research. (Ghauri &
Groenhaug, 2005, p. 146ff)
In this research non-probability sampling was used. The reason for that was the intentionally biased
selection of respondents. In addition, the study is not aiming at reaching the representativeness, as it
investigates an ongoing process. It attempts to spot a tendency and predict the possible changes
rather than quantify the established facts or patterns. The sample is formed of the visitors of Volvo
on-line forums, as they are the ones who are interested in the brand and have experience with it.
Furthermore, they are the first to obtain information and react to changes happening to the product
and the brand. As they are the active representatives of the informal Volvo “community”, they can
be seen as opinion leaders whose point of view is indicative of the current and future tendencies.
Creation of the Questionnaire
For the creation of the questionnaire there was especially information used that was collected in a
unstructured way during conducting brief interviews, reading scientific papers on the topic, articles in
newspapers and business magazines or discussions in online automobile forums. In the search the
topics of concern were identified. On that basis the questions to be asked were listed. Those were
categorized according to the types and characteristics of brand associations according to Keller’s
model in the conceptual framework: product-related attributes, brand personality, price, user
imaginary, usage imaginary, feelings and experiences, functional benefits, experiential benefit,
symbolic benefits, and strength, favorability and uniqueness of brand associations. All the questions
created were filtered and formulated as statements. Demographic questions were added as an
integral part of a survey.
The final version of a questionnaire consists of two parts. (See Appendix 4) The first part contains
questions concerning brand image based on the model by Keller (1998). The second part includes
demographic questions about age, gender and car ownership. Three versions of the questionnaire
were created. The first one described a Volvo car with Sweden mentioned as the country of brand
origin or country of manufacturing. The second questionnaire contained information that Volvo
brand was in the ownership of the Chinese company and produced in Sweden. The third version
instructed respondents that Volvo brand was owned by the Chinese company, and China was
mentioned as the country of manufacturing. The questionnaire offers a photo of sample car with
some implications on its equipment. The three-version design allowed observing the change of Volvo
brand image perception by consumers’ with the change of ownership and country of manufacturing.
The results of the first questionnaire were used as a control group, since they indicate the perception
of Volvo brand automatically classified as Swedish (Koubaa, 2007). The results obtained from the
second version illustrate the change in brand image perception in the current situation. Furthermore,
the data from the third version was used to make predictions about the change in Volvo brand image
perception if Volvo Cars put into action their plan of producing cars in China. The statements
included in the three questionnaires were identical. The types of brand associations from the model,
Page 29
5. METHODOLOGY
23
namely attributes, benefits, and attitudes and their subtypes were used as constructs of the survey.
The items were scored on a five-point Likert scale anchored by the terms “Strongly agree”, “Agree”,
“Neutral”, “Disagree” and “Strongly disagree”. As the sample car illustrated in the questionnaire
Volvo XC60 was chosen as this is the bestselling car at the moment (Volvo Car Corporation, 2010). So
we can assume that this meets most people’s preferences. An example is provided in Appendix 3.
The questions were formulated on the basis of current generally accepted characteristics of Volvo
brand (See 2.5 Volvo Brand) and their classification according to the brand image model by Keller
(See Figure 2). The constituents of Volvo brand pyramid (See Figure 1), namely safety, design,
environmental care, quality, consumer’s experience, and driving dynamics were taken as the basis
for developing the questions. They were analyzed according to description of various brand
associations and assigned in certain categories. Safety, quality, design, and technology, as an
attribute overlapping with the previous three, were classified as product-related attributes.
Environmental care was found to be corresponding to two non-product-related attributes, namely
usage imaginary and brand personality. Consumer’s experience was translated into usage imaginary
too. Driving dynamics was used as a basis for the question about experiential benefits. The question
on user imaginary was developed on the basis of the income and occupation of the Volvo consumer’s
profile (Liv, 2011) and formulated as “a confident successful person”. Symbolic benefits are closely
related to user imaginary (Keller, 1998), therefore the same characteristics of success and stability
were included in this category of questions. The question on price was developed on the real price of
the car depicted in the questionnaire. It was calculated by the car configuration function at
www.volvocars.com (Volvo Car Germany, 2011). Functional benefits are strongly connected to
product-related attributes and differ only in level of abstraction (Keller, 1998). Therefore, questions
on functional benefits were based on the previously defined product-related attributes, however,
they were rephrased in order to avoid repetition and make the similarity less obvious to the
prospective respondents. Question on the strength of brand association referred to safety and
quality of Volvo cars. The choice of safety was conditioned by its top position in the Volvo brand
pyramid (See Figure 1) and explanation by the company that they would like Volvo to be associated
with safety (Volvo Car Corporation, 2009). Quality was identified as a strong association of Volvo on
the basis of the discussions in the on-line forums. Reliability and care for family as parts of Volvo
brand personality were extracted from these discussions too (See further The Role of On-Line
Forums in the Process). The questions on attitude, uniqueness, and favorability of brand associations
were formulated in a general manner without specific relation to the characteristics of Volvo brand.
The Tool for Conducting the Survey
As tool for the online survey source www.onlineumfragen.com was identified as a suitable one. This
site appears to be developed and reputed, offers numerous possibilities as well as support in case of
problems. Onlineumfragen enables the users to create questionnaires, collect responses, and
statistically process the data. Moreover, this source has a large group of customers including the
ones with established names, such as Vodafone, Zeiss, UBS, Nokia, BMW or Stanford University. The
working language of the web-page is German; however this was no obstacle as one of the authors is
a native German speaker. An account was created on April 16, 2011. Initially, the free membership
was chosen. Later, however, the authors had to upgrade to professional membership, as the free one
put limitations that did not allow to conduct the survey in a desired way. The professional
membership cost 5 EUR.
Page 30
5. METHODOLOGY
24
Placement of the Questionnaire
For the research three countries were selected, namely USA, Great Britain and Germany. The choice
was not random. The top five largest markets for Volvo are USA, Sweden, Great Britain, Germany and
China (Volvo Car Corporation, 2010). The sales figures in each of the markets are presented in
Appendix 1. Sweden and China were deliberately omitted. Sweden is a home market of Volvo;
therefore Swedish consumers can feel closely related to and have a special attitude towards the
company and the brand. China, in its turn, is a base for Geely, which can affect the consumers’
opinions towards being more positive. Thus, consumers from the USA, Great Britain and Germany
were identified as having sufficient interest in the topic and providing a relatively objective point of
view.
The questionnaires were placed in specialized automobile on-line discussion panels, as the authors
viewed them as an effective way of reaching a sufficient number of respondents in a short period of
time. After thorough consideration the authors decided to choose the forums specifically targeting
Volvo owners in contrast to general discussions concerning various car brands. The intention was to
reach respondents who have interest, knowledge, and what is most important – experience with the
brand. In addition, people who are active in this kind of discussion panels are either current Volvo
owners or the ones planning to purchase a car. Therefore, their opinion is of importance as they are
the target group for Volvo Cars. The authors are aware that this limits the universal validity of the
result.
The criteria for selection of discussion panels were the number of registered participants and activity
of discussions, e.g. number of new threads, views and replies. Furthermore, the presence of general
discussion section was crucial for the choice of the forums. Several forums were discarded as being
not suitable as they contained only rubrics for special models or were specialized on certain aspects
like tuning or historic cars. After intensive search and analysis the following web-sources were
selected. www.motor-talk.de (Volvo part), founded in 2001, is the largest German-speaking forum
with its 1,700,000 registered participants. The next one is www.volvoforums.org.uk. It involves
61,098 registered members and covers a significant part of the British Volvo scene. Finally,
www.volvo-forums.com was selected among the forums available in the USA. It has 68, 788
registered members, and demonstrates higher activity in comparison to other American forums. The
questionnaires were placed under the general discussion rubrics. These online discussion panels
provided access to consumers in the German, British, and American markets. The authors are aware
that the on-line sources are open and generally available, therefore there is no guarantee that only
people from the target countries were among the respondents.
In order to place the questionnaires in the above mentioned forums, accounts were created and site
administrators were requested for permission. The first contact was made after the feedback on the
research plan was received from the thesis supervisor on April 21, 2011.
In the introduction e-mails the authors provided the information that seemed necessary for making
the decision and giving the consent. The background information (students, international marketing,
Mälardalen University) was included as well as a brief description of the project. Furthermore, it was
stressed that no personal data was going to be collected and processed.
As it was not possible to identify the responsible administrator of the special Volvo section on
http://www.motor-talk.de, an account was created and from that basis the forum-internal mail
Page 31
5. METHODOLOGY
25
service was used to request information. It was done on April 21, 2011. The reply was received on
April 25, 2011, telling the online-nickname of the responsible person. He or she was contacted
instantly, in the same way as it was done with www.volvoforums.org.uk. However, even after several
follow-up e-mails were sent, there was no reaction. Therefore, after careful check of the membership
rules in the forum, the decision was taken to post the questionnaire on May 4, 2011. An e-mail
informing the administrator about the action was sent. This decision was in some way supported by
the fact that several similar questionnaires had been previously posted in other sections of the
forum. On May 11, 2011, a week after the link to the questionnaire was posted, a reply from the
administrator was received. It said that as long as no personal information about the forum
participants was collected, the administration had no objections.
In the case of the British Volvo Forum (part of Volvo Club UK) the reply was received on April 25,
2011. It said “Under discussion and consideration. Will reply once decision reached”. As no further
reaction was obtained a follow up e-mail was sent on April, 29, 2011 reminding about the awaited
permission. On that same day the reply was received. It contained the request to send the link to the
questionnaire so that the case could be assessed. This was done immediately, however no reaction
was received. As the authors were pressed for time, they posted the questionnaire at their risk on
May, 4, 2011 under the following link http://www.volvoforums.org.uk/showthread.php?t=123795,
assuming that no reply gives a silent consent. In addition, it could be seen that the link that had been
provided to the site administrators was visited and two questionnaires were filled in. Thus, it was
assumed that the administrators were aware of the content of the questionnaire and had no
objections. In order to keep the situation transparent the authors sent another e-mail to the
administrators informing them that the initiative had been taken. Nevertheless, on May 12, 2011 a
reply from the administrator was finally received. The administrator expressed his dissatisfaction
with the unauthorized placement of the questionnaire, and informed that it would be given only
limited exposure and eventually would be deleted. The tone of the e-mail was quite personal and
emotional. The threat was put into action and on May 17, 2011 the questionnaire and the whole
thread of discussion was deleted. Thus, the survey period in this forum was two days shorter than in
the other two. This, however, was compensated by the active participation of the members, and the
authors were able to collect the data they intended to. Nevertheless, all the valuable opinions
expressed by the forum participants in the discussion thread were lost. This incident caused distress
and disappointment to the authors, as they had not broken any rules of the forum, and the decision
of the administrator was obviously based on personal motives.
The situation in the third forum http://www.volvo-forums.com was slightly different from the
previous two. Having no reaction from the forum administrators, the authors created an account,
and after the membership was confirmed and activated, they posted the questionnaire. It was done
on May 4, 2011. Afterwards no reaction from the administrators was received whatsoever.
As the questionnaires were placed in the forums, it appeared that the participants were willing to
involve in a discussion asking questions about the purpose and the character of the research. They
were also sharing their ideas about Volvo, expressing opinions about the survey and making
suggestions on its improvement. The authors were widely involved in the interaction, answering the
questions and commenting on the opinions.
In order to mitigate the influence of variations in the perception of Volvo in the three markets, the
three versions of the questionnaire were sequentially rotated through the forums. Thus, for each
Page 32
5. METHODOLOGY
26
version of the questionnaire the data from all the three countries was obtained. First rotation was
undertaken on May 10, 2011; the second one – on May 15. In such a way each version of the
questionnaire was being posted in each forum for an equal period of five days, except for one version
that was placed last in the British forum. As the thread was deleted on May 17, 2011 the link to the
questionnaire was exposed for only three days. The other two links to the questionnaires were
deactivated in the evening of May 19, 2011, which finished the data collection process.
The Role of Online-Forums within the Process
The forums mentioned above played an essential role during the whole time of creating the thesis. In
the beginning they were used for getting a general idea about the topic itself and about topics the
Volvo Car community is concerned about. Later they were used to make the questionnaires available
to the potential respondents. When this step was taken there was an unexpected development in a
way that forum members started to discuss besides filling in the questionnaires. This covered the
topic or provided additional information about own views/opinions on the situation. It was
excessively done especially in the German and the British forums. Some new interesting information
as well as implications helpful for understanding and for later interpretation were received. The
process was especially in the first time quite demanding as the authors put a lot of time in reading,
responding as well as encouraging the respondents to give even more information.
The development described showed, that in the German and the British forums an approach using
focus groups – as described by Ghauri & Groenhaug (2005, p. 140ff) - would also be possible.
As the volume of written responses would exceed a reasonable amount within this paper only some
constructive and helpful examples are provided in Appendix 5. The German examples were
translated by one of the authors of this thesis.
Sample Size
The total number of 172 responses was received through the survey. The distribution of responses
per questionnaire per country is presented in Table 1. For convenience and better understanding the
three versions of the questionnaire will be given the following codes:
Scenario A – referring to a car manufactured by Volvo Cars in Sweden;
Scenario B – referring to a car manufactured in Sweden by Volvo Cars owned by Geely;
Scenario C – referring to a car manufactured in China by Volvo Cars owned by Geely.
Table 1: Number of responses per questionnaire per country
Country Scenario A Scenario B Scenario C
USA 14 16 16
Great Britain 18 24 23
Germany 20 22 19
Total 52 62 58
Page 33
5. METHODOLOGY
27
The number of responses per questionnaire varies from 52 for Scenario A to 62 for Scenario B with
58 for Scenario C in between. The distribution of responses through the countries is slightly uneven
since the British and the German forums were more active than the one in the USA. Nevertheless,
the variations are not sufficient to influence the results considerably.
The analysis of demographic information about the respondents indicates that 151 out of 172
respondents are men (88%), whereas 21 are women (12%). As for the age, 7% respondents are under
25, 28% are between 25 and 35, 55% are between 35 and 55, and 10% of respondents are over 55
years old. 93% of respondents own a car, and 92% have owned a Volvo car at some point of their
lives. The received results indicate that the authors reached the respondent group they were
targeting, namely people who have knowledge and experience with the brand. The age and gender
characteristics of the respondents are very close the profile of an average Volvo owner (Volvo Car
Corporation, 2011; Liv – Das Volvo Magazin, 2011).
Processing the Data
In order to derive the conclusions from the obtained data, it was statistically processed. The answers
to the questions were given values from 1 to 5, namely: “Strongly agree” – 1, “Agree” – 2, “Neutral”
– 3, “Disagree” – 4, “Strongly disagree” – 5. Based on these values, the means were calculated for
each question. The means were chosen as the form to calculate the result, as they demonstrate
accurately even the slight differences in numbers and provide good ground for comparison. The
mean was calculated by the formula:
E (x) =
where:
X – frequency of responses,
Y – value of answers,
N – number of values. (Wackerly et al., 2008)
Adjusted to this particular case the formula is the following:
E (x) =
In addition, the percentage of responses was calculated and presented. The authors view it as being
necessary, since the percentage enables them to observe the distribution of responses and spot the
tendencies. The combination of the mean and percentage is viewed as being an effective way of
calculating and presenting the result, since it serves well the purpose of the research.
The calculations of the responses were obtained from the survey software www.onlineumfrage.com.
The means and percentages were calculated in Microsoft Excel.
Essential information to be mentioned here is, that according to Ghauri & Groenhaug (2005, p. 81)
the median is the statistically correct figure to process the data measures by ordinal scale, whereas
Page 34
5. METHODOLOGY
28
mean is applicable to data measured on interval or ratio scales. Thus, the median was derived from
the obtained results. However, in our case it is not possible to see differences or tendencies when
using it. As a result means are shown and used for supporting interpretation.
Page 35
6. EMPIRICAL RESULTS AND ANALYSIS
29
6. EMPIRICAL RESULTS AND ANALYSIS
This chapter presents the results of the primary data collection, their interpretation and analysis in
relation to the conceptual framework of this research. The results of the questions are grouped
according to the elements of brand image model by Keller (1998). The comparison of the results of
Scenario A and Scenario B provides the ground for analysis of the effect that change in country of
brand origin has on the brand image of Volvo. Further comparison with Scenario C illustrates the
effect that the change in country of manufacturing can have on it. In case that the sum of the
percentages is no exactly 100 %, this is due to the rounding in Microsoft Excel.
6.1 Product-related attributes
Product-related attributes are physical properties of the product that determine the level of its
performance (Keller, 1998, p.93f). Under product-related attributes, such characteristics of Volvo as
safety, quality, design, and level of technology were tested. Further the results, analysis, and
interpretation for each question and scenario are provided.
This car provides safety to the driver and passengers
The responses to the statement calculated in means and percentages are presented in Table 2 and
Table 3 respectively.
Table 2: Product-related attributes, Safety. Means
Scenario A Scenario B Scenario C
Mean 2,08 1,74 2,53
The figures in Table 2 demonstrate that in Scenario A there is a strong tendency towards “Agree”
that was attributed the value of 2. In Scenario B the tendency moves slightly closer to “Strongly
agree” that has the value of 1. In Scenario C, however, the mean goes down to the middle between
“Agree” and “Neutral”. The percentage in frequency distribution presented in Table 3 gives a detailed
picture of these tendencies.
Table 3: Product-related attributes, Safety. Percentages
Strongly Agree Agree Neutral Disagree Strongly
Disagree
Scenario A 19 % 54 % 27 % 0 % 0 %
Scenario B 45 % 35 % 19 % 0 % 0 %
Scenario C 19 % 31 % 28 % 22 % 0 %
As can be seen in Table 3, in Scenario A the total of 73 % agree with the statement, of them 19 %
strongly agree, whereas 27 % are neutral. In Scenario B the total of 80 % respondents agree, of them
45 % strongly agree, and 19 % are neutral. No disagreement is expressed by the respondents.
Scenario C indicates a different distribution of responses. The total of 40 % agree, of them 19 %
Page 36
6. EMPIRICAL RESULTS AND ANALYSIS
30
strongly agree, and 28 % are neutral about the statement. In contrast to Scenario A and B, quite a
large part of respondents – 22 % express disagreement.
Thus, it can be concluded from the results that Volvo brand, managed and manufactured in Sweden
is viewed by the overwhelming majority of respondents as providing safety, and this opinion
becomes even stronger with the Chinese acquisition of Volvo. However, a Volvo car produced in
China is believed to provide lower level of safety. Almost a quarter of respondents think that this car
does not provide safety to the driver, and passengers.
This is a high-quality car
As demonstrated in Table 4, the mean values illustrate the tendency leading to “Agree” in Scenario A,
that slightly goes up in Scenario B, and goes down considerably in Scenario C.
Table 4: Product-related attributes, Quality. Means
Scenario A Scenario B Scenario C
Mean 2,37 2,24 2,91
The distribution of responses in percentages is presented in Table 5 below.
Table 5: Product-related attributes, Quality. Percentages
Strongly Agree Agree Neutral Disagree Strongly
Disagree
Scenario A 15 % 44 % 29 % 12 % 0 %
Scenario B 23 % 47 % 23 % 0 % 8 %
Scenario C 5 % 34 % 38 % 9 % 14 %
The total of 59 % of respondents agree that a Swedish-owned Volvo car manufactured in Sweden has
high quality, of them 15 % strongly agree, 29 % are not decided about the statement, and 12 %
disagree with it. For a Volvo car, owned by Geely, the percentage of agreement is even higher with
the total of 70 % and 23 % of “Strongly agree”. 23 % are neutral, whereas 8 % of respondents express
extreme disagreement. The proportion of disagreement increases in Scenario C amounting to the
total of 23 %, of which 14 % is strong disagreement. The proportion of the undecided respondents is
higher too compared to the previous two scenarios – 38 %. Thus, the percentage of the agreement is
the lowest of the three scenarios, amounting to the total of 39 % with only 5 % of strong agreement.
The tendency of response distribution indicates that slightly more than a half of respondents assess
the quality of all-Swedish Volvo car as high. After the Chinese acquisition the quality of the car is
viewed as being higher, even though some extreme disagreement is expressed. However, if the same
car is produced in China, the opinion about its quality tends to become less positive. Obviously, many
respondents are either skeptical, or undecided about the quality of such a car.
Page 37
6. EMPIRICAL RESULTS AND ANALYSIS
31
This car offers a distinctive and superior design.
Table 6: Product-related attributes, Design. Means
Scenario A Scenario B Scenario C
Mean 2,31 2,34 2,52
As can be seen in Table 6, the mean demonstrates that the opinions are close to agreement with the
tendency towards neutrality. The figures for Scenarios A and B are nearly equal, whereas in Scenario
C the mean is in the middle between agreement and neutrality. The more detailed results in
percentages are shown in Table 7.
Table 7: Product-related attributes, Design. Percentages
Strongly Agree Agree Neutral Disagree Strongly
Disagree
Scenario A 15 % 46 % 31 % 8 % 0 %
Scenario B 11 % 60 % 21 % 0 % 8 %
Scenario C 14 % 45 % 21 % 17 % 3 %
In Scenario A the Volvo car is believed to have distinctive and superior design by the total of 61 % of
respondents. 31 % are neutral to the statement, whereas 8 % do not agree with it. In Scenario B the
proportion of respondents who view it as having good design is equal to the total of 71 %, of them 11
% strongly agree. 21 % do not have a definite opinion, whereas 8 % strongly disagree. The proportion
of disagreement increases considerably in Scenario C, amounting to the total of 20 %. Agreement is
expressed by the total of 59 %, which is the lowest of the three scenarios.
The all-Swedish Volvo car is viewed as having good design by more than a half of respondents. It is
interesting that almost one third of respondents are not decided about the design of Volvo, and
some even express disagreement with the statement. As for the Chinese-owned Volvo, it seems that
a part of the undecided ones shifts toward agreement. The comparison of the numbers indicates that
the Chinese-owned Volvo is believed to have better design than the all-Swedish one. However, if the
car is made in China, the undecided respondents tend to shift to disagreement with the high level of
its design, whereas the proportion of agreement is almost the same as for the all-Swedish Volvo. It
should be noted that the opinions about the design of Volvo made in China vary considerably, and
both extremes have their advocates.
Page 38
6. EMPIRICAL RESULTS AND ANALYSIS
32
This car is designed according to high technological standards.
Table 8 below provides the calculated means of the responses to the statement.
Table 8: Product-related attributes, Technological standards. Means
Scenario A Scenario B Scenario C
Mean 1.77 2.27 2.38
The means indicate the tendency to smoothly go down with each scenario. Scenario A demonstrates
clearly agreement with the tendency to strong agreement. In Scenario B the agreement is slightly
directed towards neutrality. In Scenario C it moves further down towards neutrality.
The results in percentage are provided in Table 9.
Table 9: Product-related attributes, Technological standards. Percentages
Strongly Agree Agree Neutral Disagree Strongly
Disagree
Scenario A 46 % 31 % 23 % 0 % 0 %
Scenario B 18 % 48 % 26 % 5 % 3 %
Scenario C 26 % 40 % 9 % 22 % 3 %
As can be seen in Table 9, in Scenario A the total of 77 % express agreement with the statement. The
remarkable 46 % of them strongly agree. The remaining 23 % are neutral to the statement. No
disagreement is observed. The total percentage of respondents that express agreement in Scenario B
is slightly lower compared to Scenario A – 66 %, of which only 18 % strongly agree. 8 % of
respondents disagree, of which 3 % even strongly disagree. 26 % do not have a definite opinion. In
Scenario C the opinions are quite polar. The impressive total of 66 % still agree with the statement, of
them 26 % strongly agree. The percentage of neutral opinions is as low as 9 %. However, a quarter of
the respondents express disagreement.
The opinions about the high level of technology of the all-Swedish Volvo appear to be very positive.
The absence of disagreeing responses is worth mentioning in this case. The situation, however,
changes with the growing presence of China in Volvo. The opinions split with a large number of
respondents still believing in the high technological level of Volvo, and a growing skepticism about it.
It can be concluded that the image of China attached to Volvo brings doubts about the level of
technology.
Discussion
The product-related attributes, such as safety, quality, and design demonstrate a similar tendency.
Merely positive result for the all-Swedish Volvo becomes even better with the Chinese acquisition.
However, when the car is manufactured in China, the opinions turn towards less positive, but the
level of disagreement is never higher than a quarter. This result was unexpected, but the explanation
Page 39
6. EMPIRICAL RESULTS AND ANALYSIS
33
was found in the comments left by the survey-takers in the discussion panels. According to them,
Volvo has lost its positions in the recent years of Ford ownership. Therefore, the change in ownership
and management is welcomed by the long-term Volvo owners. In addition, these results can be
explained by the strength of Volvo brand in these aspects, which are defined by the company as the
essential constituents of the Volvo brand pyramid (Volvo Car Corporation, 2009). Another
explanation is high expectations that respondents have about the change in the company that is
going to bring large investments in Volvo. Nevertheless, the opinions about the car manufactured in
China tend to become skeptical. Apparently, the respondents admire the idea of Chinese investments
in Volvo, but do not view China as an appropriate manufacturing country for Volvo. This result is in
line with the conclusions of Koubaa (2007) who suggests that the highly-reputed brands, such as
Volvo is considered to be, suffer erosion and depreciation if the manufacturing is moved from a
country with more positive country image to a country with less positive image. The difference in the
effects of the change in COB and COM supports the results of the research by Fetscherin and Toncar
(2009) who concluded that in automobile industry COM exerts greater influence on the brand image
than COB.
Regarding the level of technology, the tendency is slightly different. The opinions on this attribute of
Volvo become less positive with the Chinese acquisition, and they continue degrading when China is
mentioned as the country of manufacturing. As suggested by Koubaa (2007), negative image of COO
can overcome even strong brands. Apparently, this is the example of such a case when the image of
China as a low-technology cheap manufacturing country seems to be stronger than the brand image
of Volvo.
6.2 Non-Product-Related Attributes
According to the conceptual framework, non-product-related attributes comprise associations about
brand personality, user and usage imaginary, feelings and experiences, and price (Keller, 1998). The
results on theses brand associations are presented below.
6.2.1 Brand personality
Brand personality associations refer to the human characteristics that consumers attribute to the
brand (Keller, 1998). Within these associations, such traits of Volvo brand as reliability, care for
family and environment were put in focus.
I can rely on this car in every situation
The results in means and percentages are provided in Table 10 and Table 11.
Table 10: Brand personality, Reliable. Means
Scenario A Scenario B Scenario C
Mean 2,54 2,52 2,66
The development of means indicates a slight decline from Scenario A to C. There seems to be an
improvement from Scenario A to B, however, the difference of 0,02 is not significant to make
assumptions on that basis. So it can be concluded that it remains.
Page 40
6. EMPIRICAL RESULTS AND ANALYSIS
34
Table 11: Brand personality, Reliable. Percentages
Strongly Agree Agree Neutral Disagree Strongly
Disagree
Scenario A 8 % 46 % 31 % 15 % 0 %
Scenario B 15 % 39 % 31 % 10 % 5 %
Scenario C 9 % 41 % 31 % 14 % 5 %
As illustrated in Table 11, in Scenario A the total 54 % of respondents agree that the brand has
reliability in its image. 31 % do not have a definite opinion about it. The total 15 % express
disagreement, of them 5 % strongly disagree. Scenario B indicates a rise in the proportion of strong
agreement from 8 % to 15 % compared with Scenario A. At the same time the percentage “Agree”
goes down by 7 %. Thus, the total is the same in Scenario A and B. However, in Scenario B the
distribution of responses is more scattered as 5 % of those that expressed disagreement have
changed towards “Strongly Disagree” option. It can be concluded that the general tendency is almost
the same in Scenario A and Scenario B, and the means indicate clearly. Nevertheless, Scenario B
shows wider distribution of answers, where extreme opinions gain more weight in comparison with
Scenario A. Scenario C indicates a slight decline in the proportion of agreement – the total is 50 %, of
which 9 % strongly agree. The percentage of respondents who do not agree with the statement rises
to the total of 19 % - the highest of the three scenarios. Interestingly, the proportion of neutral
responses is the same in all the three scenarios.
Overall, the opinions about the reliability of Volvo are stable. The Chinese ownership brings a slight
improvement, which is however not significant enough to provide basis for valid conclusions. What
can be concluded is that the situation worsens a little in case of the Volvo car manufactured in China.
This car communicates care for family
The processed results in means and percentages are shown in Table 12 and Table 13 respectively.
Table 12: Brand personality, Caring for family. Means
Scenario A Scenario B Scenario C
Mean 1,90 2,15 3,66
Scenario A presents high level of agreement with a tendency towards strong agreement. In Scenario
B the numbers still indicate agreement but are slightly directed towards neutrality. Scenario C
indicates drastic change, as the mean is strongly directed towards disagreement.
Page 41
6. EMPIRICAL RESULTS AND ANALYSIS
35
Table 13: Brand personality, Caring for family. Percentages
Strongly Agree Agree Neutral Disagree Strongly
Disagree
Scenario A 29 % 52 % 19 % 0 % 0 %
Scenario B 19 % 56 % 19 % 0 % 5 %
Scenario C 0 % 7 % 38 % 38 % 17 %
As the numbers in Table 13 show, the mean of Scenario A is a result of a cumulative agreement,
which is expressed by 81 % of respondents. The remaining 19 % are not decided about the
statement. No disagreement is observed. In Scenario B agreement is still the dominant opinion with
the total of 75 % of respondents agreeing with the statement; of them 19 % strongly agree. However,
5 % respondents switched to a “Strongly disagree“ position. Scenario C presents a striking difference
from the previous two scenarios. Only 7 % of respondents still agree with the statement, whereas the
total of 55 % express disagreement. 17 % of them strongly disagree. More than one third of
respondents – 38 % are undecided about it.
To summarize, the respondents think that a Volvo car produced in China loses its message of care for
family. Simply put, if one cares about the family he or she would not choose a Volvo made in China.
This car communicates care for environment.
Table 14 and Table 15 below present the calculated means and percentages of the responses.
Table 14: Brand personality, Caring for environment. Means
Scenario A Scenario B Scenario C
Mean 2,31 3,03 3,66
As can be seen Table 14, the mean in Scenario A indicates agreement with the visible tendency to
neutral. In Scenario B the mean demonstrates that the opinions are centered on neutral, whereas
Scenario C has strong tendency towards disagreement.
Table 15: Brand personality, Caring for environment. Percentages
Strongly Agree Agree Neutral Disagree Strongly
Disagree
Scenario A 17 % 35 % 48 % 0 % 0 %
Scenario B 0 % 26 % 50 % 19 % 5 %
Scenario C 0 % 7 % 38 % 38 % 17 %
Page 42
6. EMPIRICAL RESULTS AND ANALYSIS
36
Table 15 illustrates that in Scenario A the total of 52 % of respondents agree with the statement,
whereas 48 % are neutral to it. There are no disagreeing opinions. As soon as the Chinese
involvement starts with ownership in Scenario B, the proportion of agreement goes down to 26 %
with 0 % of strong agreement. The percentage of undecided respondents is nearly the same, but as
many as 24 % respondents do not agree. This number increases in Scenario C where already 55 %
respondents express disagreement with the statement. Only 7 % of respondents still agree, and 38 %
do not a definite opinion.
It can be inferred from the numbers that the growing Chinese involvement in the brand image of
Volvo exerts negative effect on its “environmentally friendly” brand personality. Apparently, the
brand personality of Volvo as a caring, environmentally-friendly car is degraded by the image of
China.
Discussion
According to the obtained results, the brand personality of Volvo appears to be strongly influenced
by the change in country of brand origin and country of manufacturing. Of the three elements of
Volvo brand personality, reliability remains unaffected by the Chinese acquisition and the change in
place of manufacturing. In contrast, such traits of Volvo brand personality as care for family and care
for environment deteriorate drastically with the growing involvement of China in the brand. The
most disturbing signal in this context is degradation of care for nature as an element of the Volvo
brand personality, since care for environment is one of the core values of Volvo (Urde, 2003). Overall,
the results confirm the conclusions of the research by Wang (2008) who suggests that negative COO
image exerts detrimental effect on the brand personality and downplays its role in the consumers’
purchase intention.
6.2.2 User Imaginary
User imaginary is the picture of a typical brand user. It can be based on demographic criteria, as well
as more abstract psychographic characteristics. (Keller, 1998, p. 95f) In this particular case, the
psychographic image of a Volvo driver is under scrutiny.
Confident successful people choose this car
The calculated means and percentages of response distribution are provided in Table 16 and Table 17
respectively.
Table 16: User imaginary. Means
Scenario A Scenario B Scenario C
Means 2,15 2,85 2,76
Table 16 demonstrates that in Scenario A the mean indicates the tendency towards agreement
slightly directed to neutrality. In Scenarios B and C this directedness becomes stronger, and the
means come close to 3 denoting neutrality. The difference between the means in Scenario B and
Scenario C is not significant, therefore it cannot provide basis for valid inferences. The distribution of
responses in percentage presented in Table 17 provides a clearer picture.
Page 43
6. EMPIRICAL RESULTS AND ANALYSIS
37
Table 17: User imaginary. Percentages
Strongly Agree Agree Neutral Disagree Strongly
Disagree
Scenario A 17 % 50 % 33 % 0 % 0 %
Scenario B 10 % 34 % 32 % 10 % 15 %
Scenario C 17 % 28 % 28 % 18 % 10 %
The opinion about the typical Volvo user being a confident successful person appears to be positive,
since the total 67 % - two thirds of respondents agree with the statement. The remaining 33 % are
neutral. No disagreement is expressed. Scenario B indicates significant changes in the distribution of
responses. The total 44 % of respondents express agreement and 25 % disagree while the level of
neutral opinions remains nearly the same. In Scenario C a slight improvement can be observed due
to the larger proportion of respondents expressing strong agreement. Nevertheless, the cumulative
agreement is the same as in Scenario B, whereas the proportion of disagreement is slightly higher
amounting to the total 28 %.
Discussion
The Chinese involvement in the Volvo brand exerts negative influence on the user imaginary of
Volvo. The difference between Chinese-owned and Chinese-manufactured Volvo is not significant.
Apparently, the respondents are not sure that a confident successful person would drive a Volvo
related in any way to China, whether through ownership or through manufacturing. This appears to
be a problem since the new management of Volvo intends to carry on with the strategy of presenting
Volvo as a premium segment car (Zöllter, 2010).
6.2.3 Usage Imaginary
Usage imaginary refers to the ideas that consumers typically have about the way the brand is used
(Keller, 1998, p. 96). The comfort and impact on environment of the Volvo car was put in focus.
This car is comfortable to use.
The numeric presentation of responses to this statement is provided in Table 18 and Table 19.
Table 18: Usage imaginary, Comfort. Means
Scenario A Scenario B Scenario C
Means 2,19 2,65 2,48
As can be observed in Table 18, the mean in Scenario A demonstrates agreement with the statement,
even though a slight tendency towards neutrality can be observed. Scenario B has already a strong
directedness towards neutral opinion, which bounces back a bit in Scenario C towards agreement.
Page 44
6. EMPIRICAL RESULTS AND ANALYSIS
38
Table 19: Usage imaginary, Comfort. Percentages
Strongly Agree Agree Neutral Disagree Strongly
Disagree
Scenario A 15 % 50 % 35 % 0 % 0 %
Scenario B 11 % 39 % 32 % 10 % 8 %
Scenario C 16 % 38 % 34 % 7 % 5 %
Table 19 shows that in Scenario A the total of 65 % of respondents agree with the statement; of them
15 % strongly agree. The remaining 35 % are neutral to it. No disagreement is expressed. In Scenario
B the total proportion of agreement goes down to 50 %, whereas 18 % disagree with the statement.
Scenario C demonstrates a similar distribution of opinions – the total 54 % agree, 34 % are neutral,
and 12 % disagree.
The results clearly demonstrate that the respondents assess the all-Swedish Volvo as being
comfortable. The Chinese-owned Volvo has fewer admirers of its comfort. Surprisingly, the Volvo
made in China is viewed as being slightly more comfortable. The reason for this is not clear and can
also not be derived from the discussions in the forums. What can be concluded with certainty is that
the comfort of usage is negatively influenced by the involvement of China in the brand image of
Volvo.
Using this car brings minimum harm to the environment
Table 20 and Table 21 contain the calculated results in means and percentages.
Table 20: Usage imaginary, Harm to Environment. Means
Scenario A Scenario B Scenario C
Means 2,69 3,03 3,19
It can be observed in Table 20 that from Scenario A to Scenario C there is a steep decrease of
indicators. Scenario A the mean indicates agreement with strong tendency towards neutrality,
Scenario B is clearly neutral, and Scenario C is still neutral, but slightly directed towards
disagreement.
Page 45
6. EMPIRICAL RESULTS AND ANALYSIS
39
Table 21: Usage imaginary, Harm to Environment. Percentages
Strongly Agree Agree Neutral Disagree Strongly
Disagree
Scenario A 8 % 31 % 46 % 15 % 0 %
Scenario B 8 % 26 % 39 % 26 % 5 %
Scenario C 3 % 17 % 45 % 26 % 9 %
As can be seen in Table 21, the general tendency going through the three scenarios is the decreasing
proportion of agreement and increasing proportion of disagreement. The total percentage of
respondents expressing agreement with the statement goes down from 39 % in Scenario A to 34 % in
Scenario B, and to 20 % in Scenario C. The disagreement goes up from 15 % to 31 %, and to 35 % in
the three scenarios respectively. The large proportion of respondents who do not have a definite
opinion in all the three scenarios should be noted.
The results of the survey clearly demonstrate that the growing involvement of China in the brand
image of Volvo affects negatively the respondents’ ideas of the impact the usage of the Volvo car has
on environment. This echoes with the tendency spotted in the element of care for environment in
the brand personality of Volvo.
The relatively large proportion of the respondents with neutral opinion can be explained in two ways.
First, the respondents might be simply not interested in this aspect of the car usage. Second, the
result could be caused by the design of the questionnaire. As one of the respondents mentioned in
the forum discussion, the depicted XC60 did not go in line with the idea of environmental
friendliness. Thus, the respondents could have been misled by the photo of the car included in the
questionnaire. Nevertheless, the photo was the same in all the three versions of the questionnaire;
therefore, the comparability of the obtained data was not influenced.
Discussion
The obtained results on usage imaginary of the Volvo brand indicate that the two examined aspects
are negatively affected by the change in the country of brand origin and country of manufacturing.
Regarding comfort of usage, it does not seem possible to observe the difference in impact of the
change of COB and COM. In contrast, the impact of the car usage on environment is viewed as being
more detrimental when the car is produced in China than when Volvo is only owned by the Chinese
company, which goes in line with the conclusions of Fetscherin and Toncar (2009) about COM having
a stronger influence than COB in the automobile industry.
6.2.4 Feelings and Experiences
This non-product-related attribute refers to emotions and ideas that consumers connect to the brand
in their minds (Keller, 1998, p.96f). In this case the role of emotion and reason in the brand image of
Volvo were under examination.
Page 46
6. EMPIRICAL RESULTS AND ANALYSIS
40
The idea of having this car is exciting.
The processed results of this statement are presented in means and percentages in Table 22 and
Table 23 respectively.
Table 22: Feelings and experiences, Excitement. Means
Scenario A Scenario B Scenario C
Mean 2,87 2,87 2,91
As shown in Table 22, the means are close to characteristic 3 with a tendency towards agreement in
all the three scenarios. The figures presented in Table 23 present the situation in more details.
Table 23: Feelings and experiences, Excitement. Percentages
Strongly Agree Agree Neutral Disagree Strongly
Disagree
Scenario A 0 % 38 % 37 % 25 % 0 %
Scenario B 15 % 27 % 29 % 15 % 15 %
Scenario C 17 % 22 % 29 % 14 % 17 %
In Scenario A the respondents omitted the extremes of “Strongly agree” and “Strongly disagree” and
centered the responses around the neutral, while in Scenario B the situation appears to be more
scattered – the extremes got each 15 %. Thus, in Scenario B the total of 42 % respondents agree with
the statement. At the same time the cumulative 30 % disagree. The distribution of responses is even
more polar in Scenario C where the extremes rise to 17 % each.
Even though the means do not show any difference among the three versions of Volvo, the analysis
of the response distribution reveals an interesting tendency. While the all-Swedish Volvo does not
evoke much of emotions in the respondents’ minds, the change in ownership and country of
manufacturing brings visible tension and the rise of emotions from very positive to very negative. It
seems as if some respondents were curious and excited about the forthcoming changes, whereas
some totally skeptical and resistant to them.
Page 47
6. EMPIRICAL RESULTS AND ANALYSIS
41
Choosing this car is a logical and reasoned decision.
Table 24: Feelings and experiences, Reason. Means
Scenario A Scenario B Scenario C
2,50 2,63 3,07
The means in Table 24 show gradual decline from Scenario A to Scenario C. In Scenario A and B the
means indicate agreement with the strong tendency towards neutrality. Scenario C goes down to
neutrality with even a slight directedness towards disagreement.
Table 25: Feelings and experiences, Reason. Percentages
Strongly Agree Agree Neutral Disagree Strongly
Disagree
Scenario A 8 % 42 % 42 % 8 % 0 %
Scenario B 0 % 61 % 19 % 15 % 5 %
Scenario C 0 % 31 % 38 % 24 % 7 %
As illustrated in Table 25, the distribution of responses provides a clearer picture of the opinions. In
Scenario A 50 % of respondents agree with the statement; of them 8 % strongly agree. 42% are
neutral, and 8 % disagree. In Scenario B the cumulative percentage of agreement is higher – 61 %,
but no strong agreement is expressed. The total proportion of disagreement rises to 20 %, whereas
the neutral goes down to 19 %. Scenario C shows the tendency towards decrease in the percentage
of agreement – 31 %; and increase in disagreement – the cumulative 31 %.
Once again the involvement of China in the brand image of Volvo brings polarity in the respondents’
opinions. Nevertheless, the proportion of the agreeing respondents indicates the improvement in the
image of Volvo under Chinese ownership, and degradation of the image of Volvo manufactured in
China. The similar development pattern is observed in product-related attributes, and it can be
assumed that the logics and reason of choice of Volvo can be related to them. Simply put, logics
would suggest that one should buy a Volvo car with good characteristics, such as safety, quality, good
design, and technology. Apparently, if the car is made in China and does not possess these
characteristics, then it is not reasonable to buy it.
6.2.5 Price
This non-product-related attribute refers to the beliefs that consumers have about the price and
value of the brand (Keller, 1998, p. 95). The price was calculated by the car configuration function at
www.volvocars.com (Volvo Car Germany, 2011). It was initially calculated in euro and then converted
into U.S. dollars.
Page 48
6. EMPIRICAL RESULTS AND ANALYSIS
42
This car is worth more than 65000 $.
The processed results in means and percentages can be seen in Table 26 and Table 27.
Table 26: Price. Means
Scenario A Scenario B Scenario C
Mean 3,85 3,92 3,66
The analysis of the figures in Table 26 shows that the price rating experiences an unexpected
development. All the three scenarios have means very close to 4 denoting “Disagree”. Against the
awaited result the trend is less negative in Scenario C compared to Scenarios A and B. Nevertheless,
the differences among the three scenarios are not significant enough to draw conclusions from them.
Table 27: Price. Percentages
Strongly Agree Agree Neutral Disagree Strongly
Disagree
Scenario A 0 % 10 % 33 % 21 % 37 %
Scenario B 5 % 0 % 26 % 37 % 32 %
Scenario C 3 % 10 % 28 % 34 % 24 %
From the data provided in Table 27 it becomes clear that the overwhelming majority of the
respondents express disagreement with the statement. The cumulative percentage of disagreement
is 58 % in Scenario A, 69 % in Scenario B, and 58 % in Scenario C. At the same between one quarter
and one third are not decided. The proportion of agreement is as low as 10 % in Scenario A, 5 % of
strong agreement in Scenario B, and 10 % of agreement and 3 % strong agreement in Scenario C.
The obtained results can be interpreted in two ways. One way can be to conclude that the
respondents view Volvo cars as being overpriced, regardless of ownership and place of
manufacturing. The other way is to admit the shortcomings of the statement formulation. As
mentioned before, the price was derived from the car configuration function at www.volvocars.com
in the German section. Several problems could be connected with this. First, the authors overlooked
the fact that the prices in the U.S. market are in average lower than in the E.U (Grundhoff, 2010).
Second, Germany has higher prices on automobiles compared to other European countries
(European Commission, 2010); therefore the German respondents could be more positive about the
price than, for example, the British. Finally, another factor was that even though the photo of CX 60
was just an illustration, the price was calculated for exactly this model. Thus, the respondents could
get confused since at first they were asked the questions about a Volvo car in general, and then they
had to access the pricing of a particular model.
Page 49
6. EMPIRICAL RESULTS AND ANALYSIS
43
6.3 Benefits
6.3.1 Functional Benefits
Functional benefits are usually related to product-related attributes, and refer to intrinsic advantages
of the product or service (Keller, 1998, p. 99). The functional benefits of space, less frequent
repairing, and technical support are put in focus. They are related to such product-related attributes,
as design, quality, and level of technology respectively.
This car provides enough space for traveling
The processed results in means and percentages are presented in Table 28 and Table 29 respectively.
Table 28: Functional Benefits, Space. Means
Scenario A Scenario B Scenario C
2,02 2,31 2,0
The means in Table 28 indicate that the opinions are centered at the agreement. In Scenario B the
slight tendency towards neutrality can be observed.
Table 29: Functional Benefits, Space. Percentages
Strongly Agree Agree Neutral Disagree Strongly
Disagree
Scenario A 21 % 63 % 8 % 8 % 0 %
Scenario B 13 % 60 % 15 % 10 % 3 %
Scenario C 19 % 62 % 19 % 0 % 0 %
As it can be seen in Table 29, in all three scenarios the proportion of cumulative agreement is quite
large – 84 % in Scenario A, 73 % in Scenario B, and 81 % in Scenario C. The percentage of
disagreement shows an unexpected fact that Scenario C is the only one with 0% disagreement. At the
same time Scenario A has 8 % disagreement, and Scenario B – 13 %, of which 3 % is strong
disagreement.
Clearly, Volvo cars are viewed as the ones designed to provide enough space for comfortable
travelling. The improvement of the results for the Chinese-owned and Chinese-manufactured Volvo
comes as a total surprise to the authors. The explanation cannot be found in either the literature, or
the respondents’ comments. The opinions about the spaciousness of the Volvo cars appear to be
more positive than about their design. Even though the results of the two questions demonstrate a
certain degree of correlation, it is obvious that the respondents think that there is more to design
than just space.
Page 50
6. EMPIRICAL RESULTS AND ANALYSIS
44
This car will not require frequent repairing
Table 30 and Table 31 provide the results in means and percentages.
Table 30: Functional Benefits, Repairing. Means
Scenario A Scenario B Scenario C
Mean 2,73 2,84 2,93
As can be seen in Table 30, the means indicate agreement with strong tendency towards neutrality in
all the three scenarios. From Scenario A to Scenario C the means closer approach 3 used to denote
neutrality.
Table 31: Functional Benefits, Repairing. Percentages
Strongly Agree Agree Neutral Disagree Strongly
Disagree
Scenario A 4 % 27 % 62 % 8 % 0 %
Scenario B 5 % 32 % 50 % 0 % 13 %
Scenario C 0 % 28 % 59 % 7 % 7 %
The numbers in Table 31 show that in Scenario A surprisingly large part of the respondents do not
have a definite opinion about the statement – 62 %. Almost one third – 31 % - agree with it; of them
4 % strongly agree. 8 % express disagreement. Scenario B has more polar distribution of opinions.
The cumulative 37 % agree, 50 % are neutral, and 13 % strongly disagree. In Scenario C the
proportion of the respondents expressing agreement is 28 %, neutrality – 59 %, and disagreement –
14 %.
Even though the means show the best result for the all-Swedish Volvo, the distribution of responses
demonstrates that the Volvo under Chinese ownership has the largest proportion of followers,
whereas the Volvo manufactured in China has the smallest proportion of the agreeing opinions. This
pattern follows the one in the product-related attribute of quality.
If I have this car I will have good technical support from the manufacturer
The processed results in means and percentages are presented in Table 32 and Table 33 respectively.
Table 32: Functional Benefits, Technical support. Means
Scenario A Scenario B Scenario C
Mean 2,42 2,89 2,79
The means provided in Table 32 indicate agreement with the tendency towards neutrality. In
Scenario A this tendency is the weakest, in Scenario B it is the strongest of the three. The difference
Page 51
6. EMPIRICAL RESULTS AND ANALYSIS
45
between the means of Scenario B and C is not significant; therefore, it does not give the ground for
making inferences.
Table 33: Functional Benefits, Technical support. Percentages
Strongly Agree Agree Neutral Disagree Strongly
Disagree
Scenario A 10 % 38 % 52 % 0 % 0 %
Scenario B 5 % 35 % 35 % 15 % 10 %
Scenario C 7 % 33 % 40 % 16 % 5 %
As depicted in Table 33, the distribution of responses in Scenario A shows the large proportion of
respondents who are neutral to the statement – 52 %. The remaining 48 % either agree, or strongly
agree. No disagreement is expressed. In contrast, in Scenario B the total of 25 % of the respondents
disagree; of them 10 % strongly disagree. The cumulative 40 % agree with the statement; and 35 %
are neutral. In Scenario C the distribution pattern is similar – the total of 40% agree, 21 % disagree,
and 40 % are neutral.
The consumers consider the all-Swedish Volvo appears to be most trustworthy of the three in terms
of after-sale technical support. The Chinese-owned and Chinese-manufactured Volvo lose the
respondents trust, and collect quite polar opinions. Apparently, the change in the country of brand
origin exerts negative influence on the ideas about the technical support of Volvo. The influence in
the change of country of manufacturing cannot be observed. The development pattern in this
question resembles the one in the question about the related question about the attribute of
technological standards of Volvo.
Discussion
To summarize, the functional benefits of Volvo follow the development pattern of the product
related attributes. The results for the all-Swedish Volvo are not as positive as expected; however, the
comparison with the Chinese-owned Volvo and Chinese-manufactured Volvo provides the basis for
inferences. The respondents expect the improvement of the situation after the acquisition; however,
are skeptical about the production in China. These results find theoretical support in studies by
Koubaa (2007), Fetscherin and Toncar (2009), and Wang (2008). The exception here is the benefit of
space, where the development pattern comes into conflict with the anticipated results, and no
explanation in the previous research can be found.
Page 52
6. EMPIRICAL RESULTS AND ANALYSIS
46
6.3.2 Experiential Benefits
Experiential benefits refer to how it feels to use a product or service (Keller, 1998, p.100). In this
respect the ease and pleasure of driving A Volvo car was put in focus.
Driving this car is easy and pleasant
Table 34 and Table 35 contain the numerical presentation of the responses to this statement.
Table 34: Experiential Benefits. Means
Scenario A Scenario B Scenario C
Mean 2,23 2,85 2,76
In Scenario A the mean is close to 2 denoting agreement that, however, marks a little tendency
towards characteristic 3 standing for neutrality. In Scenario B the mean develops strongly towards
neutral. The same can be said about Scenario C. The difference between Scenario B and C is not
significant enough to make conclusions about real differences.
Table 35: Experiential Benefits. Percentages
Strongly Agree Agree Neutral Disagree Strongly
Disagree
Scenario A 15 % 46 % 38 % 0 % 0 %
Scenario B 15 % 26 % 32 % 15 % 13 %
Scenario C 12 % 28 % 40 % 14 % 7 %
As made obvious in Table A, in Scenario A the cumulative majority of 61 % express agreement with
the statement. The remaining 38 % are neutral to it. No disagreement is expressed. In Scenario B the
respondents are less positive (the total of 41 %) and less neutral (32 %). There appears to be a shift
towards disagreement that is summed up into 28 %. In Scenario C the tendency is slightly different.
The proportion of agreement is nearly the same as in Scenario B, however, the percentage of
disagreement goes down to the cumulative 21 % giving rise to the neutral opinions that amount to
40 %.
Discussion
It can be observed that the opinions about the experiential benefit of the all-Swedish Volvo car are
generally positive. Further, the trend towards lower expectations of the car with the Chinese
involvement can be noticed. However, the difference between the Chinese-owned Volvo and
Chinese-manufactured Volvo is not significant. It seems that the latter one is slightly more positive,
but if neutrality is interpreted as a wait-and-see position this can change fast. This is a disturbing
signal, since driving experience is included in the brand pyramid of Volvo and is defined as being
essential for the premium segment cars (Volvo Cars Corporation, 2009).
Page 53
6. EMPIRICAL RESULTS AND ANALYSIS
47
6.3.3 Symbolic Benefits
Symbolic benefits refer to the consumer’s deeper needs of self-expression or social approval. It
usually correlates with the non-product-related attribute – user imaginary. (Keller, 1998, p. 99) Since
a user imaginary of a confident successful person was examined previously, the symbolic benefits of
success and stability were put into focus.
This car symbolizes success.
The calculated results in means and percentages are provided in Table 36 and Table 37.
Table 36: Symbolic Benefits, Success. Means
Scenario A Scenario B Scenario C
Means 2,56 3,03 3,03
As can be seen in Table 36, the means show a development from agreement level with tendency
towards neutral in Scenario A to a relatively stable “neutral” in Scenarios B and C. Scenarios B and C
are equal.
Table 37: Symbolic Benefits, Success. Percentages
Strongly Agree Agree Neutral Disagree Strongly
Disagree
Scenario A 10 % 44 % 37 % 0 % 10 %
Scenario B 5 % 26 % 45 % 10 % 15 %
Scenario C 3 % 24 % 48 % 14 % 10 %
Table 37 demonstrates that in Scenario A the cumulative 54 % of the respondents agree with the
statement that the car symbolizes success. At the same time 37 % do not have a definite opinion.
The total of 10 % expressed disagreement. The distribution of responses in Scenario B and C shows
that the Chinese involvement affects the level of agreement negatively. The proportion of the
respondents that disagree is almost equal – the total of 25 % and 24 % in Scenario B and C
respectively. The cumulative percentage of agreement is slightly different – 31 % in Scenario B and
27 % in Scenario C. It can be observed that in Scenario B the distribution of opinions is more polar
that in Scenario C with both extremes having more weight.
The respondents do not seem persuaded about the Volvo car being a symbol of success. A little more
than a half of the respondents believe that the all-Swedish Volvo symbolizes success. The Chinese
ownership and manufacturing in China bring this belief even lower down. Obviously, the respondents
do not think that a Chinese Volvo can be a symbol of its owner’s success.
Page 54
6. EMPIRICAL RESULTS AND ANALYSIS
48
This car symbolizes stability.
The calculated means and percentages of responses to this statement are provided in Table 38 and
Table 39 respectively.
Table 38: Symbolic Benefits, Stability. Means
Scenario A Scenario B Scenario C
Means 2,21 2,81 2,84
As Table 38 shows, the mean in Scenario A indicates agreement with the slight directedness towards
neutrality. In the Scenario B and C this directedness becomes stronger approaching very close to
characteristic 3 denoting neutrality.
Table 39: Symbolic Benefits, Stability. Percentages
Strongly Agree Agree Neutral Disagree Strongly
Disagree
Scenario A 17 % 63 % 10 % 0 % 10 %
Scenario B 5 % 39 % 32 % 19 % 5 %
Scenario C 5 % 38 % 34 % 12 % 10 %
Table 39 illustrates that Scenario A offers a comfortable level of cumulative 80 % of agreement. A
minority of 10 % of respondents remain neutral and 10 % disagree. In Scenario B and C the
distribution of responses is very similar. In Scenario B the total 44 % agree, 32 % are neutral, and the
total 24 % disagree. In Scenario C 43 % agree, 34 % are neutral, and 22 % disagree.
The obtained results show that the convincing majority of the respondents view the all-Swedish
Volvo as a symbol of stability. The Chinese ownership brings certain skepticism in their opinions. The
effect of the manufacturing in China cannot be observed – the difference in the responses
distribution is not significant enough to provide ground for interpretation.
Discussion
The symbolic benefits of success and stability of Volvo appear to be negatively influenced by the
change in the country of brand origin. The effect of the change in country of manufacturing cannot
be observed. The tendencies observed in the symbolic benefits of Volvo repeat those in the user
imaginary, as suggested by Keller (1998). The concept of success and stability of Volvo embodied in
both user imaginary and symbolic benefits of the brand suffer from the Chinese involvement.
Page 55
6. EMPIRICAL RESULTS AND ANALYSIS
49
6.4 Attitude
Attitudes refer to the overall evaluation of the brand in the consumers’ minds. They are usually
formed with consideration to the brand’s attributes and benefits. (Keller, 1998, p.100)
I have an overall positive attitude to this car.
The calculated results of the attitude measurement are presented in Table 40 and Table 41.
Table 40: Attitude, means
Scenario A Scenario B Scenario C
Mean 1,85 2,24 2,48
As shown in Table 40, the mean indicates clear agreement with a slight tendency towards strong
agreement in Scenario A. In Scenario B and C the increasing directedness towards neutrality can be
observed.
Table 41: Attitude, percentages
Strongly Agree Agree Neutral Disagree Strongly
Disagree
Scenario A 23 % 69 % 8 % 0 % 0 %
Scenario B 18 % 60 % 13 % 0 % 10 %
Scenario C 14 % 52 % 17 % 7 % 10 %
The numbers in Table 41 illustrate that Scenario A forms an overwhelming majority of 92 %
respondents agreeing with the statement, of them 23 % strongly agree. Only 8 % percent can be
found in the “neutral corner”. No disagreement is expressed. In Scenario B the situation is less
positive. Even though the total of 78 % still agree with the statement, the number of neutrals rises to
13 %, and 10 % of respondents express extreme disagreement. The degrading tendency becomes
even more visible in Scenario C where the total percentage of agreement goes down to 62 %, and the
percentage of disagreement rises to the cumulative 17 %.
Discussion
To summarize, the respondents have very positive attitude towards Volvo, which however, degrades
steeply with the change to Chinese ownership and manufacturing. Nevertheless, even Volvo owned
by Geely and manufactured in China evokes positive attitude in two thirds of the respondents. This
indicates the strength of the brand and a certain level of immunity to changes of country of brand
origin and country of manufacturing.
Page 56
6. EMPIRICAL RESULTS AND ANALYSIS
50
6.5 Strength of Brand Associations
Brand associations are characterized by how strongly they are connected to the brand in consumers’
minds. Strength of brand associations defines what consumers recall first in relation to the brand.
(Keller, 1998, p. 103ff) The Volvo brand pyramid (See Figure 1) places safety on top. In addition, the
description of it says that the company wants consumers to think of safety when they think of Volvo
(Volvo Car Corporation, 2010). Therefore, the strength of the association with the attribute of safety
is under examination.
Safety is the first thing that comes to my mind when I see this car.
Table 42 and Table 43 present the results to this question in means and percentages respectively.
Table 42: Strength of Brand Associations, Safety. Means
Scenario A Scenario B Scenario C
Mean 2,21 2,26 2,71
The means in Table 42 demonstrate agreement with the tendency towards neutrality. In Scenario A
and B the means are almost equal, whereas in Scenario C the mean is strongly directed towards
neutrality.
Table 43: Strength of Brand Associations, Safety. Percentages
Strongly Agree Agree Neutral Disagree Strongly
Disagree
Scenario A 23 % 37 % 37 % 3 % 0 %
Scenario B 21 % 50 % 16 % 8 % 5 %
Scenario C 14 % 41 % 22 % 5 % 17 %
As stated in Table 43, in Scenario A the total of 60 % respondents agree with the statement, 37 % are
neutral to it, and 3 % disagree. Scenario B demonstrates more polar results – the cumulative 70 %
agree, 16 % are neutral, 8 % disagree, and 5 % strongly disagree. In Scenario C the tendency towards
disagreement becomes obvious – the total 22 % respondents disagree; of them 17 % strongly
disagree. The proportion of agreement goes down to the cumulative 55 %, whereas the neutral
opinions rise to 22 %.
Thus, despite the unexpectedly large proportion of neutral responses, it can be concluded that the
association of the all-Swedish Volvo with safety is quite strong. It becomes even stronger for the
Chinese-owned Volvo, but appears to be weaker for the car manufactured in China. Nevertheless,
even in the worst-case scenario more than half of the respondents strongly associate Volvo with
safety. This pattern echoes with the tendency observed in the question about safety as a product-
related attribute (See 6.1 Product-Related Attributes). From these two questions it can be concluded
Page 57
6. EMPIRICAL RESULTS AND ANALYSIS
51
that the respondents strongly associate Volvo with safety, have expectations for its improvement
with the change of ownership, but doubt the safety of the Volvo cars manufactured in China.
When I look at this car I think about its high quality.
The numeric presentation of responses to this question is provided in Table 44 and Table 45. Table 44
contains the means, whereas Table 45 – percentages.
Table 44: Strength of Brand Associations, Quality. Means
Scenario A Scenario B Scenario C
Means 2,54 2,47 2,97
As depicted in Table 44, in Scenario A and B the means indicate agreement with the tendency to
neutrality. In Scenario C the means is very close to 3 denoting neutrality. The difference between the
means of Scenario A and B is not significant enough to provide basis for conclusions.
Table 45: Strength of Brand Associations, Quality. Percentages
Strongly Agree Agree Neutral Disagree Strongly
Disagree
Scenario A 0 % 56 % 35 % 10 % 0 %
Scenario B 16 % 37 % 34 % 10 % 3 %
Scenario C 7 % 38 % 24 % 14 % 17 %
The percentages in Table 45 illustrate the development well. Scenario A benefits from a majority of
56 % supporting the statement, 10 % of the respondents disagree with it, and 37 % remain
undecided. The cumulative percentage of agreement in Scenario B is lower than in Scenario A,
however 16 % out of 53 % strongly agree in Scenario B, which makes the result into more positive.
Nevertheless, 3 % of respondents express extreme disagreement. In Scenario C the proportion of
cumulative agreement goes down to 45 %, and the disagreement rises to 31%, of which 17 % is
strong disagreement. The percentage of neutral opinions is the lowest of the three scenarios
amounting to only 24 %.
The analysis of distribution of responses gives the possibility to conclude that the involvement of
China in the brand image of Volvo brings tension into the distribution of opinions. Nevertheless,
Volvo under Chinese ownership seems to have the strongest association with quality in the
respondents’ minds, whereas Volvo made in China – the weakest. This pattern echoes with the one
in the results for quality as a product-related attribute of Volvo and the functional benefit connected
to it.
Discussion
The associations of Volvo brand with safety and quality are fairly strong. The development pattern
through the three scenarios of Volvo ownership and production resembles the patterns observed in
Page 58
6. EMPIRICAL RESULTS AND ANALYSIS
52
the product-related attributes of safety and quality. These attributes improve with the Chinese
acquisition and degrade with the Chinese production. In the similar way the associations with these
attributes become stronger with the change in ownership and weaker with the change in the location
of production, which goes in line with the studies of Koubaa (2007) about the vulnerability of high-
reputed brands to change in manufacturing location and the research by Fetscherin and Toncar
(2009) about the prevailing strength of COM over COB in the car manufacturing industry.
6.6 Uniqueness of Brand Associations
Uniqueness of brand associations is determined by the fact whether they are shared by other brands
or not. Unique brand associations make the brand different from the competitors and provide
compelling reasons for consumers to choose this brand over the others. (Keller, 1998, p. 108f)
No other car possesses the same qualities as this one.
The results of this question in means and percentages are presented in Table 46 and Table 47
respectively.
Table 46: Uniqueness of Brand Associations. Means
Scenario A Scenario B Scenario C
Means 3,63 3,32 3,67
As can be seen in Table 46, the means in all the three scenarios demonstrate the dominance of
neutral opinions with the tendency towards disagreement. In Scenario A and C this tendency is
stronger than in Scenario B.
Table 47: Uniqueness of Brand Associations. Percentages
Strongly Agree Agree Neutral Disagree Strongly
Disagree
Scenario A 0 % 10 % 27 % 54 % 10 %
Scenario B 5 % 21 % 32 % 21 % 21 %
Scenario C 7 % 0 % 29 % 47 % 17 %
The numbers in Table 47 demonstrate that the distribution of opinions in all the three scenarios is
characterized by an unexpectedly large proportion of disagreement. In Scenario A the total 64 % of
respondents disagree with the statement, only 10 % agree, and 27 % are neutral. Scenario B presents
a slightly more favorable picture – disagreement goes down to 42 %, agreement and neutral rise to
the total of 26 % and 32 % respectively. Nevertheless, the strong tendency to disagreement is again
observed in Scenario C – the total 64 % of respondents disagree with the statement; of them 17 %
strongly disagree. Strong agreement is expressed by 7 % of respondents, and 29 % do not have a
definite opinion.
Page 59
6. EMPIRICAL RESULTS AND ANALYSIS
53
Discussion
The obtained results describe quite an unfortunate situation for Volvo. It appears that the brand
does not have unique brand associations, and does not stand out among its competitors in the
consumers’ minds. The Chinese acquisition seems to have a positive effect on the uniqueness of the
Volvo brand; however, the manufacturing in China nullifies this slight positive change. Apparently,
the respondents do not think a car produced in China can be unique in any way. The situation looks
even more disturbing, if the character of the respondent group is taken into consideration. It is
surprising that the participants of on-line Volvo forums who have first-hand and often long-term
experience with the brand do not view it as being unique. The plausible explanation was found in the
comments that the survey-takers were leaving in the discussion panel. According to them, Volvo lost
its distinctive features, such as safety, simplicity, and spaciousness, during the Ford period when the
brand was pushed into the premium segment where it failed to establish itself. Thus, Volvo lost its
traditional image, and its uniqueness got dissolved in the competition. The slightly better results for
Volvo under Chinese ownership are explained by the high expectations that the respondents have
about the change in the company. In the discussion they express hope that Geely will take Volvo back
to pre-Ford stage.
6.7 Favorability of Brand Associations
According to Keller (1998), brand associations can vary depending on how positively they are
evaluated in consumers’ minds. Positive evaluation is called favorability of brand associations.
I have an overall positive impression of this car.
Table 48: Favorability of brand associations. Means
Scenario A Scenario B Scenario C
Mean 1,88 2,26 2,48
As illustrated in Table 48, in Scenario A the mean indicates agreement with a slight tendency towards
strong agreement. In Scenario B and C the means still demonstrate agreement, which is, however,
directed towards neutrality. Table 49 shows the distribution of responses in per cents.
Table 49: Favorability of brand associations. Percentages
Strongly Agree Agree Neutral Disagree Strongly
Disagree
Scenario A 21 % 69 % 10 % 0 % 0 %
Scenario B 13 % 63 % 15 % 5 % 5 %
Scenario C 12 % 52 % 19 % 10 % 7 %
In Scenario A an overwhelming majority of 90 % respondents express agreement with the statement,
of them 21 % strongly agree. Only 10 % percent take the neutral position. No disagreement is
Page 60
6. EMPIRICAL RESULTS AND ANALYSIS
54
observed. In Scenario B the situation is slightly less positive. Even though the total of 76 % still agree
with the statement, the number of neutrals goes up to 15 %, 5 % of respondents express
disagreement, and another 5 % even strong disagreement. The degrading tendency becomes more
conspicuous in Scenario C where the total percentage of agreement falls to 64 %, and the percentage
of disagreement rises to the cumulative 17 %.
Overall, the respondents have very positive impression of Volvo, which can be interpreted into
favorability of brand associations. As was expected, it degrades steadily with the change to Chinese
ownership and manufacturing. Nonetheless, even Volvo owned by Geely and manufactured in China
is favored by almost two thirds of the respondents. This result correlates with pattern observed in
the question about the attitude, where the respondents have very positive attitude towards Volvo
despite the degrading tendency with the increasing involvement of China.
Page 61
7. CONCLUSION
55
7. CONCLUSION
The results of the conducted research enable the authors to make certain conclusions about the
effect that the acquisition by Geely had on the brand image of Volvo. Even though the acquisition
took place only a year ago and its effect on the model portfolio is yet to be observed, the change has
already found its reflection in the brand image of Volvo. The character of this change is complex and
somewhat ambiguous, since various aspects of the brand image were affected in different ways.
Unexpectedly, the essential attributes of Volvo brand, such as safety, quality, and design were found
to be influenced in a positive way. Volvo cars produced after the acquisition by Geely are perceived
as providing higher safety, better quality and design than before. The association of Volvo with these
attributes became stronger too. This improvement can be the result of the large investments that
Volvo is expected to receive from the new parent company. Nevertheless, the level of technology as
the attribute of the brand image suffered losses after the Chinese takeover. What is of particular
interest is that the acquisition has added uniqueness to the brand image of Volvo. Apparently, the
combination of the Swedish production and the Chinese management makes Volvo stand out among
other car manufacturers in the consumers’ minds. In addition, excitement and curiosity strengthened
their position in the emotional component of the Volvo brand image. At the same time the
improvement in the essential attributes such as safety, quality, and design ascertained the image of
Volvo brand as being a logical and reasoned choice for the consumers.
The more intangible aspects of the Volvo image, however, were affected negatively by the
acquisition. To specify, Volvo brand seems to be losing its association with care for environment.
Even though it has been one of the core values of Volvo for decades, it is now challenged by the
involvement of the image of China. Care for family has undergone similar changes, that are however
of milder character. Furthermore, the image of a typical Volvo owner appears to be changing. The
association with a successful confident person as a driver of a Volvo car has become weaker. Similar
conclusion can be made about the symbolic value of the brand image. Volvo as a symbol of success
and stability in its owner’s life started losing its positions. As a sum of all the transformations
happening to the brand image, the consumers’ attitude towards Volvo became less positive. Despite
this, the brand still has a large margin of safety and great support from the consumers.
As mentioned before, it has only been a year since the acquisition, and the brand image, as well as
the company itself, is still at the transition stage. Consumers are still not sure where this change is
going to lead and prefer to take the “wait-and-see” position. The further development in the brand
image of Volvo is largely dependent on the branding strategy and managerial decisions of the new
management. As this research showed, the widely discussed plan of producing cars in China is going
to have detrimental effect on the brand image of Volvo. The idea of China being the production
location for Volvo hits hard on all the elements of the brand image. The long-term essentials of
Volvo, such as safety, quality, technology, and design become depreciated for the consumers. Care
for environment suffers severe losses. Uniqueness and symbolic value of the brand are downgraded.
Consequently, the attitude towards Volvo produced in China is to become less and less positive.
Suggestions for Further Research
After the tendencies are clear and the major points of concern are indicated in this paper, the
authors recommend that a study of similar character should be conducted after the transition stage
Page 62
56
of Volvo is finished. Then the established fact can be studied through a large quantitative research,
and the conclusions of this thesis can be confirmed or refuted.
Page 63
REFERENCES
57
REFERENCES Aaker, D. (July, 1992) The Value of Brand Equity. Journal of Business Strategy. 13
Abrahams, D. (2008) Brand Risk. Abingdon, Oxon, GBR: Gower Publishing Limited. Retrieved on
March 20, 2011 from http://site.ebrary.com/lib/malardalen/docDetail.action?docID=10215578
Achterholt, U., Schmid, R. (2008) A rough road: The effects of today’s financial crisis on the global
automotive industry. KPMG. Retrieved on April 2, 2011 from http://www.kpmg.com/Ca/en/
IssuesAndInsights/ArticlesPublications/Documents/A-rough-road-financial-crisis.pdf
Ahmed, S., d'Astous A. (2001) Canadian Consumers' Perceptions of Products Made in Newly Industrializing East Asian Countries. IJCM, 11 (1)
Alter S. (1985 September 23) Strong Brand Names Attract Takeover Bids. Advertising Age, p.73
Amann, T. (2009 February) KPMG´s EMIAT 2/2009: Indien gibt bei Auslandsinvestments seine
Führungsrolle an China ab. KPMG. Retrieved on April 2, 2011 from http://www.kpmg.de/
WasWirTun/15888.htm
AMS. (2008 September 19) Volvo XC60: Hybrid- und Diesel-News. Auto Motor und Sport. Retrieved
on April 3, 2011 from http://www.auto-motor-und-sport.de/news/volvo-xc60-hybrid-und-diesel-
news-693563.html
AMS. (2011 February 21) Volvo V60 Plug-in-Hybrid auf dem Genfer Autosalon: Volvo-Diesel-Hybrid
kommt 2012. Auto Motor und Sport. Retrieved on April 3, 2011 from http://www.auto-motor-und-
sport.de/eco/volvo-v60-plug-in-hybrid-auf-dem-genfer-autosalon-volvo-diesel-hybrid-kommt-2012-
3351482.html
Auto, Motor und Sport (1978, November 8). Die Einsteiger: Vier Möglichkeiten in die automobile
Oberklasse einzusteigen: BMW 518, Citroen CX 2000 Confort, Mercedes-Benz 200, Volvo 244 L. Auto,
Motor und Sport, 23/1978, p. 116 – 127
Brandsher, K. (1999 January 9) International Business; Ford buys Volvo Car unit in bid to lift profile of
luxury models. The New York Times. Retrieved on April 2, 2011 from
http://www.nytimes.com/1999/01/29/business/international-business-ford-buys-volvo-car-unit-bid-
lift-profile-luxury-models.html
Calabrese, G. (2001) R&D globalization in the car industry. Int. J. Automotive Technology and
Management. Vol. 1, No. 1, pp.145–159.
Chapman, M. (2010 August 4) Volvo emphasizes cars' beauty with global campaign. Marketing Week.
Retrieved on April 3, 2011 from: http://www.marketingweek.co.uk/sectors/automotives/volvo-
emphasises-cars-beauty-with-global-campaign/3016705.article
Page 64
REFERENCES
58
Dietkirchen, O. (2010 November 10) Der Volvo V60 ist schön, aber unpraktisch. Die Welt. Retrieved
on April 3, 2011 from: http://www.welt.de/motor/modelle/article10828048/Der-Volvo-V60-ist-
schoen-aber-unpraktisch.html
Doran, J. (2006 August 3) Jaguar’s future in the balance as ford reviews its weakest assets. The
Sunday Times. Retrieved on April 2, 2011 from http://business.timesonline.co.uk/
tol/business/industry_sectors/engineering/article699080.ece
Enjoji, Kaori (2011, Feb. 25th), Volvo Cars to Manufacture Autos in China in 2013: CEO. CNBC.
Retrieved on June 8, 2011 from http://www.cnbc.com/id/41770404/Volvo_Cars_to_Manufacture_
Autos_in_China_ in_2013_CEO.
European Commission (January 1, 2010), Car Prices Within the European Union. European Union.
Retrieved on May 20, 2011 from
http://ec.europa.eu/competition/sectors/motor_vehicles/prices/2010_07_full.pdf
Evans, M., Jamal, A., Foxall, G. (2010). Consumer Behaviour. John Wiley & Sons Ltd.
Fangfang, L. (2010 March 29) Geely buys Volvo in biggest overseas foray. China Daily. Retrieved on
April 2, 2011 from http://www.chinadaily.com.cn/china/2010-03/29/content_9653260.htm
Fetscherin, M. (2009) The effects of the country of brand and the country of manufacturing of
automobiles. International Marketing Review, 27 (2). Retrieved on March 27, 2011 from
http://www.emeraldinsight.com/journals.htm?issn=02651335&volume=27&issue=2&articleid=1853
515&show=html
Fink, A. (1996) How to analyze survey data. Thousand Oaks, California: SAGE Publications
Finkelstein, S. (2002) The DaimlerChrysler Merger. Tuck School of Business at Dartmouth. Retrieved
on April 2, 2011 from http://mba.tuck.dartmouth.edu/pdf/2002-1-0071.pdf
Fisher, C. (2007) Researching and writing a dissertation: A guidebook for business students. 2nd
edition. Harlow: Prentice Hall
Foxhall, J. (2007 October) Volvo’s new XC60. Auto Express. Retrieved on April 2, 2011 from
http://www.autoexpress.co.uk/carreviews/firstdrives/210733/volvo_xc60.html
Garret, J. (2006 January 22) Does Saab has a future within the G.M. Family?. The New York Times.
Retrieved on April 2, 2011 from http://www.nytimes.com/2006/01/22/automobiles/22SAAB.html
Geely. (2011). Company Overview. Retrieved on April 4, 2011 from geely.com/brands/
international/company_overview.html
Ghauri, Pervez N. & Cateora, Philip (2010). International Marketing. 3rd edition. Berkshire: McGraw-
Hill Education
Page 65
REFERENCES
59
Ghauri, Pervez N. & Groenhaug, Kjell (2005), Research Methods in Business studies: A practical guide.
3rd edition. Harlow: Prentice Hall
Glaberson, W. (1987 September 8) Ford buys prestigious car maker. The New York Times. Retrieved
on April 2, 2011 from http://www.nytimes.com/1987/09/08/business/ford-buys-prestigious-car-
maker.html
Grundhoff, S. (November 10, 2010). US-Autopreise: Premium zum Discount-Tarif. Zeit Online.
Retrieved on May 20, 2011 from http://www.zeit.de/auto/2010-11/autopreise-usa?page=2
Grünweg, T. (2010 September 20) Riskanter Kurswechsel. Manager Magazin. Retrieved on April 2,
2011 from http://www.manager-magazin.de/lifestyle/artikel/0,2828,715864,00.html
Handelsblatt. (2009 December 29). Geely – der merkwürdige Autobauer aus China. Retrieved on April
12, 2011 from http://www.handelsblatt.com/unternehmen/industrie/geely-der-merkwuerdige-
autobauer-aus-china/3335404.html?p3335404=all
Keller, K. (1998) Building, Measuring and Managing Brand Equity. Prentice hall
Koubaa, Y. (2008) Country of origin, brand image perception, and brand image structure. Asia Pacific
Journal of Marketing and Logistics, 20 (2). Retrieved on March 27, 2011 from
http://www.emeraldinsight.com/journals.htm?issn=13555855&volume=20&issue=2&articleid=1728
302&show=html
Lee, H. (2011) Brand Image Strategy Affects Brand Equity after M&A. European Journal of Marketing,
45 (7/8). Retrieved on March 28, 2011 from http://www.emeraldinsight.com/search. htm?st1=Brand
+Image+Strategy+Affects+Brand+Equity+after+M%26A&ct=all&go=Go
Leyrer, G. (1975, February 15). Test: Volvo 244 DL. Auto, Motor und Sport, 04/1975, p. 56 – 63
Leyrer, G. (1981, April, 22). Alter Schwede: Test Volvo 264/ 264GLE – Volvo-Spitzenmodell mit
Sechszylindermotoren. Auto, Motor und Sport, 08/1981, p. 94 – 100
Lin, L. (2006) The influence of the country-of-origin image, product knowledge and product
involvement on consumer purchase decisions: an empirical study of insurance and catering services
in Taiwan. Journal of Consumer Marketing, 23 (5). Retrieved on March 28, 2011 from
http://www.emeraldinsight.com/journals.htm?issn=07363761&volume=23&issue=5&articleid=1567
351&show=html
Liv – Das Volvo Magazin (2011). Mediadaten 2011: Kundprofil. Retrieved on May 12, 2011 from
http://www.wdv.de/media/LIV_Mediadaten_2011.pdf
Manager Magazin. (2011 January, 5). Geely kauft Volvo: Angriff in der Oberklasse. Retrieved on April
11, 2011 from http://www.manager-magazin.de/fotostrecke/fotostrecke-63260.html
McNamara, P. (2006 July 25). Volvo C30 (2006): first official pictures. Car Magazine. Retrieved on
April 3, 2011 from http://www.carmagazine.co.uk/News/Search-Results/First-Official-Pictures/Volvo-
C30/
Page 66
REFERENCES
60
Mendenhall, W., Scheaffer. R.L., Wackerly, D.D.,, Mathematical Statistics with Applications. -
Duxbury Press, 2001, 6th Edition
Mepham, D., Heard, C. (2006 January 4) The Volvo C30 Project – dynamic young urban customers in
the Spotlight. Volvo Cars of Canada Corp. Retrieved on April 2, 2011 from
https://www.media.volvocars.com/download/media/articles/.../3467_3_2.aspx
Millward, D. (2007 December 18) Jaguar and Land Rover set for Indian takeover. The Telegraph.
Retrieved on April 2, 2011 from http://www.telegraph.co.uk/news/uknews/1572933/Jaguar-and-
Land-Rover-set-for-Indian-takeover.html
Nicholson, C. (2010 August 2). Chinese Carmaker Geely Completes Acquisition of Volvo from Ford. The
New York Times. Retrieved on April 12, 2011 from http://www.nytimes.com/ 2010/08/03/business/
global/03volvo.html
Salarna et al. (2005). Mergers and Acquisition: Three international case studies. Deutsche Bank;
Bankers Trust; British Petroleum-Amoco; Ford-Volvo. Journal of European industrial training. Emerald
Group Publishing Ltd.
Sapsford, Roger & Jupp, Victor (1996). Data Collection and Analysis. London: Sage Publications
Shirouzu N. (2011 February 7) Volvo: Swedish Company with Chinese Characteristics? Wall Street
Journal. Retrieved on May 2, 2011 from http://blogs.wsj.com/chinarealtime/2011/02/07/volvo-
swedish-company-with-chinese-characteristics/?KEYWORDS=volvo+cars+sales
Strach P., Everet A. (2006) Brand corrosion: mass-marketing’s threat to luxury automobile brands
after merger and acquisition. Journal of Product & Brand Management, 15(2) Emerald publishing
group
Thanasuta et al (2009). Brand and country of origin valuations of automobiles. Asia Pacific Journal of
Marketing and Logistics, 21 (3) Retrieved on March 25, 2011 from http://www.emeraldinsight.com/
journals.htm?issn=1355-5855&volume=21&issue=3&articleid=1801070&show=html
The Economist. (2010). China's lucky man bags Volvo. Retrieved on April 4, 2011 from
http://www.economist.com/node/16750095?story_id=16750095&CFID=152275665&CFTOKEN=569
24159
The Independent (2000 March 17) Ford buys Land Rover for 1.85bn Pounds. Retrieved on April 2,
2011 from http://www.independent.co.uk/news/business/news/ford-buys-land-rover-for-pound185
bn-722568.html
The Local (2009 December 26). Geely to run Volvo as an independent brand. Retrieved on April 13,
2011 from http://www.thelocal.se/24052/20091226/
The Local (a) (2010 December 27). Volvo mulls Chinese plant within two years. Retrieved on April 12,
2011 from http://www.thelocal.se/31090/20101227/
Page 67
REFERENCES
61
The Local (b) (2010 April 25). Volvo unveils China investment plans. Retrieved on April 13, 2011 from
http://www.thelocal.se/32258/20110225/
The Local (b) (2011 January 25). Volvo opens new China headquarters in Shanghai. Retrieved on April
13, 2011 from http://www.thelocal.se/31628/20110125/
The Local (c) (2010 November 13). Volvo and Geely in two minds over China plans. Retrieved on April
13, 2011 from http://www.thelocal.se/30192/20101113/
The Local (c). (2011 January 7) Sweden's Volvo Cars increases sales in 2010. Retrieved on April 12,
2011 from http://www.thelocal.se/31306/20110107/
Urde, M. (2003) Core Value-Based Corporate Brand Building. Institute of Economic Research
Reed, John (2011, Feb. 25th), Volvo plans new China car plants. The Financial Times. Retrieved on
June 8, 2011 from http://cachef.ft.com/cms/s/0/b4c43fb2-40cc-11e0-9a37-00144feabdc0.html#axzz
1OgO1J5sP
Volvo Car Corporation (2010) 2010 Pocket Guide. Retrieved on April 11, 2011 from
http://www.volvocars.com/de/top/about/facts/Documents/2010%20POCKET%20GUIDE.pdf
Volvo Car Germany (2011) Konfigurator. Retrieved on April 10, 2011 from
http://www.volvocars.com/de/sales-services/sales/Pages/car-configurator.aspx
Volvo Car UK. (2010 February 8). Newsroom. Håkan Samuelsson, CV and Biography. Retrieved on
April 12, 2011 from https://www.media.volvocars.com/uk/enhanced/en-uk/Home/Welcome.aspx
Volvo Cars. (2011). Geschichte. Retrieved on April 11, 2011 from http://www.volvocars.com/
de/top/about/heritage/pages/default.aspx
Volvo Owners Club. (2011). History of the Volvo car. Retrieved on April 11, 2011 from
http://www.volvoclub.org.uk/history/index.shtml
Wang, X. (2008) Does country-of-origin matter in the relationship between brand personality and
purchase intention in emerging economies? Evidence from China’s auto industry. International
Marketing Review, 25(4). Retrieved on March 29, 2011 from http://www.emeraldinsight.com/
journals.htm?issn=02651335&volume=25&issue=4&articleid=1733319&show=html
Wackerly, D., Mendenhall, W., Scheaffer, R. (2008) Mathematical Statistics with Applications.
Thomson Learning, 7th ed.
Zöllter, J. (2010 December 8). Interview Stefan Jacoby: Volvo wird Apple der Autohersteller. Welt
Online. Retrieved on May 20, 2011 from http://www.welt.de/motor/article11469008/Volvo-wird-
Apple-der-Autohersteller.html
Page 68
APPENDIX
62
Appendix 1 Sales figures of Volvo per country in 2009
Source: Volvo Car Corporation, 2011
Page 69
APPENDIX
63
Appendix 2
Sales Figures of Volvo per model in 2009
Source: Volvo Car Corporation, 2011
0
10000
20000
30000
40000
50000
60000
70000C
30
C7
0
S40
S60
S80
V5
0
V7
0
XC6
0
XC7
0
XC9
0
No. of cars sold by model
Page 70
APPENDIX
64
Appendix 3
Screenshot of the On-line Questionnaire
Page 71
APPENDIX
65
Appendix 4
Questionnaire
PRODUCT RELATED ATTRIBUTES
1. This car provides safety to the driver and passengers.
2. This is a high-quality car.
3. This car offers a distinctive and superior design.
4. This car is designed according to high technological standards.
NON-PRODUCT-RELATED ATTRIBUTES
5. I can rely on this car in every situation. (Brand personality)
6. This car communicates care for family. (Brand personality)
7. This car communicates care for environment. (Brand personality)
8. Confident successful people choose this car. (User imaginary)
9. This car is comfortable to use. (Usage imaginary)
10. Using this car brings minimum harm to the environment. (Usage imaginary)
11. The idea of having this car is exciting. (Feelings and experiences)
12. Choosing this car is a logical and reasoned decision. (Feelings and experiences)
13. This car is worth more than 65000 $. (Price)
FUNCTIONAL BENEFITS
14. This car provides enough space for traveling.
15. This car will not require frequent repairing.
16. If I have this car I will have good technical support from the manufacturer.
EXPERIENTIAL BENEFITS
17. Driving this car is easy and pleasant.
SYMBOLIC BENEFITS
18. This car symbolizes success.
19. This car symbolizes stability.
ATTITUDE
20. I have an overall positive attitude to this car.
STRENGTH OF BRAND ASSOCIATIONS
21. Safety is the first thing that comes to my mind when I see this car.
22. When I look at this car I think about its high quality.
UNIQUENESS OF BRAND ASSOCIATIONS
23. No other car possesses the same qualities as this one.
FAVORABILITY OF BRAND ASSOCIATIONS
24. I have an overall positive impression of this car.
DEMOGRAPHIC QUESTIONS
25. Are you male/female
26. Are you younger than 25 years?
27. 35 – 35?
28. 35 – 55?
29. Older than 55?
30. Do you own a car?
31. Have you ever owned a Volvo?
Page 72
APPENDIX
66
Appendix 5
Example on Forum Responses
BRITISH FORUM (www.volvoforums.org.uk):
“zetor160”
Senior Member
I don't know what Geely is going to do for Volvo but I hope that they get the company back to the
pre-Ford standard where the consumer got a safe, comfortable, reasonably priced and highly reliable
product.
Those qualities combined with an improvement in engine technology (high performance diesels
would be nice) should help make Volvo a successful company again.
Just my thoughts.
„Oilydad“
Premier Member
Cool
Here's my own views on Volvo for what they are worth.
I have been a long time Volvo owner, (40 years plus) and was first attracted to Volvos as a SAFE
reliable and strong car that would be a good towcar for our caravan, reasonably economical, and
with the ability to deliver a comfortable ride over long distances. Those were, and still are important
values to me.
There is also the added attraction to the Volvo marque, equating with safety, strength and generally
the very well deserved reputation of solid cars, well made in Sweden, by people who to me at least,
are really interested in what they build, because they use them in their own country, and take pride
in doing so.
But one of the prime reasons that I continue to buy the OLDER versions of Volvos, is that I can service
them myself, and there are few cars today that you can self-service. Being able to perform routine
servicing is important to me, because I don't trust garages. I'd rather do the job myself, and KNOW
that it's been done. Today’s dealers are mainly about selling cars and once they have got your
money, you can get lost. That's lousy service and cheap plasticky looking cars are something that I
won't have anything to do with.
NONE of the current Volvos would make me reach for my cheque book. I'd leave VOLVO and go with
another make.
Page 73
APPENDIX
67
So if you guys doing this survey are interested. Volvo need to BRING BACK SOME OF THE
TRADITIONAL VOLVO CARS. Updated yes, but keep the shape and capacity. These 4x4 and people
carrier type things are now as dead as the ark!! Poncy cars for poncy show-off people. Just horrible
things. Cut down on the electrics. make them reliable and easy to own. There's a recession. A simple
good, working car is all that most people want. The "Show Off" era is dead! Nobody cares how big
your car is, or how big your head is either. Find someone who cares.
I want to buy a Car that works. Cars that are known the world over for reliability and for hard work.
Cars that can be got going again if they stop suddenly. Not need a technician with a computer in the
garage for 48 hours before they will run again. Not Mitsubishi engines that blow up after 80,000
miles or so. The redblock engines will do 5 times that mileage. But above all cars that people who
drive Volvos actually LIKE TO OWN.
People like us are not impressed by all the bling of modern vehicles. Couldn't give a monkeys about
it. We're not impressed by mirrors in indicators, heated steering wheels, paddle gear changes and all
that nonsense. We want to drive the car, and enjoy it for what it is. A simple, very functional car that
thousands of people have bought in the past, and would do so again, if they had the opportunity to
do so.
I like to chuck the dog and shopping in the back and go. And if it gets a bit muddy, so what. That's
what a working estate car is for.
Progress has RUINED Volvo. They are building cars that most true VOLVO owners aren't interested in.
(And so go to other manufacturers)... They need to step back, and look at their traditional values.
Build VOLVOS not tinny plasticky rubbish, which describes their whole "modern" range. Horrible cars
the lot of them.
I've said it many many times. If I could go down to my dealers tomorrow and buy a brand new Volvo
940.......I'd do it.
My next working car will be yet another 2nd hand Volvo......but if I can't find one, then I will not be
buying another Volvo again, simple as that, because the new models have absolutely 100% ZERO
appeal.
Car technology in general has gone too far. It's got completely silly and OTT. Time to step back and
ask the question: What is the main purpose of a car? What do we want to use it for? Why are we
making them so complicated for owners when minor faults appear that they need a garage to sort
them out, when in the past ten minutes with the handbook would cure the problem?
Time the Volvo hierarchy, right from the CEO down, got round the table and gave us what we want,
rather than pandering to the wishy washy ideas of some trendy designer team with it's head in a
cloud. TRADITIONAL VOLVOS, with the traditional Volvo shape, are known the world over......Bring
them back. VOLVO are turning their backs on potentially millions of pounds worth of sales, because
they tell us what THEY want, rather than LISTENING to us. And that's why their sales have declined to
an all time low.
Page 74
APPENDIX
68
If you want me to come and talk to them....I'll do it. Just be prepared to LISTEN.
I'll even bring my own Volvo along, to show them what a REAL car is, and how they could improve on
it just slightly to make it an award winning vehicle right around the world.
NOBODY knows Volvos better than VOLVO OWNERS!!
GERMAN FORUM (www.motor-talk.de):
“Pete77”
Lustig ist die Frage ob ein bauartbedingt spritschluckender SUV im Hinblick auf die Umwelt
entwickelt wurde. :D
Die Fragen sind teilweise sehr hypothetisch. Mir wird jeder zustimmen, wenn ich behaupte:" Keiner
kann Rückschlüsse auf die Qualität eines in Europa entwickelten und in China gebauten Autos
ziehen"! Also muss man viele Fragen mit neutral beantworten.
Erfahrungsgemäß sind deutsche Premiumsuvs, die in Amerika produziert werden, oft schlechter
zusammengebaut als klassenähnliche Pendants des Herstellers aus europäischen Werken.
Die meisten Volvokunden zahlen vor allem auch für das schwedische Image. Obwohl schon einige
Teile moderner Volvos (z.B. Frontscheiben) aus China stammen, ist wohl ein Auto, in China
zusammengebaut, für die Meisten endgültig ein "Chinese".
In diesem Fall werden viele den Premiumaufschlag für den Volvo nicht mehr bezahlen, weil man bei
deutschen Premiummarken vergleichbare, technisch höher entwickelte Produkte bekommt und bei
Billiganbietern ähnliche Produkte zu einem niedrigeren Preis.
Die Fomoco- Teile verzeihen wir Volvo gerade noch.
Schon irre- vor den Chinesen hat jeder Angst, die zweifelhafte Vergangenheit der Familie Quandt
oder der Firma Volkswagen bedenkt niemand beim Kauf eines Premiumautos.
TRANSLATION
It is funny to think about whether a design caused fuel consuming SUV (Sport Utility Vehicle) was
designed with a focus on environmental protection. :D
The questions are partly kind of hypothetic. Everyone will agree with me claiming: “No one can make
conclusions on the quality of a car developed in Europe and manufactured in China”! Therefore you
have to reply with “neutral” to many questions.
From experience German premium SUVs produced in America are often not assembled on the same
level of quality as their pendants manufactured in Europe, even if it is done by the same company.
Page 75
APPENDIX
69
Most of the Volvo customers pay also for the Swedish image. However there are already some parts
of the current Volvos (like windshields) coming from China. In case, that the entire car is
manufactured there, it will finally turn the product for the most customers into a “Chinese”.
Considering that, many will no longer be willing to pay a premium-price for such a car. Especially as
one can get comparable but technologically higher level cars from German competitors for roughly
the same price and at the same time almost the same car for a lower price if one goes for some
budget car manufacturer.
At the moment we are still willing to forgive Volvo using Fomoco-parts. (Fomoco = Ford Motor
Company, [note from the author])
It is weird – everyone fears the Chinese, but no one thinks about the problematic history of the
Quandt family (BMW [note from the author]) or Volkswagen when buying a car.
„Atemschutznotfall“
Hallo Maximilian/Uliana,
eure Umfrage habe ich soweit durchgeführt. Anbei noch ein paar persönliche Anmerkungen und
Einschätzungen.
Die Vorstellung, dass ein in China gebauter Volvo bei uns in Deutschland verkauft wird erfüllt mich
mit größter Sorge. Ich selbst fahre seit vielen Jahren deutsche Fahrzeuge, die von deutschen
Arbeitern in Deutschland gefertigt wurden. Da die Fahrzeugpreise immer höher werden, mein Gehalt
aber eher geringer wird (Lebenshaltungskosten steigen) habe ich mich nach einer Alternative
umgeschaut:
- der Hersteller soll renommiert sein
- das Fahrzeug soll sicher sein
- das Fahrzeug soll wertig sein
- das Fahrzeug soll toll aussehen und mir gefallen
- es soll kein "Allerweltsauto" sein, das man überall antrifft
Durch oben genannten Punkte bin ich letztlich bei Volvo gelandet und habe mir im vorigen Monat
einen schicken XC60 bestellt. Wenn dieser Volvo aus sehr vielen chinesischen Teilen bestehen würde,
hätte ich mir dieses Fahrzeug nicht gekauft. Sicherheit und Chinafahrzeugfertigung kann ich nicht in
Einklang bringen, wobei ich bei anderen Nicht-Auto-Produkten die Chinesen an führender Stelle
Page 76
APPENDIX
70
sehe. So zum Beispiel bei hochwertigen taktischen LED-Leuchten, als Beispiel sei hier die Firma Fenix
genannt.
Meine eigene Befürchtung ist, dass sich der Name Volvo auf irgendwelchen "komischen Fahrzeugen"
wiederfinden wird und dadurch der gute Geist von Volvo verschwindet und komplett "den Bach
runter geht".
TRANSLATION
Hi Maximilian/Uliana,
I have filled in your poll. I furthermore want to enclose a few personal remarks and assessments.
The idea, that a Volvo manufactured in China is sold in Germany worries me. I drive German cars
since many years, manufactured by German workers in Germany. As the prices are rising and rising
while my salary is more likely to decrease (costs of living going up) I looked for an alternative:
The manufacturer should have a good reputation
The vehicle should be safe
The car should have a good quality
The car should be good looking
It should be no run-of-the-mill car that you can see everywhere
By taking the above mentioned criteria into account I ended up with Volvo. Thus, I have ordered a
nice XC60 last month. In case that this car would consist of a lot of Chinese components, I would not
have ordered the car. The combination of safety and Chinese car production is for me an impossible
one. Even considering the fact that I see China in a leading position as far as certain non-car-products
are concerned. An example would be high-quality tactical LEDs (light emitting diodes) by Fenix.
My own fear is that we will see the Volvo logo in future on any strange cars which would then
diminish the good spirit of the brand.
“Oli”
Dazu ist dieser >>Thread<< eine wahre Datenmine. Es ist vielleicht zu viel, das alles zu lesen, aber
mein Tipp wäre: Rückwärts lesen! Der Verkauf an China wird in aller Fülle kommentiert und
diskutiert.
Lieb Gruss
Oli
Page 77
APPENDIX
71
TRANSLATION
This >>Thread<< is a pure data mine concerning the topic. It might be a bit too much to read the all
that. However, my tip is: Read it backwards! There are a lot of comments and discussion regarding
the Chinese acquisition.
All the best
Oli
US FORUMS (www.volvo-forums.com):
“DANIELM85948”
good cars ,shame about the electrics, very bad soldering.
“DANIELM85948”
QUOTE
Thank you for your reply! Do you have problems with soldering in you 940?
Cheers, Max&Ulia
yes, due to bad solder, on the board, on the dash they have a they have tin and lead mix, the tin in
the solder, will start to crack, so then you have a dry joint, you then must remove the old solder, and
replace with the new silver solder, which would stop that, but when you resolder, you can burn the
board, if you use the wrong solder iron, so this must be done with care, Volvo need to get this work
done, in Sweden, or if work done in Japan, they must only use silver solder, and there work should be
passed, and signed off, Volvo know there is trouble with the electrics, and they know how to fix it,
they must give better after sale service, look here in the forum, to see trouble with the electrics, i
have had five Volvo’s in total now, from 1982,fix this thing with the electrics, and they would sell
more cars.