Page 1
Effect of the overhang length of a recurve seawall in
reducing wave overtopping
Estelle Swart
Supervisor: Prof JS Schoonees
December 2016
Thesis presented in partial fulfilment of the requirements
for the degree Master of Engineering in the
Faculty of Civil Engineering at Stellenbosch University
Page 2
i
Declaration
DECLARATION
By submitting this thesis electronically, I declare that the entirety of the work contained therein
is my own, original work, that I am the sole author thereof (save to the extent explicitly
otherwise stated), that reproduction and publication thereof by Stellenbosch University will not
infringe any third party rights and that I have not previously in its entirety or in part submitted
it for obtaining any qualification.
Name …………………………………
Date …………………………………
Copyright © 2016 Stellenbosch UniversityAll rights reserved
Stellenbosch University https://scholar.sun.ac.za
Page 3
ii
Abstract
ABSTRACT
With the slow but steady rise in sea level, which is due to global warming, the pressure on the
coastal zone across the world has greatly increased. In the past coastal developments have
frequently encroached onto the shore, therefore progressively more of these developments have
recently come under increasing wave and storm attack, with large portions of the world’s
coastlines needing protection.
A solution to adequately protect the coastlines under threat would be to increase the crest height
of existing seawalls. However, since this would often obstruct the sea view, such a solution
would be unacceptable to seaside property owners. The construction of recurve seawalls to
reduce overtopping provides a solution, while limiting the obstruction of the sea view.
Historically, seawalls have been used to protect coastlines. Recurve seawalls, where the sea-
facing side of the wall is shaped concavely forward to re-direct wave attack back out to sea,
were first designed in the 1980s. However, very few guidelines for the design of recurve
seawalls are currently available.
Against this background, the current physical model study was conducted with the objectives
of quantifying the reduction in wave overtopping in terms of the various geometrical properties
of the recurve seawall, such as the overhang length and freeboard height (being the difference
between the crest level and water level), and developing design curves for recurve seawalls.
To achieve the objectives of this study, a 2D physical model was designed and built. More than
200 tests were undertaken in order to cover a wide range of water levels and wave periods for
nine different recurve seawall designs.
The study found that as the overhang length increases, the reduction in overtopping increases
up to a certain point, after which a longer overhang length has no further significance. However,
under certain conditions, the 0.3 m overhang length produced worse overtopping reduction
results than the vertical wall. Further, a recurve seawall with a parapet angle greater than 50º
will not improve the reduction in overtopping, when compared to the results for a vertical wall
under similar conditions.
It was concluded that the crest level, in combination with the freeboard level, are critical
parameters in the determination of overtopping. It is recommended that the freeboard should be
Stellenbosch University https://scholar.sun.ac.za
Page 4
iii
sufficient so that the incoming wave hits the vertical part of recurve wall. If sufficient freeboard
is not available, the recurve wall will be drowned and will not provide any overtopping
reduction. A combination of high freeboard and low water levels can produce up to 100%
reduction in overtopping.
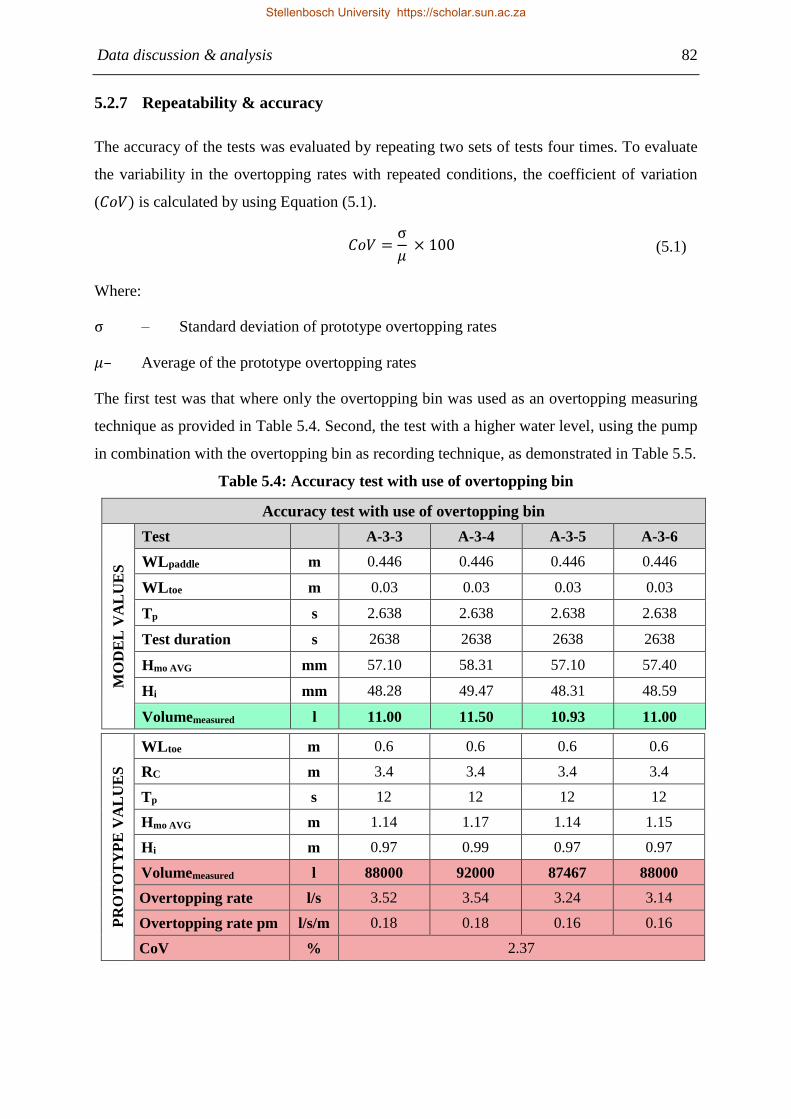
The repeatability of the tests showed that the accuracy is very good, and significantly better
than the data in the CLASH database. Comparison of the measured overtopping with the
prediction of the most referenced database, the EurOtop dataset, showed that the EurOtop
method should be used with caution.
Additional tests should be conducted to investigate the influence that the beach slope, as well
as the wave height, will have on the effectiveness of the recurve wall. Further overhang lengths
in a critical area (for example the 0.2 m and 0.4 m overhang lengths), are also required to expand
the usefulness of the design guidelines. The stability of the recurve seawalls and of their
foundations should also be considered in greater detail.
Stellenbosch University https://scholar.sun.ac.za
Page 5
iv
Opsomming
OPSOMMING
Met die seevlak wat as gevolg van aardverwarming stadig maar geleidelik styg, is daar algaande
meer druk uitgeoefen op kussones reg oor die wêreld. Terwyl daar in die verlede dikwels
kusontwikkelings tot binne die dinamiese kussone ingedring het, word baie van die
ontwikkelings aan toenemende golf- en storm-aanvalle blootgestel en benodig groot dele van
wêreld se kuslyne beskerming.
ʼn Oplossing om die kuslyne in gevaar te beskerm, is om die kruinhoogte van bestaande seemure
te verhoog. Alhoewel aangesien so ʼn oplossing die see-uitsig in baie gevalle sal belemmer, sal
dit onaanvaarbaar wees vir die eienaars van eiendom aangrensend aan die kuslyn. Die bou van
terugkaatsmure om die golfoorslag te verminder voorsien ʼn oplossing sonder om see-uitsig te
belemmer.
Seemure is geskiedkundig gebruik om kuslyne te beskerm. Terugkaatsmure, waar die
seewaartse kant van die muur konkaaf vorentoe gevorm is om die golf aanval seewaarts te stuur,
is eerste in die 1980s ontwerp. Desnieteenstaande is baie beperkte riglyne vir die ontwerp van
terugkaatsmure tans beskikbaar.
Die huidige navorsingsprojek is teen die agtergrond uitgevoer met die doelwit om die
vermindering van golfoorslag te kwantifiseer in terme van die meetkundige eienskappe van die
terugkaatsmuur – soos die oorhanglengte en die vryboordhoogte (wat die verskil tussen die
kruinvlak en die watervlak is) en om ontwerpsriglyne vir terugkaatsmuur te ontwikkel.
Om die bogenoemde doelwitte te bereik, is ʼn 2D fisiese model ontwerp en gebou. Meer as 200
toetse is uitgevoer, wat ʼn wye reeks watervlakke en golfperiodes insluit vir nege
terugkaatsmuur-ontwerpe.
In die studie is daar bevind dat, soos die oorhanglengte van die terugkaatsmuur verleng, verhoog
die vermindering in oorslag, maar net tot op ʼn punt, waarna die verlenging van oorhanglengte
geen verdere effek sal hê op die vermindering van oorslag nie. Vir sekere omstandighede het
die 0.3 m oorhanglengte egter ʼn kleiner vermindering in oorslag gelewer as die vertikale muur.
Verder sal ʼn terugkaatsmuur met ʼn borswering hoek groter as 50º by dieselfde golftoestande
en watervlak nie die vertikale muur se vermindering in oorslag verbeter nie.
Stellenbosch University https://scholar.sun.ac.za
Page 6
v
Daar is tot die gevind dat beide die kruinhoogte en die vryboordhoogte kritiese parameters is in
die bepaling van oorslag. Daar word verder aanbeveel dat die vryboordhoogte voldoende moet
wees sodat die inkomende golf die vertikale deel van die terugkaatsmuur sal tref. Indien
voldoende vryboord nie reeds beskikbaar is of verskaf kan word nie, sal die terugkaatsmuur
versuip en sal dan geen vermindering in oorslag plaasvind nie. ʼn Kombinasie van hoë vryboord
en lae watervlak kan egter tot 100% vermindering in oorslag lewer.
Die herhaalbaarheid van die toetse het gewys dat die akkuraatheid baie goed is, en aansienlik
beter is as die CLASH data. ʼn Vergelyking van die gemete oorslag met die voorspelling van
die mees verwysde datastel, die EurOtop datastel, het getoon dat die EurOtop metode versigtig
gebruik moet word.
Addisionele toetse moet gedoen word om die invloed van die strandhelling te ondersoek, asook
die invloed wat die golfhoogte sal hê op die effektiwiteit van die terugkaatsmuur. Verder moet
oorhanglengtes in ʼn kritiese gebied (byvoorbeeld 0.2 m en 0.4 m) beskou word om die
bruikbaarheid van die ontwerpsriglyne uit te brei. Laastens moet die stabiliteit en fondasie van
die terugkaatsmure in ag geneem word en in meer detail bestudeer word.
Stellenbosch University https://scholar.sun.ac.za
Page 7
vi
Acknowledgements
ACKNOWLEDGEMENTS
I would like to acknowledge the contribution of the following people. Without the support and
encouragement this would not have been possible.
My study leader, Prof Koos Schoonees, for your guidance, knowledge and open door
throughout my post graduate studies;
My father, Harry Swart, without your support and guidance I would not have succeeded;
My mother, Jean Swart, for your continuous moral support;
Kishan Tulsi, and Talia Schoonees for your willingness to give advice, excitement and
motivation to undertake this project;
Johann Nieuwoudt, Iliyaaz Williams and Marvin Lindoor, for your time, understanding
and humour. Thank you for making the laboratory something to look forward to each
day.
Lastly, I thank my friends and family for the support, motivation and assistance in and
out of this study.
Stellenbosch University https://scholar.sun.ac.za
Page 8
vii
TABLE OF CONTENTS
Declaration .................................................................................................................................. i
Abstract ...................................................................................................................................... ii
Opsomming ............................................................................................................................... iv
Acknowledgements ................................................................................................................... vi
List of Tables ............................................................................................................................ xii
List of Figures ......................................................................................................................... xiv
List of Abbreviations and Glossary ....................................................................................... xviii
Nomenclature .......................................................................................................................... xix
1 INTRODUCTION .............................................................................................................. 1
1.1 Background .................................................................................................................. 1
1.2 Objectives .................................................................................................................... 2
1.3 Methodology ................................................................................................................ 2
1.4 Report layout and structure.......................................................................................... 3
2 LITERATURE REVIEW ................................................................................................... 4
2.1 Introduction ................................................................................................................. 4
2.2 Recurve seawalls ......................................................................................................... 4
2.2.1 Types of seawalls ................................................................................................. 4
2.2.2 Recreational uses of recurve wall ......................................................................... 5
2.3 Overtopping ................................................................................................................. 6
2.3.1 Overtopping types ................................................................................................ 6
2.3.2 Overtopping limits ................................................................................................ 8
2.3.3 Effects of wind ................................................................................................... 11
2.4 Design guidelines for recurve seawalls: Fundamental research ................................ 11
2.4.1 Owen and Steele (1993) ..................................................................................... 11
2.4.2 Banyard and Herbert (1995) ............................................................................... 12
Stellenbosch University https://scholar.sun.ac.za
Page 9
viii
2.4.3 Clifford (1996) ................................................................................................... 16
2.5 Design guidelines for recurve seawalls: Recent studies ............................................ 18
2.5.1 CLASH ............................................................................................................... 18
2.5.2 Flaring Shaped Seawall (FSS) (2003-2007) ....................................................... 22
2.5.3 Allsop et al. (2005) ............................................................................................. 25
2.5.4 Van Doorslaer and De Rouck (2011) ................................................................. 27
2.5.5 Veale et al. (2012) .............................................................................................. 29
2.5.6 Roux (2013) ........................................................................................................ 31
2.5.7 Schoonees (2014) ............................................................................................... 32
2.5.8 Summary ............................................................................................................ 35
2.6 Physical modelling of wave overtopping .................................................................. 35
2.6.1 Similitude criterion ............................................................................................. 35
2.6.2 Model effects ...................................................................................................... 39
2.6.3 Scale effects ........................................................................................................ 40
2.6.4 Mitigation of model effects ................................................................................ 41
2.6.5 Methods to measure overtopping ....................................................................... 42
3 PHYSICAL MODEL TESTS ........................................................................................... 44
3.1 General description of the model ............................................................................... 44
3.1.1 Test facility ......................................................................................................... 44
3.1.2 Bed slope ............................................................................................................ 45
3.1.3 Geometry of a recurve wall ................................................................................ 46
3.1.4 Wave period ....................................................................................................... 47
3.1.5 Wave spectra ...................................................................................................... 47
3.1.6 Length of wave sequence ................................................................................... 48
3.1.7 Data acquisition .................................................................................................. 49
3.2 Model scale ................................................................................................................ 50
3.3 Test procedure ........................................................................................................... 50
Stellenbosch University https://scholar.sun.ac.za
Page 10
ix
3.4 Measuring equipment and techniques ....................................................................... 51
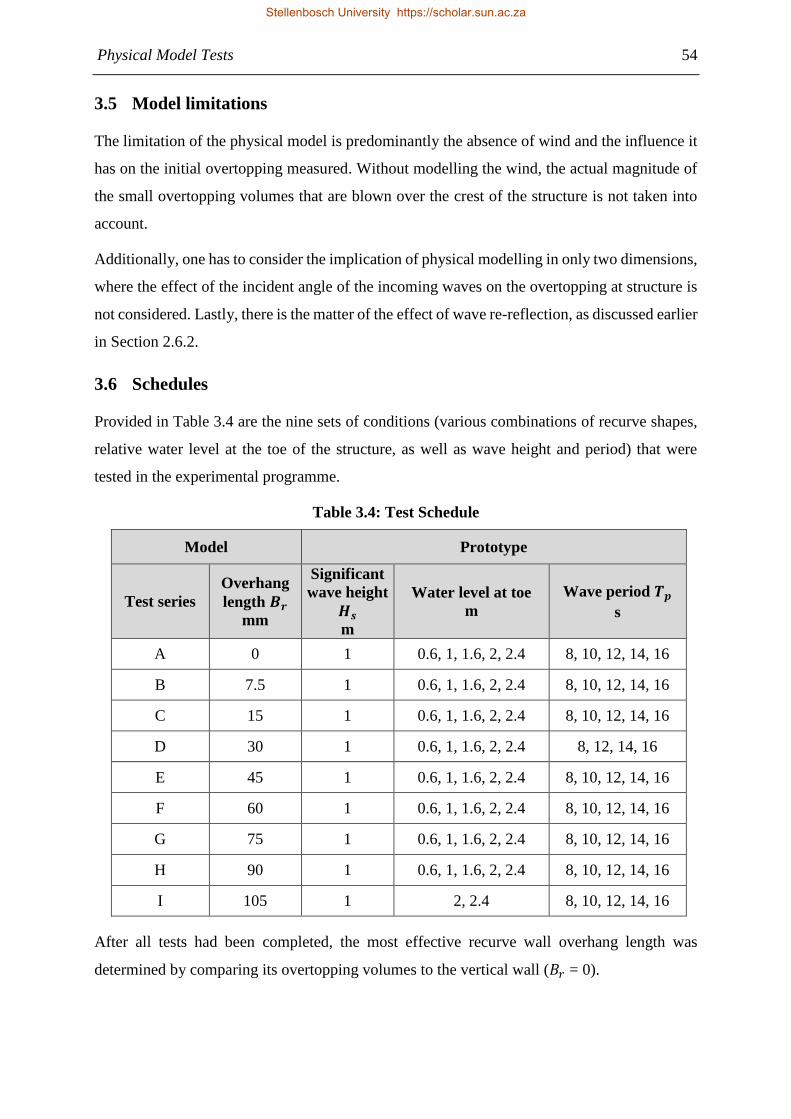
3.5 Model limitations ....................................................................................................... 54
3.6 Schedules ................................................................................................................... 54
3.7 Summary of test conditions ....................................................................................... 55
4 RESULTS ......................................................................................................................... 56
4.1 Introduction ............................................................................................................... 56
4.2 Physical model ........................................................................................................... 56
4.2.1 Test overview ..................................................................................................... 56
4.2.2 Overall performance ........................................................................................... 60
4.3 Results from EurOtop online calculation tool ........................................................... 61
4.4 Summary .................................................................................................................... 62
5 DATA DISCUSSION & ANALYSIS .............................................................................. 63
5.1 Introduction ............................................................................................................... 63
5.2 Physical model tests................................................................................................... 63
5.2.1 Overall performance of recurve walls ................................................................ 63
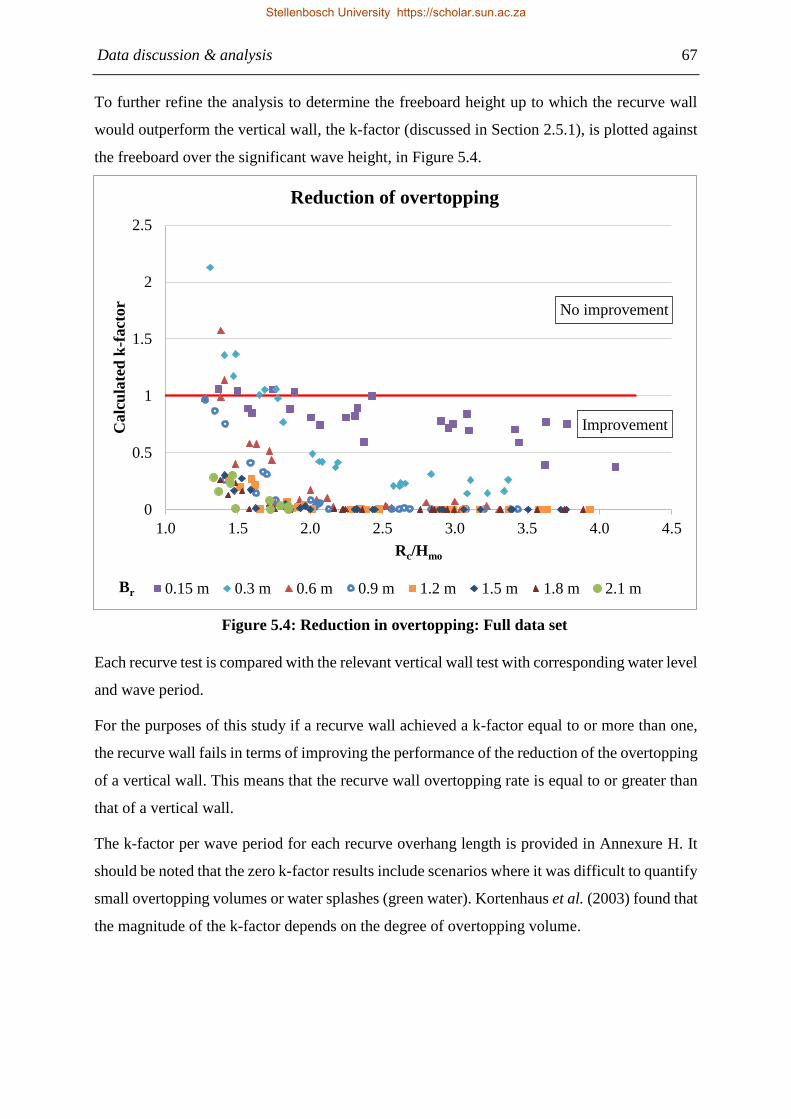
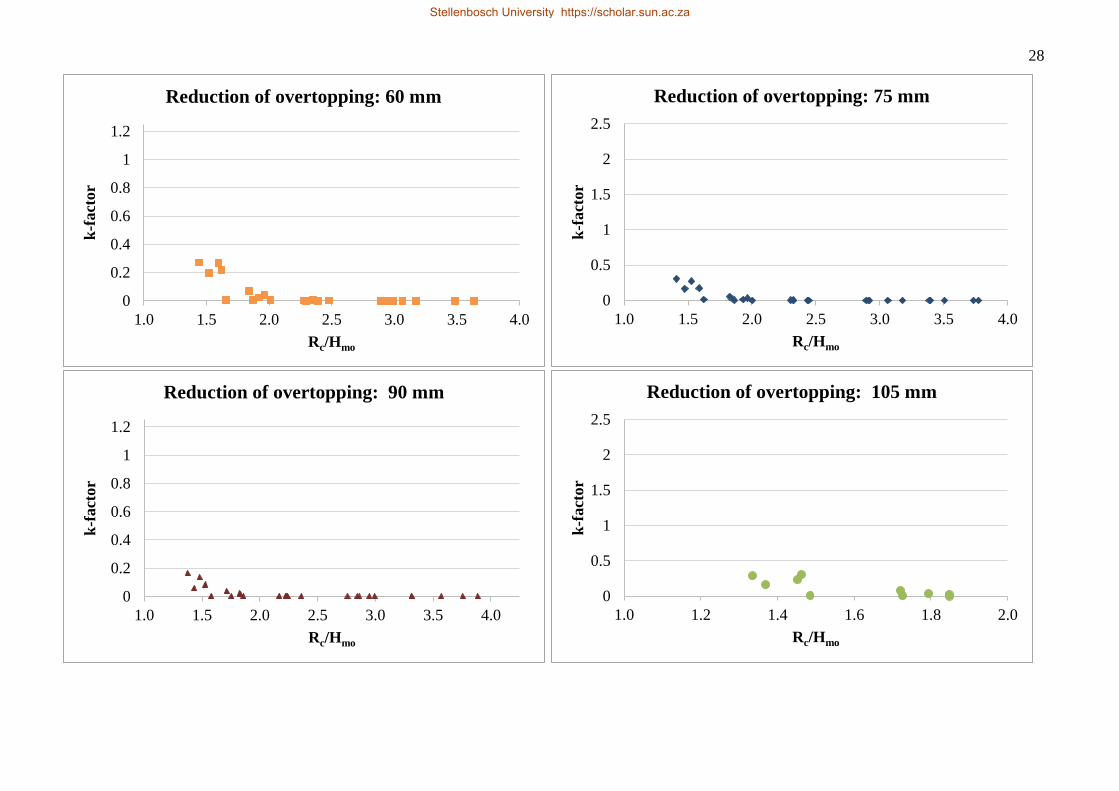
5.2.2 Reduction of overtopping ................................................................................... 65
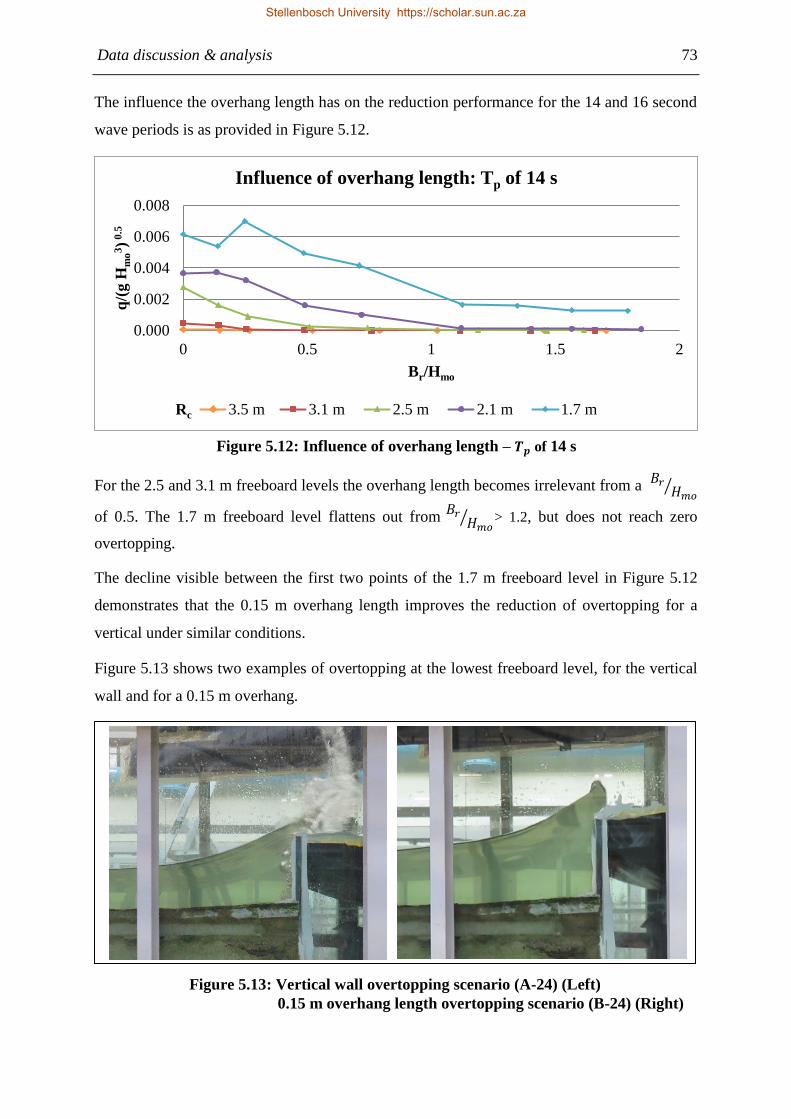
5.2.3 Influence of the length of the overhang ............................................................. 69
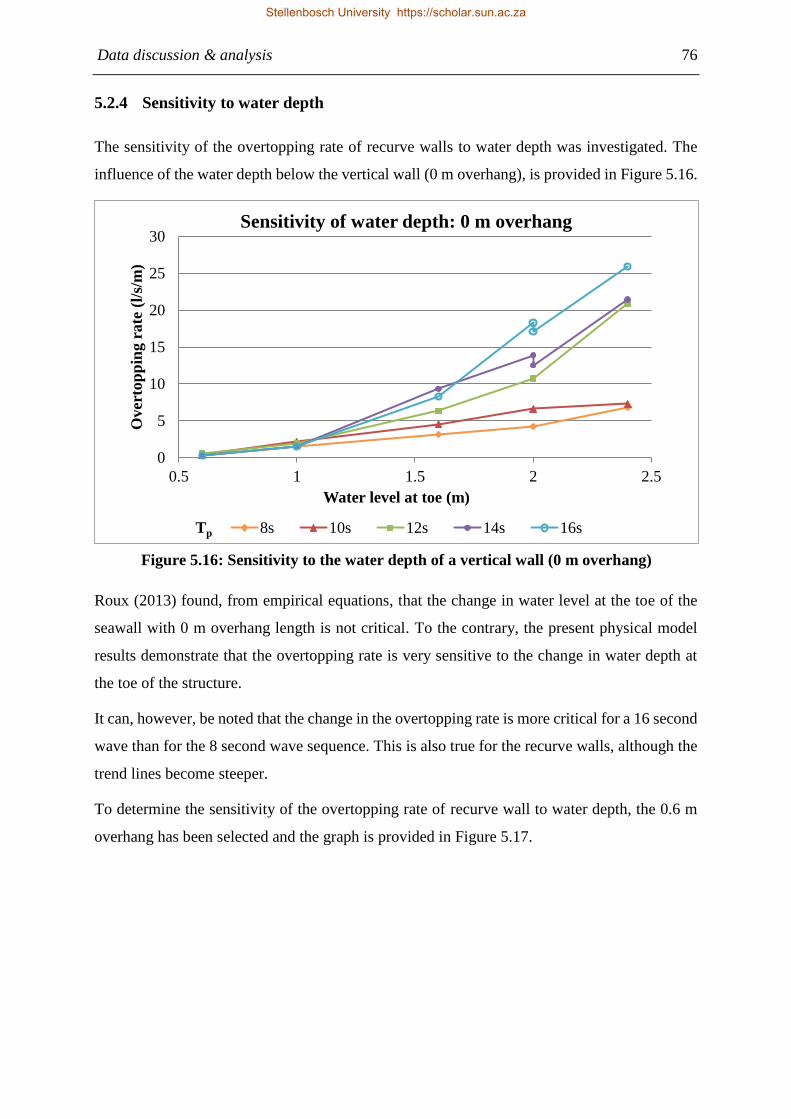
5.2.4 Sensitivity to water depth ................................................................................... 76
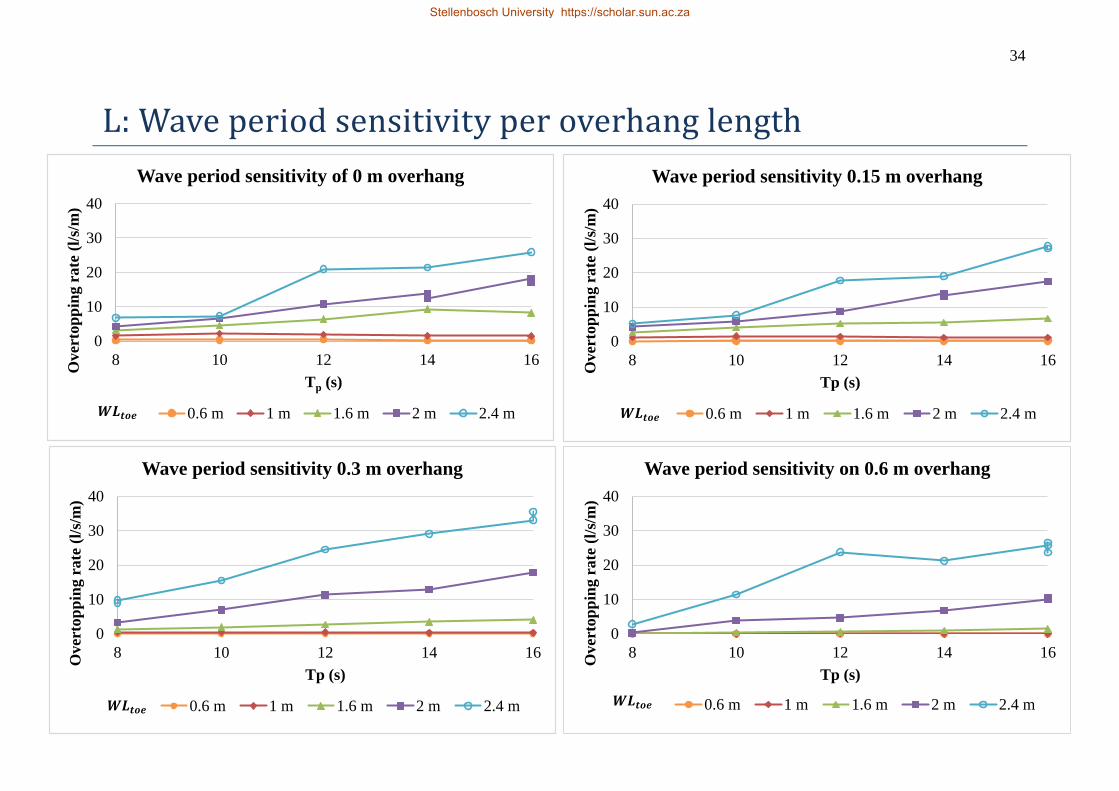
5.2.5 Sensitivity of wave period .................................................................................. 77
5.2.6 Influence of wave height .................................................................................... 79
5.2.7 Repeatability & accuracy ................................................................................... 82
5.2.8 Influence of recurve wall on Dynamic Wave Absorption .................................. 83
5.3 Comparison with previous results and EurOtop tool................................................. 85
5.3.1 Allsop et al. (2005) ............................................................................................. 85
5.3.2 Schoonees (2014) ............................................................................................... 87
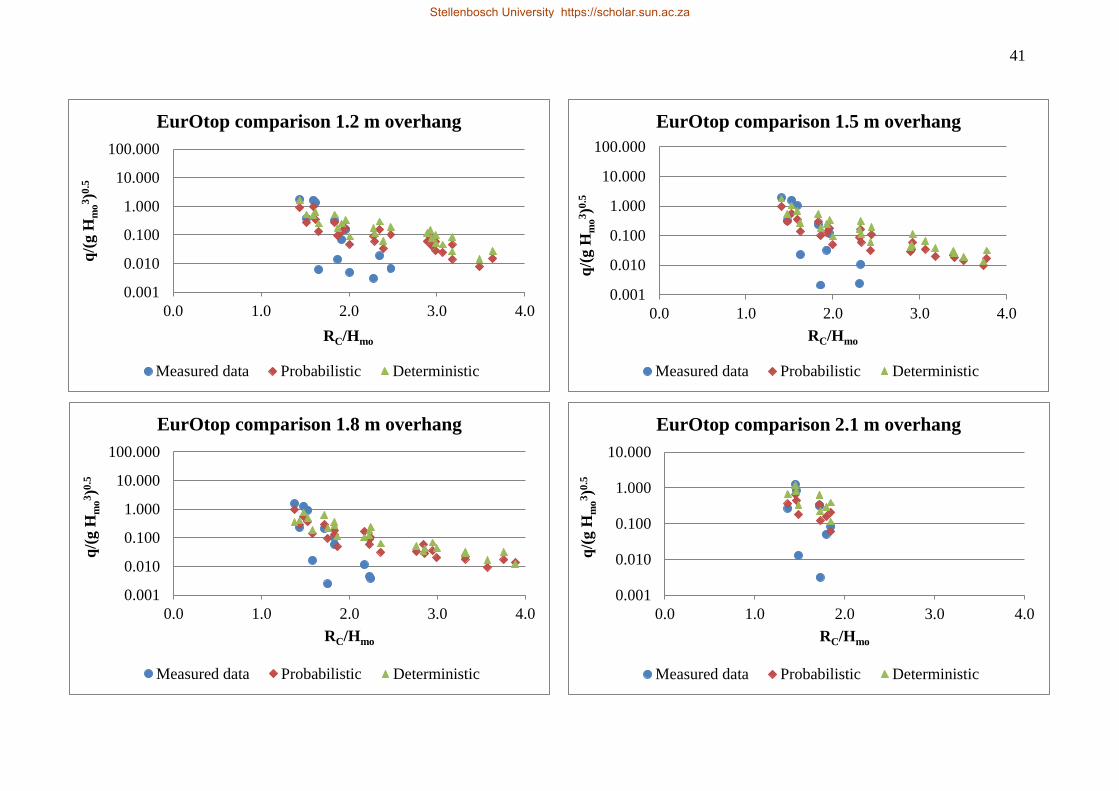
5.3.3 EurOtop online calculation tool ......................................................................... 90
5.4 Summary .................................................................................................................... 95
Stellenbosch University https://scholar.sun.ac.za
Page 11
x
6 PROPOSED DESIGN PROCEDURE .............................................................................. 97
6.1 Introduction ............................................................................................................... 97
6.2 Design considerations ................................................................................................ 97
6.2.1 General comment ............................................................................................... 97
6.2.2 Procedure ............................................................................................................ 98
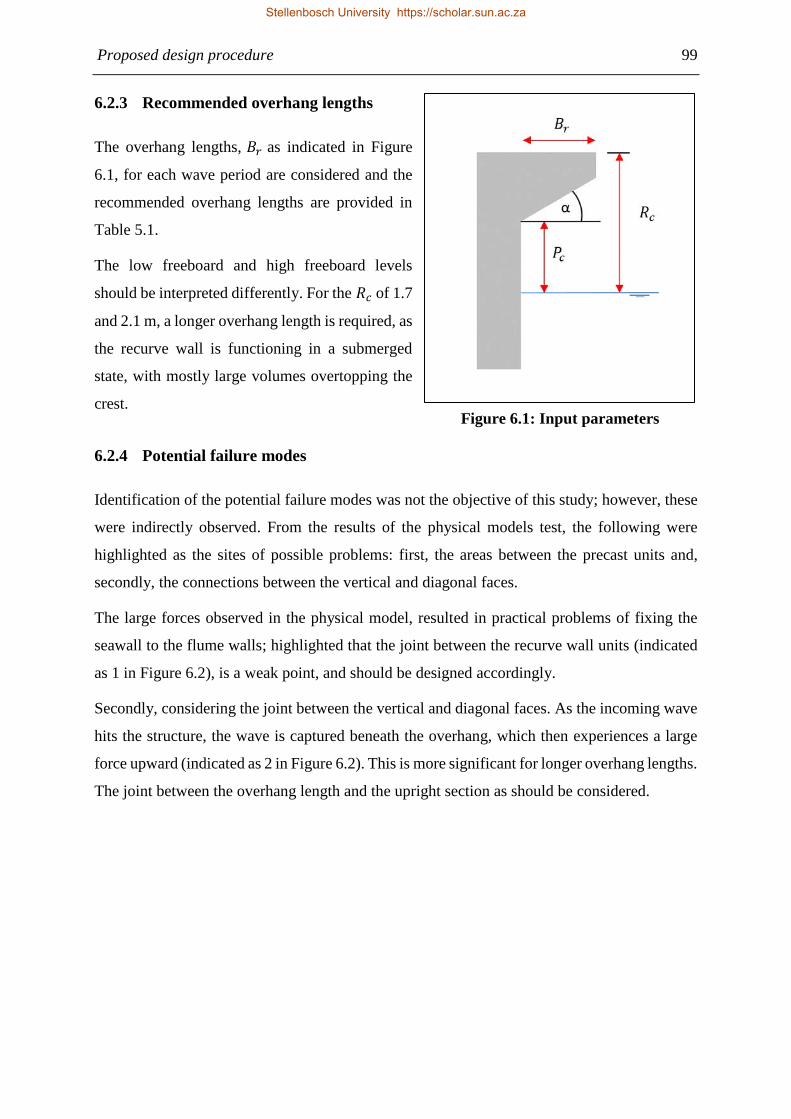
6.2.3 Recommended overhang lengths ....................................................................... 99
6.2.4 Potential failure modes ....................................................................................... 99
6.3 Example ................................................................................................................... 100
6.4 Summary .................................................................................................................. 101
7 CONCLUSIONS ............................................................................................................. 102
7.1 Introduction ............................................................................................................. 102
7.2 Findings from the literature ..................................................................................... 102
7.3 Wave overtopping results from this physical model study...................................... 103
7.3.1 Reduction in overtopping ................................................................................. 104
7.3.2 Influence of the length of the overhang ........................................................... 104
7.3.3 Sensitivity to water depth ................................................................................. 104
7.3.4 Sensitivity to wave period ................................................................................ 105
7.3.5 Influence of wave height .................................................................................. 105
7.3.6 Repeatability and accuracy ............................................................................... 106
7.3.7 Influence of recurve wall on Dynamic Wave Absorption (DWA) .................. 106
7.4 Comparison of previous research ............................................................................ 106
7.5 In conclusion............................................................................................................ 108
8 RECOMMENDATIONS ................................................................................................ 109
8.1 General ..................................................................................................................... 109
8.2 Recommendations for further study ........................................................................ 109
8.2.1 Enhancing the Design Guidelines for recurve seawalls ................................... 109
8.2.2 Physical model equipment ............................................................................... 110
Stellenbosch University https://scholar.sun.ac.za
Page 12
xi
References .............................................................................................................................. 111
List of Annexures ................................................................................................................... 116
Stellenbosch University https://scholar.sun.ac.za
Page 13
xii
List of Tables
LIST OF TABLES
Table 2.1: Permissible overtopping: Pedestrians (EurOtop, 2007) ............................................ 9
Table 2.2: Permissible overtopping: Buildings and infrastructure (EurOtop, 2007); (CIRIA,
2007) ......................................................................................................................................... 10
Table 2.3: Permissible overtopping: Vehicles (EurOtop, 2007) .............................................. 10
Table 2.4: Berkeley-Thorn and Roberts (1981) recurve wall geometry .................................. 11
Table 2.5: Banyard and Herbert’s (1995) empirical coefficients ............................................. 13
Table 2.6: Banyard and Herbert’s (1995) adjustment factors .................................................. 14
Table 2.7: Crest berm freeboard adjustment factors (Clifford, 1996) ...................................... 17
Table 2.8: FSS geometrical properties of experiments ............................................................ 23
Table 2.9: Classification of impulsiveness parameter (Allsop et al., 2005) ............................ 26
Table 2.10: Van Dooslaer and De Rouck’s definition sketch and parameters ......................... 28
Table 2.11: Geometrical properties of recurve wall (Schoonees, 2014) ................................. 33
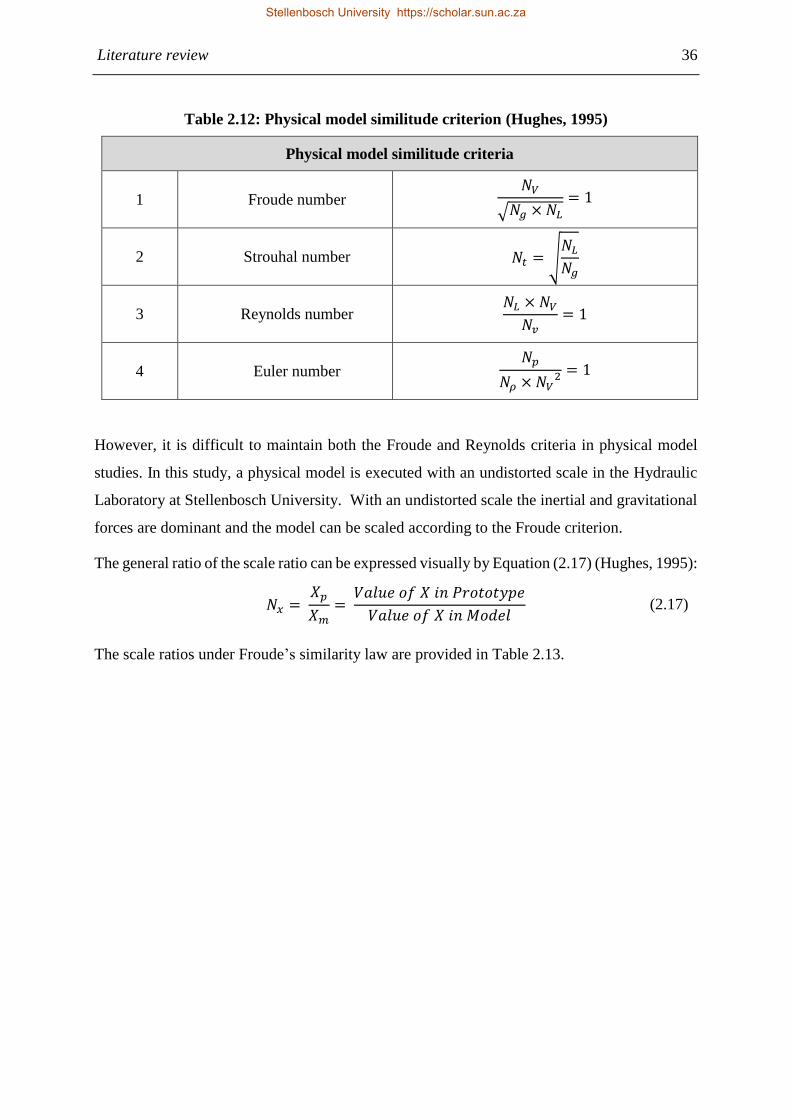
Table 2.12: Physical model similitude criterion (Hughes, 1995) ............................................. 36
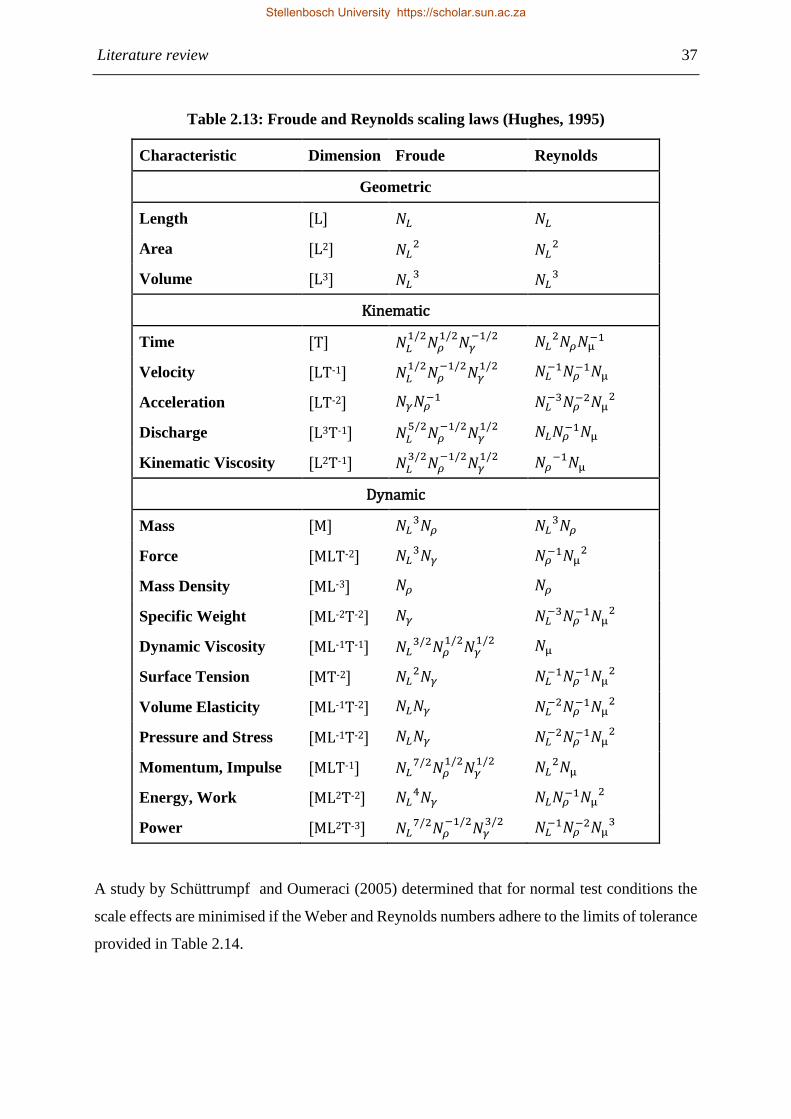
Table 2.13: Froude and Reynolds scaling laws (Hughes, 1995) .............................................. 37
Table 2.14: Tolerable scale limits (Schüttrumpf & Oumeraci, 2005) ...................................... 38
Table 3.1: Nearshore slope calculation .................................................................................... 45
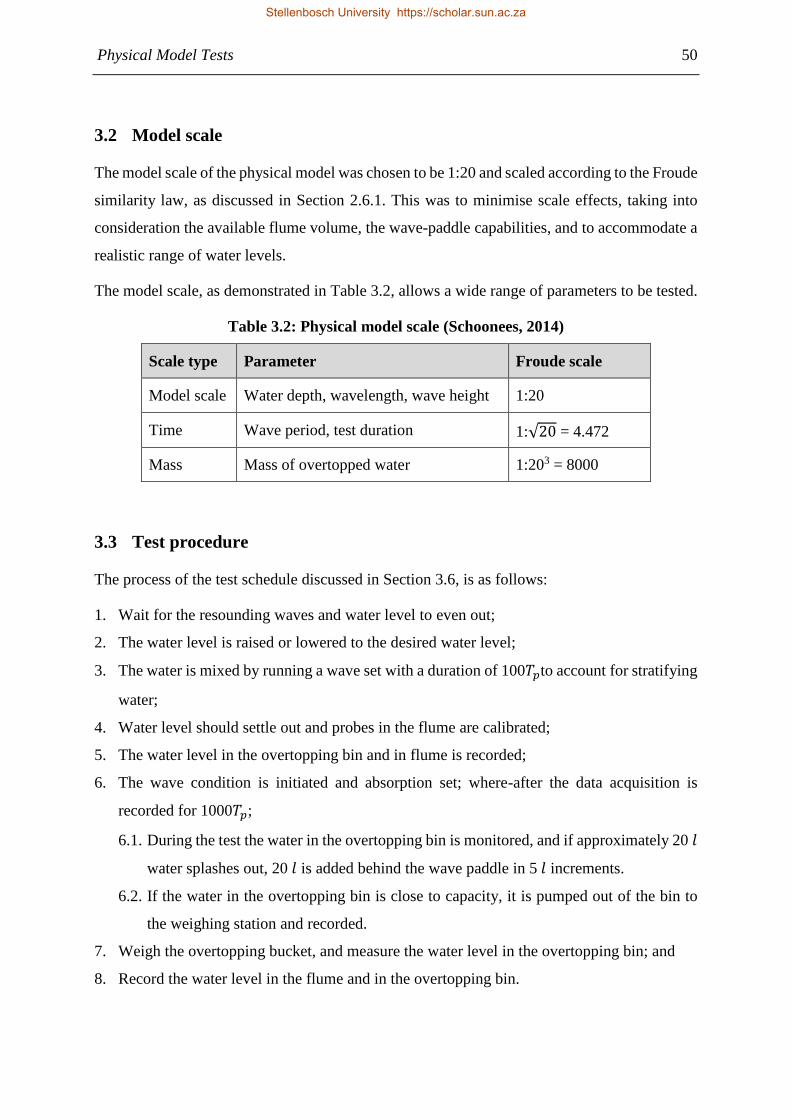
Table 3.2: Physical model scale (Schoonees, 2014) ................................................................ 50
Table 3.3: Average wavelength for calculation of probe spacing ............................................ 53
Table 3.4: Test Schedule .......................................................................................................... 54
Table 3.5: Summary of prototype test conditions .................................................................... 55
Table 5.1: Proposed overhang length per water level .............................................................. 75
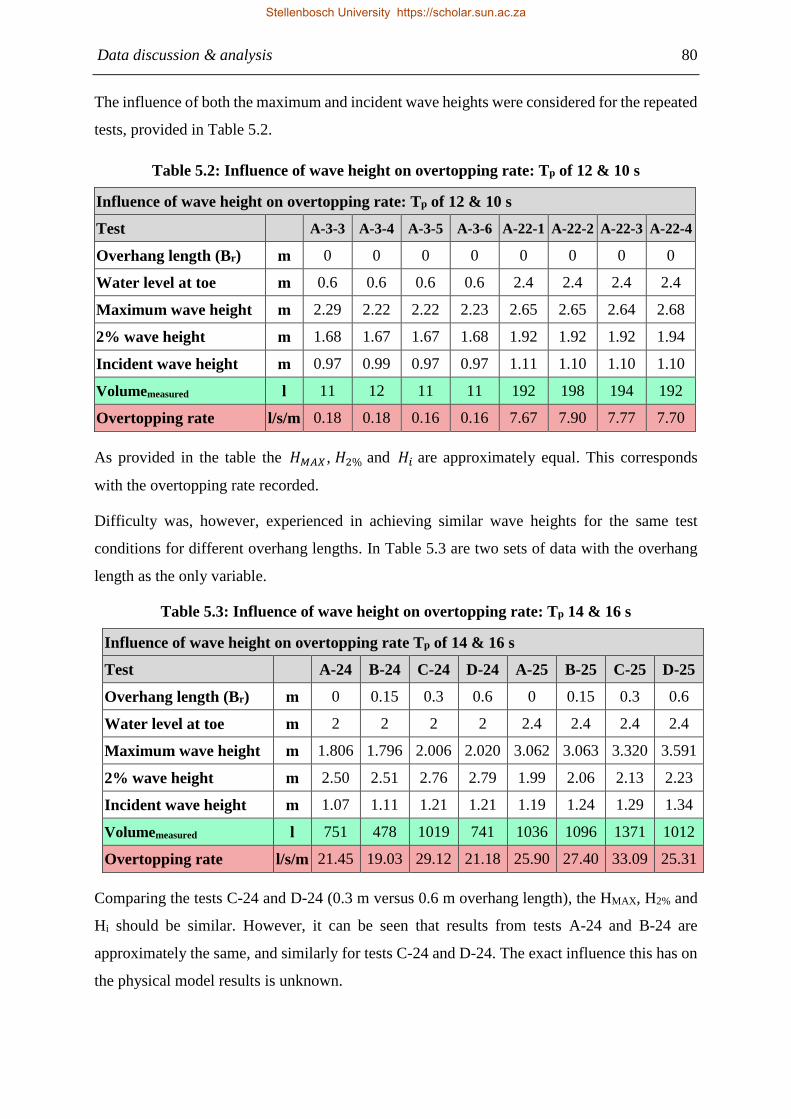
Table 5.2: Influence of wave height on overtopping rate in repeated tests .............................. 80
Table 5.3: Influence of wave height on overtopping rate Tp 14 & 16 s ................................... 80
Stellenbosch University https://scholar.sun.ac.za
Page 14
xiii
Table 5.4: Accuracy test with use of overtopping bin .............................................................. 82
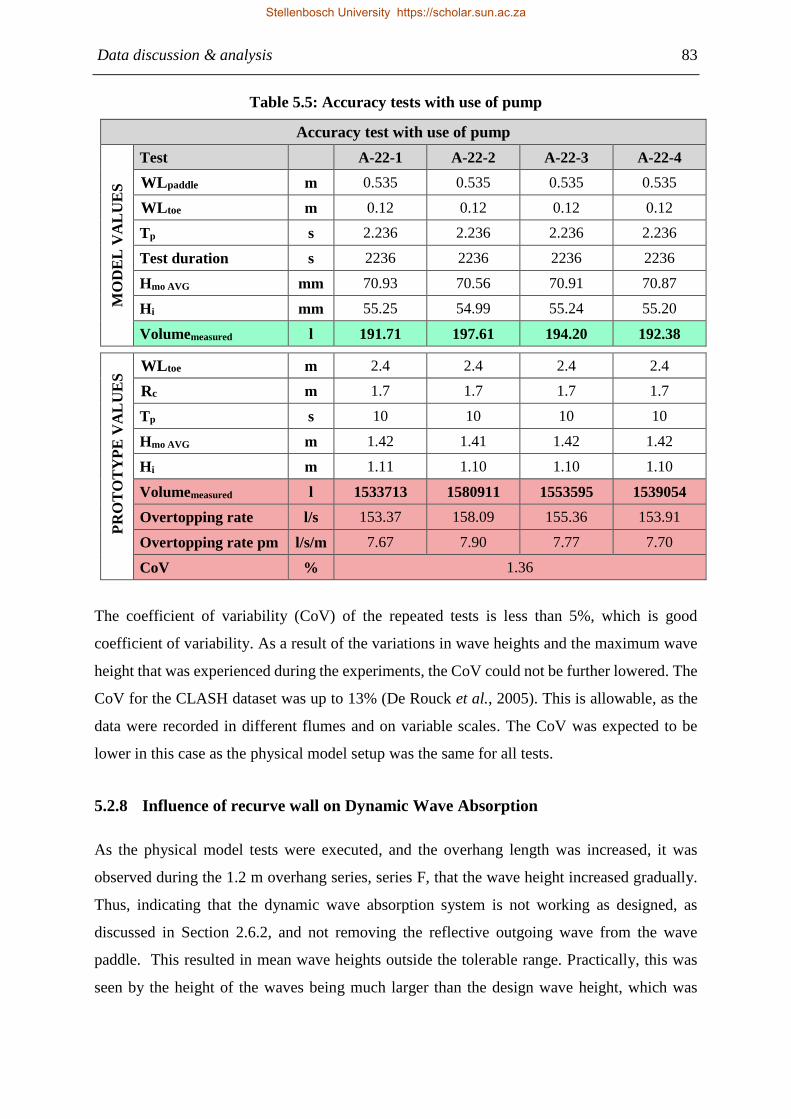
Table 5.5: Accuracy tests with use of pump ............................................................................ 83
Table 5.6: Comparison of Model results and Schoonees (2014) 0 m recurve profile .............. 88
Table 5.7: Comparison of model results and Schoonees (2014) 1.2 m recurve profile ........... 89
Table 6.1: Procedure example input variables ....................................................................... 100
Table 7.1: Summary of proposed overhang lengths per freeboard level ............................... 108
Stellenbosch University https://scholar.sun.ac.za
Page 15
xiv
List of Figures
LIST OF FIGURES
Figure 2.1: Examples of recurve seawall classification ............................................................. 4
Figure 2.2a: Aldeburgh, UK (Stacey, 2009) .............................................................................. 5
Figure 2.3: Examples of overtopping ......................................................................................... 7
Figure 2.4: Non-impulsive/pulsating wave sequence (Bruce et al., 2009) ................................ 7
Figure 2.5: Impulsive wave sequence (Bruce et al., 2009) ........................................................ 8
Figure 2.6: Near-breaking sequence (Bruce et al., 2009) .......................................................... 8
Figure 2.7: Discharge factor for impermeable slopes (Banyard & Herbert, 1995) .................. 15
Figure 2.8: Discharge factor for permeable slopes (Banyard & Herbert, 1995) ...................... 16
Figure 2.9: Clifford (1996) definition sketch ........................................................................... 16
Figure 2.10: Adjustment discharge factors (Clifford (1996) adapted by author)..................... 18
Figure 2.11: Neural Network structure configurations ............................................................ 19
Figure 2.12: CLASH parapet definition sketch ........................................................................ 20
Figure 2.13: Generic method decision chart (Allsop et al., 2005) ........................................... 21
Figure 2.14: FSS definition illustration .................................................................................... 23
Figure 2.15: Pressure transducers on FSS and CPS profiles .................................................... 24
Figure 2.16a: FSS, b: FSS with vertical wall on top of structure ............................................. 25
Figure 2.17: Non-impulsive condition for a vertical wall (Allsop et al., 2005) ....................... 26
Figure 2.18: Allsop et al. (2007) design profiles ..................................................................... 27
Figure 2.19: Sensitivity of parapet nose angle ......................................................................... 28
Figure 2.20: Experiment profiles (Veale et al., 2012) ............................................................. 29
Figure 2.21: Influence of seawall position (Veale et al., 2012) ............................................... 30
Figure 2.22: Promenade cross section (Veale et al. (2012) adapted by author) ...................... 30
Stellenbosch University https://scholar.sun.ac.za
Page 16
xv
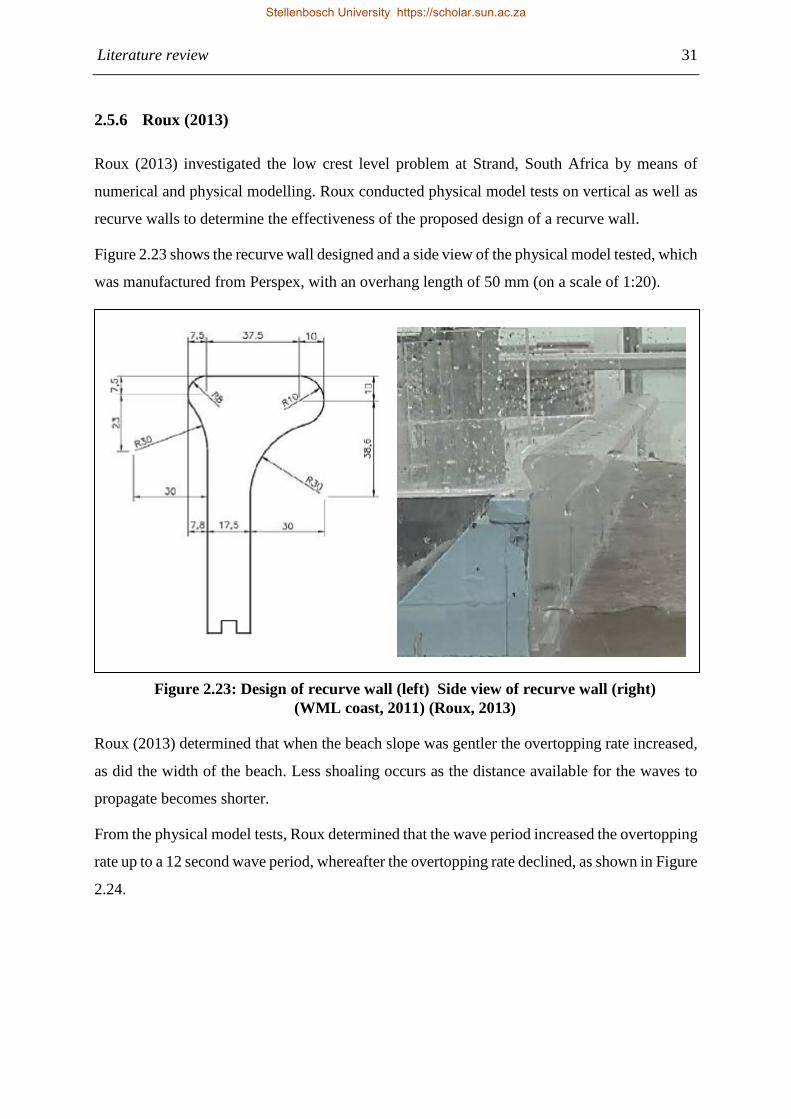
Figure 2.23: Design of recurve wall (left) Side view of recurve wall (right) ......................... 31
Figure 2.24: Influence of wave period on overtopping rate (Roux, 2013) ............................... 32
Figure 2.25: Model geometries (Schoonees, 2014) .................................................................. 33
Figure 2.26: Influence of overhang length on mean overtopping rate (Schoonees, 2014) ...... 34
Figure 2.27: Full-scale tests ..................................................................................................... 41
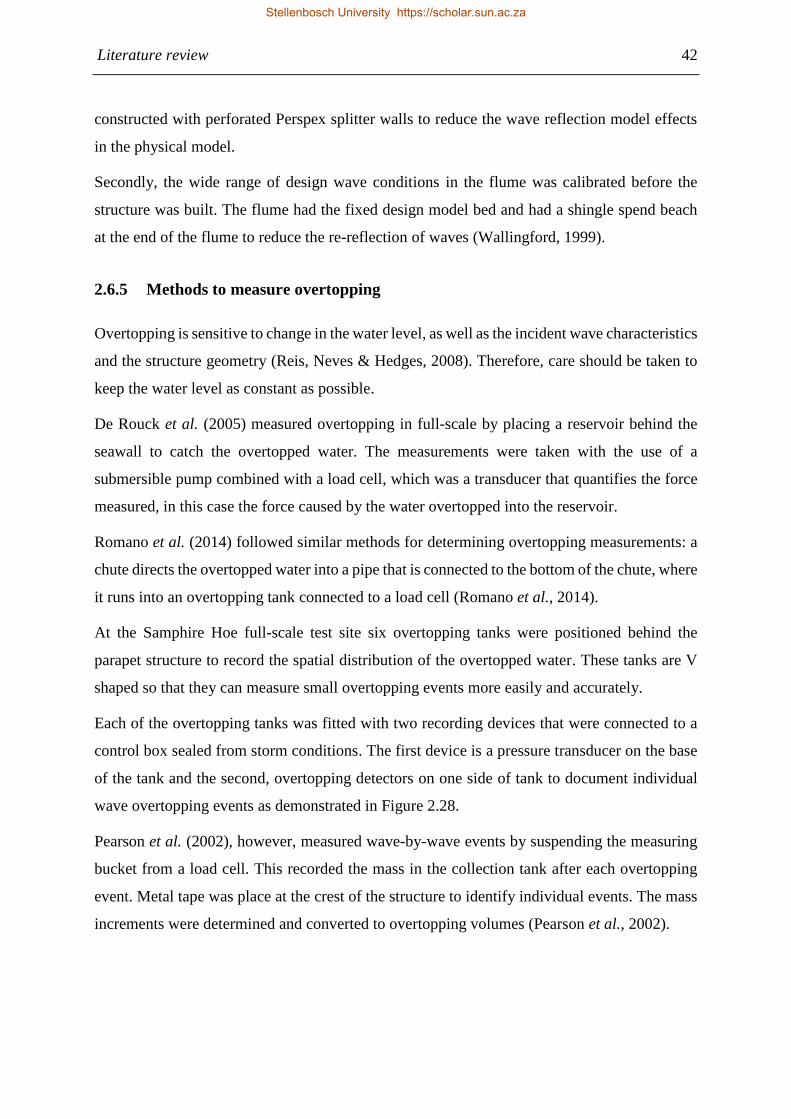
Figure 2.28a: Overtopping tank with 1) pressure transducers and 2) overtopping detectors; . 43
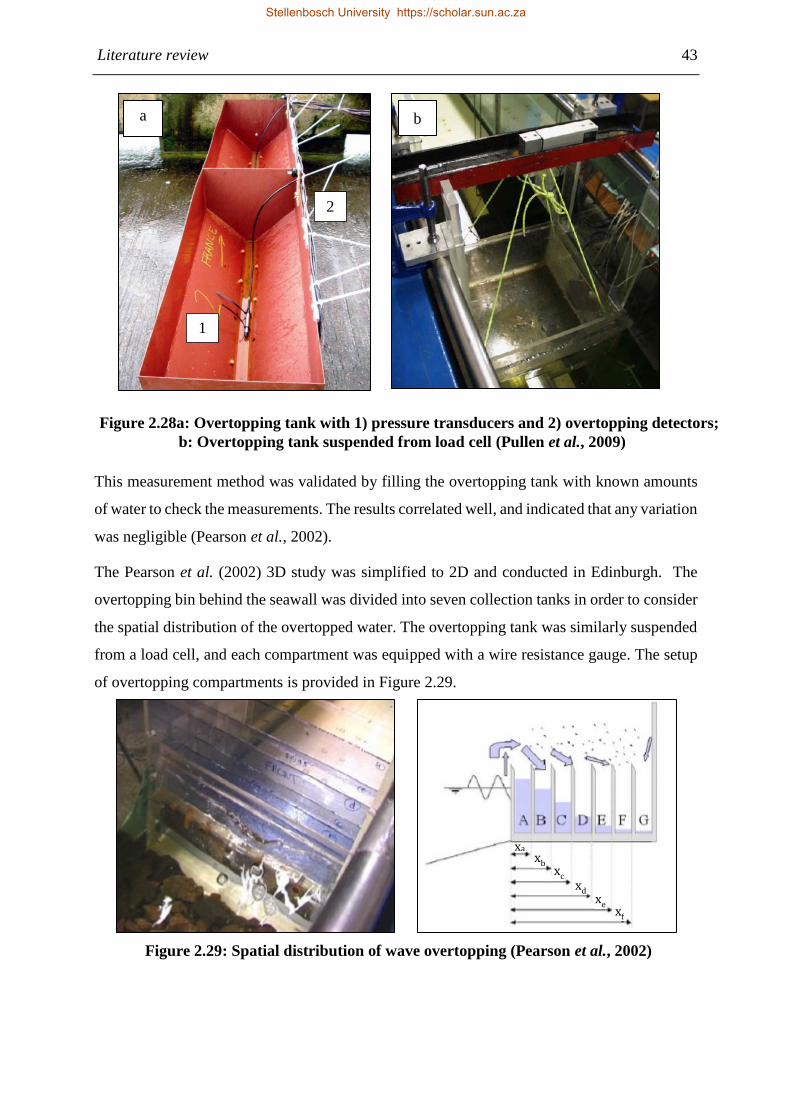
Figure 2.29: Spatial distribution of wave overtopping (Pearson et al., 2002) ......................... 43
Figure 3.1: Test facility ............................................................................................................ 44
Figure 3.2: Estimated slopes in flume ...................................................................................... 46
Figure 3.3: Generic recurve wall geometry of model tests ...................................................... 46
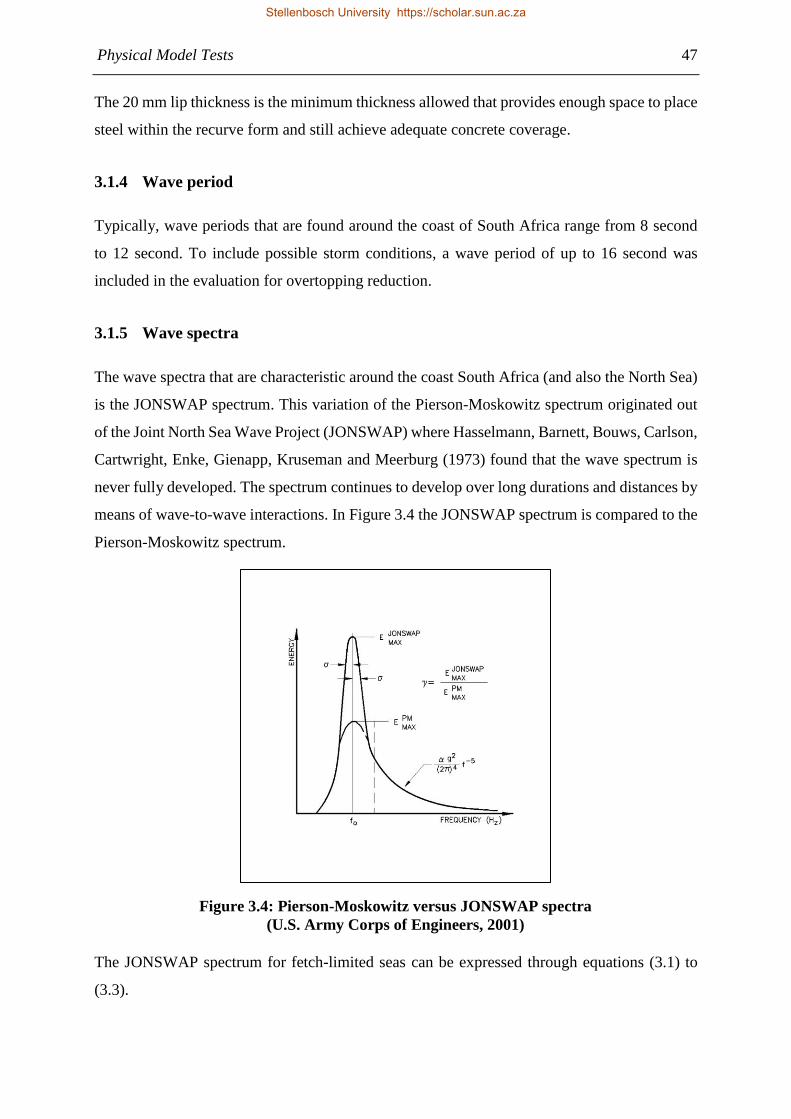
Figure 3.4: Pierson-Moskowitz versus JONSWAP spectra ..................................................... 47
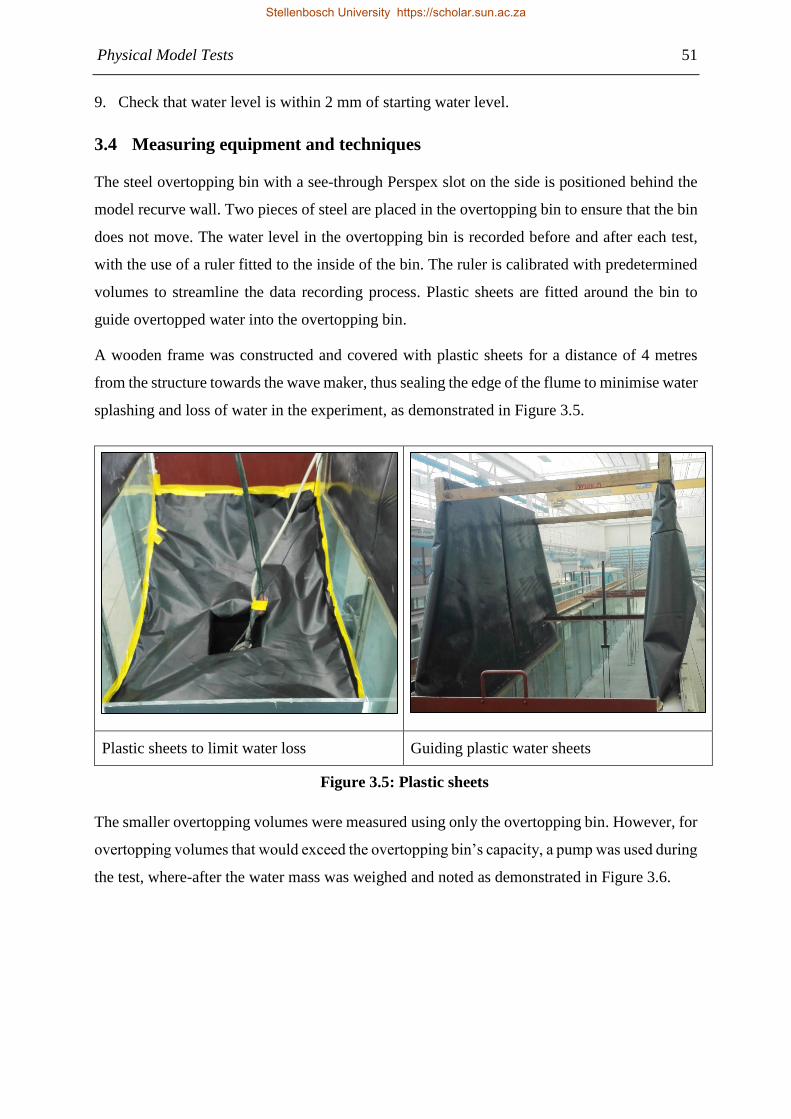
Figure 3.5: Plastic sheets .......................................................................................................... 51
Figure 3.6: Wave overtopping recording equipment ............................................................... 52
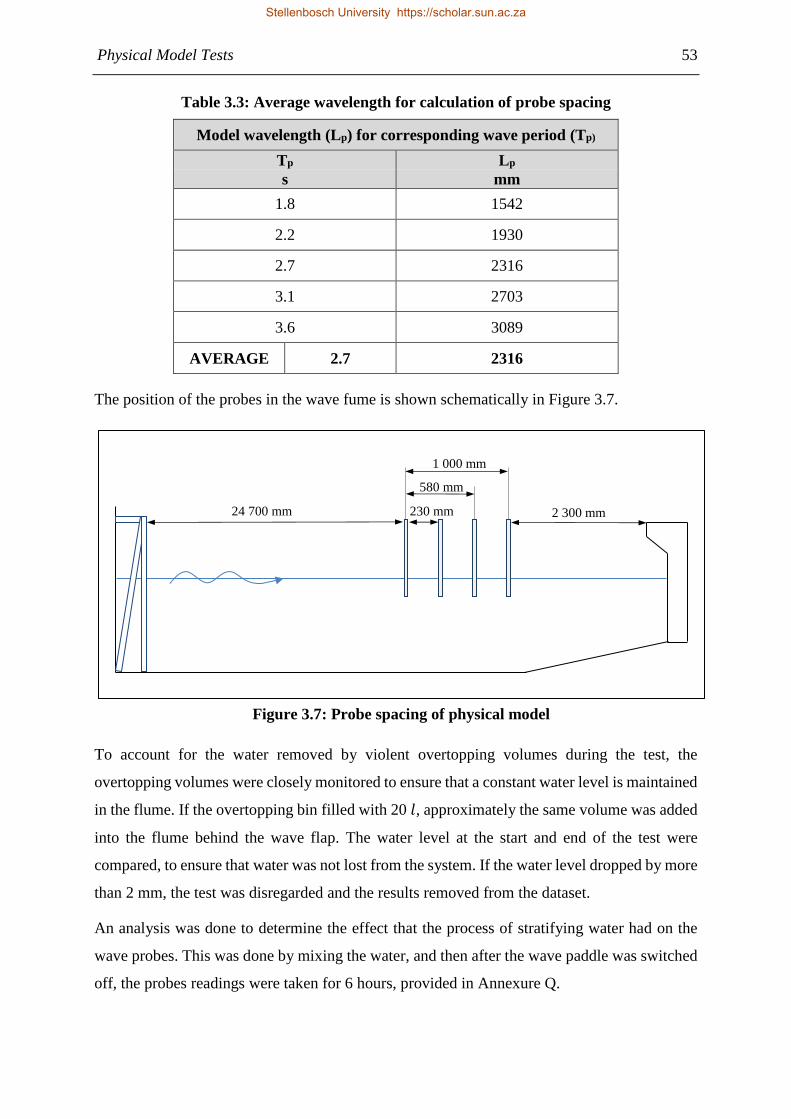
Figure 3.7: Probe spacing of physical model ........................................................................... 53
Figure 4.1: Complete data set overall performance ................................................................. 61
Figure 4.2: Measured versus Empirical data ............................................................................ 62
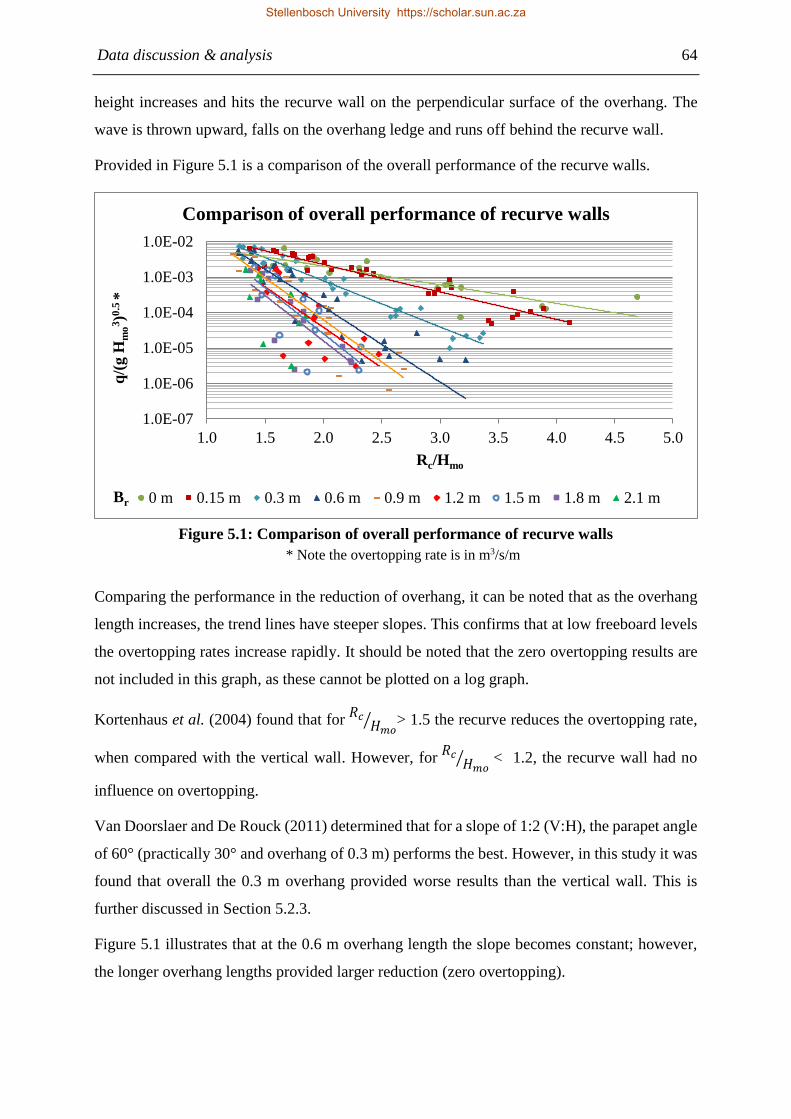
Figure 5.1: Comparison of overall performance of recurve walls ........................................... 64
Figure 5.2: Overall performance comparison of 0 m, 0.15 m and 0.3 m ................................. 65
Figure 5.3: Comparison of overtopping rate of vertical versus recurve wall ........................... 66
Figure 5.4: Reduction in overtopping: Full data set ................................................................. 67
Figure 5.5: Reduction in overtopping: 0.15 m ......................................................................... 68
Figure 5.6: Reduction in overtopping: 0.3 m ........................................................................... 69
Figure 5.7: Influence of overhang length – 10 s ...................................................................... 70
Figure 5.8: 0 m overtopping examples (A-17) (𝑻𝒑 = 10 s) ...................................................... 71
Figure 5.9: 0.15 m overtopping examples (B-17) (𝑻𝒑 = 10 s) ................................................. 71
Stellenbosch University https://scholar.sun.ac.za
Page 17
xvi
Figure 5.10: 0.3 m overtopping sequence (C-17) (𝑻𝒑 = 10 s) ................................................. 72
Figure 5.11: Schematic of 0.3 m overhang behaviour ............................................................. 72
Figure 5.12: Influence of overhang length – 𝑻𝒑 of 14 s .......................................................... 73
Figure 5.13: Vertical wall overtopping scenario (A-24) (Left) ................................................ 73
Figure 5.14: 0.3 m overhang length overtopping scenario (C-24) (Left) ................................. 74
Figure 5.15: Influence of overhang length: Rc of 2.1m ............................................................ 75
Figure 5.16: Sensitivity to the water depth of a vertical wall (0 m overhang) ......................... 76
Figure 5.17: Sensitivity of a wall with 0.6 m overhang to water depth ................................... 77
Figure 5.18: Vertical wall (0 m overhang) wave period sensitivity ......................................... 78
Figure 5.19: Sensitivity of 0.9 m overhang to wave period ..................................................... 79
Figure 5.20: Illustration of recurve wall components .............................................................. 81
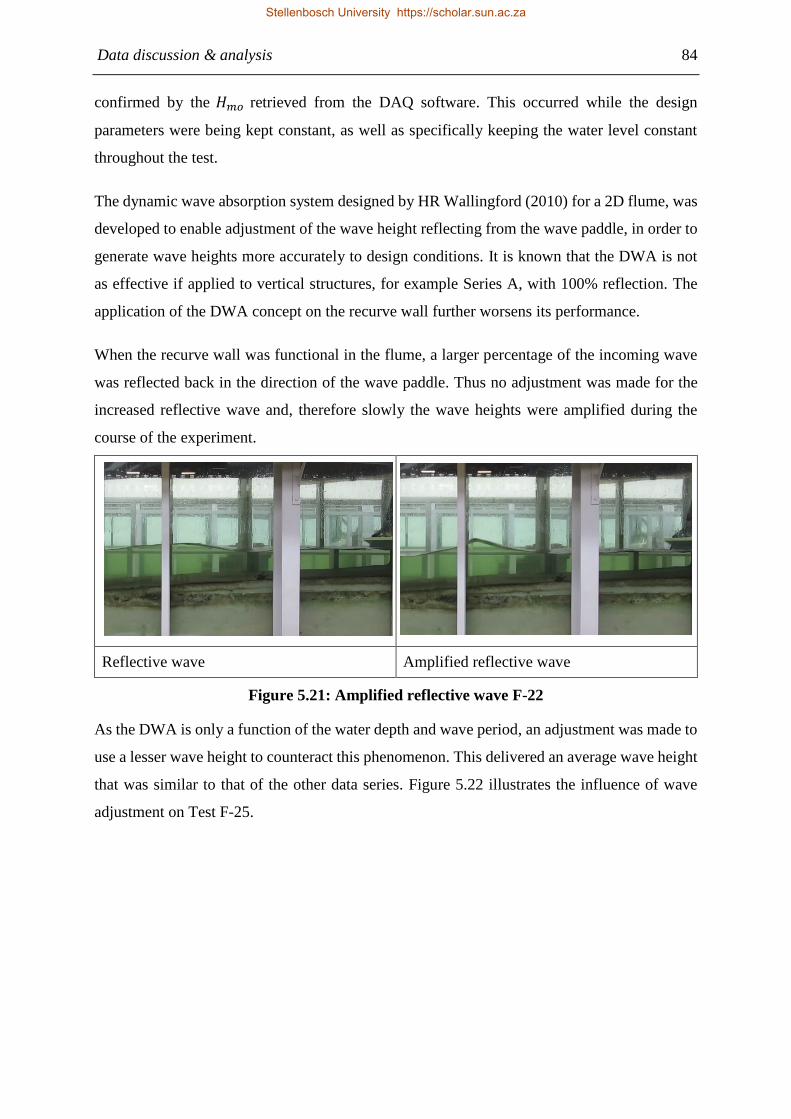
Figure 5.21: Amplified reflective wave F-22 ........................................................................... 84
Figure 5.22: Influence of wave adjustment F-25 ..................................................................... 85
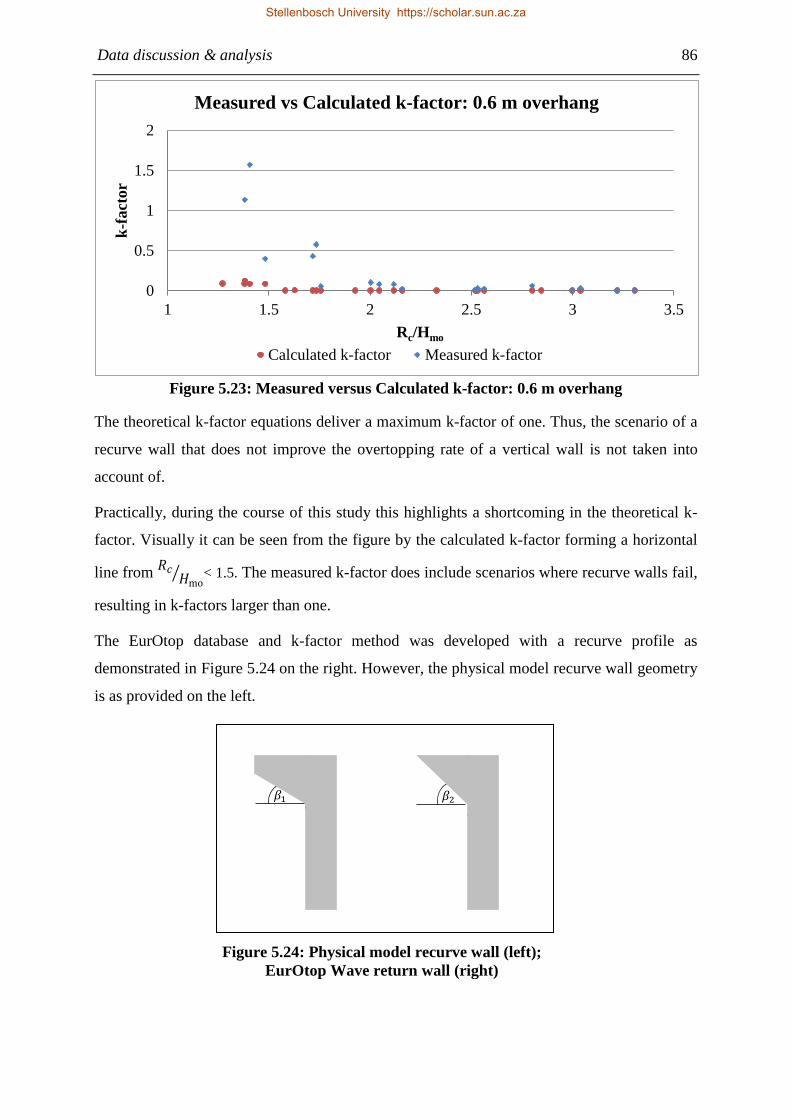
Figure 5.23: Measured versus Calculated k-factor: 0.6 m overhang ....................................... 86
Figure 5.24: Physical model recurve wall (left); EurOtop Wave return wall (right) ............... 86
Figure 5.25: Measured versus Calculated k-factor: 0.3 m overhang ....................................... 87
Figure 5.26: Comparison of Model results versus Schoonees (2014) ...................................... 90
Figure 5.27: Comparison of EurOtop with physical model results 0 m ................................... 91
Figure 5.28: EurOtop comparison 0 m overhang – 𝑻𝒑 of 12 s ................................................ 92
Figure 5.29: EurOtop comparison 0 m overhang – 𝑻𝒑 of 16 s ................................................ 92
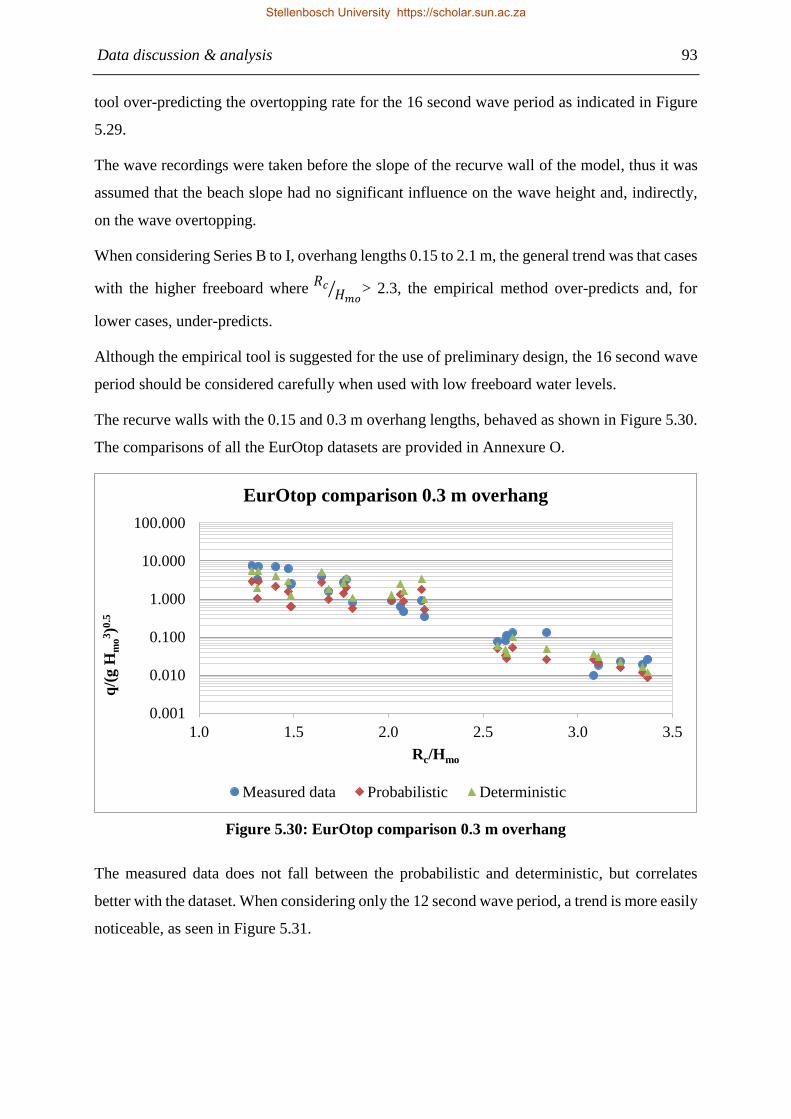
Figure 5.30: EurOtop comparison 0.3 m overhang .................................................................. 93
Figure 5.31: EurOtop comparison 0.3 m overhang – 𝑻𝒑 of 12 s ............................................. 94
Figure 5.32: EurOtop comparison 1.2 m overhang .................................................................. 94
Figure 6.1: Input parameters .................................................................................................... 99
Figure 6.2: Failure modes schematic ...................................................................................... 100
Stellenbosch University https://scholar.sun.ac.za
Page 18
xvii
Figure 6.3: Example of how to use the design chart .............................................................. 101
Figure 6.4: Schematic of design procedure ............................................................................ 101
Stellenbosch University https://scholar.sun.ac.za
Page 19
xviii
List of Abbreviations and Glossary
LIST OF ABBREVIATIONS AND GLOSSARY
2D – Two dimensions
3D – Three dimensions
CLASH – Crest Level Assessment of coastal Structures and Hazard analysis on
permissible overtopping
CPS – Circular cum Parabolic Seawall
DWA – Dynamic Wave Absorption
Drowned – When the freeboard level is low, the recurve wall will not behave as
designed.
EPP – Equivalent Paddle Position
FSS – Flaring Shaped Seawall
Freeboard – The difference between the crest level and the water level
JONSWAP – Joint North Sea Wave Project
MSE – Mean Square Error
NN – Neural Network
RMS – Root Mean Square
Stratifying water – The process of defining layers of different temperatures at various
depths in a body of water.
SWL – Still water level
Stellenbosch University https://scholar.sun.ac.za
Page 20
xix
Nomenclature
NOMENCLATURE
∝ – Equilibrium coefficient
β – Parapet angle as in Table 2.11
𝛾 – JONSWAP peak enhancement factor
𝜎 – Dimensionless spectral width parameter
𝜎0 – Wave run-up height
λ – Height ratio
𝐴, 𝐵 – Empirical coefficients dependent on wave return wall profile in Table 2.5
𝐴𝐶∗ – Dimensionless crest freeboard (m)
𝐴𝐶 – Freeboard to the base of the recurve seawall (m)
𝐴𝑓 – Adjustment factor
𝐵𝑟 – Overhang length
𝑑 – Diameter of the FSS
𝐷𝑓 – Discharge factor
𝐹 – Fetch length
𝑔 – Gravitational acceleration (m/s2)
ℎ∗ – Impulsiveness parameter
H2% – 2% wave height (m)
ℎ – Water depth of the toe of FSS
ℎ𝐴 – Layer thickness at SWL
𝐻𝑖 – Incident wave height (m)
HMAX – Maximum wave height (m)
𝐻𝑚0 – Significant wave height (m)
Stellenbosch University https://scholar.sun.ac.za
Page 21
xx
𝐻𝑟 – Reflected wave height (m)
𝐻𝑠 – Significant wave height at the toe of recurve seawall (m)
ℎ𝑡 – Height of parapet
k-factor – A factor used to indicate/evaluate the effectiveness of the recurve wall, as
defined in Equation 2.12
𝐾𝑟 – Bulk reflection factor
𝐿𝑂 – Deep water wavelength (m)
𝑃𝑐 – Height of vertical part of the wall above SWL (m)
𝑃𝑠 ∗ – Dimensionless pressure parameter
𝜌𝑤 – Density of a fluid
𝑞 – Mean discharge per metre of seawall [l/s/m]
𝑄𝑐 – Mean discharge per metre of seawall at crest of armoured slope [m3/s/m]
𝑟 – Roughness coefficient
𝑅 – Wave run-up height
𝑅𝑐 – Freeboard (m)
𝑅cw – Freeboard to the top of recurve seawall (m)
𝑇𝑚 – Mean wave period at the toe of recurve seawall (s)
𝑇𝑃 – Wave period (s)
𝑣 – Kinematic viscosity
𝑣𝐴 – Wave run-up velocity at SWL
𝑊∗ – Dimensionless wall height
𝑊ℎ – Height of recurve seawall (m)
𝑊𝐿𝑝𝑎𝑑𝑑𝑙𝑒 – Water level at the wave paddle (m)
𝑊𝐿𝑡𝑜𝑒 – Water level at toe of structure (m)
𝑋∗ – Adjusted crest berm freeboard
Stellenbosch University https://scholar.sun.ac.za
Page 22
1
1 INTRODUCTION
INTRODUCTION
1.1 Background
In preceding decades, environmental considerations including setback lines were not always
deemed important. Structures and roads were often built on sites that today would be classified
as environmentally sensitive or vulnerable areas. Furthermore, developers and architects have
always wanted to build as close to the water as possible. Consequently, these structures and
roads now need to be protected against coastal processes.
In addition, the sea level has been rising in recent decades. These structures already mentioned,
as well as structures that were built in sites acceptable in the past, could now be in increasing
danger along the coastline. Amongst other threats, these structures are now exposed to wave
overtopping, that occurs as the incoming waves hit coastal structures and water travels over the
crest of the structure originally built to keep the sea at bay.
Engineering measures are needed to protect these endangered properties and roads. To reduce
the wave overtopping at a structure, the initial design approach was to decrease overtopping
horizontally, in order to reduce the wave height reaching the structure. There are numerous
alternative methods in doing this. For example, the construction of a berm, breakwater, or
horizontal reef; or increasing the height of the terrain level. If this cannot be achieved, the
alternative is to limit the overtopping in the vertical plane, namely by either increasing the crest
level or constructing a recurve seawall.
However, there is pressure from coastal communities to retain the sea view from their properties
as far as possible. Although there are more factors that endanger coastal structures, one possible
approach to ameliorate this process where space is limited is the construction of a recurve
seawall structure. The recurve seawall can either be added to an existing seawall, or
incorporated in the design of new protection measures.
This study specifically focused on the reduction of overtopping by means of the optimisation
of the recurve seawall design at the back of a beach (Type 3), as further discussed in Chapter
CHAPTER 1
Stellenbosch University https://scholar.sun.ac.za
Page 23
Introduction 2
2. Recurve seawalls have been designed to reduce overtopping and limit the amount of water
flowing over the crest structure. As the wave hits the structure and water is thrown upward, the
wind can cause the uprush and fine spray to be carried over the crest of the structure. For the
purpose of this study the effect of wind is excluded.
The application of the recurve structure can be only as successful as the amount of attention
given to this area of research. Limited research has been done on the influence that the shape
of the recurve wall would have on the rate of reduction of overtopping. Only limited or
incomplete design curves are currently available that could assist in the design process for
recurve walls (EurOtop, 2007).
1.2 Objectives
The following objectives of this study were identified:
To quantify the reduction in overtopping on seawalls on beaches by the use of recurve
seawalls that do not obstruct the sea view;
To determine the effect that the overhang length of the recurved seawall has on the
reduction of wave overtopping;
To create design curves for different overhang lengths of the recurve walls;
To determine to what freeboard height, difference between the crest level and water
level, the designs are feasible.
1.3 Methodology
A literature review has been completed in order to obtain a comprehensive understanding of
previous and current research on the reduction of overtopping on coastal structures, the design
of seawalls and more specifically the design of recurve seawalls.
A set of experiments was undertaken to test the influence of the sea-facing slope of the seawall
on the reduction of overtopping rates. An existing curve of the influence of recurve overhang
versus overtopping reduction rates was refined by testing more recurve seawall overhang
lengths. This was done for a range of maritime conditions during which the wave height was
kept constant and the water level, seabed slope, wall height and wave period were varied. For
Stellenbosch University https://scholar.sun.ac.za
Page 24
Introduction 3
each slope the maximum functional freeboard height was determined, which would provide a
guideline to the height of the recurve seawall structure that had to be constructed.
A few experiments were repeated to ensure that data obtained was accurate and reliable. The
results obtained from the experiments were analysed to create a design curve to aid in the
process of future design of recurve seawalls, showing the influences the overhang length of the
recurve wall has on the overtopping reduction rate. The results obtained have been evaluated
against previous research (Allsop, Bruce, Pearson & Besley, 2005); (Schoonees, 2014) to assess
whether this comparison has led to insights that can add value to the findings of the present
study.
1.4 Report layout and structure
In Chapter 2, a literature review is conducted to achieve a comprehensive understanding of
wave overtopping, the function of recurved seawalls, the available research on design
guidelines and physical modelling of wave overtopping. With the added knowledge gained, the
physical model setup is discussed in Chapter 3. This includes the measuring equipment, design
parameters, testing schedule and scaling procedure. Chapter 4 discusses the results obtained
from the physical models, followed by a detailed discussion and analysis of the data in Chapter
5. The proposed design procedure is introduced in Chapter 6. Finally, the conclusions of the
research study and recommendations for further research are discussed in Chapters 7 and 8.
Stellenbosch University https://scholar.sun.ac.za
Page 25
4
2 LITERATURE REVIEW
LITERATURE REVIEW
2.1 Introduction
This literature study was undertaken, in order to understand all aspects related to wave
overtopping, recurve seawalls and physical modelling. The design guidelines for recurve
seawalls may be divided into the fundamental principles and recent research.
2.2 Recurve seawalls
2.2.1 Types of seawalls
Recurved walls are used in various cases and in wide application. These were roughly
categorised in three groups by Schoonees (2014) namely: large recurved walls, recurve walls
on top of sea defence, structures as part of composite sea defences and finally recurved seawall
on top of vertical seawalls.
A recurved seawall is also referred to in the literature as a wave return wall, a parapet wall or a
bullnose; however, it will be further referred to in this study as a recurve seawall. This
investigation focuses on Type 3, as demonstrated in Figure 2.1.
Type 1: Large recurve wall
(Evans, 2015)
Type 2: Recurve wall on top
of a structure
(Hill, 2014)
Type 3: Recurve wall on top
of a vertical wall
(Schoonees, 2014)
Figure 2.1: Examples of recurve seawall classification
CHAPTER 2
Stellenbosch University https://scholar.sun.ac.za
Page 26
Literature review 5
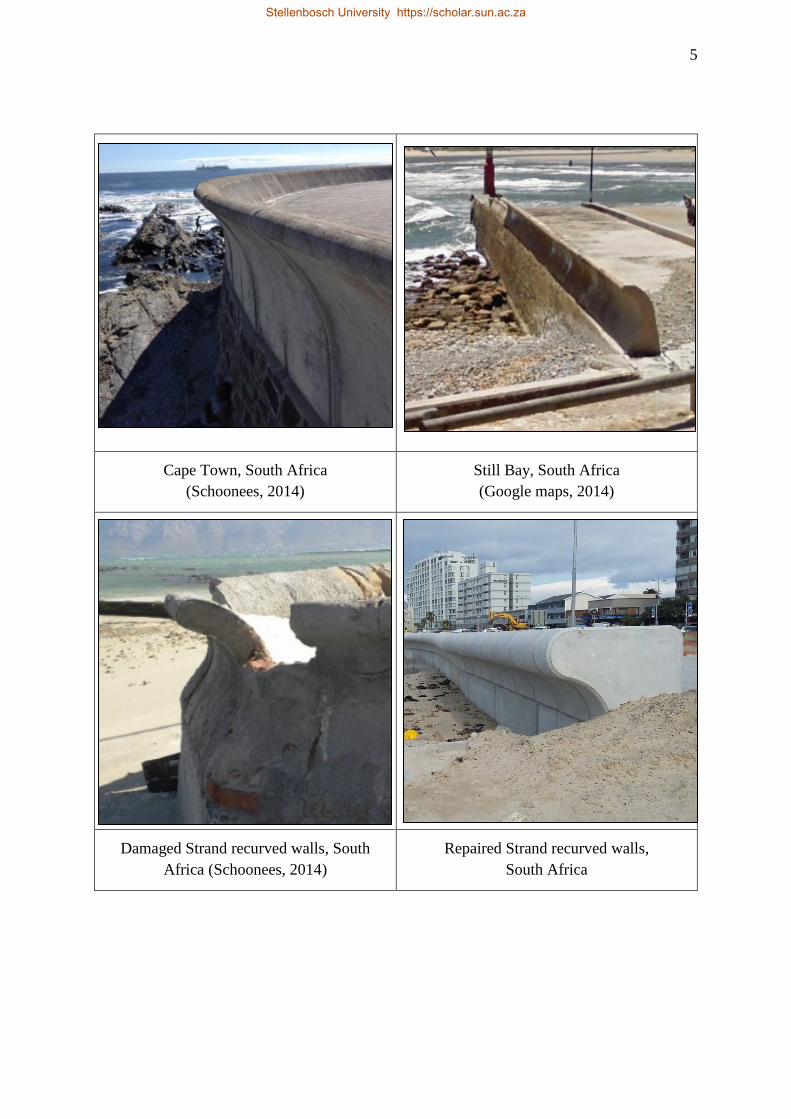
Further combinations of recurve seawalls in composite structures for example on top of
breakwaters, or as used in of erosion protection, are not considered. Practical examples are
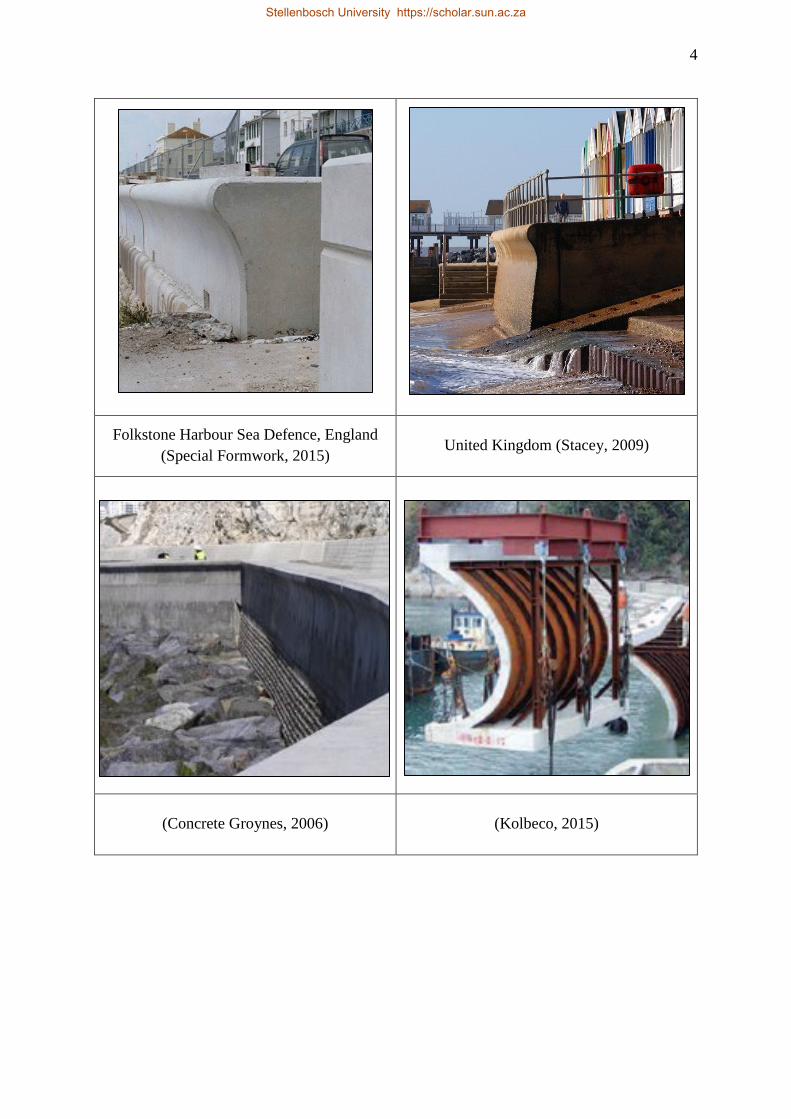
provided in Annexure A.
Although recurve seawalls are frequently used in sea defence, available research provides
limited guidance on the design guidelines to apply or the optimal shape of the recurve seawall.
2.2.2 Recreational uses of recurve wall
The construction of recurve walls occurs typically in environments where a solution is required,
which will disrupt the aesthetic as little as possible. This introduces the secondary recreational
function of the recurve seawall.
With the use of recurve wall (Type 3) on top of a dike or at the top of seaward a slope, the
recurve top functions as a bench, as demonstrated in Figure 2.2.
The large surface on top of the structure can be used for fishing activities. These structures are
also designed with a face sloping to the landward side, so that pedestrians can lean over easily
without endangering their lives. In case of the Flaring Shaped Seawall it is possible to use the
top surface as a promenade for the recreational use of the community.
a) b)
Figure 2.2a: Aldeburgh, UK (Stacey, 2009)
b: New Orleans, USA (Lake Pontchartrain Basin Foundation, 2015)
Stellenbosch University https://scholar.sun.ac.za
Page 27
Literature review 6
As this is not the primary function, not much attention is given to additional functions.
However, when the structure is required to blend with the environment, additional recreational
uses may be considered.
2.3 Overtopping
The purpose of the recurve wall is to reduce the wave overtopping generated by waves colliding
with the seawall. This works according to the concept that the wall should project the water
volume colliding with it seawards. This results in a more feasible alternative than designing a
structure to stop the wave mass. There three types of overtopping are now further discussed
(EurOtop, 2007).
2.3.1 Overtopping types
The first type of overtopping occurs when the wave run-up is high enough that the water flows
over the crest of the structure, commonly referred to as ‘green water’. The second and most
common type occurs with vertical seawalls, as the wave breaks against the seawall, generating
large volumes of water splashes also referred to as ‘white water’. The water then either falls
back into the ocean or is carried over the crest of the structure by the wind blowing onshore
(EurOtop, 2007).
The third type of overtopping, which is often disregarded, is overtopping in the form of spray.
The wind carries the fine spray landward over the crest of the structure, as the wave breaks
against the seawall.
It should be noted that the water spray can cause local hazards when it occurs with a strong
onshore wind (EurOtop, 2007). Extra care should be taken as for water spray is often excluded
from estimates of overtopping and adjustment should be made accordingly. Examples of the
types of overtopping types are provided in Figure 2.3.
Stellenbosch University https://scholar.sun.ac.za
Page 28
Literature review 7
Type 1: Green water
(Swarzenski, 2014)
Type 2: White water
(EurOtop, 2007)
Type 3: Water spray
(Mail Online, 2014)
Figure 2.3: Examples of overtopping
According to Bruce, van der Meer, Pullen, and Allsop (2009), when considering vertical walls,
three wave conditions occur: non-impulsive/pulsating, impulsive/breaking and broken wave
overtopping conditions.
The non-impulsive/pulsating conditions occur when the wave height is relatively small in
comparison to the water depth, and they are not easily influenced by the toe or bed slope (Bruce
et al., 2009). Figure 2.4 shows the non-impulsive wave sequence.
The non-impulsive wave sequence results in non-impulsive green water overtopping over the
crest of the structure.
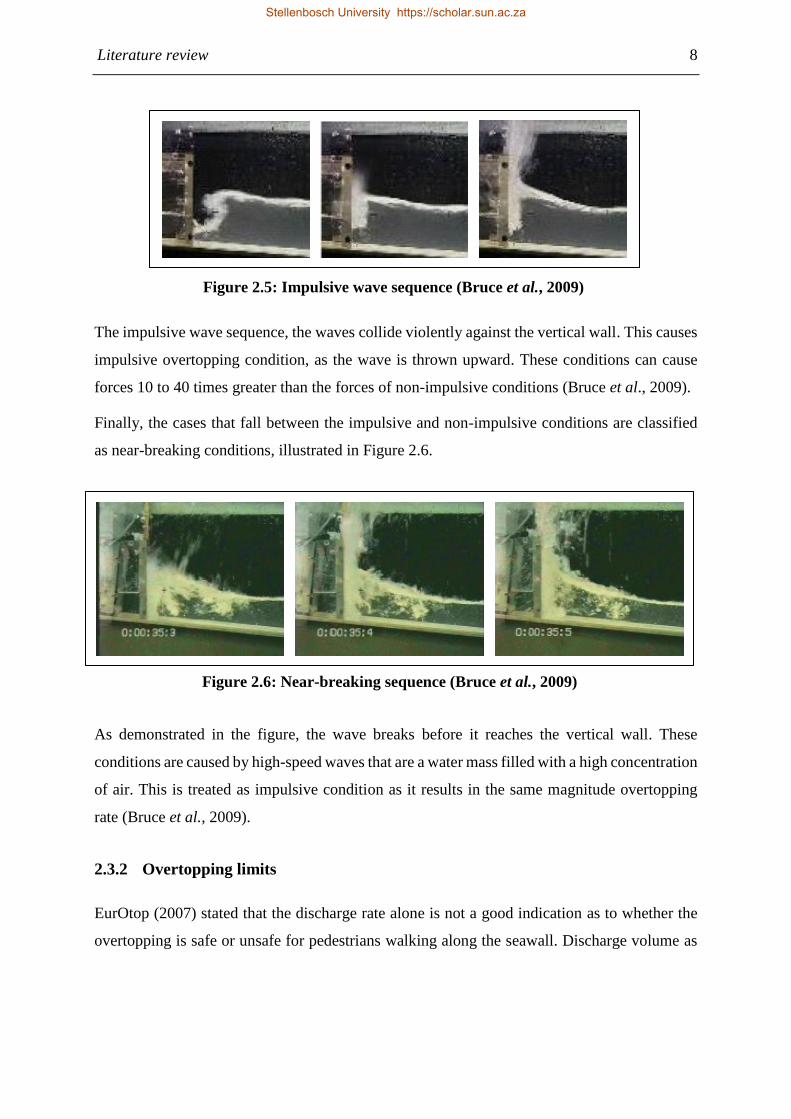
Figure 2.5 shows the impulsive/breaking wave sequence, which occurs when the waves are
larger in comparison with the water depth at the toe of the structure.
Figure 2.4: Non-impulsive/pulsating wave sequence (Bruce et al., 2009)
Stellenbosch University https://scholar.sun.ac.za
Page 29
Literature review 8
The impulsive wave sequence, the waves collide violently against the vertical wall. This causes
impulsive overtopping condition, as the wave is thrown upward. These conditions can cause
forces 10 to 40 times greater than the forces of non-impulsive conditions (Bruce et al., 2009).
Finally, the cases that fall between the impulsive and non-impulsive conditions are classified
as near-breaking conditions, illustrated in Figure 2.6.
As demonstrated in the figure, the wave breaks before it reaches the vertical wall. These
conditions are caused by high-speed waves that are a water mass filled with a high concentration
of air. This is treated as impulsive condition as it results in the same magnitude overtopping
rate (Bruce et al., 2009).
2.3.2 Overtopping limits
EurOtop (2007) stated that the discharge rate alone is not a good indication as to whether the
overtopping is safe or unsafe for pedestrians walking along the seawall. Discharge volume as
Figure 2.5: Impulsive wave sequence (Bruce et al., 2009)
Figure 2.6: Near-breaking sequence (Bruce et al., 2009)
Stellenbosch University https://scholar.sun.ac.za
Page 30
Literature review 9
an alternative would be a better indicator. However, there is little information available on
hazard levels for the wide range of structures used to control overtopping.
Most research on overtopping limits, however, are expressed as discharge, therefore this
measure will be used in this study.
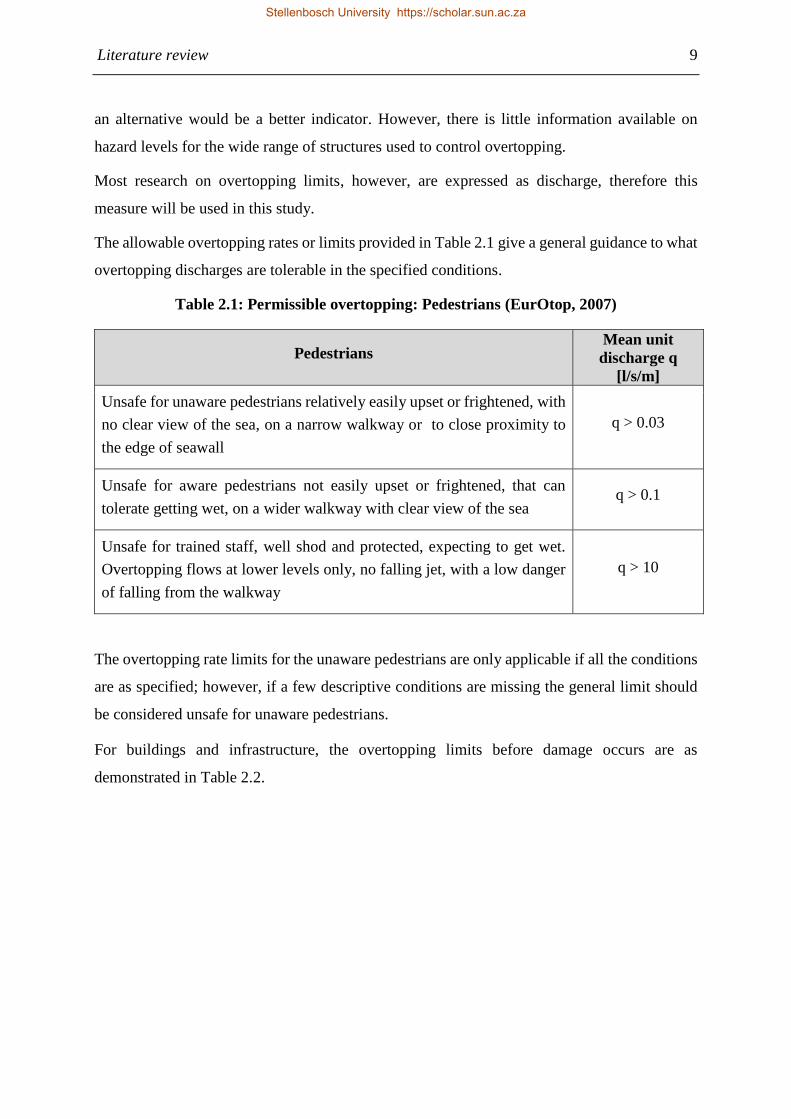
The allowable overtopping rates or limits provided in Table 2.1 give a general guidance to what
overtopping discharges are tolerable in the specified conditions.
Table 2.1: Permissible overtopping: Pedestrians (EurOtop, 2007)
Pedestrians Mean unit
discharge q
[l/s/m]
Unsafe for unaware pedestrians relatively easily upset or frightened, with
no clear view of the sea, on a narrow walkway or to close proximity to
the edge of seawall
q > 0.03
Unsafe for aware pedestrians not easily upset or frightened, that can
tolerate getting wet, on a wider walkway with clear view of the sea q > 0.1
Unsafe for trained staff, well shod and protected, expecting to get wet.
Overtopping flows at lower levels only, no falling jet, with a low danger
of falling from the walkway
q > 10
The overtopping rate limits for the unaware pedestrians are only applicable if all the conditions
are as specified; however, if a few descriptive conditions are missing the general limit should
be considered unsafe for unaware pedestrians.
For buildings and infrastructure, the overtopping limits before damage occurs are as
demonstrated in Table 2.2.
Stellenbosch University https://scholar.sun.ac.za
Page 31
Literature review 10
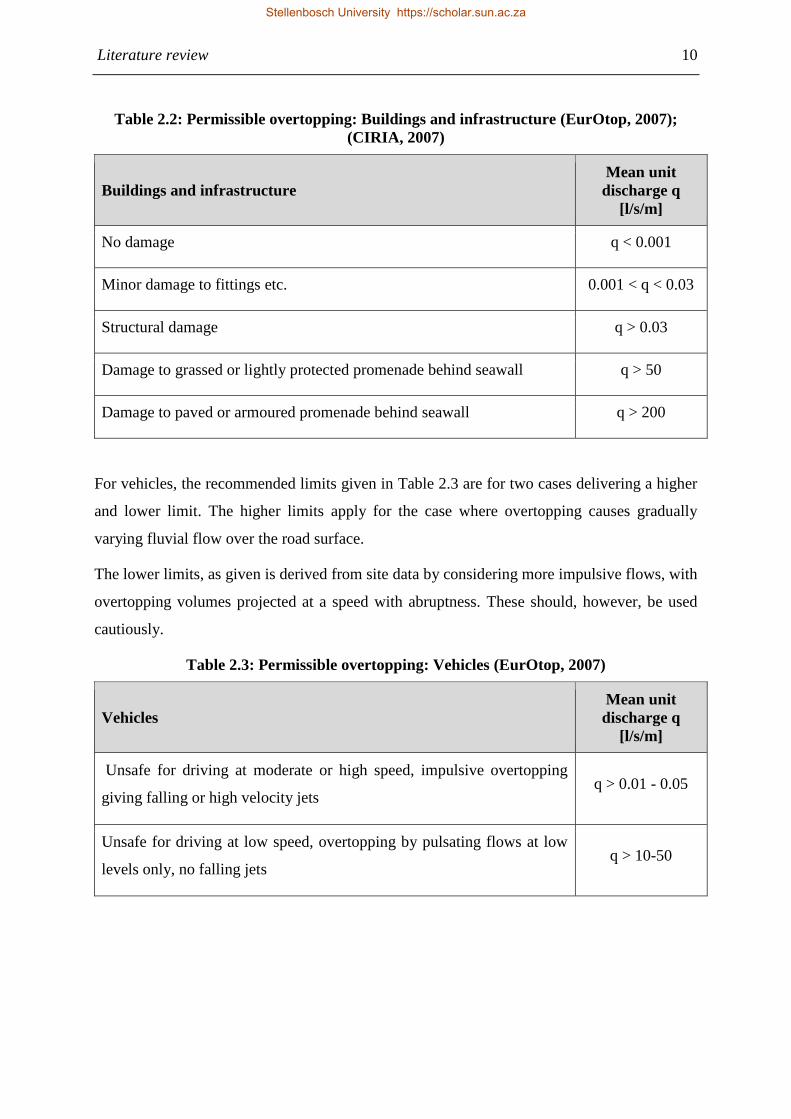
Table 2.2: Permissible overtopping: Buildings and infrastructure (EurOtop, 2007);
(CIRIA, 2007)
Buildings and infrastructure
Mean unit
discharge q
[l/s/m]
No damage q < 0.001
Minor damage to fittings etc. 0.001 < q < 0.03
Structural damage q > 0.03
Damage to grassed or lightly protected promenade behind seawall q > 50
Damage to paved or armoured promenade behind seawall q > 200
For vehicles, the recommended limits given in Table 2.3 are for two cases delivering a higher
and lower limit. The higher limits apply for the case where overtopping causes gradually
varying fluvial flow over the road surface.
The lower limits, as given is derived from site data by considering more impulsive flows, with
overtopping volumes projected at a speed with abruptness. These should, however, be used
cautiously.
Table 2.3: Permissible overtopping: Vehicles (EurOtop, 2007)
Vehicles
Mean unit
discharge q
[l/s/m]
Unsafe for driving at moderate or high speed, impulsive overtopping
giving falling or high velocity jets q > 0.01 - 0.05
Unsafe for driving at low speed, overtopping by pulsating flows at low
levels only, no falling jets q > 10-50
Stellenbosch University https://scholar.sun.ac.za
Page 32
Literature review 11
2.3.3 Effects of wind
The wind has an effect not only on the water spray generated in type 3 overtopping, but can
also influence the water volume. The wind can dampen or amplify the water jet, change the
incident wave profile or modify the shape or angle of physical jet (Allsop, Bruce, Pearson &
Besley, 2005).
These processes are difficult to recreate in small-scale tests and, while little information is
available on the actual effect, they were omitted for the purposes of this study. The effect of
wind on overtopping volume is an additional design constraint that should be carefully
considered, for it can cause significant offset if onshore wind is present, or cause over design if
offshore wind present (Allsop et al., 2005).
2.4 Design guidelines for recurve seawalls: Fundamental research
2.4.1 Owen and Steele (1993)
Owen and Steele (1993) performed research on two recurve seawall profiles, one profile
recommended by Berkeley-Thorn and Roberts (1981) and a second recommended by Owen
and Steele (1993). Provided below is the profile developed by Berkeley-Thorn and Roberts
(1981) with typical dimensions.
Table 2.4: Berkeley-Thorn and Roberts (1981) recurve wall geometry
Prototype parameters (m)
H 0.61 0.91 1.22 1.52 1.83
A 0.53 0.79 1.05 1.33 1.63
B 0.38 0.5 0.61 0.72 0.84
C 0.33 0.42 0.52 0.6 0.67
D 0.31 0.52 0.75 0.99 1.24
E 0.15 0.23 0.3 0.38 0.46
F 0.1 0.1 0.11 0.11 0.11
Stellenbosch University https://scholar.sun.ac.za
Page 33
Literature review 12
This shape is valuable since the curve shoots back the incipient wave at a shallow angle
(measuring from the SWL), which reduces the probability of the wave being carried over the
crest of the structure in the form of spray (Owen & Steele, 1993).
Incoming waves break on the slope, or on the wall, and reflect back seaward. In reality, these
two functions are not mutually exclusive and generally, when both occur, an erosive force,
which results in toe protection problems, is found to occur (Berkeley-Thorn & Roberts, 1981).
This can be prevented in the design phase, by designing to protect the wall and toe by
incorporating a dissipating feature.
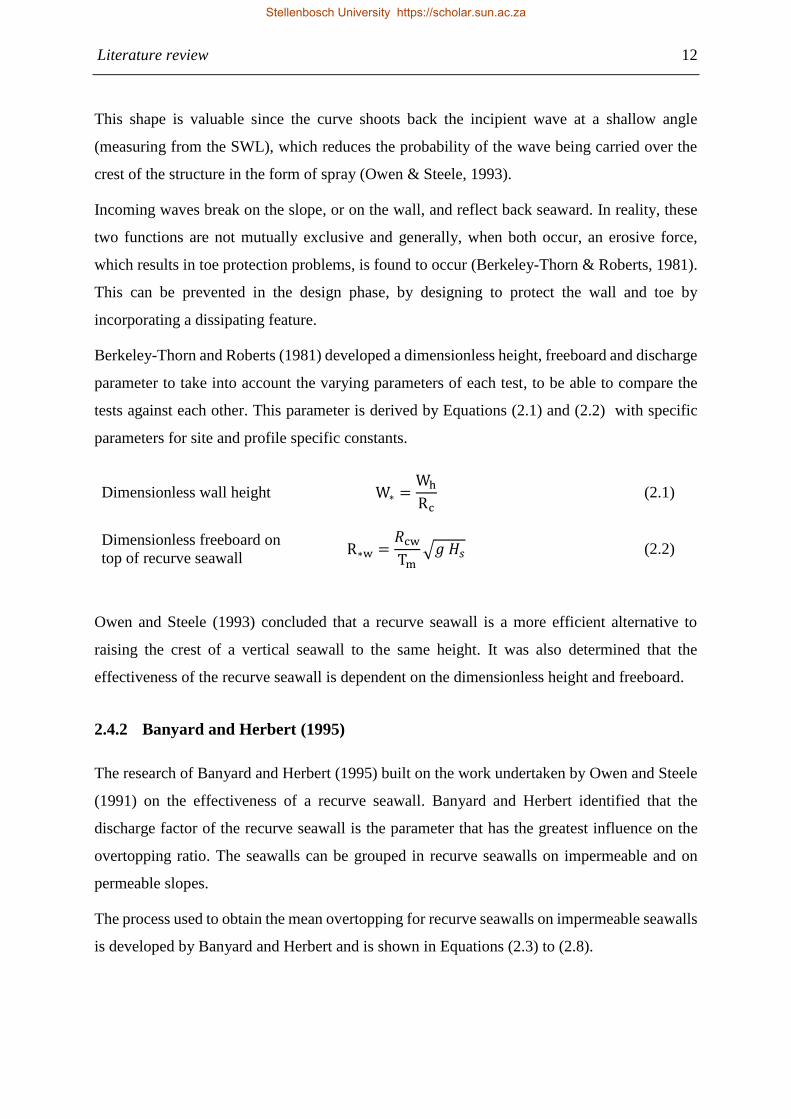
Berkeley-Thorn and Roberts (1981) developed a dimensionless height, freeboard and discharge
parameter to take into account the varying parameters of each test, to be able to compare the
tests against each other. This parameter is derived by Equations (2.1) and (2.2) with specific
parameters for site and profile specific constants.
Dimensionless wall height W∗ =Wh
Rc (2.1)
Dimensionless freeboard on
top of recurve seawall R∗w =
𝑅cw
Tm√𝑔 𝐻𝑠 (2.2)
Owen and Steele (1993) concluded that a recurve seawall is a more efficient alternative to
raising the crest of a vertical seawall to the same height. It was also determined that the
effectiveness of the recurve seawall is dependent on the dimensionless height and freeboard.
2.4.2 Banyard and Herbert (1995)
The research of Banyard and Herbert (1995) built on the work undertaken by Owen and Steele
(1991) on the effectiveness of a recurve seawall. Banyard and Herbert identified that the
discharge factor of the recurve seawall is the parameter that has the greatest influence on the
overtopping ratio. The seawalls can be grouped in recurve seawalls on impermeable and on
permeable slopes.
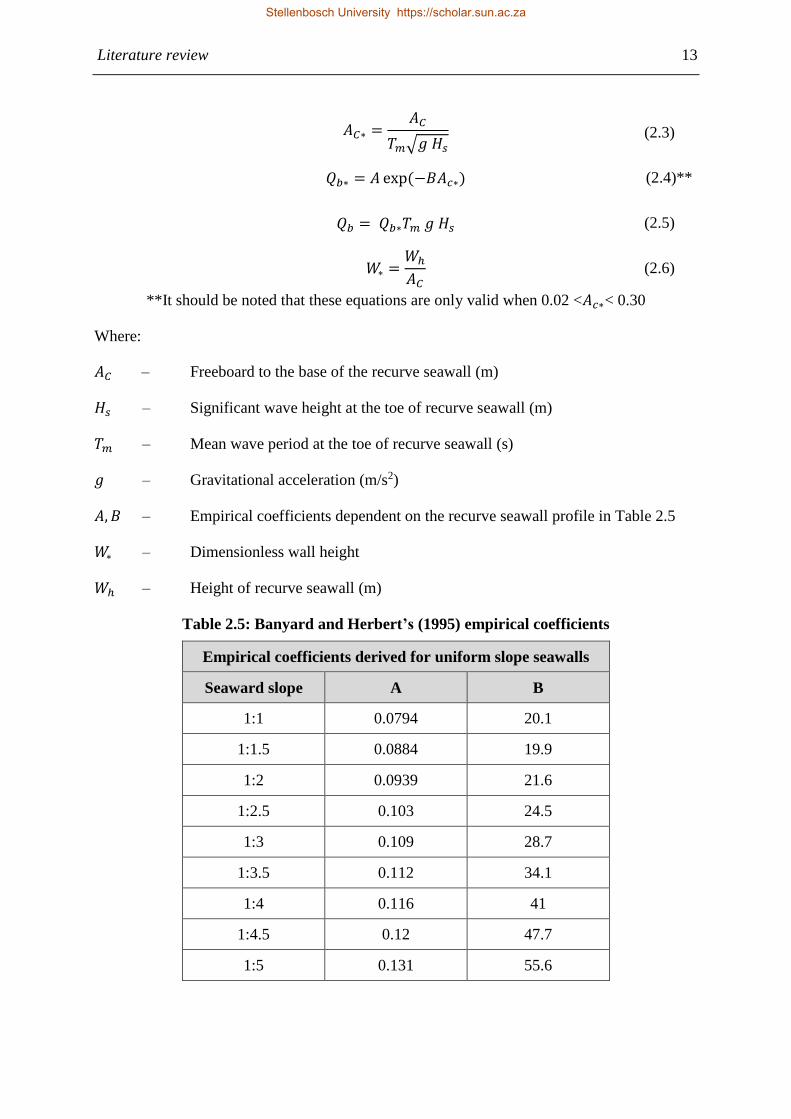
The process used to obtain the mean overtopping for recurve seawalls on impermeable seawalls
is developed by Banyard and Herbert and is shown in Equations (2.3) to (2.8).
Stellenbosch University https://scholar.sun.ac.za
Page 34
Literature review 13
𝐴𝐶∗ =𝐴𝐶
𝑇𝑚√𝑔 𝐻𝑠
(2.3)
𝑄𝑏∗ = 𝐴 exp(−𝐵𝐴𝑐∗) (2.4)**
𝑄𝑏 = 𝑄𝑏∗𝑇𝑚 𝑔 𝐻𝑠 (2.5)
𝑊∗ =𝑊ℎ
𝐴𝐶 (2.6)
**It should be noted that these equations are only valid when 0.02 <𝐴𝑐∗< 0.30
Where:
𝐴𝐶 – Freeboard to the base of the recurve seawall (m)
𝐻𝑠 – Significant wave height at the toe of recurve seawall (m)
𝑇𝑚 – Mean wave period at the toe of recurve seawall (s)
𝑔 – Gravitational acceleration (m/s2)
𝐴, 𝐵 – Empirical coefficients dependent on the recurve seawall profile in Table 2.5
𝑊∗ – Dimensionless wall height
𝑊ℎ – Height of recurve seawall (m)
Table 2.5: Banyard and Herbert’s (1995) empirical coefficients
Empirical coefficients derived for uniform slope seawalls
Seaward slope A B
1:1 0.0794 20.1
1:1.5 0.0884 19.9
1:2 0.0939 21.6
1:2.5 0.103 24.5
1:3 0.109 28.7
1:3.5 0.112 34.1
1:4 0.116 41
1:4.5 0.12 47.7
1:5 0.131 55.6
Stellenbosch University https://scholar.sun.ac.za
Page 35
Literature review 14
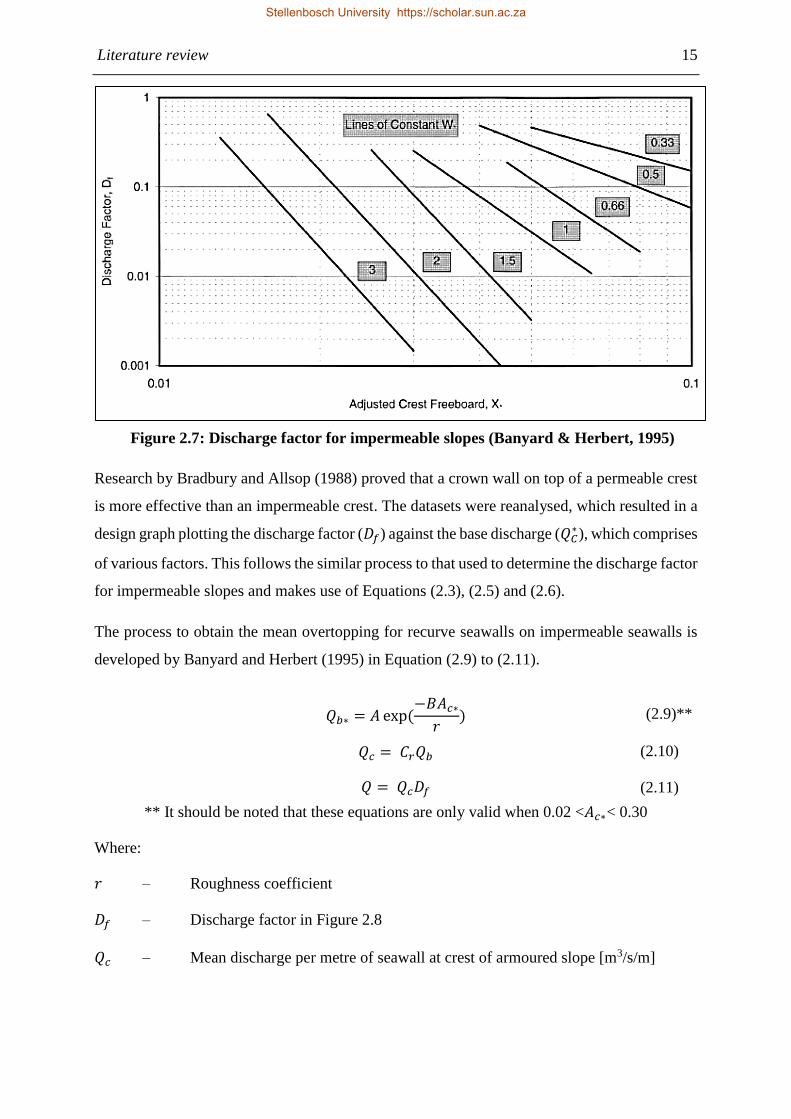
The freeboard is adjusted for the distance of the wall behind the top of the seaward slope by
means of applying Equation (2.7). With the adjusted freeboard calculated, the discharge factor
is acquired with the use the graph illustrated in Figure 2.7.
𝑋∗ = 𝐴𝑓𝐴𝐶∗ (2.7)
𝑄 = 𝑄𝑏𝐷𝑓 (2.8)
Where:
𝑄𝑏 – Base discharge (m3/s/m)
𝐴𝑓 – Adjustment factor, refer to Table 2.6
𝐷𝑓 – Discharge factor in Figure 2.7
Research by Besley (1999) determined that if the dimensionless relative wave return height W∗
is 0.55 and, at high 𝐴𝐶∗, the recurve wall provides good reduction in overtopping rate. However,
at a low 𝐴𝐶∗, the water level will raise to the curved section of the recurve wall. The recurve
wall will not be as effective and become drowned (Besley, 1999).
Table 2.6: Banyard and Herbert’s (1995) adjustment factors
𝑾𝒉 𝑨𝑪⁄ ≥ 0.6 𝑾𝒉 𝑨𝑪⁄ < 0.6
Seawall
Slope
Crest berm
width (𝑪𝑾) 𝑨𝒇
Seawall
Slope
Crest berm
width (𝑪𝑾) 𝑨𝒇
1:2 0 1 1:2 0 1
1:2 4 1.07 1:2 4 1.34
1:2 8 1.1 1:2 8 1.38
1:4 0 1.27 1:4 0 1.27
1:4 4 1.22 1:4 4 1.53
1:4 8 1.33 1:4 8 1.67
Stellenbosch University https://scholar.sun.ac.za
Page 36
Literature review 15
Research by Bradbury and Allsop (1988) proved that a crown wall on top of a permeable crest
is more effective than an impermeable crest. The datasets were reanalysed, which resulted in a
design graph plotting the discharge factor (𝐷𝑓) against the base discharge (𝑄𝐶∗), which comprises
of various factors. This follows the similar process to that used to determine the discharge factor
for impermeable slopes and makes use of Equations (2.3), (2.5) and (2.6).
The process to obtain the mean overtopping for recurve seawalls on impermeable seawalls is
developed by Banyard and Herbert (1995) in Equation (2.9) to (2.11).
𝑄𝑏∗ = 𝐴 exp(−𝐵𝐴𝑐∗
𝑟) (2.9)**
𝑄𝑐 = 𝐶𝑟𝑄𝑏 (2.10)
𝑄 = 𝑄𝑐𝐷𝑓 (2.11)
** It should be noted that these equations are only valid when 0.02 <𝐴𝑐∗< 0.30
Where:
𝑟 – Roughness coefficient
𝐷𝑓 – Discharge factor in Figure 2.8
𝑄𝑐 – Mean discharge per metre of seawall at crest of armoured slope [m3/s/m]
Figure 2.7: Discharge factor for impermeable slopes (Banyard & Herbert, 1995)
Stellenbosch University https://scholar.sun.ac.za
Page 37
Literature review 16
These two processes may be followed in reverse to determine what reduction in overtopping
can be expected with any selected design for a wave return recurve wall.
2.4.3 Clifford (1996)
The recurve profile developed by Berkeley-Thorn and Roberts (1981) was used in this study.
The parameters are provided in the definition sketch, Figure 2.9 (Clifford, 1996).
Figure 2.8: Discharge factor for permeable slopes (Banyard & Herbert, 1995)
Crest
width Cw
Sloping
sea wall
Wave conditions Hs Tm
Freeboard
RC
Wave overtopping Q
SWL
1
Wall height
WH
Wave
recurve
m
Figure 2.9: Clifford (1996) definition sketch
Stellenbosch University https://scholar.sun.ac.za
Page 38
Literature review 17
The recurve walls can be located either on top of the seaward slope (with 𝐶𝑊 = 0), or a few
meters to the back of it, to create a promenade on the width of the crest. The tests were
performed with two different seaward slopes, 1:2 and 1:4.
The adjustments to the crest berm freeboard (𝑅∗) necessary to correlate the various tests,
depending on the ratio of wall height (𝑊ℎ) to freeboard height (𝑅𝑐) are provided in Table 2.7.
Table 2.7: Crest berm freeboard adjustment factors (Clifford, 1996)
Seawall slope Crest width
𝑪𝒘
𝑾𝒉
𝑹𝑪≥
𝟐
𝟑
𝑾𝒉
𝑹𝑪≤
𝟏
𝟐
Adjustment
factor 𝑨𝒇
Adjustment
factor 𝑨𝒇
1:2 0 1 1
1:2 4 1.07 1.34
1:2 8 1.1 1.38
1:4 0 1.27 1.27
1:4 4 1.22 1.53
1:4 8 1.33 1.67
The adjusted crest berm freeboard (𝑋∗) is plotted against the discharge factor in Figure 2.10 as
illustrated in Equations (2.1) and (2.7). The result graphs are setup with the known parameters
for the ease of the designer.
Stellenbosch University https://scholar.sun.ac.za
Page 39
Literature review 18
2.5 Design guidelines for recurve seawalls: Recent studies
2.5.1 CLASH
The Crest Level Assessment of coastal Structures by full-scale monitoring, neural network
prediction and Hazard analysis on permissible wave overtopping (CLASH) project, was
initiated by the European Union to gather information regarding wave overtopping. The focus
is on the prediction and the actual behaviour of overtopping in physical models, for a wide
range of coastal structures. These investigations were done both on large scale and in laboratory
conditions.
The main objectives are to determine scale effects and to create an overtopping prediction
method based on Neural Networks (Van Gent, Pozueta, Van den Boogaard & Medina, 2005).
The CLASH database comprises of 31 parameters: 17 structural parameters, 11 hydraulic
parameters and three general parameters, which were all screened before being included in the
database. Approximately 1000 tests were excluded by the screening process, which was a
crucial process designed to ensure data entered in the databases is accurate in order to achieve
Lines of constant W*
Dimensionless Adjusted Crest Berm Freeboard
X*
0.01 0.02 0.04 0.06 0.08 0.1
Discharge Factor Df
0.1
0.01
0.001
1
Figure 2.10: Adjustment discharge factors (Clifford (1996) adapted by author)
Stellenbosch University https://scholar.sun.ac.za
Page 40
Literature review 19
the best possible results. The CLASH database now consists of 10 000 wave overtopping test
results performed on a wide range of structures.
This has resulted in certain tests being used to generate an empirical method to predict wave
overtopping. This prediction was made by an artificial neural network (NN), an algorithm that
uses a large database to estimate the overtopping generated by specified wave conditions. The
use of a neural network is recommended when a large amount of data needs to be analysed and
when the dataset is dependent on more than one parameter (Allsop, Pullen, van der Meer, Bruce,
Schüttrumpf & Kortenhaus, 2008).
If not enough data is available, the NN would extrapolate between the two available data points.
This would deliver an unreliable overtopping estimation and not the preferred method.
Similarly, the quality and accuracy of the input parameters determine the quality and the
accuracy of the output (Allsop et al., 2008). Allsop, et al. (2005) recommended that a minimum
of 15 parameters be used for input to deliver a reliable overtopping estimation.
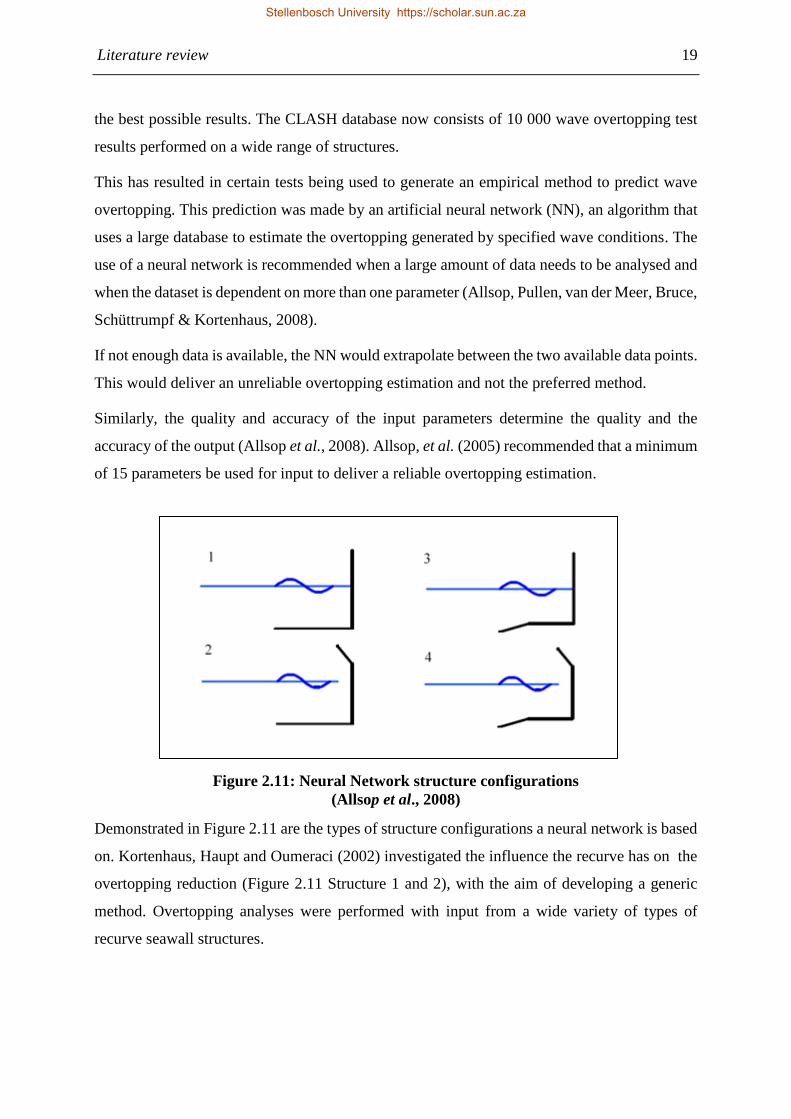
Demonstrated in Figure 2.11 are the types of structure configurations a neural network is based
on. Kortenhaus, Haupt and Oumeraci (2002) investigated the influence the recurve has on the
overtopping reduction (Figure 2.11 Structure 1 and 2), with the aim of developing a generic
method. Overtopping analyses were performed with input from a wide variety of types of
recurve seawall structures.
Figure 2.11: Neural Network structure configurations
(Allsop et al., 2008)
Stellenbosch University https://scholar.sun.ac.za
Page 41
Literature review 20
Another method to estimate wave overtopping is the empirical method developed by the VOWS
project by Allsop et al. (2008). The EurOtop Overtopping Manual (2007) provides the public
with an online estimation tool to determine the overtopping rate that can be expected for certain
composite seawalls.
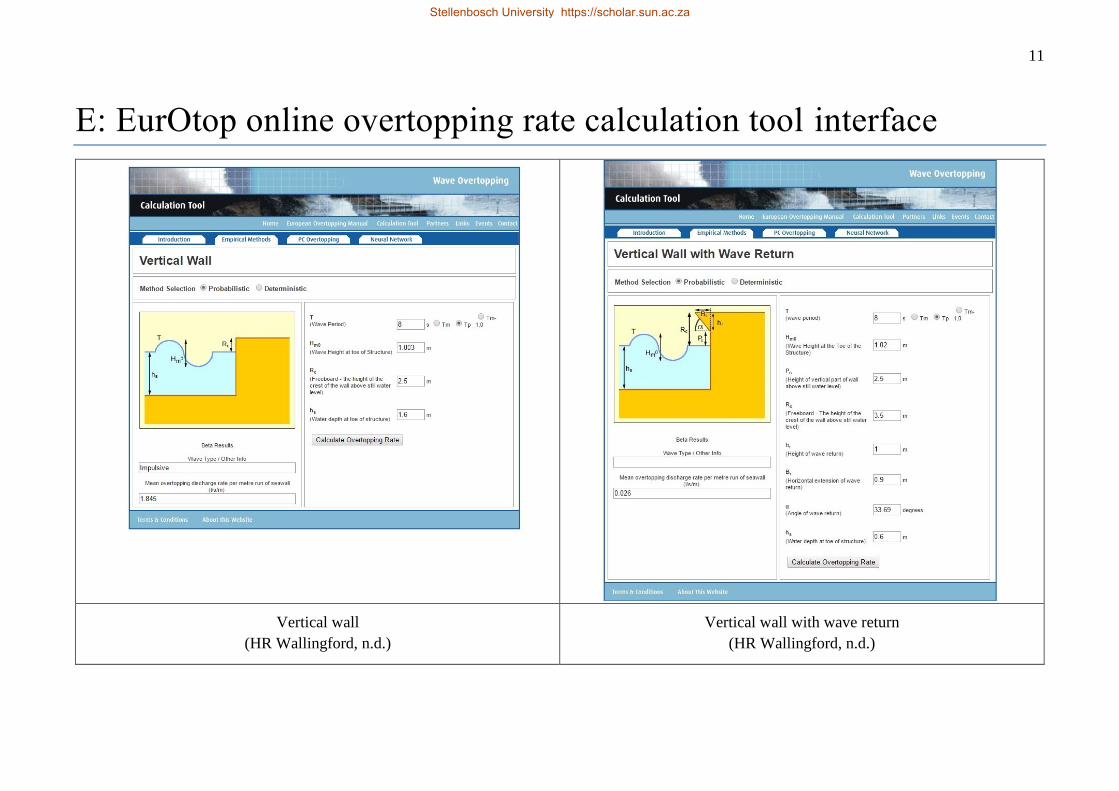
On the online form, the user provides similar geometric parameters to those required for the use
of the neural network. The interface of the vertical wall and the vertical wall with wave return
is demonstrated in Annexure E.
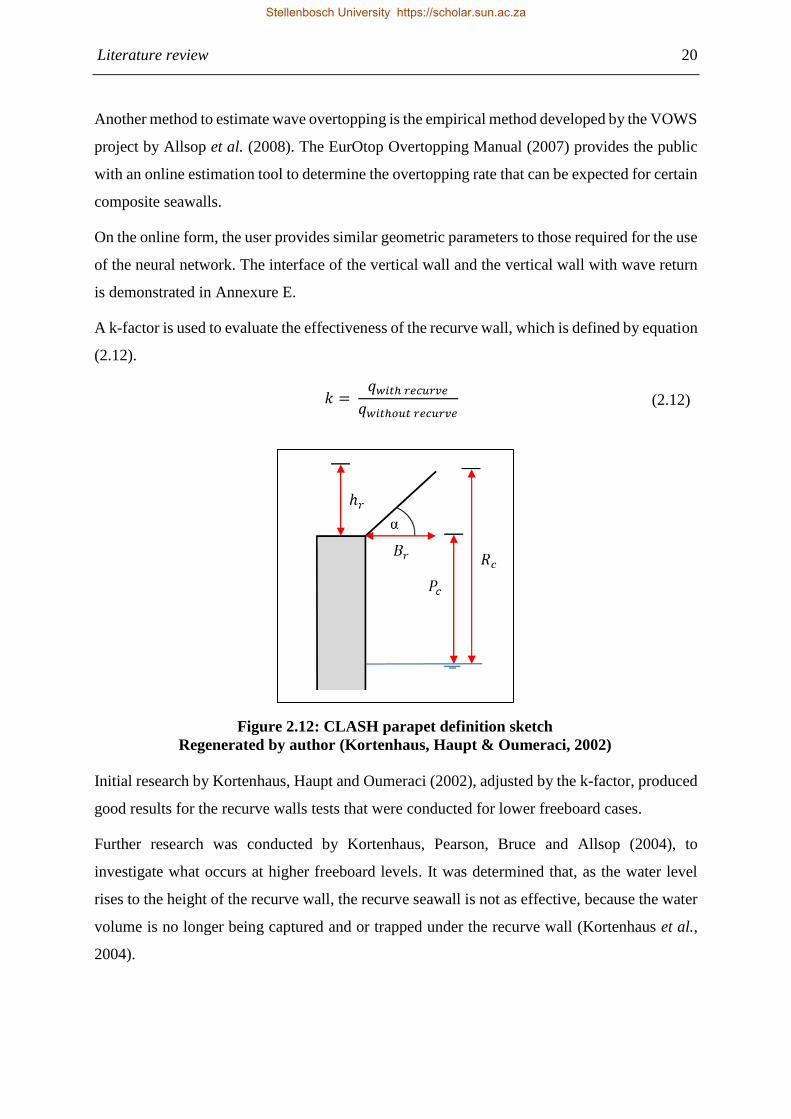
A k-factor is used to evaluate the effectiveness of the recurve wall, which is defined by equation
(2.12).
𝑘 = 𝑞𝑤𝑖𝑡ℎ 𝑟𝑒𝑐𝑢𝑟𝑣𝑒
𝑞𝑤𝑖𝑡ℎ𝑜𝑢𝑡 𝑟𝑒𝑐𝑢𝑟𝑣𝑒 (2.12)
Initial research by Kortenhaus, Haupt and Oumeraci (2002), adjusted by the k-factor, produced
good results for the recurve walls tests that were conducted for lower freeboard cases.
Further research was conducted by Kortenhaus, Pearson, Bruce and Allsop (2004), to
investigate what occurs at higher freeboard levels. It was determined that, as the water level
rises to the height of the recurve wall, the recurve seawall is not as effective, because the water
volume is no longer being captured and or trapped under the recurve wall (Kortenhaus et al.,
2004).
Figure 2.12: CLASH parapet definition sketch
Regenerated by author (Kortenhaus, Haupt & Oumeraci, 2002)
Stellenbosch University https://scholar.sun.ac.za
Page 42
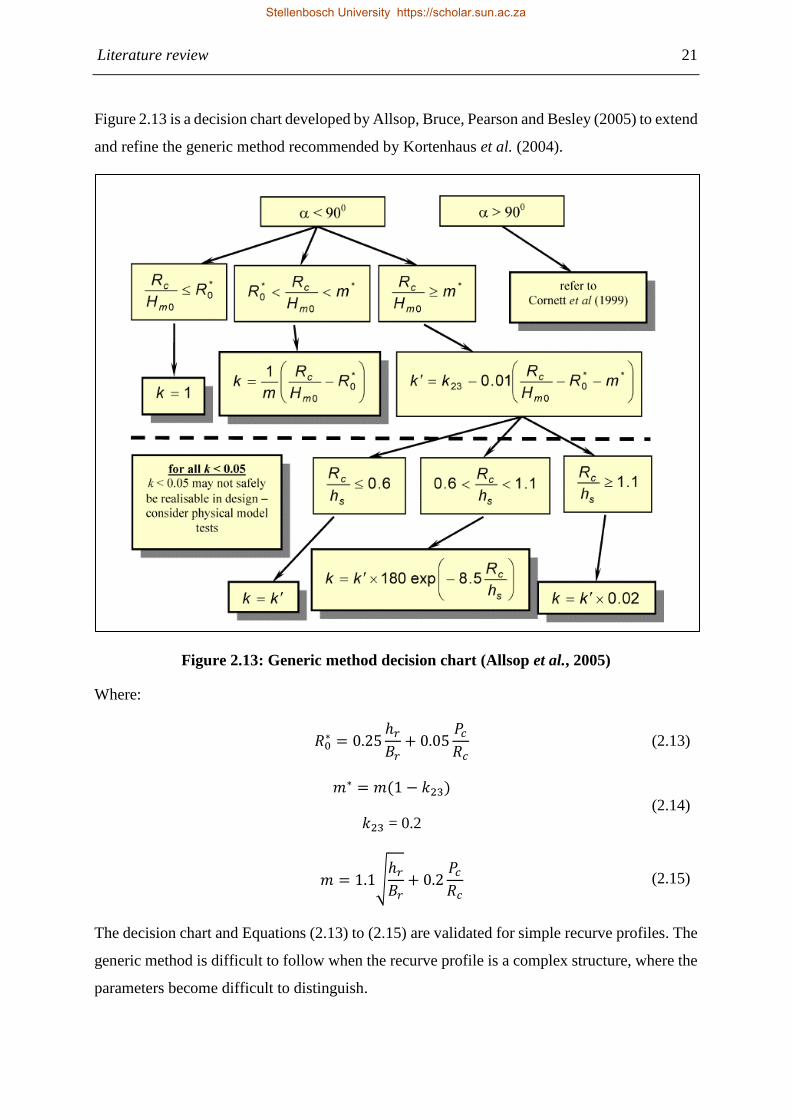
Literature review 21
Figure 2.13 is a decision chart developed by Allsop, Bruce, Pearson and Besley (2005) to extend
and refine the generic method recommended by Kortenhaus et al. (2004).
Figure 2.13: Generic method decision chart (Allsop et al., 2005)
Where:
𝑅0
∗ = 0.25ℎ𝑟
𝐵𝑟+ 0.05
𝑃𝑐
𝑅𝑐 (2.13)
𝑚∗ = 𝑚(1 − 𝑘23)
𝑘23 = 0.2 (2.14)
𝑚 = 1.1√ℎ𝑟
𝐵𝑟+ 0.2
𝑃𝑐
𝑅𝑐 (2.15)
The decision chart and Equations (2.13) to (2.15) are validated for simple recurve profiles. The
generic method is difficult to follow when the recurve profile is a complex structure, where the
parameters become difficult to distinguish.
Stellenbosch University https://scholar.sun.ac.za
Page 43
Literature review 22
The method proposed by Kortenhaus, Haupt and Oumeraci (2002) under-predicts the reduction
factors for high overtopping rates and delivers conservative overtopping reduction factors for
low overtopping rates.
To improve this method and reduce the scatter, the large CLASH database was evaluated in
combination with the VOWS project and no general trend emerged. Kortenhaus, Pearson Bruce
and Allsop (2004) concluded that it is not possible to find a generic method. However, in order
to determine a reduction factor approach for recurve seawalls, the results were grouped by their
geometry, size and form. Kortenhaus et al. (2004) analysed photographs and videos to isolate
the key physical process that reduce overtopping volumes.
The CLASH database data is often analysed by plotting the dimensionless overtopping
parameter against the freeboard over significant wave height.
𝐷𝑖𝑚𝑒𝑛𝑠𝑖𝑜𝑛𝑙𝑒𝑠𝑠 𝑜𝑣𝑒𝑟𝑡𝑜𝑝𝑝𝑖𝑛𝑔 𝑝𝑎𝑟𝑎𝑚𝑒𝑡𝑒𝑟 =𝑄
√𝑔 𝐻𝑚𝑜3
(2.16)
The scatter was not completely removed, which had been expected to some extent, considering
the wide range of geometries that was compared. The approach of Kortenhaus et al. (2004)
delivered conservative reduction factors, which indicate an overestimation of predictive
reduction factors, and Kortenhaus et al. (2004) finally concluded that the level of the reduction
factor is dependent on the magnitude of overtopping.
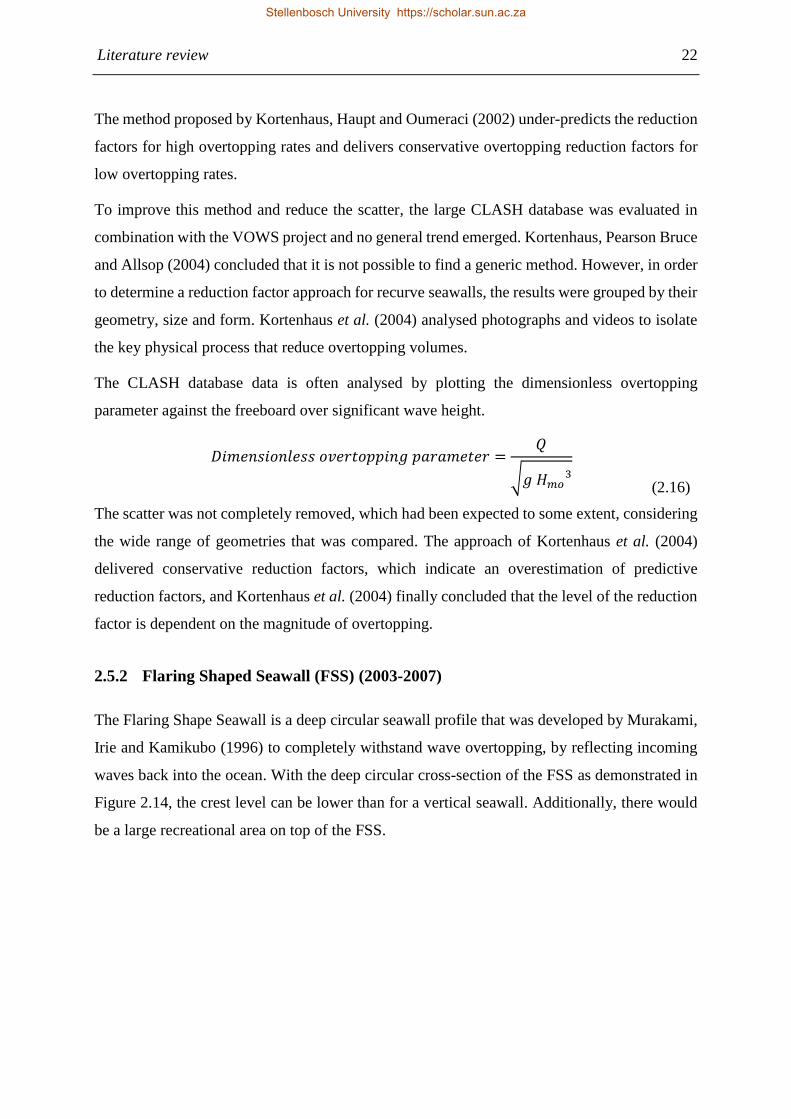
2.5.2 Flaring Shaped Seawall (FSS) (2003-2007)
The Flaring Shape Seawall is a deep circular seawall profile that was developed by Murakami,
Irie and Kamikubo (1996) to completely withstand wave overtopping, by reflecting incoming
waves back into the ocean. With the deep circular cross-section of the FSS as demonstrated in
Figure 2.14, the crest level can be lower than for a vertical seawall. Additionally, there would
be a large recreational area on top of the FSS.
Stellenbosch University https://scholar.sun.ac.za
Page 44
Literature review 23
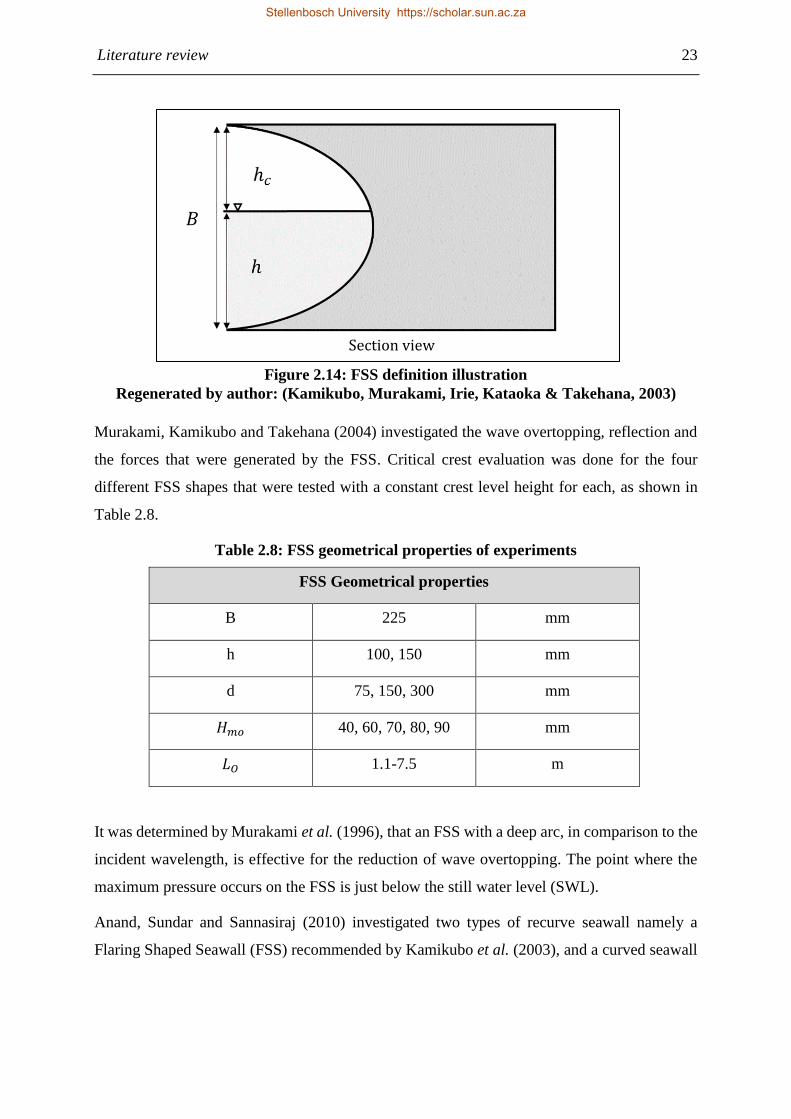
Murakami, Kamikubo and Takehana (2004) investigated the wave overtopping, reflection and
the forces that were generated by the FSS. Critical crest evaluation was done for the four
different FSS shapes that were tested with a constant crest level height for each, as shown in
Table 2.8.
Table 2.8: FSS geometrical properties of experiments
FSS Geometrical properties
B 225 mm
h 100, 150 mm
d 75, 150, 300 mm
𝐻𝑚𝑜 40, 60, 70, 80, 90 mm
𝐿𝑂 1.1-7.5 m
It was determined by Murakami et al. (1996), that an FSS with a deep arc, in comparison to the
incident wavelength, is effective for the reduction of wave overtopping. The point where the
maximum pressure occurs on the FSS is just below the still water level (SWL).
Anand, Sundar and Sannasiraj (2010) investigated two types of recurve seawall namely a
Flaring Shaped Seawall (FSS) recommended by Kamikubo et al. (2003), and a curved seawall
Figure 2.14: FSS definition illustration
Regenerated by author: (Kamikubo, Murakami, Irie, Kataoka & Takehana, 2003)
Section view
Stellenbosch University https://scholar.sun.ac.za
Page 45
Literature review 24
shape (CPS) investigated by Weber (1934). The focus of this study was the magnitude and
location the pressure induced by the waves breaking against the seawall.
The tests were administered for a 𝑇𝑝 of 1 and 3 seconds with a varying depth of 0.88 and 1 m
(model values). The two different profiles are provided in Figure 2.15 indicating the locations
the pressure transducers situated on the seawalls.
Figure 2.15: Pressure transducers on FSS and CPS profiles
(Anand, Sundar & Sannasiraj, 2010)
Kamikubo et al. (2003) validated that the location on the profile where the greatest pressure
was induced was just below the SWL. Plotting a dimensionless pressure parameter 𝑃𝑠 ∗ the FSS
experienced the largest pressures just below the SWL, delivering lower velocities. From that it
was concluded that the FSS would have the least amount of scouring at the toe of the structure
(Anand et al., 2010). In the comparison of the two profiles, the FSS outperformed the CPS
delivering no overtopping of waves.
Depending on the seabed profile or the sea depth, a rubble mound structure is required at the
bottom of the structure (Murakami, Kamikubo & Kataoka, 2008). This is to dissipate energy
and to tilt the incoming waves towards the structure.
Further research was employed to determine the effect that a vertical wall on top of the FSS
would have on the amount of water spray that would move over the crest of the structure. As
demonstrated in Figure 2.16, the FSS both with and without a crown wall was tested to compare
the efficiency of each in the reduction of overtopping (Kamikubo et al., 2003).
Stellenbosch University https://scholar.sun.ac.za
Page 46
Literature review 25
Kamikubo et al. (2003) determined that the FSS outperformed a vertical upright seawall. It
could further be concluded that the volume of water spray travelling across FSS crest
significantly decreased when a crown wall was constructed on the top of the structure.
Murakami, Maki and Takehana (2011) conducted research with 11 FSS units to determine the
effect of oblique wave attack on wave overtopping. This study concluded that the FSS improves
the overtopping reduction performance of a vertical wall for oblique wave attack. A further
conclusion was that the FSS is more efficient for short wave periods (Murakami et al., 2011).
2.5.3 Allsop et al. (2005)
Allsop et al. (2005) did research mainly on the behaviour of overtopping of vertical walls.
According to Allsop et al., for vertical walls it is critical to determine whether the wave
condition is pulsating or non-pulsating, to determine how to further assess the overtopping
results. The impulsiveness parameter is defined by using Equation (2.17) and classified in Table
2.9.
ℎ∗ = 1.3ℎ𝑠 2𝜋ℎ𝑠
𝐻𝑚𝑜 𝑔 𝑇𝑚−1,02 (2.17)
Figure 2.16a: FSS, b: FSS with vertical wall on top of structure
(Kamikubo et al., 2003)
a) b)
Stellenbosch University https://scholar.sun.ac.za
Page 47
Literature review 26
Figure 2.17: Non-impulsive condition for a vertical wall (Allsop et al., 2005)
Table 2.9: Classification of impulsiveness parameter (Allsop et al., 2005)
Classification of 𝒉∗
ℎ∗ < 0.2 Impulsive conditions
0.2 < ℎ∗ < 0.3 Breaking and non-breaking waves
ℎ∗ > 0.3 Non-impulsive conditions
It was determined that for the non-impulsive case, vertical walls with no freeboard (𝑅𝑐 = 0 m),
the dimensionless overtopping parameter (Equation 2.16) can be used as 0.062 for probabilistic
design purposes.
Allsop et al. (2005) recommended that for deterministic or safety assessment the dimensionless
overtopping parameter should be taken as 0.068. Figure 2.17 is a comparison of CLASH
datasets for the non-impulsive condition for a vertical wall.
By extending the probabilistic trend from Figure 2.17 (indicated as the dark blue line), the trend
line crosses the Y-axis with a dimensionless overtopping parameter of 0.04.
Allsop, Alderson and Chapman (2007) conducted research to reduce the overtopping along the
coastline for both residential and commercial regions where the space was limited, to mitigate
Stellenbosch University https://scholar.sun.ac.za
Page 48
Literature review 27
the risk of property damage. Two recurve walls, as demonstrated in Figure 2.18, were
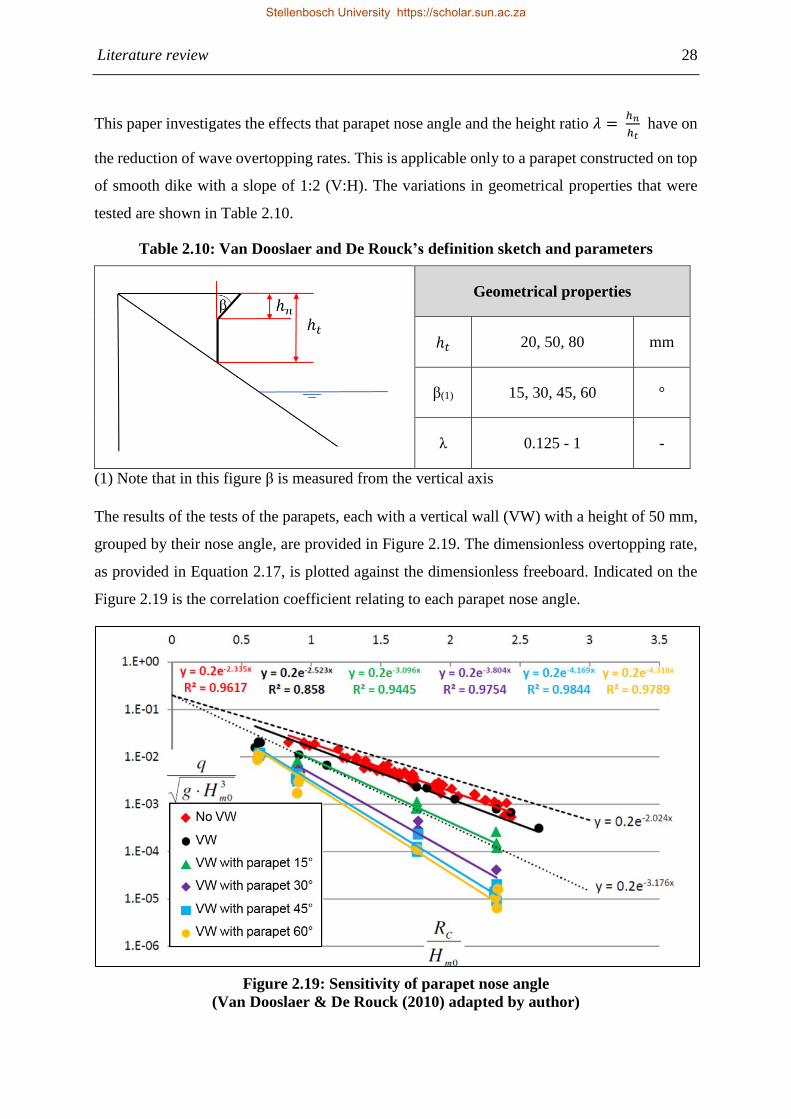
investigated and their performances were compared with those of vertical seawalls.
(a) Recurve seawall inward of the shoreline (b) Recurve seawall seawards of the shoreline
Figure 2.18: Allsop et al. (2007) design profiles
The physical model results determined that the recurve walls would outperform the vertical
walls; however, additional splash guards might be required if 0% overtopping is required.
The recurve wall inland of the shoreline (Figure 2.18 a) in comparison with the vertical walls
proved to reduce the overtopping from two to nine times.
From this investigation it was concluded that if a recurve wall was positioned seaward, there
should not be a vertical face for waves to break against, because the water then bypasses the
recurve and the recurve wall acts as a vertical wall. This can be prevented by the construction
of an angled wall below the recurve, creating a smooth transition to guide the water to fill the
recurve (Allsop et al., 2007).
From this investigation it was determined that in the design of the recurve seawall it is important
to ensure that the recurve wall projects the overtopped water beyond the breaking point of the
incoming waves, otherwise the projected water can be trapped in breaking waves and cause an
air pocket to form (Allsop et al., 2007).
2.5.4 Van Doorslaer and De Rouck (2011)
Van Doorslaer and De Rouck (2011) performed research on the modification of vertical walls
on top of dikes in order to optimise the reduction in wave overtopping. A nose was added to the
vertical wall, as demonstrated in the figure below, without increasing the total height of the
parapet (ℎ𝑡), to reflect water back into the sea instead of projecting water over the structure.
Stellenbosch University https://scholar.sun.ac.za
Page 49
Literature review 28
This paper investigates the effects that parapet nose angle and the height ratio 𝜆 = ℎ𝑛
ℎ𝑡 have on
the reduction of wave overtopping rates. This is applicable only to a parapet constructed on top
of smooth dike with a slope of 1:2 (V:H). The variations in geometrical properties that were
tested are shown in Table 2.10.
Table 2.10: Van Dooslaer and De Rouck’s definition sketch and parameters
Geometrical properties
ℎ𝑡 20, 50, 80 mm
β(1) 15, 30, 45, 60 °
λ 0.125 - 1 -
(1) Note that in this figure β is measured from the vertical axis
The results of the tests of the parapets, each with a vertical wall (VW) with a height of 50 mm,
grouped by their nose angle, are provided in Figure 2.19. The dimensionless overtopping rate,
as provided in Equation 2.17, is plotted against the dimensionless freeboard. Indicated on the
Figure 2.19 is the correlation coefficient relating to each parapet nose angle.
Figure 2.19: Sensitivity of parapet nose angle
(Van Dooslaer & De Rouck (2010) adapted by author)
Stellenbosch University https://scholar.sun.ac.za
Page 50
Literature review 29
The figure highlights that the 45° and 60° parapet angles deliver approximately the same
reduction in overtopping. However, when considering the reduction factor versus the nose
angle, it was determined that when the nose angle becomes greater than 50° it performs the
same as a vertical wall.
From the investigation conducted by Van Dooslaer and De Rouck (2010) it was validated that
a parapet with the same crest height as a smooth dike with no vertical wall improved the
overtopping rates significantly. It was determined that a parapet with a nose angle of 45°
performed the best, and a λ ratio of 1/3 is recommended.
It was also determined that a parapet with a ratio of ℎ𝑡
𝑅𝑐 < 0.25 behaves differently, and a
modified equation was suggested to predict overtopping in such cases. The individual
conditions are difficult to isolate, making it almost impossible to determine which geometrical
condition is responsible for any variation in results.
2.5.5 Veale et al. (2012)
Veale, Suzuki, Verwest, Trouw and Mertens (2012) investigated the optimal parapet geometry
to reduce wave overtopping for the existing sea dike at Wenduine, Belguim. This reduction in
overtopping must be accomplished while keeping the crest level of the dike as low as possible.
Veale et al. (2012) used the recommendations of Van Doorslaer and De Rouck (2011), and
investigated a parapet with a nose angle of 50°, resulting in approximately 150 wave
overtopping tests. Figure 2.20 shows is the three profiles investigated by Veale et al. (2012).
Note that in this study the parapet is a triangle fitted to vertical wall and Re-curve refers to the
recurve shape as demonstrated in Figure 2.20.
Figure 2.20: Experiment profiles (Veale et al., 2012)
Stellenbosch University https://scholar.sun.ac.za
Page 51
Literature review 30
As demonstrated in Figure 2.21 the seawall in position B performs slightly better than at
position A; however, the combination of both positions outperforms either of the other design
configurations.
Figure 2.21: Influence of seawall position (Veale et al., 2012)
However, the seawall that is further considered and discussed in this report is the one at location
B.
The final design of the shore protection is as shown in Figure 2.22, with the primary overtopping
reduction structure replacing the dike and forming a recurve shape. The secondary structure
constrains the overtopping from flowing landward and forms a stilling basin for the flow to
attenuate (Veale, 2012). The second structure is designed to also serve as a bench along the
promenade for recreational purposes.
9.28 m TAW
0.7 m
9.08 m TAW
6.69 m TAW
1.689 m
1:100
10.75 m
0.8 m
Figure 2.22: Promenade cross section (Veale et al. (2012) adapted by author)
Stellenbosch University https://scholar.sun.ac.za
Page 52
Literature review 31
2.5.6 Roux (2013)
Roux (2013) investigated the low crest level problem at Strand, South Africa by means of
numerical and physical modelling. Roux conducted physical model tests on vertical as well as
recurve walls to determine the effectiveness of the proposed design of a recurve wall.
Figure 2.23 shows the recurve wall designed and a side view of the physical model tested, which
was manufactured from Perspex, with an overhang length of 50 mm (on a scale of 1:20).
Roux (2013) determined that when the beach slope was gentler the overtopping rate increased,
as did the width of the beach. Less shoaling occurs as the distance available for the waves to
propagate becomes shorter.
From the physical model tests, Roux determined that the wave period increased the overtopping
rate up to a 12 second wave period, whereafter the overtopping rate declined, as shown in Figure
2.24.
Figure 2.23: Design of recurve wall (left) Side view of recurve wall (right)
(WML coast, 2011) (Roux, 2013)
Stellenbosch University https://scholar.sun.ac.za
Page 53
Literature review 32
It was determined that the decline is attributable to the waves breaking before reaching the wall
and thus losing energy which results in less water overtopping the crest of the recurve wall
(Roux, 2013).
The addition of a recurve overhang to a vertical wall can reduce the overtopping considerably
(Roux, 2013). Further, better reduction still can be achieved by increasing the freeboard. From
the physical model tests Roux noted an average of 54% reduction in overtopping.
From the research dissimilarities were found between non-breaking (pulsating) and impulsive
(breaking) wave conditions. The latter were found to be less sensitive to changes in freeboard.
2.5.7 Schoonees (2014)
Schoonees (2014) investigated the effect of recurve seawalls (Type 3) at the back of a beach to
reduce overtopping as a measure to counteract the rise in sea level, without obstructing the sea
view. Two recurve angles, as shown in Figure 2.25, were tested (one with a long and one with
a short recurve overhang) and evaluated against a vertical seawall, to test the influence of
overhang and determine the optimal design.
Figure 2.24: Influence of wave period on overtopping rate (Roux, 2013)
Wave period
Stellenbosch University https://scholar.sun.ac.za
Page 54
Literature review 33
Tests were performed on physical model with breaking and non-breaking waves with a constant
wall height and bed slope with variation in recurve angle, overhang length and freeboard level.
The test were performed with the geometrical properties given in Table 2.11, with a time series
that was based on 1000𝑇𝑃.
Table 2.11: Geometrical properties of recurve wall (Schoonees, 2014)
Figure 2.26 shows the influence of the overhang length on the mean overtopping rate. However,
the primary objective of the research was not to create design curves for overhang lengths of
recurve seawalls.
Tested profiles Recurve 1
Recurve 2
Figure 2.25: Model geometries (Schoonees, 2014)
Geometrical properties
Freeboard 𝑅𝑐 1.6, 2.0, 2.4, 3.0, 3.4 m
Parapet angle β 0, 45, 60 °
Wave period 𝑇𝑝 10 s
Stellenbosch University https://scholar.sun.ac.za
Page 55
Literature review 34
The study determined that the recurve seawalls provided a reduction in mean overtopping
compared against the vertical wall for high relative freeboard cases and low relative freeboard
cases (Schoonees, 2014).
The tests conducted by Schoonees (2014) showed that recurve profile 2, with the longer sea
facing overhang, was more efficient in reduction of wave overtopping. However, with higher
freeboard levels where 𝑅𝑐
𝐻𝑚0> 2.2, both recurve profiles perform equally well in reflecting the
incoming waves, as the overhang length has less influence on overtopping reduction as for low
freeboard cases. It was also shown that the effectivity was reduced as the freeboard decreased.
The results of the test were validated by the use of the EurOtop calculation tool. In contrast, for
the case where 𝑅𝑐
𝐻𝑚0> 1.4, the recurve wall substantially reduces wave overtopping.
One test was repeated with varying peak periods and the researcher concluded that the degree
of overtopping was sensitive to peak wave period changes. It was recommended that further
Figure 2.26: Influence of overhang length on mean overtopping rate (Schoonees, 2014)
Stellenbosch University https://scholar.sun.ac.za
Page 56
Literature review 35
tests be performed to validate the results and test other influences on the results. Larger varying
overhang lengths should also be tested.
2.5.8 Summary
Research by Berkeley-Thorn and Roberts (1981) provides the greatest contribution to the
fundamental development of recurved walls by recommending the geometry of a recurved
seawall structure. Banyard and Herbert (1995) built on this to further develop a systematic
approach to incorporating such a structure into the design process of a coastal defence.
The CLASH initiative contributed a great deal of attention to and research on wave overtopping.
However, this was focused on the development of a formula to predict the wave overtopping
rate with a given a set of parameters.
Van Doorslaer and De Rouck (2011) investigated the influence of the slope of the recurve wall
feature that is necessary to effectively reduce wave overtopping. Recently Schoonees (2014)
initiated a physical model test with a limited set of parameters to create a design guideline with
various overhang lengths.
2.6 Physical modelling of wave overtopping
A physical model allows the researcher to develop a holistic view of nearshore processes
without simplifying the process with assumptions, as is required with numerical models. One
should, however, be cognisant in the design of any such model studies, of the need to take due
account of any possible model scale effects. With a smaller scale, data collection is easier;
however, with a model with a large scale, a better representation of actual events can be
achieved (Hughes, 1995).
2.6.1 Similitude criterion
Generally there are four conditions, as stated by Hughes (1995), that should be conserved
between the prototype and model conditions when administering short wave physical model
are demonstrated in Table 2.12.
Stellenbosch University https://scholar.sun.ac.za
Page 57
Literature review 36
Table 2.12: Physical model similitude criterion (Hughes, 1995)
Physical model similitude criteria
1 Froude number 𝑁𝑉
√𝑁𝑔 × 𝑁𝐿
= 1
2 Strouhal number 𝑁𝑡 = √𝑁𝐿
𝑁𝑔
3 Reynolds number 𝑁𝐿 × 𝑁𝑉
𝑁𝑣= 1
4 Euler number 𝑁𝑝
𝑁𝜌 × 𝑁𝑉2 = 1
However, it is difficult to maintain both the Froude and Reynolds criteria in physical model
studies. In this study, a physical model is executed with an undistorted scale in the Hydraulic
Laboratory at Stellenbosch University. With an undistorted scale the inertial and gravitational
forces are dominant and the model can be scaled according to the Froude criterion.
The general ratio of the scale ratio can be expressed visually by Equation (2.17) (Hughes, 1995):
𝑁𝑥 =
𝑋𝑝
𝑋𝑚=
𝑉𝑎𝑙𝑢𝑒 𝑜𝑓 𝑋 𝑖𝑛 𝑃𝑟𝑜𝑡𝑜𝑡𝑦𝑝𝑒
𝑉𝑎𝑙𝑢𝑒 𝑜𝑓 𝑋 𝑖𝑛 𝑀𝑜𝑑𝑒𝑙 (2.17)
The scale ratios under Froude’s similarity law are provided in Table 2.13.
Stellenbosch University https://scholar.sun.ac.za
Page 58
Literature review 37
Table 2.13: Froude and Reynolds scaling laws (Hughes, 1995)
Characteristic Dimension Froude Reynolds
Geometric
Length [L] 𝑁𝐿 𝑁𝐿
Area [L2] 𝑁𝐿2 𝑁𝐿
2
Volume [L3] 𝑁𝐿3 𝑁𝐿
3
Kinematic
Time [T] 𝑁𝐿1/2
𝑁𝜌1/2
𝑁𝛾−1/2
𝑁𝐿2𝑁𝜌𝑁µ
−1
Velocity [LT-1] 𝑁𝐿1/2
𝑁𝜌−1/2
𝑁𝛾1/2
𝑁𝐿−1𝑁𝜌
−1𝑁µ
Acceleration [LT-2] 𝑁𝛾𝑁𝜌−1 𝑁𝐿
−3𝑁𝜌−2𝑁µ
2
Discharge [L3T-1] 𝑁𝐿5/2
𝑁𝜌−1/2
𝑁𝛾1/2
𝑁𝐿𝑁𝜌−1𝑁µ
Kinematic Viscosity [L2T-1] 𝑁𝐿3/2
𝑁𝜌−1/2
𝑁𝛾1/2
𝑁𝜌−1𝑁µ
Dynamic
Mass [M] 𝑁𝐿3𝑁𝜌 𝑁𝐿
3𝑁𝜌
Force [MLT-2] 𝑁𝐿3𝑁𝛾 𝑁𝜌
−1𝑁µ2
Mass Density [ML-3] 𝑁𝜌 𝑁𝜌
Specific Weight [ML-2T-2] 𝑁𝛾 𝑁𝐿−3𝑁𝜌
−1𝑁µ2
Dynamic Viscosity [ML-1T-1] 𝑁𝐿3/2𝑁𝜌
1/2𝑁𝛾
1/2 𝑁µ
Surface Tension [MT-2] 𝑁𝐿2𝑁𝛾 𝑁𝐿
−1𝑁𝜌−1𝑁µ
2
Volume Elasticity [ML-1T-2] 𝑁𝐿𝑁𝛾 𝑁𝐿−2𝑁𝜌
−1𝑁µ2
Pressure and Stress [ML-1T-2] 𝑁𝐿𝑁𝛾 𝑁𝐿−2𝑁𝜌
−1𝑁µ2
Momentum, Impulse [MLT-1] 𝑁𝐿7/2𝑁𝜌
1/2𝑁𝛾
1/2 𝑁𝐿
2𝑁µ
Energy, Work [ML2T-2] 𝑁𝐿4𝑁𝛾 𝑁𝐿𝑁𝜌
−1𝑁µ2
Power [ML2T-3] 𝑁𝐿7/2𝑁𝜌
−1/2𝑁𝛾
3/2 𝑁𝐿
−1𝑁𝜌−2𝑁µ
3
A study by Schüttrumpf and Oumeraci (2005) determined that for normal test conditions the
scale effects are minimised if the Weber and Reynolds numbers adhere to the limits of tolerance
provided in Table 2.14.
Stellenbosch University https://scholar.sun.ac.za
Page 59
Literature review 38
Table 2.14: Tolerable scale limits (Schüttrumpf & Oumeraci, 2005)
Scaling laws Tolerable limits Influences
Weber number 30 - 3000 Surface tension
Reynolds 𝑅𝑒𝑞 > 103 Viscosity
The Weber number is provided with Equation (2.18). However, if it falls outside the tolerable
limit, surface tension will affect the test results.
𝑊𝑒 = (𝑣𝐴ℎ𝐴𝜌𝑤)
𝜎0 (2.18)
Where:
𝑣𝐴 − Wave run-up velocity at SWL
ℎ𝐴 − Layer thickness at SWL
𝜌𝑤 − Density of the fluid
𝜎0 − Wave run-up height
The overtopping Reynolds number is calculated with Equation (2.19). However, if it falls below
tolerable limit, viscosity will affect model results.
𝑅𝑒𝑞 = 2(𝑅 − 𝑅𝐶)2
𝑣𝑇 (2.19)
Where:
𝑅 − Wave run-up height (m)
𝑅𝐶 − Freeboard (m)
𝑣 − Kinematic viscosity (m2/s)
T − Wave period (s)
Important limitations of physical models are scale and model effects. These occur because it is
not possible to achieve similitude of all relevant forces. The condition of the dominant forces,
however, should be satisfied; in this case the gravitational and inertial force (Hughes, 1995).
Stellenbosch University https://scholar.sun.ac.za
Page 60
Literature review 39
2.6.2 Model effects
Laboratory effects are most often caused in short wave physical models by the following
(Hughes, 1995):
Physical limitations of the model boundaries on the flow;
The use of a mechanical wave generator, which causes unintentional non-linear effects;
and
Simplification of the natural processes and forces.
The mechanical generation of waves can cause un-intended raised amplitudes, groups of waves
or non-authentic long waves (Hughes, 1995).
The re-reflection of waves is a laboratory effect that is not as apparent as those already
mentioned. Wave reflection occurs in the flume just as it would in nature; however,
additionally, the wave flap which represents the seaward boundary; re-reflects the reflected
waves back in the direction of the recurve seawall structure (Hughes, 1995). This effect can be
mitigated by means of one of three methods:
Energy dissipation beaches constructed with rubber mats in front of the wave flap;
Experiments being executed with shorter wave periods, before the reflected wave
reaches the wave flap; or
Active wave absorption at the wave flap.
Romano, Bellotti, Briganti and Franco (2014) accounted for the wave reflection in the model
by means of method developed by Goda and Suzuki (1976), rather than the use of absorption.
This method was developed by measuring the two wave records at adjacent locations
simultaneously and then analysing all amplitudes and Fourier components. The incident and
reflected wave conditions are determined by modification of the estimated data sets (Goda &
Suzuki, 1976).
The most obvious distortion that causes model effects is the absence of wind. The effect of wind
on the overtopping is an important characteristic that should not be ignored, but should be
additionally quantified after physical modelling is completed, especially in cases of strong
winds, small overtopping volumes or pulsating conditions (Ward, Zhang, Wibner and Cinotto,
1998). According to Pearson, Bruce, Allsop and Gironella (2002) wind does not have such great
Stellenbosch University https://scholar.sun.ac.za
Page 61
Literature review 40
influence on large overtopping volumes, however more care should be taken for small
overtopping volumes.
Another distortion, according to Pearson et al. (2002) is the use of fresh water instead of salt
water in the model. The use of fresh water influences the concentration of air bubbles in the
water, which has an influence on the wave pressures measured on the wall. However, there is
no evidence that this has an effect on the overtopping processes (Pearson et al., 2002)
2.6.3 Scale effects
Scale effects in physical models result from the assumption that the gravitational force is the
governing force that influences the inertia forces in the model (Hughes, 1995). This incorrectly
scales other physical factors.
According to De Rouck, Geeraerts, Troch, Kortenhaus, Pullen and Franco (2005), the influence
of certain scale effects namely: surface tension and kinematic viscosity, increase as the flow
decreases.
Le Méhauté (1976) provides a general rule of thumb that surface tension becomes significant
if the wave period is smaller than 0.35 seconds or the water level lower than 20 mm.
For small overtopping volumes the hydraulic resistance on the slope increases, causing higher
energy losses. This is as there is no turbulent boundary layer (De Rouck et al., 2005).
A study by Pearson et al. (2002) compared physical model tests of small and large scale to
determine whether there was a significant difference between the measured values in small-
scale studies versus those in large scale studies. This study came to the conclusion that for peak
and mean overtopping events under impulsive wave conditions the scale effects were
insignificant, and also that scale effects for waves under pulsating condition are minimal
(Pearson et al., 2002).
From the OPTICREST project it was determined that wave run-up is greatly underestimated in
small-scale tests (De Rouck et al., 2005). Similarly, underestimation was expected from wave
overtopping. Thus, as part of the CLASH project this was investigated by comparing full-scale
tests at three locations with small-scale experiments. The three full-scale tests comprised:
Low crested rubble mound breakwater with Antifer cubes in an armour layer (Zeebrugge,
Belgium);
Stellenbosch University https://scholar.sun.ac.za
Page 62
Literature review 41
Rock rubble mound breakwater (Ostia, Italy); and
Vertical Wall (Samphire Hoe, United Kingdom)
Full-scale wave overtopping measurements were taken by placing an overtopping reservoir on
top of each of the structures, as demonstrated in Figure 2.27 (De Rouck et al., 2005).
Zeebrugge (Belgium)
(De Rouck et al., 2005)
Ostia (Italy)
(De Rouck et al., 2005)
Samphire Hoe (UK)
(Pullen, Allsop, Bruce &
Pearson, 2009)
Figure 2.27: Full-scale tests
De Rouck et al. (2005) determined that for vertical walls the prediction, prototype and
laboratory results correlated well. The differences were attributed to wind effects. A method
was also developed to minimize scale effects by considering scaling factors for various
configurations considering the roughness and steepness of the slope, and considering the effect
of the wind (De Rouck et al., 2005).
From the experiments it was observed that the scale factor varies for different slopes, flat slopes
having a larger scale factor (De Rouck et al., 2005).
Further studies, in both 2D and 3D, were undertaken by Pullen et al. (2009), to compare the
three full-scale tests to small-scale tests. This study validated that for vertical walls, the data
points correlated well; however, there should be an adjustment made for the wind effects that
was not included in the small-scale models. This has the largest influence on small overtopping
volumes.
2.6.4 Mitigation of model effects
To minimise model effects (Wallingford, 1999) design the experiments with certain
characteristics. Firstly, the physical model had two absorption channels, one on either side
Stellenbosch University https://scholar.sun.ac.za
Page 63
Literature review 42
constructed with perforated Perspex splitter walls to reduce the wave reflection model effects
in the physical model.
Secondly, the wide range of design wave conditions in the flume was calibrated before the
structure was built. The flume had the fixed design model bed and had a shingle spend beach
at the end of the flume to reduce the re-reflection of waves (Wallingford, 1999).
2.6.5 Methods to measure overtopping
Overtopping is sensitive to change in the water level, as well as the incident wave characteristics
and the structure geometry (Reis, Neves & Hedges, 2008). Therefore, care should be taken to
keep the water level as constant as possible.
De Rouck et al. (2005) measured overtopping in full-scale by placing a reservoir behind the
seawall to catch the overtopped water. The measurements were taken with the use of a
submersible pump combined with a load cell, which was a transducer that quantifies the force
measured, in this case the force caused by the water overtopped into the reservoir.
Romano et al. (2014) followed similar methods for determining overtopping measurements: a
chute directs the overtopped water into a pipe that is connected to the bottom of the chute, where
it runs into an overtopping tank connected to a load cell (Romano et al., 2014).
At the Samphire Hoe full-scale test site six overtopping tanks were positioned behind the
parapet structure to record the spatial distribution of the overtopped water. These tanks are V
shaped so that they can measure small overtopping events more easily and accurately.
Each of the overtopping tanks was fitted with two recording devices that were connected to a
control box sealed from storm conditions. The first device is a pressure transducer on the base
of the tank and the second, overtopping detectors on one side of tank to document individual
wave overtopping events as demonstrated in Figure 2.28.
Pearson et al. (2002), however, measured wave-by-wave events by suspending the measuring
bucket from a load cell. This recorded the mass in the collection tank after each overtopping
event. Metal tape was place at the crest of the structure to identify individual events. The mass
increments were determined and converted to overtopping volumes (Pearson et al., 2002).
Stellenbosch University https://scholar.sun.ac.za
Page 64
Literature review 43
This measurement method was validated by filling the overtopping tank with known amounts
of water to check the measurements. The results correlated well, and indicated that any variation
was negligible (Pearson et al., 2002).
The Pearson et al. (2002) 3D study was simplified to 2D and conducted in Edinburgh. The
overtopping bin behind the seawall was divided into seven collection tanks in order to consider
the spatial distribution of the overtopped water. The overtopping tank was similarly suspended
from a load cell, and each compartment was equipped with a wire resistance gauge. The setup
of overtopping compartments is provided in Figure 2.29.
Figure 2.28a: Overtopping tank with 1) pressure transducers and 2) overtopping detectors;
b: Overtopping tank suspended from load cell (Pullen et al., 2009)
xc xd
xe xf
xb xa
Figure 2.29: Spatial distribution of wave overtopping (Pearson et al., 2002)
1
1
2
2
b a
Stellenbosch University https://scholar.sun.ac.za
Page 65
44
3 PHYSICAL MODEL TESTS
PHYSICAL MODEL TESTS
3.1 General description of the model
3.1.1 Test facility
The physical model tests were performed in a 2D wave flume at the Hydraulic laboratory of the
Civil Engineering Department of the University of Stellenbosch as provided in Figure 3.1,
which has a width of 1 m, length of 30 m and a maximum operational depth of 0.8 m.
2D wave flume
(Guerrero, n.d.)
Wave paddle in 2D flume
(Guerrero, n.d.)
Figure 3.1: Test facility
The wave flume is equipped with a wave-maker, a piston-type paddle that moves horizontally
to generate waves. The flume is fitted with an absorption beach behind the paddle to prevent
splashing of water (HR Wallingford, 2010).
The wave paddle is fitted with a dynamic wave absorption system that compromises for the
effect of the reflection of waves in the flume. This unit measures the water level and calculates
the equivalent paddle position (EPP) signal. The EPP represents the position in which the
paddle would have been without the effect of reflected waves (HR Wallingford, 2010).
CHAPTER 3
Stellenbosch University https://scholar.sun.ac.za
Page 66
Physical Model Tests 45
The test setup, used by Schoonees (2014) in the wave flume in the hydraulic laboratory at the
University of Stellenbosch was re-used to determine the influence that the overhang length of
the recurve wall has on the effective reduction of overtopping. A detailed flume cross-section,
indicating the elevations, is provided in Annexure B.
3.1.2 Bed slope
The bed slope in front of the structure will consist of two slopes, a deep-sea slope that is
estimated at 1:50 and the nearshore slope characteristic southern African coasts. The slopes of
five locations around South Africa’s coast, around -1m to +1m MSL, were surveyed, as
suggested by Schoonees (2014), to estimate an accurate nearshore slope. These slope
calculations are provided in Table 3.1.
Table 3.1: Nearshore slope calculation
Location Slope
(-1m to +1m MSL) Source
False Bay 1:16.5 (WNNR, 1983)
Grootbrak/Glentana 1:32 (Schoonees, et al., 2008)
Richards Bay 1:42 (WSP Africa Coastal Engineers, 2012)
Saldanha Bay 1:11.5 (Schoonees & Theron, 2003)
Table Bay 1:14.5 (Soltau, 2009)
Average 1:18.41
The deep-sea slope and the estimated nearshore slope are illustrated in Figure 3.2.
Stellenbosch University https://scholar.sun.ac.za
Page 67
Physical Model Tests 46
A study by Bruce et al. (2005) proved that for vertical walls with impulsive wave conditions
(where the shoaling water exposes the bed slope or the toe of the structure), the bed slope
critically influences the incoming wave. However, for the purposes of this study only pulsating
wave conditions were considered and thus the bed slope would not have had a substantial effect
on this study.
3.1.3 Geometry of a recurve wall
To simplify the geometry of the recurve seawall, the
geometry of a parapet is used. It was expected that the
recurved shape of the seawall would further increase
the reduction in overtopping; however, the order of
this further reduction was not known. Limited
research could be found on the design of parapet
seawalls.
As illustrated in Figure 3.3, the overhang length 𝐵𝑟,
which influences the angle 𝛽 of the overhang, was
varied in the tests in order to evaluate the influence is
has on the reduction of overtopping.
The overhang length, 𝐵𝑟 , varied in test conditions
from 0 mm to 105 mm.
1:50
1:50
1:18.6
1:18.6
Figure 3.2: Estimated slopes in flume
Figure 3.3: Generic recurve wall
geometry of model tests
𝛽
Stellenbosch University https://scholar.sun.ac.za
Page 68
Physical Model Tests 47
The 20 mm lip thickness is the minimum thickness allowed that provides enough space to place
steel within the recurve form and still achieve adequate concrete coverage.
3.1.4 Wave period
Typically, wave periods that are found around the coast of South Africa range from 8 second
to 12 second. To include possible storm conditions, a wave period of up to 16 second was
included in the evaluation for overtopping reduction.
3.1.5 Wave spectra
The wave spectra that are characteristic around the coast South Africa (and also the North Sea)
is the JONSWAP spectrum. This variation of the Pierson-Moskowitz spectrum originated out
of the Joint North Sea Wave Project (JONSWAP) where Hasselmann, Barnett, Bouws, Carlson,
Cartwright, Enke, Gienapp, Kruseman and Meerburg (1973) found that the wave spectrum is
never fully developed. The spectrum continues to develop over long durations and distances by
means of wave-to-wave interactions. In Figure 3.4 the JONSWAP spectrum is compared to the
Pierson-Moskowitz spectrum.
The JONSWAP spectrum for fetch-limited seas can be expressed through equations (3.1) to
(3.3).
Figure 3.4: Pierson-Moskowitz versus JONSWAP spectra
(U.S. Army Corps of Engineers, 2001)
Stellenbosch University https://scholar.sun.ac.za
Page 69
Physical Model Tests 48
𝐸(𝑓) =
∝ 𝑔2
(2𝜋)4𝑓5𝑒𝑥𝑝 [−1.25 (
𝑓
𝑓𝑝)
−4
] 𝛾
𝑒𝑥𝑝
[ ( 𝑓
𝑓𝑝−1)
2
2𝜎2
]
(3.1)
𝑓𝑝 = 3.5 [𝑔2𝐹
𝑈103 ] (3.2)
∝ = 0.076 [𝑔𝐹
𝑈102 ]
−0.22
(3.3)
1 ≤ 𝛾 ≤ 7
𝜎 = 0.07 𝑓𝑜𝑟 𝑓 ≤ 𝑓𝑝
𝜎 = 0.09 𝑓𝑜𝑟 𝑓 > 𝑓𝑝
Where:
∝ − Equilibrium coefficient
𝜎 − Dimensionless spectral width parameter
𝛾 − Peak enhancement factor
𝐹 − Fetch length
The peak enhancement factor is defined, and is demonstrated in Figure 3.4, as the ratio of the
maximum energy density of the JONSWAP spectrum to the Pierson-Moskowitz spectrum.
The peak enhancement factor lies between one and seven in the North Sea; however, around
South Africa’s coast, it is between one and six. According to Rossouw (1989), the average 2.2
with a standard deviation of one. The peak enhancement factor was chosen as 𝛾 = 3.3 to enable
the comparison of this study to other wave overtopping studies.
3.1.6 Length of wave sequence
Study by Reis et al. (2008) determined that for physical model testing the number of waves in
a wave sequence is very important. Reis et al. suggests that for physical model tests with no
provision for active wave absorption, more tests with the same design parameters, but with
shorter wave period, should be executed. This would provide a more accurate account of mean
wave overtopping. The shorter wave-time series would eliminate the possibility of energy
buildup caused by the re-reflection of wave paddles and flume walls (Reis et al., 2008).
Stellenbosch University https://scholar.sun.ac.za
Page 70
Physical Model Tests 49
Pearson et al. (2002) made the observation that a 500-wave sequence gives an accurate wave
overtopping measurement, when compared to the 1000-wave sequence (EurOtop, 2007). This,
however, is not the case for small wave overtopping measurements.
3.1.7 Data acquisition
The HR DAQ data acquisition software that works in conjunction with the HR wave paddle is
equipped with reflection analysis, and the data analysis spectral density and zero crossing-up
method data sequences (HR Wallingford, 2010). The incident and reflected wave heights are
separated by the least squares method developed by Mansard and Funke (1980) for irregular
waves. With this method, three wave height readings are required to be taken simultaneously.
The four probes’ 𝐻𝑚0 values are averaged to determine the incident wave height.
The least squares method requires a constant water depth and probe spacing to calculate the
range of allowable reflection frequency for each case. The wave sequence recorded is then
analysed to determine the bulk reflection coefficient and the maximum and minimum
reflections that occurred during that test condition. The Reflection Analysis interface is
provided in Annexure P.
The least squares method is developed by equations (3.4) to (3.9); where the incident wave is
separated from the reflected wave by the use of equation (3.9)
𝐻𝑚𝑜2 = 𝐻𝑖
2 + 𝐻𝑟2 (3.4)
𝐻𝑚𝑜 = √(𝐻𝑖2 + 𝐻𝑟
2) (3.5)
𝐻𝑟 = 𝐾𝑟𝐻𝑖 (3.6)
Substituting (3.5) in (3.6):
𝐻𝑚𝑜 = √(𝐻𝑖2 + 𝐾𝑟
2𝐻𝑖2) (3.7)
𝐻𝑚𝑜 = 𝐻𝑖√(1 + 𝐾𝑟2) (3.8)
𝐻𝑖 =
𝐻𝑚𝑜
√(1 + 𝐾𝑟2)
(3.9)
Stellenbosch University https://scholar.sun.ac.za
Page 71
Physical Model Tests 50
3.2 Model scale
The model scale of the physical model was chosen to be 1:20 and scaled according to the Froude
similarity law, as discussed in Section 2.6.1. This was to minimise scale effects, taking into
consideration the available flume volume, the wave-paddle capabilities, and to accommodate a
realistic range of water levels.
The model scale, as demonstrated in Table 3.2, allows a wide range of parameters to be tested.
Table 3.2: Physical model scale (Schoonees, 2014)
Scale type Parameter Froude scale
Model scale Water depth, wavelength, wave height 1:20
Time Wave period, test duration 1:√20 = 4.472
Mass Mass of overtopped water 1:203 = 8000
3.3 Test procedure
The process of the test schedule discussed in Section 3.6, is as follows:
1. Wait for the resounding waves and water level to even out;
2. The water level is raised or lowered to the desired water level;
3. The water is mixed by running a wave set with a duration of 100𝑇𝑝to account for stratifying
water;
4. Water level should settle out and probes in the flume are calibrated;
5. The water level in the overtopping bin and in flume is recorded;
6. The wave condition is initiated and absorption set; where-after the data acquisition is
recorded for 1000𝑇𝑝;
6.1. During the test the water in the overtopping bin is monitored, and if approximately 20 𝑙
water splashes out, 20 𝑙 is added behind the wave paddle in 5 𝑙 increments.
6.2. If the water in the overtopping bin is close to capacity, it is pumped out of the bin to
the weighing station and recorded.
7. Weigh the overtopping bucket, and measure the water level in the overtopping bin; and
8. Record the water level in the flume and in the overtopping bin.
Stellenbosch University https://scholar.sun.ac.za
Page 72
Physical Model Tests 51
9. Check that water level is within 2 mm of starting water level.
3.4 Measuring equipment and techniques
The steel overtopping bin with a see-through Perspex slot on the side is positioned behind the
model recurve wall. Two pieces of steel are placed in the overtopping bin to ensure that the bin
does not move. The water level in the overtopping bin is recorded before and after each test,
with the use of a ruler fitted to the inside of the bin. The ruler is calibrated with predetermined
volumes to streamline the data recording process. Plastic sheets are fitted around the bin to
guide overtopped water into the overtopping bin.
A wooden frame was constructed and covered with plastic sheets for a distance of 4 metres
from the structure towards the wave maker, thus sealing the edge of the flume to minimise water
splashing and loss of water in the experiment, as demonstrated in Figure 3.5.
The smaller overtopping volumes were measured using only the overtopping bin. However, for
overtopping volumes that would exceed the overtopping bin’s capacity, a pump was used during
the test, where-after the water mass was weighed and noted as demonstrated in Figure 3.6.
Plastic sheets to limit water loss Guiding plastic water sheets
Figure 3.5: Plastic sheets
Stellenbosch University https://scholar.sun.ac.za
Page 73
Physical Model Tests 52
The pump that had initially been used burnt out, and eventually three different pumps were used
during the course of the physical model tests. Each time a new pump was used, the overtopping
bin was re-calibrated with the ruler.
To ensure that the incident wave was as designed and the effect of reflecting waves were
accounted for, the four waves probes were spaced in front of the recurve wall structure. The
spacing of the first three probes was determined by the Mansard and Funke (1980) method. The
fourth probe was positioned one average wavelength away from the structure, as demonstrated
in Table 3.3. This was to ensure that the wave readings were taken before the bed slope had an
influence on the incident wave, and thus before wave breaking occurs. Reflection analysis was
performed as discussed in Section 3.1.7.
Pump in overtopping bin Weighing and water refill station
Figure 3.6: Wave overtopping recording equipment
Stellenbosch University https://scholar.sun.ac.za
Page 74
Physical Model Tests 53
Table 3.3: Average wavelength for calculation of probe spacing
Model wavelength (Lp) for corresponding wave period (Tp)
Tp Lp
s mm
1.8 1542
2.2 1930
2.7 2316
3.1 2703
3.6 3089
AVERAGE 2.7 2316
The position of the probes in the wave fume is shown schematically in Figure 3.7.
To account for the water removed by violent overtopping volumes during the test, the
overtopping volumes were closely monitored to ensure that a constant water level is maintained
in the flume. If the overtopping bin filled with 20 𝑙, approximately the same volume was added
into the flume behind the wave flap. The water level at the start and end of the test were
compared, to ensure that water was not lost from the system. If the water level dropped by more
than 2 mm, the test was disregarded and the results removed from the dataset.
An analysis was done to determine the effect that the process of stratifying water had on the
wave probes. This was done by mixing the water, and then after the wave paddle was switched
off, the probes readings were taken for 6 hours, provided in Annexure Q.
2 300 mm
230 mm
580 mm
1 000 mm
24 700 mm
Figure 3.7: Probe spacing of physical model
Stellenbosch University https://scholar.sun.ac.za
Page 75
Physical Model Tests 54
3.5 Model limitations
The limitation of the physical model is predominantly the absence of wind and the influence it
has on the initial overtopping measured. Without modelling the wind, the actual magnitude of
the small overtopping volumes that are blown over the crest of the structure is not taken into
account.
Additionally, one has to consider the implication of physical modelling in only two dimensions,
where the effect of the incident angle of the incoming waves on the overtopping at structure is
not considered. Lastly, there is the matter of the effect of wave re-reflection, as discussed earlier
in Section 2.6.2.
3.6 Schedules
Provided in Table 3.4 are the nine sets of conditions (various combinations of recurve shapes,
relative water level at the toe of the structure, as well as wave height and period) that were
tested in the experimental programme.
Table 3.4: Test Schedule
After all tests had been completed, the most effective recurve wall overhang length was
determined by comparing its overtopping volumes to the vertical wall (𝐵𝑟 = 0).
Model Prototype
Test series
Overhang
length 𝑩𝒓
mm
Significant
wave height
𝑯𝒔
m
Water level at toe
m
Wave period 𝑻𝒑
s
A 0 1 0.6, 1, 1.6, 2, 2.4 8, 10, 12, 14, 16
B 7.5 1 0.6, 1, 1.6, 2, 2.4 8, 10, 12, 14, 16
C 15 1 0.6, 1, 1.6, 2, 2.4 8, 10, 12, 14, 16
D 30 1 0.6, 1, 1.6, 2, 2.4 8, 12, 14, 16
E 45 1 0.6, 1, 1.6, 2, 2.4 8, 10, 12, 14, 16
F 60 1 0.6, 1, 1.6, 2, 2.4 8, 10, 12, 14, 16
G 75 1 0.6, 1, 1.6, 2, 2.4 8, 10, 12, 14, 16
H 90 1 0.6, 1, 1.6, 2, 2.4 8, 10, 12, 14, 16
I 105 1 2, 2.4 8, 10, 12, 14, 16
Stellenbosch University https://scholar.sun.ac.za
Page 76
Physical Model Tests 55
3.7 Summary of test conditions
Provided in Table 3.5 is a summary of the prototype test conditions of the experiments that
were undertaken in this study.
Table 3.5: Summary of prototype test conditions
Geometrical properties
Overhang length (𝐵𝑟) 0, 0.15, 0.3, 0.6, 0.9, 1.2, 1.5, 1.8, 2.1 m
Wave period (𝑇𝑝) 8, 10, 12, 14, 16 s
Freeboard (𝑅𝑐) 0.6, 1, 1.6, 2, 2.4 m
Bed slope 1:18.6 -
Model scale 1:20 -
With the above-mentioned range of test conditions, with the repeated tests included, 240
experiments were done to create a comprehensive account of the overhang length that was most
effective in the reduction of overtopping and, further, the freeboard height to which a recurve
wall is most effective.
Stellenbosch University https://scholar.sun.ac.za
Page 77
56
4 RESULTS
RESULTS
4.1 Introduction
In this chapter the physical model test results are considered first, by giving a brief overview of
the tests undertaken and their general performance. Secondly, the physical model results are
compared against the results of previous research discussed in Chapter 2 Literature Review.
4.2 Physical model
During the course of this thesis, 240 tests were administered to compile a complete dataset in
order to gain a better understanding of how the recurve wall performs under a wide set of sea-
conditions. The behaviour of the recurve wall is considered by providing an overview of each
series.
4.2.1 Test overview
The wave overtopping results are grouped by the recurve overhang length. The first test series,
with the vertical wall with a 0 mm overhang length, is used as the basis dataset against which
to compare the performance of each recurve shape to determine the efficiency of the relevant
profile.
4.2.1.1 Series A – 0 mm overhang
In the vertical wall series with a 0 mm overhang, it was seen that a wave reflected from the
recurve wall structure amplified the incoming wave and caused an amplified wave up-rush and
overtopping volume over the crest of the structure. In certain instances, the reflective wave
caused the incoming wave to break before reaching the structure, thus dissipating its energy
and minimising the wave overtopping volume.
The waves from lower water levels break in front of the structure and a smaller wave
overtopping volume splashed against the vertical wall and was thrown upward.
CHAPTER 4
Stellenbosch University https://scholar.sun.ac.za
Page 78
Results 57
With higher freeboard levels, the non-impulsive waves appeared calmer and thus took longer
to breach the crest of the vertical wall. However, when the wave overtopped over the crest of
the structure, it was found that the overtopping volumes were significantly larger.
The dynamic wave absorption system was less effective for the 14 and 16 second wave periods,
which resulted in higher wave heights. This had the most influence for the two lowest water
levels. The overtopping events increased, as did the volume per event, however it should be
noted that this was only a qualitative observation.
4.2.1.2 Series B – 7.5 mm overhang
Series B, which has the smallest overhang length, provided a small reduction in wave
overtopping, when compared to the vertical wall. This profile behaved similarly to those in
Series A, with 0 mm overhang, as the small overhang did not shoot the wave uprush far enough
seaward.
The small overhang restricts the small volumes that just overtopped the vertical wall. A small
reduction in overtopping rate was seen.
However, with the more violent wave sequences (wave periods of 14 and 16 seconds) and at
higher water levels, the overhang did not behave as designed and serves just as an obstruction
for the incoming waves.
4.2.1.3 Series C – 15 mm overhang
The 15 mm overhang behaved similarly to that in Series B with the 7.5 mm overhang length,
providing a slightly greater reduction in overtopping at lower water levels than the vertical wall
did.
However, the tests performed with the longer wave periods (14 and 16 seconds) and the two
highest water levels, achieved poorer results than were recorded with the 7.5 mm overhang or
the vertical wall.
As the waves with longer periods reached the structure, the wave curled into the recurve, and
was trapped underneath the overhang, as the remainder of the oncoming wave pushes the
trapped volume over the crest.
Stellenbosch University https://scholar.sun.ac.za
Page 79
Results 58
4.2.1.4 Series D – 30 mm overhang
The 30 mm overhang was the first recurve shape with an overhang significant enough to direct
the wave-uprush seaward. This overhang provided good overtopping reduction with the lower
water levels.
During the experiments, it was observed that the 30 mm overhang length shoots the wave-
uprush seaward at an extreme of 4 m physical model distance seaward (80 m prototype value
seaward).
At the highest water level, the waves that curled into the recurve structure were minimal, thus
the 30 mm overhang recurve provides small, if any, reduction in overtopping.
4.2.1.5 Series E – 45 mm overhang
The 45 mm overhang provided a good reduction in overtopping for the lowest water levels. The
overhang behaved similarly to the 30 mm overhang that shoots the wave-uprush a significant
distance seaward. The wave uprush was shot back seaward over the crest of the incoming
waves, and effectively cleared from underneath the seawall.
Further, when tested with a higher water level, this overhang length provided good reduction
of wave overtopping compared with the shorter overhang lengths. While providing a reduction
in the wave overtopping, this did not result in zero overtopping crossing crest level.
4.2.1.6 Series F – 60 mm overhang
The recurve wall with the 60 mm overhang behaved similarly to that in Series H, providing
good reduction in wave overtopping. This overhang length allowed the wave to curl into the
shape and thus be thrown back seaward.
This overhang length was less effective at the two highest water levels tested, with the lowest
freeboard. Although it did not provide zero overtopping, it nevertheless delivered a major
reduction compared to the vertical wall results.
The zero overtopping results should, however, be interpreted carefully. The overtopping
splashes were difficult to quantify. In some instances, the overtopping did not reach the water
guiding plastic, but remained on the overhang ledge. There were splashes that were observed
Stellenbosch University https://scholar.sun.ac.za
Page 80
Results 59
during the test, that were too small to have had an effect on the overtopping bin water level
(effectively less than 0.5𝑙 model value).
4.2.1.7 Series G – 75 mm overhang
The 75 mm overhang recurve profile behaves similarly; however, it improved on the
performance of the 60 mm overhang length.
The three lowest water levels provided good reduction in overtopping, allowing little, if any,
overtopping over the crest of the recurve wall. The zero overtopping results should be
interpreted carefully. The overtopping splashes were difficult to quantify, as discussed above.
4.2.1.8 Series H – 90 mm overhang
Series H represents the second longest overhang length and, as expected, the lower water levels
produced low overtopping volumes that were difficult to quantify, as discussed in Section
4.2.1.6.
The water splashes that were observed during the test were too small to have any effect on the
overtopping bin water level (effectively less than 0.5𝑙 model value). In some instances, the
overtopping did not reach the plastic water guide, but remained on the overhang ledge.
The lower water levels effectively reduced the wave overtopping as they allow the wave to curl
into the wave recurve structure, which redirects the wave seaward.
4.2.1.9 Series I –105 mm overhang
This profile represents the most extreme recurve profile, which was tested at only the two
highest water levels. At the second highest water level, most of the waves hit the slanted
component of the overhang length and the waves were cleared and shot back seaward at a small
angle from the wall.
As the length of the overhang restricted the waves from overtopping the crest of the wall, the
recurve wall had to withstand large forces as the wave collided with the seawall. In some
instances, a void formed as the water level drops when the incoming wave reached the wall.
As the water level increased and the wave hit the perpendicular surface of the vertical wall, the
wave overtopped the crest of the recurve wall.
Stellenbosch University https://scholar.sun.ac.za
Page 81
Results 60
4.2.1.10 Summary
As expected, the performance of the recurve wall profiles in reducing the overtopping improved
as the overhang length increased. The overhang length prevents the wave uprush from
breaching the crest of the recurve wall. Up to a certain water level the longer overhang provides
complete reduction in overtopping; however, the reduction is limited as the freeboard decreases.
The zero overtopping results in the series with overhang lengths of 45, 60, 75, 90 and 105 mm
should be considered cautiously. Small overtopping volumes are difficult to quantify, because
of the method used to measure the overtopping.
Series C, with a 15 mm overhang length, initially behaved similarly to the series with a 7.5 mm
overhang length. However, with higher water levels, this profile reduction performance was
less effective than that of the vertical wall. As the wave curls into the recurve, a portion of the
wave is trapped beneath the overhang, and the remainder of the wave pushes this trapped
volume over the crest.
The recurve seawalls achieved worse results with higher water levels and the longer
wavelengths (14 and 16 seconds), which represented stormier conditions. These conditions
submerged the recurve wall, which provided little or no resistance. During the study, results of
the tests with a 16 second wave period were difficult to predict. This could be because the wave
period lies on the outer boundary of the absorption gain value adjustment graph.
4.2.2 Overall performance
The physical model test results are provided in Annexure F per wave period, as the water level
increases. The green represents the physical model values, with red representing the prototype
volumes and overtopping rates.
The full dataset, comprising all wave periods, water levels and recurve overhang lengths
provided below, was plotted with dimensionless overtopping parameter versus the freeboard
over 𝐻𝑚𝑜 and is provided in Figure 4.1.
Stellenbosch University https://scholar.sun.ac.za
Page 82
Results 61
* Note the overtopping rate is in m3/s/m
Tests that were repeated are shown on the figures as individual separate tests. The reference
data plotted in Figure 4.1 are provided in Annexure F, per recurve overhang length. The small
overtopping rates from the small and zero overtopping volumes at the 0.9, 1.2, 1.5 and 1.8 m
overhang lengths are not represented on the graph, as 0 is not defined for a log scale.
Figure 4.1 indicates that all recurve wall shapes with overhang lengths larger than 0.15 m
provide a clear reduction in wave overtopping. The 0.15 m overhang enhances the overtopping
reduction in some cases; however, not in all conditions.
4.3 Results from EurOtop online calculation tool
The EurOtop overtopping calculation tool was evaluated with the measured data from the
physical model tests. The data measured in the physical model tests are plotted against the
probabilistic data provided in Figure 4.2.
1.0E-07
1.0E-06
1.0E-05
1.0E-04
1.0E-03
1.0E-02
1.0E-01
1.0E+00
1.0 1.5 2.0 2.5 3.0 3.5 4.0 4.5 5.0
q/(
g H
mo3)0
.5 *
Rc/Hmo
Complete data set
0 m 0.15 m 0.3 m 0.6 m 0.9 m 1.2 m 1.5 m 1.8 m 2.1 mBr
Figure 4.1: Complete data set overall performance
Stellenbosch University https://scholar.sun.ac.za
Page 83
Results 62
It can be seen that with this wide spread of model test conditions, the empirical data does not
fall on the 1:1 line, which represents a perfect relationship. The most critical finding is that the
15 mm overhang length was greatly under-predicted, delivering much larger overtopping rates
than estimated.
The variability in the results is attributed to small overtopping volumes, extrapolated data, and
limits within the dataset. This will be further discussed in Section 5.3.3.
4.4 Summary
All the overtopping lengths, except the 0.3 m overhang length (15 mm overhang length model
value), improved the reduction performance of the vertical wall (0 m overhang length) under
similar conditions.
The empirical data does not correspond to the measured physical model data in a 1:1
relationship as desired. This deviation and the remainder of the results are discussed and
analysed in the following chapter.
0
10
20
30
40
50
60
0 10 20 30 40 50 60
Pro
bali
stic
data
(l/
s/m
)
Measured data (l/s/m)
Measured data vs Empirical data
0 m 0.15 m 0.3 m 0.6 m 0.9 m 1.2 m 1.5 m 1.8 m 2.1 mBr
1:1
Figure 4.2: Measured versus Empirical data
Stellenbosch University https://scholar.sun.ac.za
Page 84
63
5 DATA DISCUSSION & ANALYSIS
DATA DISCUSSION & ANALYSIS
5.1 Introduction
The data recorded during the physical model tests, the EurOtop online calculation tool, and
previous research that was reviewed, will be compared, discussed and analysed in this chapter.
Tests that were repeated to determine the accuracy are shown on graphs as two individual tests.
The average of the repeated tests was used for calculation purposes in certain instances.
5.2 Physical model tests
The physical model tests were analysed by first commenting on the overall performance of the
recurve walls.
Then considering, in the reduction of overtopping, the influence of
overhang length,
sensitivity of water level,
wave period and
wave height.
The accuracy and repeatability of the tests were considered and then, finally, the influence of
the recurve on the recurve wall was examined. From here forward all overtopping rates are
considered in l/s/m unless otherwise stated.
5.2.1 Overall performance of recurve walls
In the higher freeboard cases, the reflective wave collides with the incoming wave and the
splashes travel over the crest of the structure. This collision also dissipates the energy of the
incoming wave, as a mitigated wave hits the structure and then clears away from the wall.
As the waves hit the slanted component of the recurve wall, the waves are cleared from under
the recurve wall. In some cases, the reflective wave amplifies the incoming wave so that wave
CHAPTER 5
Stellenbosch University https://scholar.sun.ac.za
Page 85
Data discussion & analysis 64
height increases and hits the recurve wall on the perpendicular surface of the overhang. The
wave is thrown upward, falls on the overhang ledge and runs off behind the recurve wall.
Provided in Figure 5.1 is a comparison of the overall performance of the recurve walls.
* Note the overtopping rate is in m3/s/m
Comparing the performance in the reduction of overhang, it can be noted that as the overhang
length increases, the trend lines have steeper slopes. This confirms that at low freeboard levels
the overtopping rates increase rapidly. It should be noted that the zero overtopping results are
not included in this graph, as these cannot be plotted on a log graph.
Kortenhaus et al. (2004) found that for 𝑅𝑐
𝐻𝑚𝑜⁄ > 1.5 the recurve reduces the overtopping rate,
when compared with the vertical wall. However, for 𝑅𝑐
𝐻𝑚𝑜⁄ < 1.2, the recurve wall had no
influence on overtopping.
Van Doorslaer and De Rouck (2011) determined that for a slope of 1:2 (V:H), the parapet angle
of 60° (practically 30° and overhang of 0.3 m) performs the best. However, in this study it was
found that overall the 0.3 m overhang provided worse results than the vertical wall. This is
further discussed in Section 5.2.3.
Figure 5.1 illustrates that at the 0.6 m overhang length the slope becomes constant; however,
the longer overhang lengths provided larger reduction (zero overtopping).
1.0E-07
1.0E-06
1.0E-05
1.0E-04
1.0E-03
1.0E-02
1.0 1.5 2.0 2.5 3.0 3.5 4.0 4.5 5.0
q/(
g H
mo
3)0
.5 *
Rc/Hmo
Comparison of overall performance of recurve walls
0 m 0.15 m 0.3 m 0.6 m 0.9 m 1.2 m 1.5 m 1.8 m 2.1 mBr
Figure 5.1: Comparison of overall performance of recurve walls
Stellenbosch University https://scholar.sun.ac.za
Page 86
Data discussion & analysis 65
Van Doorslaer and De Rouck (2011) further found that at a 50° parapet angle (practically, an
overhang of 0.15 and 0.3 m) overtopping reduction performance does not improve over that of
a vertical wall. For this study, this result can be seen in the 0.15 m overhang length series.
Provided in Figure 5.2 is a comparison of the 0, 0.15 and 0.3 m overhang lengths, magnified
around the area of focus.
* Note the overtopping rate is in m3/s/m
The intersections of lines are indicated on Figure 5.2 as dark blue stars. The mean of the 0.15 m series
lies below the mean of the vertical wall, however for the 𝑅𝑐
𝐻𝑚𝑜⁄ < 2, the 0.15 m series intersects
the 0 m mean. Similarly, the 0.3 m trend intersects the vertical wall at 𝑅𝑐
𝐻𝑚𝑜⁄ < 1.5. This
illustrates that the 0.15 and 0.3 m overhang lengtdo not improve the reduction performance of
the vertical wall.
5.2.2 Reduction of overtopping
The amount of the reduction in overtopping was evaluated by calculating the k-factor, as
discussed in Section 2.5.1. To get a better understanding of the severity of the k-factor the
overtopping rate of the vertical wall was plotted against the overtopping achieved for each
overhang length, as provided in Figure 5.3.
Figure 5.2: Overall performance comparison of 0 m, 0.15 m and 0.3 m
1.0E-04
1.0E-03
1.0E-02
1.0 1.5 2.0 2.5 3.0
q/(
g H
mo
3)0
.5 *
Rc/Hmo
Overall performance comparison of 0 m, 0.15 m and 0.3 m
0 m 0.15 m 0.3 m
Br
Stellenbosch University https://scholar.sun.ac.za
Page 87
Data discussion & analysis 66
Visually, Figure 5.3 may be interpreted as follows: If the data point lies below the red line, the
recurve test improved the overtopping rate of the vertical wall. From Figure 5.3 it can be
concluded that in most cases the recurve wall enhances the reduction in overtopping achieved
by the vertical wall under similar conditions. The result of the 0.15 m overhang length test lies
just below the line, indicating that this overhang length provided only a small reduction in
overtopping rate and, in some instances, performed worse than the vertical wall.
There are individual tests in the 0.6 m overhang length series that perform worse than the
vertical wall in similar conditions.
The 0.9 m overhang was the recurve with the longest overhang length before the wave height
was adjusted, and it resulted in increased overtopping rates. This can be seen visually, as the
0.6 m overhang length outperformed the overtopping rate reduction of the 0.9 m overhang
length, under similar conditions.
Furthermore, as the overhang length increases, the trend flattens, indicating that no further
improvement occurs in the effectivity reduction. The lowest freeboard levels achieve large
overtopping rate results.
0
5
10
15
20
25
30
0 5 10 15 20 25 30
Over
top
pin
g r
ate
rec
urv
e se
aw
all
[l/
s/m
]
Overtopping rate vertical wall [l/s/m]
Comparison of overtopping rate of vertical vs recurve wall
0.15 m 0.3 m 0.6 m 0.9 m 1.2 m 1.5 m 1.8 m 2.1 mBr
1:1
No improvement
Improvement
Figure 5.3: Comparison of overtopping rate of vertical versus recurve wall
Stellenbosch University https://scholar.sun.ac.za
Page 88
Data discussion & analysis 67
To further refine the analysis to determine the freeboard height up to which the recurve wall
would outperform the vertical wall, the k-factor (discussed in Section 2.5.1), is plotted against
the freeboard over the significant wave height, in Figure 5.4.
Each recurve test is compared with the relevant vertical wall test with corresponding water level
and wave period.
For the purposes of this study if a recurve wall achieved a k-factor equal to or more than one,
the recurve wall fails in terms of improving the performance of the reduction of the overtopping
of a vertical wall. This means that the recurve wall overtopping rate is equal to or greater than
that of a vertical wall.
The k-factor per wave period for each recurve overhang length is provided in Annexure H. It
should be noted that the zero k-factor results include scenarios where it was difficult to quantify
small overtopping volumes or water splashes (green water). Kortenhaus et al. (2003) found that
the magnitude of the k-factor depends on the degree of overtopping volume.
0
0.5
1
1.5
2
2.5
1.0 1.5 2.0 2.5 3.0 3.5 4.0 4.5
Calc
ula
ted
k-f
act
or
Rc/Hmo
Reduction of overtopping
0.15 m 0.3 m 0.6 m 0.9 m 1.2 m 1.5 m 1.8 m 2.1 mBr
Figure 5.4: Reduction in overtopping: Full data set
No improvement
Improvement
Stellenbosch University https://scholar.sun.ac.za
Page 89
Data discussion & analysis 68
0
0.2
0.4
0.6
0.8
1
1.2
1.4
1.0 1.5 2.0 2.5 3.0 3.5 4.0 4.5
Calc
ula
ted
k-f
act
or
Rc/Hmo
Reduction of overtopping: 0.15 m
Figure 5.5: Reduction in overtopping: 0.15 m
The overhang lengths that failed within the tested water levels are the recurve walls with
overhang lengths of 0.15, 0.3 and 0.6 m. The reduction in overtopping for the recurve wall with
the smallest overhang length of 0.15 m, is provided in Figure 5.5.
For those cases where it does not fail, the 0.15 m overhang length provides only a slight
improvement in the reduction of overtopping to that of the vertical wall. More than 50% of the
data points lie in the 0.6 to 0.9 k-factor region, representing an improvement of only 10% to
40%. The failure pattern of the 0.15 m overhang length does not exhibit a well-defined
clustering. To be certain that this recurve length provides a reduction in overtopping the use of
this shape would be recommended only when 𝑅𝑐
𝐻𝑚𝑜⁄ > 2.8.
However, the 0.3 m overhang length provides a clearer failure relationship. The reduction of
overtopping for the 0.3 m overhang is provided in Figure 5.6.
Stellenbosch University https://scholar.sun.ac.za
Page 90
Data discussion & analysis 69
Although this overhang length still fails at the low freeboard levels, it provides better reduction
than the 0.15 m, with more than 50% of data in the 0.5 to 1 k-factor range. This represents 50%-
100% reduction. The individual overhang lengths are provided in Annexure H.
5.2.3 Influence of the length of the overhang
The influence of overhang length on the overtopping rate is analysed per wave period. As the
𝐵𝑟𝐻𝑚𝑜
⁄ increases, it represents the increasing overhang length from 0 to 0.21 m. Figure 5.7 and
Figure 5.12 demonstrate that the lower freeboard levels produce higher mean overtopping rates.
From research (Schoonees, 2014); (Roux, 2013), it was expected that a longer overhang length
would increase the effectivity of the reduction of overtopping; however, only up to a point.
Figure 5.7 illustrates that for a 10 second wave the 0.6 m overhang becomes trivial for all except
the lowest freeboard water levels, for which a greater than 1.2 m overhang has no further
influence on the reduction of overtopping.
Figure 5.6: Reduction in overtopping: 0.3 m
0
0.5
1
1.5
2
2.5
1.0 1.5 2.0 2.5 3.0 3.5
Calc
ula
ted
k-f
act
or
Rc/Hmo
Reduction of overtopping: 0.3 m
Stellenbosch University https://scholar.sun.ac.za
Page 91
Data discussion & analysis 70
From Figure 5.7 it can be seen that the 2.5, 3.1 and 3.5 m freeboard levels achieve zero
overtopping results for a 𝐵𝑟
𝐻𝑚𝑜⁄ > 0.25, which represents overhang lengths longer than 0.3 m.
Similarly, this occurs for the 2.1 m freeboard level for a 𝐵𝑟
𝐻𝑚𝑜⁄ > 1.05, representing overhang
lengths longer than 1.2 m. The overtopping rate at the highest freeboard level decreases as the
overhang length increases, but never reaches zero overtopping.
There is a deviation from this trend in the lowest freeboard height, freeboard of 1.7 m, that is
present in all wave periods. In Figure 5.7 the 0.15 m overhang provides a slight improvement
in reduction of the overtopping rate compared with the 0 m overhang length, however, at a
𝐵𝑟𝐻𝑚𝑜
⁄ of 0.25, the 0.3 m overhang achieves worse overtopping results. This occurs as a
volume is trapped under the 0.3 m overhang. This phenomenon is considered by analysing the
overtopping reduction behaviour for the 10 second wave period with increasing overhang
length in Figure 5.8 to Figure 5.10 (from 0 to 0.3 m overhang lengths).
For the first three data points, representing the 0, 0.15 and 0.3 m overhang lengths, the lowest
two freeboard levels behave differently to the remainder of water levels. The vertical wall has
more overtopping events than with the 0.15 and 0.3 m overhang lengths; however, this is mostly
in small volumes.
The 0.15 m overhang length behaves similarly to the vertical wall, with a small lip of wave
uprush overtopping crossing the crest of the recurve structure. The small recurve overhang
restricts minimal overtopping, which results in the reduction of the dimensionless overtopping
0.000
0.002
0.004
0.006
0.008
0 0.5 1 1.5 2
q/(
g H
mo
3)0
.5
Br/Hmo
Influence of overhang length: Tp of 10 s
3.5 m 3.1 m 2.5 m 2.1 m 1.7 mRc
Figure 5.7: Influence of overhang length – 𝑻𝒑 of 10 s
Stellenbosch University https://scholar.sun.ac.za
Page 92
Data discussion & analysis 71
parameter. Provided in Figure 5.8 and Figure 5.9 are the overtopping styles of the 0 and 0.15 m
overhang lengths with arrows indicating the overtopping movement.
The 0.3 m overhang is the first recurve shape tested that changed the behaviour of the
overtopping volume. The 0.3 m recurve shoots the wave uprush upward and a portion of the
volume is trapped under the overhang component. As the remainder of the wave follows
through, the volume trapped under the overhang is pushed over the crest of the recurve wall.
Thus a larger volume breaches the crest of the structure than would without a recurve, as
demonstrated in Figure 5.10, where arrows indicate overtopping movement.
Figure 5.8: 0 m overtopping examples (A-17) (𝑻𝒑 = 10 s)
Figure 5.9: 0.15 m overtopping examples (B-17) (𝑻𝒑 = 10 s)
Stellenbosch University https://scholar.sun.ac.za
Page 93
Data discussion & analysis 72
1
The behaviour of the 0.3 m overhang length delivering worse overtopping reduction results
than the vertical wall was observed in all wave periods. Schematisation of this phenomenon is
provided in Figure 5.11, with arrows indicating the water movement.
It is clear that the various freeboard heights are not equally sensitive to the overhang length.
This validates what Roux (2013) found: that the height of the crest level is critical and that great
care should be taken when determining the crest level.
Figure 5.10: 0.3 m overtopping sequence (C-17) (𝑻𝒑 = 10 s)
2
Figure 5.11: Schematic of 0.3 m overhang behaviour
Stellenbosch University https://scholar.sun.ac.za
Page 94
Data discussion & analysis 73
The influence the overhang length has on the reduction performance for the 14 and 16 second
wave periods is as provided in Figure 5.12.
For the 2.5 and 3.1 m freeboard levels the overhang length becomes irrelevant from a 𝐵𝑟
𝐻𝑚𝑜⁄
of 0.5. The 1.7 m freeboard level flattens out from 𝐵𝑟
𝐻𝑚𝑜⁄ > 1.2, but does not reach zero
overtopping.
The decline visible between the first two points of the 1.7 m freeboard level in Figure 5.12
demonstrates that the 0.15 m overhang length improves the reduction of overtopping for a
vertical under similar conditions.
Figure 5.13 shows two examples of overtopping at the lowest freeboard level, for the vertical
wall and for a 0.15 m overhang.
Figure 5.13: Vertical wall overtopping scenario (A-24) (Left)
0.15 m overhang length overtopping scenario (B-24) (Right)
0.000
0.002
0.004
0.006
0.008
0 0.5 1 1.5 2
q/(
g H
mo
3)
0.5
Br/Hmo
Influence of overhang length: Tp of 14 s
3.5 m 3.1 m 2.5 m 2.1 m 1.7 mRc
Figure 5.12: Influence of overhang length – 𝑻𝒑 of 14 s
Stellenbosch University https://scholar.sun.ac.za
Page 95
Data discussion & analysis 74
The 0.15 m overhang length restricts overtopping minimally and therefore larger reflection
occurs for the B-series. For the A series with a 0 m overhang, a larger volume is carried over
the crest, visually represented as the decline in overtopping rate for the first two points in Figure
5.12.
The increase visible in Figure 5.12 for a 𝑅𝑐 of 1.7 m is as discussed above for the 10 second
wave period case. The overtopping scenario of the 14 second wave period in combination with
the lowest freeboard level is shown in Figure 5.14.
The tests series with a 0.3 and 0.6 m overhang lengths with a 14 second wave period are further
analysed to understand the discrepancy in the overtopping rate trends that was seen to occur
during this study. Although tests C-24 (0.3 m overhang) and D-24 (0.6 m overhang) have
similar wave heights, the 0.6 m overhang provides greater reduction, however only slightly
improves the 0.15 m overhang overtopping reduction. The 0.3 m overhang behaves as described
in Figure 5.10, producing larger overtopping rates.
To recommend the overhang length that performs best overall the influence of the overhang
length had to be examined for each water level. The wave periods for each freeboard level were
plotted over each other, and are provided in Annexure K.
The maximum overhang length per water level was determined by allocating the point at which
all the wave periods level out; thus the effect of increasing the overhang any further becomes
insignificant. The minimum overhang length was identified by using an overtopping rate limit
Figure 5.14: 0.3 m overhang length overtopping scenario (C-24) (Left)
0.6 m overhang length overtopping scenario (D-24) (Right)
Stellenbosch University https://scholar.sun.ac.za
Page 96
Data discussion & analysis 75
of 0.1 l/s/m (the permissible overtopping rate for aware pedestrians provided by EurOtop
(2007)). For the cases where this was not valid, the reduction of overtopping against a vertical
wall was evaluated.
To determine the influence the freeboard level has on the overtopping rate, the 2.1 m freeboard
height is provided in Figure 5.15.
From Figure 5.15 it can be observed that from 𝐵𝑟
𝐻𝑚𝑜⁄ > 1, the trends of all the wave periods
flatten out, which indicates that the overhang length has no further impact on the overtopping
rate. Only with the 0.6 m overhang does the overhang diminish the vertical wall overtopping
rate. A similar procedure was followed to recommend a functional overhang length per water
level, as provided in Table 5.1.
Table 5.1: Proposed overhang length per water level
Proposed overhang length per water level
Water level at
toe 𝑾𝑳𝒕𝒐𝒆
Freeboard
𝑹𝒄 Overhang length
𝑩𝒓
[m] [m] [m]
0.6 3.5 0.15 - 0.6
1 3.1 0.15 - 0.9
1.6 2.5 0.3 - 1.2
2 2.1 0.6 - 1.5
2.4 1.7 0.9 - 1.2
0
5
10
15
20
0 0.5 1 1.5 2
Over
top
pin
g r
ate
[l/
s/m
]
Br/Hmo
Influence of overhang length: Rc of 2.1m
8 s 10 s 12 s 14 s 16 sTp
Figure 5.15: Influence of overhang length: Rc of 2.1m
Stellenbosch University https://scholar.sun.ac.za
Page 97
Data discussion & analysis 76
5.2.4 Sensitivity to water depth
The sensitivity of the overtopping rate of recurve walls to water depth was investigated. The
influence of the water depth below the vertical wall (0 m overhang), is provided in Figure 5.16.
Roux (2013) found, from empirical equations, that the change in water level at the toe of the
seawall with 0 m overhang length is not critical. To the contrary, the present physical model
results demonstrate that the overtopping rate is very sensitive to the change in water depth at
the toe of the structure.
It can, however, be noted that the change in the overtopping rate is more critical for a 16 second
wave than for the 8 second wave sequence. This is also true for the recurve walls, although the
trend lines become steeper.
To determine the sensitivity of the overtopping rate of recurve wall to water depth, the 0.6 m
overhang has been selected and the graph is provided in Figure 5.17.
0
5
10
15
20
25
30
0.5 1 1.5 2 2.5
Over
top
pin
g r
ate
(l/
s/m
)
Water level at toe (m)
Sensitivity of water depth: 0 m overhang
8s 10s 12s 14s 16sTp
Figure 5.16: Sensitivity to the water depth of a vertical wall (0 m overhang)
Stellenbosch University https://scholar.sun.ac.za
Page 98
Data discussion & analysis 77
Similarly, the wave period has an influence on the 0.6 m overhang only if the water level
exceeds 1.6 m. The reason for the flattened graph and rightward shift is that, as the overhang
length increases, the overtopping volumes that occur reduce. As the overhang length increases,
the overtopping rate will be zero for greater water depths, and then rapidly increase.
For all the overhang lengths, in the scenarios in which the water level is less than the wave
height, the wave period has no significant influence on the overtopping rate. Similarly, as for
Figure 5.16, the slope of an 8 second wave is gentler than that of a 16 second wave. This
indicates that the water depth is not the only dependent variable, and that the influence of the
wave period should be researched.
5.2.5 Sensitivity of wave period
During the physical model tests the wave period was varied from 8 to 16 seconds, which
influences the wavelength. To compare an 8 second wave with a 16 second, theoretically, with
equal wave heights the 8 second wave crests would be more closely spaced than those of the
16 second wave. During this study variation was experienced because of influence of the wave
maker and its influence on dynamic wave absorption, that will be further discussed in Section
5.2.8.
To determine the sensitivity of the overtopping rate to the wave period, each recurve wall was
considered separately by plotting the overtopping rate against the wave period per water level
0
5
10
15
20
25
30
0.5 1 1.5 2 2.5
Over
top
pin
g r
ate
(l/
s/m
)
Water level at toe (m)
Sensitivity of water depth: 0.6 m overhang
8s 10s 12s 14s 16sTp
Figure 5.17: Sensitivity of a wall with 0.6 m overhang to water depth
Stellenbosch University https://scholar.sun.ac.za
Page 99
Data discussion & analysis 78
at the toe of the structure, as shown in Figure 5.18. The wave period sensitivity for each
overhang length is provided in Annexure L.
Figure 5.18: Vertical wall (0 m overhang) wave period sensitivity
As can be seen in Figure 5.18 and Figure 5.16, the wave period or water level cannot easily be
isolated as the only dependent variable. The wave period and water level each have a large
influence on the wave overtopping. For the vertical wall, with 0 m overhang length, with the
lower water levels the wave period does not have as significant an influence on the overtopping
rate. As the water level increases, the change in wave period becomes more critical in its
influence on the overtopping rate.
In most cases where overtopping is not zero it can be seen that the longer wave periods produce
larger overtopping rates. The shorter wavelengths comprise of smaller volumes of water, and
clear easily from the wall. In some instances, with the larger wavelengths, the first wave is
thrown seaward and becomes caught up in the second wave. This superimposes the waves, and
a larger volume breaches the crest.
The recurve wall profiles with overhang lengths of 0.15, 0.3 and 0.6 m, are also more sensitive
to wave periods at higher water levels. With the overhang lengths longer than 0.6 m, the wave
period sensitivity is as provided in Figure 5.19.
0
5
10
15
20
25
30
8 10 12 14 16
Over
top
pin
g r
ate
(l/
s/m
)
Tp (s)
Wave period sensitivity of 0 m overhang
0.6 m 1 m 1.6 m 2 m 2.4 m𝑾𝑳𝒕𝒐𝒆
Stellenbosch University https://scholar.sun.ac.za
Page 100
Data discussion & analysis 79
0
5
10
15
20
25
8 10 12 14 16
Ov
erto
pp
ing
ra
te (
l/s/
m)
Tp (s)
Wave period sensitivity of 0.9 m overhang
0.6 m 1 m 1.6 m 2 m 2.4 m𝑾𝑳𝒕𝒐𝒆
The effect of the wave height on the wave overtopping on the recurve wall is further discussed
in Section 5.2.6.
As the overhang length increases, only the highest water level significantly increases the
sensitivity of the wall to the wave period. This was in line with what had been expected for
longer overhang lengths, as the recurve wall is more efficient in reducing overtopping. As a
result, less water was breaching the crest of the recurve wall and thus less variability was visible
in the overtopping rate.
For all the profiles, the overtopping rates increase as the wave period increases. This contradicts
Roux (2013), who had found that the overtopping rate decreases beyond a 𝑇𝑝 of 12 seconds.
The increased wave heights in physical model tests with 14 and 16 second wave periods resulted
in increased overtopping rates. However, this increase would not be enough to explain the
difference between model data and Roux’s (2013) dataset.
5.2.6 Influence of wave height
For the purposes of the study it was chosen to keep the wave height constant. As a result of the
differences noted in the wave height, with the other variables kept constant, the influence of the
wave height on the overtopping rate is considered. This is further discussed in Section 5.2.7
Figure 5.19: Sensitivity of 0.9 m overhang to wave period
Stellenbosch University https://scholar.sun.ac.za
Page 101
Data discussion & analysis 80
The influence of both the maximum and incident wave heights were considered for the repeated
tests, provided in Table 5.2.
Table 5.2: Influence of wave height on overtopping rate: Tp of 12 & 10 s
Influence of wave height on overtopping rate: Tp of 12 & 10 s
Test A-3-3 A-3-4 A-3-5 A-3-6 A-22-1 A-22-2 A-22-3 A-22-4
Overhang length (Br) m 0 0 0 0 0 0 0 0
Water level at toe m 0.6 0.6 0.6 0.6 2.4 2.4 2.4 2.4
Maximum wave height m 2.29 2.22 2.22 2.23 2.65 2.65 2.64 2.68
2% wave height m 1.68 1.67 1.67 1.68 1.92 1.92 1.92 1.94
Incident wave height m 0.97 0.99 0.97 0.97 1.11 1.10 1.10 1.10
Volumemeasured l 11 12 11 11 192 198 194 192
Overtopping rate l/s/m 0.18 0.18 0.16 0.16 7.67 7.90 7.77 7.70
As provided in the table the 𝐻𝑀𝐴𝑋 , 𝐻2% and 𝐻𝑖 are approximately equal. This corresponds
with the overtopping rate recorded.
Difficulty was, however, experienced in achieving similar wave heights for the same test
conditions for different overhang lengths. In Table 5.3 are two sets of data with the overhang
length as the only variable.
Table 5.3: Influence of wave height on overtopping rate: Tp 14 & 16 s
Influence of wave height on overtopping rate Tp of 14 & 16 s
Test A-24 B-24 C-24 D-24 A-25 B-25 C-25 D-25
Overhang length (Br) m 0 0.15 0.3 0.6 0 0.15 0.3 0.6
Water level at toe m 2 2 2 2 2.4 2.4 2.4 2.4
Maximum wave height m 1.806 1.796 2.006 2.020 3.062 3.063 3.320 3.591
2% wave height m 2.50 2.51 2.76 2.79 1.99 2.06 2.13 2.23
Incident wave height m 1.07 1.11 1.21 1.21 1.19 1.24 1.29 1.34
Volumemeasured l 751 478 1019 741 1036 1096 1371 1012
Overtopping rate l/s/m 21.45 19.03 29.12 21.18 25.90 27.40 33.09 25.31
Comparing the tests C-24 and D-24 (0.3 m versus 0.6 m overhang length), the HMAX, H2% and
Hi should be similar. However, it can be seen that results from tests A-24 and B-24 are
approximately the same, and similarly for tests C-24 and D-24. The exact influence this has on
the physical model results is unknown.
Stellenbosch University https://scholar.sun.ac.za
Page 102
Data discussion & analysis 81
3
2
1
During the course of the study it was observed that the maximum wave height influences the
maximum volume that overtops the crest of the structure, although the volume per overtopping
event was not measured. When comparing tests B-25 and C-25, the HMAX is larger for test C-
25, although this is not significantly noticeable in 𝐻𝑖.
In cases where the freeboard is at its lowest, the wave height has a great influence on the volume
that overtops the crest of the recurve wall. This is at the lowest freeboard level (highest water
level), where the wave height is greater than the available freeboard height (𝑅𝑐 = 0.6 m where
𝐻𝑖 = 1 m). As the incoming wave hits the recurve wall, the wave submerges the wall and
overtops the crest of the recurve wall.
The recurve wall is designed so that the incoming wave hits the vertical wall and/or the slanted
component of the wall (indicated as 1 and 2 on Figure 5.20). The waves are then reflected and
cleared from the wall. In some cases, the incoming wave hits the recurve wall on the
perpendicular face of the crest, above the recurve (indicated as 3 on Figure 5.20), and the wave
is then thrown upward and a large quantity of water overtops the structure.
The effect of the wave height in the dimensionless overtopping parameter (Equation 2.16) is to
the power of 1.5. This does not illustrate the influence of the wave height on the volume clearly.
Figure 5.20: Illustration of recurve wall components
Stellenbosch University https://scholar.sun.ac.za
Page 103
Data discussion & analysis 82
5.2.7 Repeatability & accuracy
The accuracy of the tests was evaluated by repeating two sets of tests four times. To evaluate
the variability in the overtopping rates with repeated conditions, the coefficient of variation
(𝐶𝑜𝑉) is calculated by using Equation (5.1).
𝐶𝑜𝑉 =σ
𝜇 × 100 (5.1)
Where:
σ – Standard deviation of prototype overtopping rates
𝜇– Average of the prototype overtopping rates
The first test was that where only the overtopping bin was used as an overtopping measuring
technique as provided in Table 5.4. Second, the test with a higher water level, using the pump
in combination with the overtopping bin as recording technique, as demonstrated in Table 5.5.
Table 5.4: Accuracy test with use of overtopping bin
Accuracy test with use of overtopping bin
MO
DE
L V
AL
UE
S
Test A-3-3 A-3-4 A-3-5 A-3-6
WLpaddle m 0.446 0.446 0.446 0.446
WLtoe m 0.03 0.03 0.03 0.03
Tp s 2.638 2.638 2.638 2.638
Test duration s 2638 2638 2638 2638
Hmo AVG mm 57.10 58.31 57.10 57.40
Hi mm 48.28 49.47 48.31 48.59
Volumemeasured l 11.00 11.50 10.93 11.00
PR
OT
OT
YP
E V
AL
UE
S
WLtoe m 0.6 0.6 0.6 0.6
RC m 3.4 3.4 3.4 3.4
Tp s 12 12 12 12
Hmo AVG m 1.14 1.17 1.14 1.15
Hi m 0.97 0.99 0.97 0.97
Volumemeasured l 88000 92000 87467 88000
Overtopping rate l/s 3.52 3.54 3.24 3.14
Overtopping rate pm l/s/m 0.18 0.18 0.16 0.16
CoV % 2.37
Stellenbosch University https://scholar.sun.ac.za
Page 104
Data discussion & analysis 83
Table 5.5: Accuracy tests with use of pump
Accuracy test with use of pump M
OD
EL
VA
LU
ES
Test A-22-1 A-22-2 A-22-3 A-22-4
WLpaddle m 0.535 0.535 0.535 0.535
WLtoe m 0.12 0.12 0.12 0.12
Tp s 2.236 2.236 2.236 2.236
Test duration s 2236 2236 2236 2236
Hmo AVG mm 70.93 70.56 70.91 70.87
Hi mm 55.25 54.99 55.24 55.20
Volumemeasured l 191.71 197.61 194.20 192.38
PR
OT
OT
YP
E V
AL
UE
S WLtoe m 2.4 2.4 2.4 2.4
Rc m 1.7 1.7 1.7 1.7
Tp s 10 10 10 10
Hmo AVG m 1.42 1.41 1.42 1.42
Hi m 1.11 1.10 1.10 1.10
Volumemeasured l 1533713 1580911 1553595 1539054
Overtopping rate l/s 153.37 158.09 155.36 153.91
Overtopping rate pm l/s/m 7.67 7.90 7.77 7.70
CoV % 1.36
The coefficient of variability (CoV) of the repeated tests is less than 5%, which is good
coefficient of variability. As a result of the variations in wave heights and the maximum wave
height that was experienced during the experiments, the CoV could not be further lowered. The
CoV for the CLASH dataset was up to 13% (De Rouck et al., 2005). This is allowable, as the
data were recorded in different flumes and on variable scales. The CoV was expected to be
lower in this case as the physical model setup was the same for all tests.
5.2.8 Influence of recurve wall on Dynamic Wave Absorption
As the physical model tests were executed, and the overhang length was increased, it was
observed during the 1.2 m overhang series, series F, that the wave height increased gradually.
Thus, indicating that the dynamic wave absorption system is not working as designed, as
discussed in Section 2.6.2, and not removing the reflective outgoing wave from the wave
paddle. This resulted in mean wave heights outside the tolerable range. Practically, this was
seen by the height of the waves being much larger than the design wave height, which was
Stellenbosch University https://scholar.sun.ac.za
Page 105
Data discussion & analysis 84
confirmed by the 𝐻𝑚𝑜 retrieved from the DAQ software. This occurred while the design
parameters were being kept constant, as well as specifically keeping the water level constant
throughout the test.
The dynamic wave absorption system designed by HR Wallingford (2010) for a 2D flume, was
developed to enable adjustment of the wave height reflecting from the wave paddle, in order to
generate wave heights more accurately to design conditions. It is known that the DWA is not
as effective if applied to vertical structures, for example Series A, with 100% reflection. The
application of the DWA concept on the recurve wall further worsens its performance.
When the recurve wall was functional in the flume, a larger percentage of the incoming wave
was reflected back in the direction of the wave paddle. Thus no adjustment was made for the
increased reflective wave and, therefore slowly the wave heights were amplified during the
course of the experiment.
Reflective wave Amplified reflective wave
Figure 5.21: Amplified reflective wave F-22
As the DWA is only a function of the water depth and wave period, an adjustment was made to
use a lesser wave height to counteract this phenomenon. This delivered an average wave height
that was similar to that of the other data series. Figure 5.22 illustrates the influence of wave
adjustment on Test F-25.
Stellenbosch University https://scholar.sun.ac.za
Page 106
Data discussion & analysis 85
F-25 F-25 with wave adjustment
Figure 5.22: Influence of wave adjustment F-25
The adjustment reduced the average 𝐻𝑖 from 72 mm to 58 mm. It can be seen that large volumes
overtopped the crest level of the recurve wall.
5.3 Comparison with previous results and EurOtop tool
The physical model results were compared with results obtained from Allsop et al. (2005),
Schoonees (2014), as well as with those from the online EurOtop overtopping prediction tool.
5.3.1 Allsop et al. (2005)
The physical model results were compared with the research of Allsop et al. (2005) in two
ways. First, by plotting the dimensionless overtopping parameter against the freeboard over
wave height and, secondly, by evaluating the theoretically developed k-factor against the
calculated k-factors.
Further, a theoretical k-factor was developed by Allsop et al. to provide an indication of what
reduction in the overtopping rate could be expected from an overhang length.
The theoretical k-factor versus the calculated k-factor was plotted per overhang length,
provided in Annexure L. Figure 5.23 shows results for the 0.6 m overhang length.
Stellenbosch University https://scholar.sun.ac.za
Page 107
Data discussion & analysis 86
The theoretical k-factor equations deliver a maximum k-factor of one. Thus, the scenario of a
recurve wall that does not improve the overtopping rate of a vertical wall is not taken into
account of.
Practically, during the course of this study this highlights a shortcoming in the theoretical k-
factor. Visually it can be seen from the figure by the calculated k-factor forming a horizontal
line from 𝑅𝑐
𝐻mo⁄ < 1.5. The measured k-factor does include scenarios where recurve walls fail,
resulting in k-factors larger than one.
The EurOtop database and k-factor method was developed with a recurve profile as
demonstrated in Figure 5.24 on the right. However, the physical model recurve wall geometry
is as provided on the left.
Figure 5.24: Physical model recurve wall (left);
EurOtop Wave return wall (right)
𝛽2 𝛽1
0
0.5
1
1.5
2
1 1.5 2 2.5 3 3.5
k-f
act
or
Rc/Hmo
Measured vs Calculated k-factor: 0.6 m overhang
Calculated k-factor Measured k-factor
Figure 5.23: Measured versus Calculated k-factor: 0.6 m overhang
Stellenbosch University https://scholar.sun.ac.za
Page 108
Data discussion & analysis 87
The calculated k-factor should predict increased overtopping rates, as a result of the difference
in geometry. The opposite is visible in Figure 5.23, as all the calculated k-factors are lower than
the measured k-factor. This implies that the reduction is over-predicted. Allsop et al. (2005)
recommended that a physical model should be used if a reduction factor of 20 is required (k <
0.05).
As the overhang length becomes greater, the k-factor reduces as expected and correlates better
with the calculated k-factors. The 0.3 m overhang series, as discussed in the previous section,
does not improve the overtopping reduction performance of the vertical wall. The measured
versus the calculated k-factor for the 0.3 m overhang series is provided in Figure 5.25.
For all the overhang lengths, the calculated k-factor becomes constant at a certain point.
The theoretical k-factor equations (2.13) to (2.15) are dependent on the 𝑅𝑐 and 𝐻𝑚𝑜, the values
of which vary for each series, but using the same variables causes similar k-factors, for example
at 𝑅𝑐
𝐻mo⁄ < 1.5.
5.3.2 Schoonees (2014)
The dataset for this research project was designed to expand on Schoonees’s (2014) research.
Two datasets were repeated, to determine whether tests with overlapping conditions could be
used. The first dataset was the 10 second wave period for the 0 m overhang recurve profile (i.e.
0
0.5
1
1.5
2
2.5
1 1.5 2 2.5 3 3.5 4 4.5
k-f
act
or
Rc/Hmo
Measured vs Calculated k-factor: 0.3 m overhang
Calculated k-factor Measured K-factor
Figure 5.25: Measured versus Calculated k-factor: 0.3 m overhang
Stellenbosch University https://scholar.sun.ac.za
Page 109
Data discussion & analysis 88
the vertical wall). The comparison of Schoonees’s (2014) vertical wall dataset extract was
compared against the model results, provided in Table 5.6.
Table 5.6: Comparison of Model results and Schoonees (2014) 0 m recurve profile
Extract Series A: 0 m overhang recurve profile
Test A-2 A-7 A-12 A-17 A-22
WLtoe m 0.03 0.05 0.08 0.1 0.12
Rc m 0.175 0.155 0.125 0.105 0.085
Tp s 2.236 2.236 2.236 2.236 2.236
Hmo AVG m 0.0451 0.0503 0.0534 0.0565 0.0543
Overtopped volume l 10.00 55.25 113.77 165.72 182.39
Schoonees’s (2014) 0 m overhang recurve profile
Test AVG A6-7 AVGA4-5 AVGA2-3 A-1 AVGA8-10
WLtoe m 0.03 0.05 0.08 0.1 0.12
Rc m 0.17 0.15 0.12 0.1 0.08
Tp s 2.236 2.236 2.236 2.236 2.236
Hmo AVG m 0.060 0.063 0.063 0.060 0.059
Overtopped volume l 29.08 127.82 312.64 454.78 454.85
It can be seen that the model results are significantly lower than those in the Schoonees’s (2014)
dataset. This can be attributed to various factors, namely, the water level, crest level and wave
height.
It was attempted to replicate Schoonees’s (2014) model setup to achieve results that
corresponded as closely as possible. Because of the uncontrollable variables present during the
configuration of the wall into the flume, the vertical wall was a height of 0.205 m, compared to
the designed 0.2 m. This provided an additional 0.005 m of freeboard, which would cause less
water to travel over the crest of the recurve wall. Furthermore, to achieve the same water level
at the toe of the recurve wall, the water level at the wave paddle was lowered by 0.005 m. This
was taken into account in all calculations and should not have a great effect on the overtopping
rate.
Although the discrepancies might seem large in comparison to the varying wave height, the two
different datasets correlated well with the corresponding EurOtop datasets. A root mean squared
analysis was performed and is provided in Annexure M. For the vertical wall, the physical
Stellenbosch University https://scholar.sun.ac.za
Page 110
Data discussion & analysis 89
model tests delivered a root mean squared error of 1.47. Between Schoonees (2014) and the
EurOtop a larger error of 3.805 was achieved; although it still indicates a small error.
The wave heights achieved in the physical model are closer to the designed wave height of
0.05 m than that achieved by Schoonees (2014). These deviations all contribute to a lower
overtopping volume. This also applies to the 1.2 m recurve profile that is provided in Table 5.7.
Table 5.7: Comparison of model results and Schoonees (2014) 1.2 m recurve profile
Extract Series F: 1.2 m overhang recurve profile
Test F-2 F-7 F-12 F-17 F-22
WLtoe m 0.03 0.05 0.08 0.1 0.12
Rc m 0.175 0.155 0.125 0.105 0.085
Tp s 2.236 2.236 2.236 2.236 2.236
Hmo AVG m 0.048 0.051 0.054 0.056 0.056
Overtopped volume l 0.00 0.00 0.00 1.32 35.75
Schoonees’s (2014) 1.2 m overhang recurve profile
Test C-5 C-4 AVGC1-3 AVGC6-9 AVGC10-12
WLtoe m 0.03 0.05 0.08 0.1 0.12
Rc m 0.17 0.15 0.12 0.1 0.08
Tp s 2.236 2.236 2.236 2.236 2.236
Hmo AVG m 0.063 0.066 0.062 0.063 0.059
Overtopped volume l 0.42 1.22 2.23 26.16 153.30
With the 1.2 m overhang profile, the results for the lower water levels, where most of the water
is reflected against the vertical wall and the bottom component of the overhang length. The
deviation is thus not as significant as in the lower freeboard cases, where the crest level had a
significant influence.
The error for the 1.2 m overhang length is lower than the error for the vertical wall. The RME
for the physical model is 0.25, compared to a 1.76 error achieved by Schoonees (2014). This
indicates that the data series error is smaller than that in Schoonees’s (2014) dataset, although
it still indicates a small error. The full root mean squared method analysis is provided in
Annexure M.
A comparison of the physical model results and those of Schoonees (2014) can be seen in Figure
5.26.
Stellenbosch University https://scholar.sun.ac.za
Page 111
Data discussion & analysis 90
* Note the overtopping rate is in m3/s/m
When the two datasets are compared in prototype values, with the wave height taken into
account, the difference in results is not as significant. The 0 m for Swart (2016) and Schoonees
(2014) follow the same trend. Similarly, for the 1.2 m overhang.
5.3.3 EurOtop online calculation tool
The online EurOtop overtopping calculation tool is used to evaluate the measured overtopping
results, as described in Section 2.5.1 with the vertical wall and vertical wall with wave return
interfaces. The vertical wall with the wave return is used as approximation, as the geometry of
the recurve wall used in the physical model test would provide better results, as the wave return
shoots the wave back seaward at a flatter angle. This is illustrated in Figure 5.24 by 𝛽1 < 𝛽2.
Take note that the graphs’ y-axes do not necessarily have the same scales.
The EurOtop tool provides the probabilistic and deterministic overtopping rate. The
probabilistic plot is obtained by fitting a mean linear trend line to the dataset compiled by the
CLASH initiative. The deterministic plot is one standard deviation from the probabilistic trend,
this is to take account for variability of the dataset that is compiled from data with diverse model
conditions. The data measured in the physical model should fall within the two boundaries.
1.0E-11
1.0E-10
1.0E-09
1.0E-08
0.0 0.5 1.0 1.5 2.0 2.5 3.0 3.5 4.0 4.5
Q/(
g H
mo
3)0
.5
Rc/Hmo
Comparison of Model results vs Schoonees(2014)
0 m Swart (2016) 0 m Schoonees (2014) 1.2 m Swart (2016) 1.2 m Schoonees (2014)
Figure 5.26: Comparison of Model results versus Schoonees (2014)
Stellenbosch University https://scholar.sun.ac.za
Page 112
Data discussion & analysis 91
The non-impulsive condition of the vertical wall (Series A) physical model results as well as
the EurOtop results are compared with the data provided by Allsop et al. (2005) in Figure 2.17
(Section 2.5.3).
Figure 5.27: Comparison of EurOtop with physical model results 0 m
The data is plotted with the dimensionless overtopping parameter on a logarithmic scale versus
the freeboard over incoming wave height on a linear scale.
The measured data of the vertical wall strives to a dimensionless overtopping parameter of 40
(0.04 if q is m3/s/m), that corresponds with the trend found by Allsop et al. (2005).
The vertical wall with a wave period of 8, 10 and 12 second compares best with EurOtop
probabilistic and deterministic data. Provided in Figure 5.28 is the 12 second wave period of
the wall with a 0 m overhang length.
0.01
0.10
1.00
10.00
100.00
0.0 1.0 2.0 3.0 4.0 5.0
q/(
g H
mo
3)0
.5
Rc/Hmo
EurOtop comparison: 0 m overhang length
Measured data Probabilistic Deterministic
Stellenbosch University https://scholar.sun.ac.za
Page 113
Data discussion & analysis 92
Where the measured data falls below the empirical data is where 𝑅𝑐
𝐻𝑚𝑜⁄ > 2.4, representing the
high freeboard levels. With these conditions the recurve wall is most effective and the low
overtopping volumes are difficult to quantify in physical model conditions.
Considering the higher wave periods for vertical walls, the measured data lies within two
standard deviations from the probabilistic trend. This could be a result of the wave period being
outside the allowable range, thus extrapolating data not based on actual tests. This results in the
0
2
4
6
8
1.3 1.8 2.3 2.8 3.3 3.8 4.3 4.8 5.3
Q/(
g H
mo
3)0
.5
Rc / Hmo
Series A 0 m: Tp of 12 s
Measured data Probabilistic Deterministic
Figure 5.28: EurOtop comparison 0 m overhang – 𝑻𝒑 of 12 s
0
5
10
15
20
25
1.3 1.8 2.3 2.8 3.3 3.8
Q/(
g H
mo
3)0
.5
Rc / Hmo
Series A 0 m: Tp of 16 s
Measured data Probabilistic Deterministic
Figure 5.29: EurOtop comparison 0 m overhang – 𝑻𝒑 of 16 s
Stellenbosch University https://scholar.sun.ac.za
Page 114
Data discussion & analysis 93
tool over-predicting the overtopping rate for the 16 second wave period as indicated in Figure
5.29.
The wave recordings were taken before the slope of the recurve wall of the model, thus it was
assumed that the beach slope had no significant influence on the wave height and, indirectly,
on the wave overtopping.
When considering Series B to I, overhang lengths 0.15 to 2.1 m, the general trend was that cases
with the higher freeboard where 𝑅𝑐
𝐻𝑚𝑜⁄ > 2.3, the empirical method over-predicts and, for
lower cases, under-predicts.
Although the empirical tool is suggested for the use of preliminary design, the 16 second wave
period should be considered carefully when used with low freeboard water levels.
The recurve walls with the 0.15 and 0.3 m overhang lengths, behaved as shown in Figure 5.30.
The comparisons of all the EurOtop datasets are provided in Annexure O.
The measured data does not fall between the probabilistic and deterministic, but correlates
better with the dataset. When considering only the 12 second wave period, a trend is more easily
noticeable, as seen in Figure 5.31.
0.001
0.010
0.100
1.000
10.000
100.000
1.0 1.5 2.0 2.5 3.0 3.5
q/(
g H
mo
3)0
.5
Rc/Hmo
EurOtop comparison 0.3 m overhang
Measured data Probabilistic Deterministic
Figure 5.30: EurOtop comparison 0.3 m overhang
Stellenbosch University https://scholar.sun.ac.za
Page 115
Data discussion & analysis 94
For the higher freeboard cases, the empirical data suggests that the overtopping rate is not
sensitive to the change in freeboard. This, however, is in contrast to what was found in the
physical model. In the laboratory, as the freeboard decreased, the overtopping volumes
increased, and are represented as the highest point of the measured data graph in Figure 5.31.
The empirical method correctly predicts only the lowest freeboard case for the recurve walls
with longer overhang lengths (1.2 m and longer), as seen in Figure 5.32.
Furthermore, all wave periods follow the same trend, and the empirical data over-predicts the
overtopping rate.
Figure 5.32: EurOtop comparison 1.2 m overhang
0
2
4
6
8
10
1.3 1.8 2.3 2.8 3.3
Q/(
g H
mo
3)
0.5
Rc / Hmo
Series C 0.3 m: Tp of 12 s
Measured data Probabilistic Deterministic
0.001
0.010
0.100
1.000
10.000
100.000
1.0 1.5 2.0 2.5 3.0 3.5 4.0
q/(
g H
mo
3)0
.5
Rc/Hmo
EurOtop comparison 1.2 m overhang
Measured data Probabilistic Deterministic
Figure 5.31: EurOtop comparison 0.3 m overhang – 𝑻𝒑 of 12 s
Stellenbosch University https://scholar.sun.ac.za
Page 116
Data discussion & analysis 95
For the overhang lengths of 1.2 m and longer, the recurve wall achieves zero overtopping results
where the wall allows little or no overtopping to breach the crest of the recurve wall. These
instances of very little overtopping are not included in the figure in the region where 𝑅𝑐
𝐻mo⁄ >
2.5.
From the online tool, it was found that there were discrepancies in the results, where the
overtopping rate calculated was outside the expected range. These outliers were identified
where the overtopping rate was outside range of wave periods at the same water level. This was
found at an overhang length of 0.9 m, with wave periods of 10 and 16 second, as well as for an
overhang length of 1.8 m with a 12 second wave period.
5.4 Summary
The analysis of the physical model’s results illustrated that the overtopping rate is not only
sensitive to the change in overhang length, but also strongly dependent on the change in water
depth, freeboard level and wave height and period.
The research validated that for the recurve wall with a parapet angle greater than 50º, as defined
by Section 2.5.4, does not improve the rate of prevention of overtopping of a vertical wall. If a
recurve wall with 0.15 or 0.3 m overhang is considered, the design process should validate the
results with a physical model designed with the exact parameters as design problem.
As the water level increased and freeboard decreased, it was found that the functionality of the
recurve reduces, because the recurve wall is not a feature that is designed to function in a
drowned state.
At the lowest freeboard levels, the overtopping is especially sensitive to changes in wave height.
If the wave hits the slanted or perpendicular surface of the overhang of the recurve wall in the
drowned state, the wall is no longer effectively reducing the overtopping, and would result in
large overtopping rates.
The physical model results disproved Roux’s (2013) conclusion that a wave period of greater
than 12 seconds reduces the overtopping rate, as continuous growth of overtopping rate was
observed under these conditions from test results.
For the lowest freeboard case, an overhang length greater than 1.2 m does not have a significant
influence on the reduction of overtopping. In these cases, especially for the 12, 14 and 16 second
wave periods, the volume overtopping is strongly dependent on the wave height. This occurs,
Stellenbosch University https://scholar.sun.ac.za
Page 117
Data discussion & analysis 96
because the freeboard available is less than the wave height, and the waves thus overtops the
wall regularly.
The physical model results correlate moderately well with previous research. For the EurOtop
results, the high overtopping events are over-predicted and the low freeboard levels are under-
predicted. As this is only recommended for preliminary design, the variability is acceptable.
It was found, in high freeboard cases of the physical model results, that the data recording
method was not accurate enough to measure the small overtopping volumes and, as the EurOtop
over-predicts the wave overtopping, the average of the two is required to achieve an authentic
representative account of the performance of recurve walls.
Stellenbosch University https://scholar.sun.ac.za
Page 118
97
6 PROPOSED DESIGN PROCEDURE
PROPOSED DESIGN PROCEDURE
6.1 Introduction
The reader should now have an in-depth knowledge of overtopping and the behaviour of recurve
walls under various, yet specific, sea conditions. In this chapter more attention will be given to
aiding the designer in the process of design and selection. First, the general design
considerations will be discussed, then the selection of the recommended overhang length and
finally, the importance of awareness of potential failure modes will be highlighted.
6.2 Design considerations
6.2.1 General comment
The recurve wall is designed to function so that the waves curl up into the recurve and shot
back seaward. It is important to design the recurve wall to have enough freeboard so that it can
function in this manner. As a rule of thumb, the design should allow for a freeboard of a
minimum of 1.5 times the height of the design wave.
The designer should consider the effect that the recurve wall will have on the surrounding area.
A 100% reflection of waves can change the wave climate and cause wave focusing at a different
point. The public should not use the area beneath the recurve wall, as the waves that shoot
seaward could cause harm if unexpected by people in the area.
The conclusions made from this study are valid only for the chosen design parameters as
stipulated in Section 3.7.
CHAPTER 6
Stellenbosch University https://scholar.sun.ac.za
Page 119
Proposed design procedure 98
6.2.2 Procedure
The main principles that should be followed in the process of designing a recurve wall can be
divided into four steps:
1. Determine the use of the facility:
The purpose the wall or area is designed for will determines the permissible overtopping
rate that the recurve wall should be design for. EurOtop provides limits for various purposes,
provided in Table 2.1 - 2.3. These tables allow the designer to choose to incorporate a safety
factor by choosing a higher overtopping rate than required.
2. Wave climate information:
The wave climate information required for this design process is the wave height and period
(𝐻𝑚𝑜 and 𝑇𝑝) of the identified area.
3. Site-specific information:
To determine the crest level, the water level and freeboard levels are required. Most often
more than one freeboard and crest level will be selected, to provide more alternatives.
The crest level should be chosen so that the design water level falls within the vertical face
of recurve wall (indicated as 1 on Figure 5.20) so that the incoming HMAX collides into the
vertical face of the recurve wall.
4. Select relevant chart:
The relevant design chart is chosen according to the site-specific wave period.
The overtopping rate and 𝐻𝑚𝑜 are inserted in the dimensionless overtopping parameter,
provided in Equation (2.16). Finally, the dimensionless overtopping parameter is used as a
limit. All freeboard and overhang length combinations beneath the limiting parameter can
be chosen.
Note: The limitation of this study is that it is developed for an approach seabed slope of
1:18.6 and 𝐻𝑚𝑜 from 1 to 1.25 m.
Stellenbosch University https://scholar.sun.ac.za
Page 120
Proposed design procedure 99
6.2.3 Recommended overhang lengths
The overhang lengths, 𝐵𝑟 as indicated in Figure
6.1, for each wave period are considered and the
recommended overhang lengths are provided in
Table 5.1.
The low freeboard and high freeboard levels
should be interpreted differently. For the 𝑅𝑐 of 1.7
and 2.1 m, a longer overhang length is required, as
the recurve wall is functioning in a submerged
state, with mostly large volumes overtopping the
crest.
6.2.4 Potential failure modes
Identification of the potential failure modes was not the objective of this study; however, these
were indirectly observed. From the results of the physical models test, the following were
highlighted as the sites of possible problems: first, the areas between the precast units and,
secondly, the connections between the vertical and diagonal faces.
The large forces observed in the physical model, resulted in practical problems of fixing the
seawall to the flume walls; highlighted that the joint between the recurve wall units (indicated
as 1 in Figure 6.2), is a weak point, and should be designed accordingly.
Secondly, considering the joint between the vertical and diagonal faces. As the incoming wave
hits the structure, the wave is captured beneath the overhang, which then experiences a large
force upward (indicated as 2 in Figure 6.2). This is more significant for longer overhang lengths.
The joint between the overhang length and the upright section as should be considered.
Figure 6.1: Input parameters
Stellenbosch University https://scholar.sun.ac.za
Page 121
Proposed design procedure 100
6.3 Example
To illustrate the design procedure, an example of how to follow the four steps as provided in
Section 6.2.2 is given below.
The wave climate input variables 𝐻𝑚𝑜 and 𝑇𝑝 are chosen. The site that the recurve is being
designed for, is accessible to the public. The overtopping rate is chosen from Table 2.3, as that
which is safe for aware pedestrians.
Table 6.1: Procedure example input variables
Procedure example
INPUT VARIABLES 1. Facility use Table 2.1
2. Wave climate CHECKS 𝑄 0.1 l/s/m
𝑇𝑝 12 s Safe for aware pedestrians
𝐻𝑚𝑜 1 m √
4. OUTPUT VARIABLES
3. Site-specific Dimensionless overtopping parameter
𝑆𝑜 1:18.6 - √
𝑄
√𝑔 𝐻𝑚𝑜3
0.00319 𝑊𝐿𝑡𝑜𝑒 2.3 m
𝑅𝑐 1.7 m
For the present design problem, the wave height and approach slope are within the allowable
range. The relevant chart for the 12 second wave period is selected. The dimensionless
overtopping parameter is used as a limiting variable (Figure 6.3).
Figure 6.2: Failure modes schematic
1 2
Stellenbosch University https://scholar.sun.ac.za
Page 122
Proposed design procedure 101
To achieve the designed overtopping rate for the design scenario, any overhang length, in
combination with a freeboard level beneath the red line can be chosen. For the chosen freeboard
level of 1.7 m, the blue shaded area is the allowable design region. Freeboard levels should be
interpolated on the chart to achieve a value between data points.
For this freeboard level, the 1.2, 1.5, 1.8 and 2.1 m overhang lengths are included. However, as
no significant reduction effect can be seen between overhang lengths of 1.2 m and 2.1 m. The
use of a 1.2 m overhang length is recommended.
6.4 Summary
The design procedure is schematically represented in Figure 6.4
•Determine q [l/s/m]
•EurOtop limits in Table 2.3-2.5
1. Determine the use of facility
•Wave period Tp
•Wave height Hmo
2. Wave climate information
•Water level
•Crest level
•Determine Freeboard Rc
3. Site-specific information
•Input Q and Hmo in Dimensionless overtopping parameter Eq 2.16
•Determine the Br required
4. Select relevant chart (TP)
Figure 6.4: Schematic of design procedure
Figure 6.3: Example of how to use the design chart
Stellenbosch University https://scholar.sun.ac.za
Page 123
102
7 CONCLUSIONS
CONCLUSIONS
7.1 Introduction
An extensive study was conducted on the effect of the length of the overhang on the reduction
of overtopping when compared with the performance of a vertical wall under similar conditions.
As a result, the knowledge base concerning the manner in which recurve seawalls behave and
specifically, influence wave overtopping was significantly expanded.
The objectives of this study were to determine the effect of the overhang length on the reduction
of overtopping, to compile a comprehensive set of design guidelines for the design of recurve
seawalls, and to determine to the freeboard height to which the recurve seawall will outperform
a vertical wall.
To achieve these objectives, a 2D physical model was designed and tests were conducted in a
glass-walled wave flume equipped with a piston-type wave-generating paddle that was
equipped with a dynamic wave absorption system. To provide a detailed design guideline, nine
different recurve shapes were tested with five different water levels. Wave periods
characteristic of the South African coast were chosen, while the seabed slope and wave height
remained constant.
7.2 Findings from the literature
The literature reports remarkable research regarding the use of recurve walls to reduce wave
overtopping; the detailed attention on this type of structure having started in the early stages of
research on recurve walls by Berkeley-Thorn and Roberts (1981), who developed the now well-
known recurve wall shape.
Owen (1993) conducted research to evaluate the performance of different types of recurve walls
and concluded that the use of a recurve wall was more effective than raising the crest level of a
vertical seawall. It was further concluded that the freeboard and crest level of a recurve seawall
have a significant influence on the effectiveness of the wall.
Recent research administered through the European Union’s CLASH programme (Crest Level
Assessment of coastal Structures and Hazard analysis on permissible overtopping) has resulted
CHAPTER 7
Stellenbosch University https://scholar.sun.ac.za
Page 124
Conclusions 103
in the establishment of a substantial database. This dataset is now accessible through an online
calculation tool that can be used to predict the reduction in overtopping. Allsop et al. (2005)
developed a decision chart to aid in predicting the reduction in overtopping for the purposes of
the design of feasibility studies.
Van Doorslaer and De Rouck (2011) conducted research on a vertical wall with a parapet nose
on top of a 1:2 (V:H) slope and concluded that the if the nose angle increases by more than 50°
the performance of the parapet is similar to that of a vertical wall. The research also determined
that a parapet angle of 45° provides the best overtopping reduction (Van Doorslaer & De Rouck,
2011).
The Flaring Shape Seawall (FSS), a deep circular concrete section, was developed by
Kamikubo et al. (2003). The FSS crest level can be significantly lower than that of a
conventional vertical wall (Kamikubo et al., 2003). However, this large seawall has to be
constructed, using concrete shutters, as a single new structure and cannot be added to existing
vertical walls. Kortenhaus et al. (2004) stated that the FSS is difficult to construct; however,
there are now various commercial companies specialising in the design and construction of FSS
structures.
In summary, the literature review showed that, although various components of the recurve
seawall have been researched in detail to develop parameters to estimate the probable
performance of the recurve seawall, there is currently limited validation of the theoretical
parameters developed, and still no clear and extensive design approach in place for recurve
seawalls.
Therefore, this physical model study was conducted to establish the extensive design guidelines
necessary for recurve seawalls.
7.3 Wave overtopping results from this physical model study
This study highlighted the fact that the overtopping process is dependent on various parameters,
with the most important influencing parameters being wave height, freeboard and crest level,
and recurve geometry, including overhang length.
These dependencies emphasise the importance of the careful selection of design parameters
during the feasibility and fundamental design process.
Stellenbosch University https://scholar.sun.ac.za
Page 125
Conclusions 104
The impact of the variables tested on overtopping is highlighted in the following sub-sections
(7.3.1 to 7.3.7).
7.3.1 Reduction in overtopping
The reduction in wave overtopping over a recurve wall is evaluated with the k-factor, as defined
in Section 2.5.3 by Equation (2.17). As the length of the overhang increases, the trends flatten,
indicating that at a certain point the length of the overhang is no longer significant in the further
reduction of overtopping, as demonstrated in Figure 5.4.
Reference to Figure 5.3 shows that there are three recurve profiles that fail, with the 0.15 m,
0.3 m and 0.6 m overhang lengths delivering test results with a k-factor greater than one,
indicating that the recurve wall does not improve the rate of reduction of overtopping for
vertical walls, but actually makes it worse. In comparison with Figure 5.3, the magnitude of the
individual cases can be evaluated and the severity determined.
7.3.2 Influence of the length of the overhang
For all the wave periods tested with the three lowest water levels, the reduction in overtopping
increased up to a certain point, after which any increase in the length of the overhang had no
further influences. This point varies with wave period and water level. For the highest water
level (lowest freeboard level) the 0.3 m overhang did not improve the overtopping for the 0 m
or the 0.15 m overhang length, as demonstrated in Figure 5.12.
It was found that the 0.15 m overhang length, but even more so the 0.3 m overhang length, was
less effective than the vertical wall demonstrated in Figure 5.2. This occurred at the two lowest
freeboard levels, and for all wave periods. The phenomenon is discussed in Section 5.2.3, and
illustrated in Figure 5.11.
7.3.3 Sensitivity to water depth
It may be concluded that the rate of overtopping is exceedingly sensitive to any change in water
level, as illustrated in Figure 5.16. With a 16 second wave period, this was particularly
noticeable. However, the magnitude of the reduction in overtopping was different for each
overhang length.
Stellenbosch University https://scholar.sun.ac.za
Page 126
Conclusions 105
For all the overhang lengths the scenarios in which the water level was less than the wave
height, the wave period had no significant influence on the overtopping rate.
Furthermore, the recurve wall is designed to function with the design water level no higher than
the vertical section of the recurve wall, to ensure that it would not function in a submerged state.
This highlights the importance of the accurate determination of the crest level of the structure.
7.3.4 Sensitivity to wave period
The volume of water associated with shorter wavelengths is less and is cleared easily from the
wall. In some instances, with the larger wavelengths, the first wave is thrown seaward and
caught up in second wave. This superimposes the first wave on the second and a larger volume
breaches the crest.
The recurve wall profiles with 0.15, 0.3 and 0.6 m overhang lengths are also more sensitive to
wave period at higher water levels, as shown in Annexure L.
It was found during the course of this investigation that for tests with 14 and 16 second wave
periods it was difficult to control the output. This could be because the 16 second wave period
is close to the limit of what can be generated in the small flume in the hydraulics laboratory,
and the extent of the variability is unknown.
7.3.5 Influence of wave height
Due to specific and particular physical attributes of the physical model used in this study,
differences were noted in the wave height while the other variables were kept constant. A
dependency analysis was done to quantify the variance in wave height.
It was concluded that the wave height had a significant influence on the tests with the lowest
freeboard level, as the wave height determines where on the recurve wall structure the incoming
wave hits. The overtopping volume will be greater when the incoming wave hits the recurve
wall on the perpendicular face of the curve (indicated as 3 on Figure 5.20), from where the
wave is thrown upward and consequently substantial overtopping occurs.
The recurve wall is designed so that the incoming wave hits the vertical wall and/or the slanted
component of the wall (indicated as 1 and 2 on Figure 5.20).
Stellenbosch University https://scholar.sun.ac.za
Page 127
Conclusions 106
7.3.6 Repeatability and accuracy
The repeatability and accuracy were determined by repeating tests with and without the use of
the pump. The coefficient of variance (CoV) for the tests repeated with the pump was 1.36%
and for the tests without the pump 2.37%. These figures are both less than 5%, which indicates
a good repeatability factor, compared to the CLASH database, which achieved a CoV of 13%
(De Rouck et al., 2005).
7.3.7 Influence of recurve wall on Dynamic Wave Absorption (DWA)
The Dynamic Wave Absorption system (DWA) was developed to adjust the wave height
reflecting from the wave paddle, in order to generate wave heights more accurately to design
conditions.
It was known that the DWA was not as effective when applied to vertical structures, for
example, during test in Series A, with 100% reflection. The application of the DWA concept
on the recurve wall further worsened the performance. An adjustment was made to the wave
height for the recurve wall with overhang lengths longer than 1.2 m, to counteract this
phenomenon.
7.4 Comparison of previous research
7.4.1.1 Allsop et al. (2005)
The physical model results for the vertical wall (0 m overhang was compared to the results
obtained by Allsop et al. (2005), provided in Figure 5.27. The trend fitted to the dataset from
this physical model study strives to 40 (0.04 if q is m3/s/m), corresponding to the finding by
Allsop et al. (2005).
Further, the theoretical k-factor obtained by using the decision chart developed by Allsop et al.
(2005), which is provided in Figure 2.13, and which represents the reduction provided in
overtopping provided by the recurve wall, was evaluated against the calculated k-factor,
provided in Equation (7.1).
It was found that the selection of the test conditions for the investigation was such that the
theoretical k-factor did not include cases where the overtopping rate of the vertical wall had not
Stellenbosch University https://scholar.sun.ac.za
Page 128
Conclusions 107
been improved. Although there are discrepancies for different recurve wall geometries, the
theoretical k-factor over-predicts the reduction of overtopping, as illustrated in Figure 5.24.
As it was intended that Figure 5.25 should be used to give an indication of the reduction in
overtopping by the recurve wall, this would deliver a false k-factor and prediction of the
reduction in overtopping.
7.4.1.2 Schoonees (2014)
Schoonees (2014) did research on the effect that the overhang length of a recurve wall has on
the overtopping reduction. Two recurve angles were investigated, and evaluated against the
performance in overtopping reduction of a vertical wall.
This project’s dataset was designed to expand on the Schoonees’s (2014) research. Two datasets
were repeated to determine whether tests with overlapping conditions could be used, results are
provided in Table 5.6 and 5.9. Differences between the results, as found by Schoonees and
results in the present study, can be attributed to various factors, namely, the water level, crest
level and wave height.
A root mean squared analysis was performed to evaluate the correlation of dataset. The error
for the 1.2 m overhang length was lower than the error for the vertical wall. The RME for the
physical model is 0.25, compared to a 1.76 error achieved by Schoonees. This indicates that the
data series error is smaller than that found by Schoonees’s dataset. However, both the present
study and that by Schoonees had an acceptably small margin of error. The full root mean
squared method analysis is provided in Annexure M.
7.4.1.3 EurOtop online calculations
Comparing the physical model results of this study with the EurOtop database, the EurOtop
results under-predict the results for low freeboard cases. On the other hand, for higher freeboard
cases it was found that the physical model delivers low or no overtopping results. However, the
smaller overtopping rates obtained for specific combinations of parameters in the physical
model are difficult to compare with the EurOtop database as it proved quite difficult to
accurately measure small overtopping volumes.
It can therefore be concluded that the design guidelines as developed in this physical model
study provide a valuable extension of the design capabilities available for recurve seawalls.
Stellenbosch University https://scholar.sun.ac.za
Page 129
Conclusions 108
7.5 In conclusion
It was found in the physical model study that for all cases where the overhang is larger than 0.3
m, the reduction in overtopping was enhanced. Apart from its dependence on the overhang
length, the overtopping rate is also sensitive to changes in wave height and wave period, as well
as to the water level at the foot of the structure.
A recurve seawall with a parapet angle, as defined as in Section 2.5.4, that is greater than 50º
will not improve the reduction rate of overtopping when compared to the results for a vertical
wall under similar conditions.
The freeboard has been identified as the most critical parameter in determining overtopping. If
sufficient freeboard is not provided, the recurve wall will be drowned and will not provide any
reduction in overtopping. On the other hand, a combination of high freeboard and low water
levels can produce up to a 100% reduction in overtopping.
Provided below in Table 7.1 is a summary of the recommended overhang length per freeboard
level.
Table 7.1: Summary of proposed overhang lengths per freeboard level
As a result of this study, design guidelines were developed to aid the designer in the conceptual
design phase, with the wave height, wave period and tolerable overtopping rate as input
variables. With the use of the charts provided in Annexure J and the input variable, the
combination of overhang length and freeboard level is chosen. The design procedure is fully
discussed in Chapter 6.
Referring to Section 1.2 it can be seen that all the objectives have been met during the course
of this investigation.
Proposed overhang length per 𝑹𝒄
𝑹𝒄 𝑩𝒓
[m] [m]
3.5 0.15 - 0.6
3.1 0.15 - 0.9
2.5 0.3 - 1.2
2.1 0.6 - 1.5
1.7 0.9 - 1.2
Stellenbosch University https://scholar.sun.ac.za
Page 130
109
8 RECOMMENDATIONS
RECOMMENDATIONS
8.1 General
It is recommended that the results obtained in this study should be used in a step-by-step
approach as outlined in Chapter 6, for designing recurve seawalls for practical applications. It
is not recommended, at present, that the design procedure be used beyond the range of the
design conditions stipulated in Section 3.7.
In cases where a large reduction in the overtopping rate (a factor of 20 or a k < 0.05) is required,
it is recommended that physical model tests be conducted with the exact conditions needed, to
validate the design predictions.
8.2 Recommendations for further study
The recommendations for further study are discussed, after first considering the physical model
test conditions, which is followed by considering the physical model equipment.
8.2.1 Enhancing the Design Guidelines for recurve seawalls
A large range of parameters was tested during this investigation; however, additional tests are
required to understand the amplification that occurs with the 0.3 m overhang, as discussed in
Section 5.2.3. It is recommended that recurve walls with 0.2 and 0.4 m overhangs also be tested,
to assist with the refinement of the critical range in which this occurs.
Further, it is suspected that the 16 second wave period was on the boundary of allowable wave
periods achievable in the facility where the present study was conducted. Therefore, the 16
second wave period dataset should, for the moment, be used only for the preliminary design. In
order to improve the predictive capability, it is recommended that tests should be conducted in
a different facility where the scope of hydraulic parameters is such that it will be possible to
validate the overtopping results for a 16 second wave period with a more constant range of
wave heights.
CHAPTER 8
Stellenbosch University https://scholar.sun.ac.za
Page 131
Recommendations 110
Since the beach slope was kept constant for all conditions tested, it is essential that in further
experimental work the influence of beach slope on the wave height and overtopping should be
researched.
Any and all research done in line with the recommendations as listed above should be
incorporated into the currently proposed set of design guidelines (see Chapter 6) and thus, over
time, improve the accuracy of predictions and thus the design certainty, as well as expand the
applicable range of the design guidelines.
8.2.2 Physical model equipment
Further research should be conducted to quantify the interactive reflections between the recurve
wall, the piston-type wave-generating paddle, and the dynamic wave absorption in this
interactive system. This would provide insight into the effect that the recurve wall has on the
equipment and validate the adjustment made to the wave height during this research.
From observation during the tests in this physical model study, it was clear that water droplets
on the plastic sheets and recurve wall were not accounted for. For the large overtopping
volumes, this would not make any significant difference; however, for small volumes the effect,
while unknown, could potentially be more significant.
Therefore, before any further tests are conducted, it would be advisable to improve the method
of measuring small volumes of overtopping, to ensure accuracy.
On a practical note, some difficulties were experienced with the model setup during the present
study. For the recurve walls with longer overhang lengths, the structure had to be monitored
closely, as in some instances the recurve wall came loose during the test series as a result of the
substantial hydraulic forces exerted on the structure. Research should be undertaken to
investigate the forces that are exerted on these recurve walls. This would, on the one hand,
provide more insight into the interaction between units for design purposes and, on the other
offer suggestions as to how the structural stability of the model structures could be improved.
Stellenbosch University https://scholar.sun.ac.za
Page 132
111
References
REFERENCES
Allsop, N.W.H., Alderson, J.S. and Chapman, A., 2007. Defending buildings and people
against wave overtopping. Proceedings: Conference on Coastal Structures, Venice.
Allsop, W., Bruce, T., Pearson, J. & Besley, P. 2005. Wave Overtopping at Vertical and Steep
Seawalls. Proceedings of the ICE-Maritime Engineering, 158(3):103-114. Thomas Telford
Ltd.
Allsop, N.W.H., Pullen, T.A., van der Meer, J.W., Bruce, T., Schüttrumpf, H. & Kortenhaus,
A. 2008. Improvements in wave overtopping analysis: The EurOtop overtopping manual
and calculation tool. Proceedings: COPEDEC VII, Dubai, UAE, (77).
Anand, K., Sundar, V. & Sannasiraj, S. 2010. Dynamic pressures on curved front seawall
models under random waves. Journal of Hydrodynamics, Ser.B, 22(5):538-544.
Berkeley-Thorn, R. & Roberts, A. 1981. Sea Defence and Coast Protection Works: a guide to
design. Thomas Telford Ltd.
Besley, P. and Environment Agency. 1999. Overtopping of seawalls. Environment Agency,
Bristol (United Kingdom).
Bradbury, A., Allsop, N. & Stephens, R. 1988. Hydraulic performance of breakwater crown
walls. HR Wallingford, Report No. SR146.
Bruce, T., van der Meer, J., Pullen, T. and Allsop, W. (2009). Wave Overtopping at Vertical
and Steep Structures. Handbook of Coastal and Ocean Engineering, 411-439.
CIRIA, CUR & CETMEF, 2007. The Rock Manual. The use of rock in hydraulic engineering
(2nd edition). London (683), CIRIA.
Clifford, J. 1996. Advances in coastal structures and breakwaters: Proceedings: International
conference organized by the institution of civil engineers and held in London on 27-29
April 1995. (7). Thomas Telford.
Concrete Groynes. 2006. [Online]. Available at: http://www.thisbrighton.co.uk/digicanvas/
Images/UGraniteBoulders.jpg [9 August 2016].
Culture: Undercliff Walk. 2015. [Online] Available at: http://www.thisbrighton.co.uk/culture
undercliff2.htm [13 October 2015].
Cycling Along Blackpool's Seafront. 2015. [Online] Available at: http://joylovestravel.com/
[13 October 2015].
Stellenbosch University https://scholar.sun.ac.za
Page 133
Bibliography 112
De Rouck, J., Geeraerts, J., Troch, P., Kortenhaus, A., Pullen, T. & Franco, L. 2005. New results
on scale effects for wave overtopping at coastal structures. Proceedings of ICE Coastlines,
Structures & Breakwaters, 5:29-43.
Evans, Rupert. 2015. Wave Return Wall Sea Palling. [Online] Available at: https://www.flickr
.com/photos/evansriversandcoastal/4054750625 [13 October 2015].
EurOTop. 2007. Wave Overtopping of Sea Defences and Related Structures–Assessment
Manual. UK [Online] Available at: www.overtopping-manual.com. [18 March 2015].
Goda, Y. & Suzuki, T. 1976. Estimation of Incident and Reflected Waves in Random Wave
Experiments. Coastal engineering proceedings, 1(15).
Google Maps, (2014). Google Maps. [Online] Available at: https://www.google.co.za/maps/
@-34.3862413,21.4258414,3a,75y,331.83h,84.78t/data=!3m6!1e1!3m4!1s-Vl8ikNsoUrjs
8eiPM_NCg!2e0!7i13312!8i6656 [19 August 2016].
Guerrero, F. n.d. Wave Flumes Training. HR Wallingford.
Hasselmann, K., Barnett, T.P., Bouws, E., Carlson, H., Cartwright, D.E., Enke, K., Ewing, J.A.,
Gienapp, H., Hasselmann, D.E., Kruseman, P. and Meerburg, A., 1973. Measurements of
wind-wave growth and swell decay during the Joint North Sea Wave Project (JONSWAP).
Deutches Hydrographisches Institut.
Hill, P. 2014. Sandgate to Lydd via Hythe. [Online] Available at:
http://my.viewranger.com/route/details/NTUwNzM= [5 August 2016].
HR Wallingford. 2010. Flume Wave Generation System: User manual for University of
Stellenbosch.
HR Wallingford 2010. Large Flume wave absorption System: User and Technical Manual
Supplied to University of Stellenbosch.
Hughes, S.A. 1993. Physical models and laboratory techniques in coastal engineering. World
Scientific. Vicksburg, USA: Coastal Engineering Research Center.
Kamikubo, Y., Murakami, K., Irie, I., Kataoka, Y. and Takehana, N., 2003. Reduction of wave
overtopping and water spray with using flaring shaped seawall. In The Thirteenth
International Offshore and Polar Engineering Conference. International Society of
Offshore and Polar Engineers.
Kilmac construction. 2013. Arbroath Concrete Recurve Wall. [Online] Available at:
http://www.kilmac.co.uk/kilmac-construction/Case+Studies/1101/+Angus+Council+
Arbroath+Concrete+Recurve+Wall+2012/ [13 October 2015].
Kortenhaus, A., Haupt, R. and Oumeraci, H. 2002. Design aspects of vertical walls with steep
foreland slopes. In Breakwaters, Coastal Structures and Coastlines: Proceedings of the
International Conference Organized by the Institution of Civil Engineers and Held in
London, UK on 26-28 September 2001. 221. Thomas Telford.
Stellenbosch University https://scholar.sun.ac.za
Page 134
Bibliography 113
Kortenhaus, A., Pearson, J., Bruce, T. & Allsop, N.W. 2004. Influence of Parapets and Recurves
on Wave Overtopping and Wave Loading of Complex Vertical Walls. Paper presented at
Coastal Structures 2003. 363-381.
Kobe Steel Engineering, 2009. Collapse mechanism of seawalls Vol. 59, No. 2. Kobe Steel
Engineering Reports.
Kolbeco. 2012. Flared seawall in Kunigami, Okinawa. [Online]. Available at:
http://www.kobelco.co.jp/english/about_kobelco/csr/environment/2012/03.html [13
October 2015].
Lake Pontchartrain Basin Foundation. 2015. Old Beach, Bayou St John. [Online]. Available at:
http://lpbf.maps.arcgis.com/apps/MapTour/?appid=4ad38306b21d46e89dfa85ca04e
e6c 58 [13 October 2015].
Le Mehaute, B. 1976. Similitude in Coastal Engineering. Journal of the Waterways Harbors
and Coastal Engineering Division, 102(3):317-335.
Mail Online. 2014. Sea crashed over Blackpool seafront. [Online] Available at :
http://news2.onlinenigeria.com/world/329606-storms-red-alert-homeowners-told-to-
pack-their-bags-as-powerful-tidal-surge-threatens-to-overwhelm-battered-flood-
defenses-as-britain-is-hit-with-new-gales-and-heavy-rain.html [8 August 2015].
Mansard, E.P. and Funke, E.R., 1980. The measurement of incident and reflected spectra using
a least squares method. Coastal Engineering Proceedings, 1(17).
Murakami, K., Irie, I. & Kamikubo, Y. 1996. Experiments on a non-wave overtopping type of
seawall. Coastal Engineering Proceedings, 1(25).
Murakami, K., Kamikubo, Y. & Takehana, N. 2004. Hydraulic efficiencies of non-wave
overtopping type seawall installed on a mound. Paper presented at Proc. of 6th
International Conference on Hydrodynamics. 255-260.
Murakami, K., Kamikubo, Y. & Kataoka, Y. 2008. Hydraulic performances of non-wave
overtopping type seawall against sea level rise due to global warming. Paper presented at
The Eighteenth International Offshore and Polar Engineering Conference. International
Society of Offshore and Polar Engineers.
Murakami, K., Maki, D. & Takehana, N. 2011. Wave overtopping on flaring shaped seawall
under oblique incident waves. Proceeding of the Sixth International Conference, APAC.
Owen, M. & Steele, A. 1993. Effectiveness of Recurved Wave Return Walls. Report SR 261:
HR Wallingford.
Pearson, J., Bruce, T., Allsop, W. & Gironella, X. 2002. Violent Wave Overtopping-
Measurements at Large and Small Scale. Paper presented at Coastal Engineering
Conference. 2227-2238.
Stellenbosch University https://scholar.sun.ac.za
Page 135
Bibliography 114
Pullen, T., Allsop, W., Bruce, T. & Pearson, J. 2009. Field and Laboratory Measurements of
Mean Overtopping Discharges and Spatial Distributions at Vertical Seawalls. Coastal
Engineering, 56(2):121-140.
Reis, M.T., Neves, M.G. & Hedges, T. 2008. Investigating the Lengths of Scale Model Tests
to Determine Mean Wave Overtopping Discharges. Coastal Engineering Journal,
50(4):441-462.
Romano, A., Bellotti, G., Briganti, R. & Franco, L. 2014. Uncertainties in the physical
modelling of the wave overtopping over a rubble mound breakwater: the role of the seeding
number and of the test duration. Submitted to Coastal Engineering, (103):15-21.
Rossouw, J. 1989. Design waves for the South African coastline. PhD Thesis, Stellenbosch:
University Stellenbosch.
Roux, G. B. 2013. Reduction of seawall overtopping at the Strand. Masters' Thesis,
Stellenbosch: University of Stellenbosch.
Schüttrumpf, H. and Oumeraci, H. 2005. Scale and model effects in crest level design. Paper
presented at Proc. 2nd Coastal Symposium. Höfn. Iceland.
Schoonees, T. 2014. Impermeable recurve seawalls to reduce wave overtopping. Masters'
Thesis, Stellenbosch: University of Stellenbosch.
Schoonees, J. S., Lynn, B. C., le Roux, M. & Bouton, P. 2008. Development set-back line for
southern beaches of Richards Bay, Stellenbosch: WSP.
Schoonees, J. S. & Theron, A. K., 2003. Shoreline stability and sedimentation in Saldanha Bay,
Stellenbosch: CSIR.
Soltau, C., 2009. The cross-shore distribution of grain size in the longshore transport zone,
Masters' Thesis, Stellenbosch: University of Stellenbosch.
Special Formwork. 2015. Folkstone defence. [Online] Available at: http://www.formwork.co.
uk/our-projects/folkstone-sea-defence/ [13 October 2015].
Special formwork. 2015. Ilse of Wright sea defence. [Online] Available at: http://www.form
work.co.uk/our-projects/isle-of-wight-sea-defences/ [13 October 2015].
Special formwork. 2015. Lyme Regis sea defence. [Online] Available at http://www.form
work.co.uk/our-projects/lyme-regis-sea-defences/ [13 October 2015].
Stacey, A. 2009. Southwold to Kessingland via Easton Bavents and Cove hit 5 September 2009.
[Online] The Geography Department. Available at: http://www.stacey.peak-
media.co.uk/EastonBavents/EastonCovehitheSep2009/EastonCovehitheSep2009.htm [13
October 2015].
Swarzenski, P. 2014. Waves overtopping the berm. [Online] Available at: http://soundwaves.
usgs.gov/2014/04/images/Pac7OverwashCR.jpg [8 August 2015].
Stellenbosch University https://scholar.sun.ac.za
Page 136
Bibliography 115
Teign mouth seawall. 2015. [Online] Available at: http://www.dawlish.com/content/968/teign
mouthseawall-1.jpg [13 October 2015].
U.S. Army Corps of Engineers, 2001. Coastal Engineering Manual. Engineer Manual 1110-2-
1100 (in 6 volumes) ed. Washington, D.C.: U.S. Army Corps of Engineers.
Van Doorslaer, K. and De Rouck, J. 2011. Reduction on wave overtopping on a smooth dike
by means of a parapet. Coastal Engineering Proceedings, 1(32):6.
Van Gent, M., Pozueta, B., Van den Boogaard, H. & Medina, J. 2005. D42 Final Report on
Generic Prediction Method. CLASH WP8—Report, WL| Delf Hydraulics and Polytechnic
University of Valencia,
Veale, W., Suzuki, T., Verwaest, T., Trouw, K. and Mertens, T. 2012. Integrated design of
coastal protection works for Wenduine, Belgium.Coastal Engineering
Proceedings, 1(33):70.
Wallingford, H. 1999. Overtopping of Seawalls: Design and Assessment Manual. Environment
Agency Technical Report W, 178
Ward, D.L., Zhang, J., Wibner, C.G. and Cinotto, C.M., 1998. Wind effects on run-up and
overtopping of coastal structures. PhD Thesis, Texas A&M University.
Weber C. Seawall. U.S. Patent 1,971,324, filed Jul. 18, 1934, issued Aug. 21, 1934.
WML Coast, 2011. Coastal Protection Works Strand. Report submitted to PD Naidoo &
Associates for CoCT. Cape Town.
WNNR, 1983.Valsbaai: Velddataverslag Volume II: Figure (C/SEA 8219/2), Stellenbosch:
WNNR.
WSP Africa Coastal Engineers, 2012. Coastal processes setback line for the Duin & See
development between Great Brak Rriver and Glentana, Stellenbosch: WSP.
Stellenbosch University https://scholar.sun.ac.za
Page 137
116
ANNEXURES
List of Annexures
Stellenbosch University https://scholar.sun.ac.za
Page 138
1
LIST OF ANNEXURES
A Examples of recurve seawalls 2
B Flume cross section 6
C Model recurve overhang shapes 7
D Generation capacity curves for small and large flumes 10
E EurOtop online calculation tool interface 11
F Model results 12
G Schoonees (2014) recurve results 25
H Overtopping reduction 27
I K-factor per wave period per overhang length 29
J Influence of overhang length 30
K Influence of overhang length per RC 32
L Wave period sensitivity per overhang length 34
M Root Mean Squared Method 36
N Measured versus calculated k-factor per overtopping length 38
O EurOtop comparison per overhang length 40
P Reflection Analysis interface 42
Q Probe temperature influence 43
Stellenbosch University https://scholar.sun.ac.za
Page 139
2
A: Examples of recurve seawalls
Teighmouth, England (Teign mouth seawall, 2015) St Mary’s bay, United Kingdom (Hill ,2014 )
Lyme Regis Sea Defence, England (Special formwork, 2015) Isle of Wright, England (Special formwork, 2015)
Stellenbosch University https://scholar.sun.ac.za
Stellenbosch University https://scholar.sun.ac.za
Page 140
3
United Kingdom (Stacey, 2009) Arbroath, Scotland (Kilmac construction, 2013)
Blackpool, England (Cycling Along Blackpool's Seafront, 2015) Kunigami, Okinawa Japan (Kolbeco, 2012)
Stellenbosch University https://scholar.sun.ac.za
Stellenbosch University https://scholar.sun.ac.za
Page 141
4
Folkstone Harbour Sea Defence, England
(Special Formwork, 2015) United Kingdom (Stacey, 2009)
(Concrete Groynes, 2006) (Kolbeco, 2015)
Stellenbosch University https://scholar.sun.ac.za
Page 142
5
Cape Town, South Africa
(Schoonees, 2014)
Still Bay, South Africa
(Google maps, 2014)
Damaged Strand recurved walls, South
Africa (Schoonees, 2014)
Repaired Strand recurved walls,
South Africa
Stellenbosch University https://scholar.sun.ac.za
Page 143
6
B: Flume cross section
Stellenbosch University https://scholar.sun.ac.za
Stellenbosch University https://scholar.sun.ac.za
Page 144
7
C: Model recurve shapes
A: 0 mm overhang B: 7.5 mm overhang C: 15 mm overhang
17.5
17.5
17.5
17.5
7.5
7.5
17.5
17.5
15
15
20
20
20
20
50
50
50
50
200
200
200
200
200
200
76°
76°
63°
63°
Stellenbosch University https://scholar.sun.ac.za
Stellenbosch University https://scholar.sun.ac.za
Page 145
8
D: 30 mm overhang E: 45 mm overhang F: 60 mm overhang
200
200
50
50
50
50
20
20
20
20
45
45
17.5
17.5
17.5
17.5
60
60
36°
36°
27°
27°
200
200
50
50
200
200
20
200
50
20
0
17.5
17.5
30
17.5
45°
36°
20
20
Stellenbosch University https://scholar.sun.ac.za
Stellenbosch University https://scholar.sun.ac.za
Page 146
9
90
90
G: 75 mm overhang H: 90 mm overhang I: 105 mm overhang
200
200
200
200
200
200
17.5
17.5
17.5
17.5
105
105
75
75
50
50
50
50
20
20
20
20
20
20
90
90
105
105
20
20
50
50
50
50
22°
22°
18°
18°
16°
16°
17.5
17.5
17.5
17.5
17.5
17.5
Stellenbosch University https://scholar.sun.ac.za
Stellenbosch University https://scholar.sun.ac.za
Page 147
10
D: Generation capacity curves for small and large flumes
Prototype wave
periods [s]:
8
10
12
14
16
Prototype wave
periods [s]:
8
10
12
14
16
Water depth 0.8 m (same as max capacity of 1m wide
small flume)
Note: Wave operating zones are zones below
respective curves.
Water depth 1.0 m
Water depth 1.5 m
Model wave period (s)
Model through-to-crest wave height (m)
Stellenbosch University https://scholar.sun.ac.za
Stellenbosch University https://scholar.sun.ac.za
Page 148
11
E: EurOtop online overtopping rate calculation tool interface
Vertical wall
(HR Wallingford, n.d.)
Vertical wall with wave return
(HR Wallingford, n.d.)
Stellenbosch University https://scholar.sun.ac.za
Stellenbosch University https://scholar.sun.ac.za
Page 149
12
F: Model results
A 0 m Model results
Test A-1 A-6 A-11 A-16 A-21 A-2 A-7
WLpaddle m 0.445 0.465 0.495 0.515 0.535 0.445 0.465
WLtoe m 0.03 0.05 0.08 0.1 0.12 0.03 0.05
Tp s 1.789 1.789 1.789 1.789 1.789 2.236 2.236
Test duration s 1789 1789 1789 1789 1789 2236 2236
Hmo AVG mm 51.5 57.25 61.4125 64.695 66.04 52.25 60
Hi mm 44.76 48.70 50.15 51.14 50.79 45.14 50.28
Volumemeasured l 6.67 30.50 63.00 84.34 137.24 10.00 55.25
WLtoe m 0.6 1 1.6 2 2.4 0.6 1
Rc m 3.5 3.1 2.5 2.1 1.7 3.5 3.1
Tp s 8 8 8 8 8 10 10
Hmo AVG m 1.03 1.15 1.23 1.29 1.32 1.05 1.20
Hi m 0.895 0.974 1.003 1.023 1.016 0.903 1.006
Volumemeasured l 53333 244000 504000 674699 1097908 80000 442000
Overtopping rate l/s 6.67 30.50 63.00 84.34 137.24 8.00 44.20
Overtopping rate pm l/s/m 0.33 1.53 3.15 4.22 6.86 0.40 2.21
Test A-12 A-17 A-22 A-3 A-8 A-13 A-18 A-23 A-4 A-9
WLpaddle m 0.495 0.515 0.535 0.445 0.465 0.495 0.515 0.535 0.445 0.465
WLtoe m 0.08 0.1 0.12 0.03 0.05 0.08 0.1 0.12 0.03 0.05
Tp s 2.236 2.236 2.236 2.638 2.683 2.683 2.683 2.683 3.13 3.13
Test duration s 2236 2236 2236 2638 2683 2683 2683 2683 3130 3130
Hmo AVG mm 65.985 71.265 69.6825 44.5 60 68.08 69.7975 67.8475 63.25 60.3875
Hi mm 53.37 56.52 54.25 37.28 50.86 54.15 53.97 51.11 55.07 52.06
Volumemeasured l 113.77 165.72 182.39 16.67 57.50 190.68 322.38 626.91 9.33 55.67
WLtoe m 1.6 2 2.4 0.6 1 1.6 2 2.4 0.6 1
Rc m 2.5 2.1 1.7 3.5 3.1 2.5 2.1 1.7 3.5 3.1
Tp s 10 10 10 12 12 12 12 12 14 14
Hmo AVG m 1.32 1.43 1.39 0.89 1.20 1.36 1.40 1.36 1.27 1.21
Hi m 1.067 1.130 1.085 0.746 1.017 1.083 1.079 1.022 1.101 1.041
Volumemeasured l 910124 1325768 1459150 133333 460000 1525459 2579067 5015311 74667 445333
Overtopping rate l/s 91.01 132.58 145.92 11.11 38.33 127.12 214.92 417.94 5.33 31.81
Overtopping rate pm l/s/m 4.55 6.63 7.30 0.56 1.92 6.36 10.75 20.90 0.27 1.59
Stellenbosch University https://scholar.sun.ac.za
Stellenbosch University https://scholar.sun.ac.za
Page 150
13
A 0 m Model results
Test A-14 A-19-1 A-19-2 A-24 A-5 A-10 A-15 A-20-1 A-20-2 A-25
WLpaddle m 0.495 0.515 0.515 0.535 0.445 0.465 0.495 0.515 0.515 0.535
WLtoe m 0.08 0.1 0.1 0.12 0.03 0.05 0.08 0.1 0.1 0.12
Tp s 3.13 3.13 3.13 3.13 3.578 3.578 3.578 3.578 3.578 3.578
Test duration s 3130 3130 3130 3130 3578 3578 3578 3578 3578 3578
Hmo AVG mm 66.705 70.89 70.385 70.8275 59.75 61.9475 71.4825 76.1325 74.5425 78.875
Hi mm 52.65 55.01 54.77 53.59 51.75 52.32 56.72 59.33 58.09 59.71
Qmeasured l 326.78 486.27 438.19 750.59 10.67 60.30 330.45 731.43 684.01 1036.08
WLtoe m 1.6 2 2 2.4 0.6 1 1.6 2 2 2.4
Rc m 2.5 2.1 2.1 1.7 3.5 3.1 2.5 2.1 2.1 1.7
Tp s 14 14 14 14 16 16 16 16 16 16
Hmo AVG m 1.33 1.42 1.41 1.42 1.20 1.24 1.43 1.52 1.49 1.58
Hi m 1.053 1.100 1.095 1.072 1.035 1.046 1.134 1.187 1.162 1.194
Volumemeasured l 2614264 3890170 3505547 6004724 85333 482400 2643603 5851415 5472040 8288605
Overtopping rate l/s 186.73 277.87 250.40 428.91 5.33 30.15 165.23 365.71 342.00 518.04
Overtopping rate pm l/s/m 9.34 13.89 12.52 21.45 0.27 1.51 8.26 18.29 17.10 25.90
B 0.15 m Model results
Test B-1 B-6 B-11 B-16 B-21 B-2-1 B-2-2 B-7
WLpaddle m 0.445 0.465 0.495 0.515 0.535 0.445 0.445 0.465
WLtoe m 0.03 0.05 0.08 0.1 0.12 0.03 0.03 0.05
Tp s 1.789 1.789 1.789 1.789 1.789 2.236 2.236 2.236
Test duration s 1789 1789 1789 1789 1789 2236 2236 2236
Hmo AVG mm 49.5 56.5 61.4 65.1 66.0 56.5 53.2 59.8
Hi mm 42.57 48.21 50.23 51.51 50.74 47.75 44.97 50.06
Qmeasured l 2.50 23.50 53.05 84.30 102.08 6.50 8.50 38.40
WLtoe m 0.6 0.6 1 1.6 2 0.6 0.6 1
Rc m 3.5 3.5 3.1 2.5 2.1 3.5 3.5 3.1
Tp s 8 8 8 8 8 10 10 10
Hmo AVG m 0.99 1.13 1.23 1.30 1.32 1.13 1.06 1.20
Hi m 0.85 0.96 1.00 1.03 1.01 0.96 0.90 1.00
Volumemeasured l 20000 188000 424400 674400 816635 52000 68000 307200
Overtopping rate l/s 2.50 23.50 53.05 84.30 102.08 5.20 6.80 30.72
Overtopping rate pm l/s/m 0.13 1.18 2.65 4.22 5.10 0.26 0.34 1.54
0.15 m
m
Stellenbosch University https://scholar.sun.ac.za
Stellenbosch University https://scholar.sun.ac.za
Page 151
14
B 0.15 m Model results
Test B-12 B-17 B-3 B-8 B-13 B-18 B-23 B-4 B-9 B-14
WLpaddle m 0.495 0.515 0.445 0.465 0.495 0.515 0.535 0.445 0.465 0.495
WLtoe m 0.08 0.1 0.03 0.05 0.08 0.1 0.12 0.03 0.05 0.08
Tp s 2.236 2.236 2.638 2.683 2.683 2.683 2.683 3.13 3.13 3.13
Test duration s 2236 2236 2638 2683 2683 2683 2683 3130 3130 3130
Hmo AVG mm 66.4 71.0 57.1 61.4 68.1 67.7 70.3 57.4 61.4 66.8
Hi mm 53.70 56.40 48.32 51.87 54.11 52.28 53.19 50.80 52.44 52.73
Volumemeasured l 101.33 146.90 6.50 43.40 156.06 261.01 532.61 5.50 39.85 193.19
WLtoe m 1.6 2 0.6 1 1.6 2 2.4 0.6 1 1.6
Rc m 2.5 2.1 3.5 3.1 2.5 2.1 1.7 3.5 3.1 2.5
Tp s 10 10 12 12 12 12 12 14 14 14
Hmo AVG m 1.33 1.42 1.14 1.23 1.36 1.35 1.41 1.15 1.23 1.34
Hi m 1.07 1.13 0.97 1.04 1.08 1.05 1.06 1.02 1.05 1.05
Volumemeasured l 810667 1175206 52000 347200 1248489 2088072 4260895 44000 318800 1545544
Overtopping rate l/s 81.07 117.52 4.33 28.93 104.04 174.01 355.07 3.14 22.77 110.40
Overtopping rate pm l/s/m 4.05 5.88 0.22 1.45 5.20 8.70 17.75 0.16 1.14 5.52
Test B-19-1 B-19-2 B-24 B-5 B-10 B-15 B-20-1 B-20-2 B-25-1 B-25-2
WLpaddle m 0.515 0.515 0.535 0.445 0.465 0.495 0.515 0.515 0.535 0.535
WLtoe m 0.1 0.1 0.12 0.03 0.05 0.08 0.1 0.1 0.12 0.12
Tp s 3.13 3.13 3.13 3.578 3.578 3.578 3.578 3.578 3.578 3.578
Test duration s 3130 3130 3130 3578 3578 3578 3578 3578 3578 3578
Hmo AVG mm 70.9 72.2 71.4 59.5 63.3 70.2 77.2 77.9 81.9 82.1
Hi mm 55.05 56.01 54.07 51.21 53.39 55.65 59.94 60.57 62.10 62.31
Volumemeasured l 488.56 467.62 666.18 7.50 46.95 267.42 698.08 794.56 1108.07 1084.13
WLtoe m 2 2 2.4 0.6 1 1.6 2 2 2.4 2.4
Rc m 2.1 2.1 1.7 3.5 3.1 2.5 2.1 2.1 1.7 1.7
Tp s 14 14 14 16 16 16 16 16 16 16
Hmo AVG m 1.42 1.44 1.43 1.19 1.27 1.40 1.54 1.56 1.64 1.64
Hi m 1.10 1.12 1.08 1.02 1.07 1.11 1.20 1.21 1.24 1.25
Volumemeasured l 3908505 3740922 5329472 60000 375600 2139370 5584641 6356449 8864556 8673074
Overtopping rate l/s 279.18 267.21 380.68 3.75 23.48 133.71 349.04 397.28 554.03 542.07
Overtopping rate pm l/s/m 13.96 13.36 19.03 0.19 1.17 6.69 17.45 19.86 27.70 27.10
Stellenbosch University https://scholar.sun.ac.za
Stellenbosch University https://scholar.sun.ac.za
Page 152
15
C 0.3 m Model results
Test C-1 C-6 C-11 C-16 C-21-1 C-21-2 C-2
WLpaddle m 0.445 0.465 0.495 0.515 0.535 0.535 0.445
WLtoe m 0.03 0.05 0.08 0.1 0.12 0.12 0.03
Tp s 1.789 1.789 1.789 1.789 1.789 1.789 2.236
Test duration s 1789 1789 1789 1789 1789 1789 2236
Hmo AVG mm 60.4 64.2 70.1 72.8 73.7 73.5 62.5
Hi mm 51.9 54.6 57.0 57.9 57.3 57.2 52.4
Volumemeasured l 1.75 9.50 26.07 64.75 180.30 194.82 1.63
WLtoe m 0.6 1 1.6 2 2.4 2.4 0.6
Rc m 3.5 3.1 2.5 2.1 1.7 1.7 3.5
Tp s 8 8 8 8 8 8 10
Hmo AVG m 1.21 1.28 1.40 1.46 1.47 1.47 1.25
Hi m 1.04 1.09 1.14 1.16 1.15 1.14 1.05
Volumemeasured l 14000 76000 208571 518000 1442402 1558535 13000
Overtopping rate l/s 1.75 9.50 26.07 64.75 180.30 194.82 1.30
Overtopping rate pm l/s/m 0.09 0.48 1.30 3.24 9.02 9.74 0.07
Test C-7 C-12 C-17 C-22 C-3 C-8 C-13 C-18 C-23 C-4
WLpaddle m 0.465 0.495 0.515 0.535 0.445 0.465 0.495 0.515 0.535 0.445
WLtoe m 0.05 0.08 0.1 0.12 0.03 0.05 0.08 0.1 0.12 0.03
Tp s 2.236 2.236 2.236 2.236 2.638 2.683 2.683 2.683 2.683 3.13
Test duration s 2236 2236 2236 2236 2638 2683 2683 2683 2683 3130
Hmo AVG mm 69.8 74.0 77.8 82.2 65.1 70.6 76.4 76.3 75.8 65.5
Hi mm 58.3 60.0 62.3 65.0 54.2 59.0 60.6 59.5 57.8 56.3
Volumemeasured l 12.67 47.75 174.48 387.79 2.38 13.42 80.50 340.91 735.25 2.42
WLtoe m 1 1.6 2 2.4 0.6 1 1.6 2 2.4 0.6
Rc m 3.1 2.5 2.1 1.7 3.5 3.1 2.5 2.1 1.7 3.5
Tp s 10 10 10 10 12 12 12 12 12 14
Hmo AVG m 1.40 1.48 1.56 1.64 1.30 1.41 1.53 1.53 1.52 1.31
Hi m 1.17 1.20 1.25 1.30 1.08 1.18 1.21 1.19 1.16 1.13
Volumemeasured l 101333 382000 1395876 3102285 19000 107333 644000 2727289 5881971 19333
Overtopping rate l/s 10.13 38.20 139.59 310.23 1.58 8.94 53.67 227.27 490.16 1.38
Overtopping rate pm l/s/m 0.51 1.91 6.98 15.51 0.08 0.45 2.68 11.36 24.51 0.07
0.3 m
Stellenbosch University https://scholar.sun.ac.za
Stellenbosch University https://scholar.sun.ac.za
Page 153
16
C 0.3 m Model results
Test C-9 C-14 C-19 C-24 C-5 C-10 C-15 C-20 C-25-1 C-25-2
WLpaddle m 0.465 0.495 0.515 0.535 0.445 0.465 0.495 0.515 0.535 0.535
WLtoe m 0.05 0.08 0.1 0.12 0.03 0.05 0.08 0.1 0.12 0.12
Tp s 3.13 3.13 3.13 3.13 3.578 3.578 3.578 3.578 3.578 3.578
Test duration s 3130 3130 3130 3130 3578 3578 3578 3578 3578 3578
Hmo AVG mm 69.9 72.8 75.8 79.1 67.3 71.4 78.1 81.5 84.8 86.9
Hi mm 59.2 57.5 59.1 60.5 56.7 60.2 62.0 63.7 64.7 66.4
Volumemeasured l 11.44 120.95 451.69 1019.30 1.50 12.56 161.77 712.58 1323.50 1418.96
WLtoe m 1 1.6 2 2.4 0.6 1 1.6 2 2.4 2.4
Rc m 3.1 2.5 2.1 1.7 3.5 3.1 2.5 2.1 1.7 1.7
Tp s 14 14 14 14 16 16 16 16 16 16
Hmo AVG m 1.40 1.46 1.52 1.58 1.35 1.43 1.56 1.63 1.70 1.74
Hi m 1.18 1.15 1.18 1.21 1.13 1.20 1.24 1.27 1.29 1.33
Volumemeasured l 91556 967575 3613539 8154397 12000 100444 1294160 5700607 10587991 11351679
Overtopping rate l/s 6.54 69.11 258.11 582.46 0.75 6.28 80.89 356.29 661.75 709.48
Overtopping rate pm l/s/m 0.33 3.46 12.91 29.12 0.04 0.31 4.04 17.81 33.09 35.47
D 0.6 m Model results
Test D-1 D-6 D-11 D-16 D-21
WLpaddle m 0.445 0.465 0.495 0.515 0.535
WLtoe m 0.03 0.05 0.08 0.1 0.12
Tp s 1.789 1.789 1.789 1.789 1.789
Test duration s 1789 1789 1789 1789 1789
Hmo AVG mm 61.5 65.1 70.4 74.5 73.6
Hi mm 52.9 55.3 57.9 59.8 57.3
Volumemeasured l 0.00 1.90 1.60 4.75 55.04
WLtoe m 0.6 1 1.6 2 2.4
Rc m 3.5 3.1 2.5 2.1 1.7
Tp s 8 8 8 8 8
Hmo AVG m 1.23 1.30 1.41 1.49 1.47
Hi m 1.06 1.11 1.16 1.20 1.15
Volumemeasured l 0 15200 12800 38000 440308
Overtopping rate l/s 0.00 1.90 1.60 4.75 55.04
Overtopping rate pm l/s/m 0.00 0.09 0.08 0.24 2.75
0.6 m
Stellenbosch University https://scholar.sun.ac.za
Stellenbosch University https://scholar.sun.ac.za
Page 154
17
D 0.6 m Model results
Test D-3 D-8 D-13 D-18 D-23 D-4 D-9 D-14 D-19 D-24
WLpaddle m 0.445 0.465 0.495 0.515 0.535 0.445 0.465 0.495 0.515 0.535
WLtoe m 0.03 0.05 0.08 0.1 0.12 0.03 0.05 0.08 0.1 0.12
Tp s 2.638 2.683 2.683 2.683 2.683 3.13 3.13 3.13 3.13 3.13
Test duration s 2638 2683 2683 2683 2683 3130 3130 3130 3130 3130
Hmo AVG mm 65.2 73.8 77.0 77.4 79.0 68.2 72.5 75.0 78.6 80.3
Hi mm 54.3 61.5 61.1 60.5 60.5 57.6 61.2 59.0 61.1 61.6
Volumemeasured l 0.50 2.00 15.75 140.14 712.06 0.00 1.50 33.75 238.11 741.34
WLtoe m 0.6 1 1.6 2 2.4 0.6 1 1.6 2 2.4
Rc m 3.5 3.1 2.5 2.1 1.7 3.5 3.1 2.5 2.1 1.7
Tp s 12 12 12 12 12 14 14 14 14 14
Hmo AVG m 1.30 1.48 1.54 1.55 1.58 1.36 1.45 1.50 1.57 1.61
Hi m 1.09 1.23 1.22 1.21 1.21 1.15 1.22 1.18 1.22 1.23
Volumemeasured l 4000 16000 126000 1121127 5696485 0 12000 270000 1904906 5930748
Overtopping rate l/s 0.33 1.33 10.50 93.43 474.71 0.00 0.86 19.29 136.06 423.62
Overtopping rate pm l/s/m 0.02 0.07 0.53 4.67 23.74 0.00 0.04 0.96 6.80 21.18
Test D-5 D-10 D-15 D-20-1 D-20-2 D-15 D-20-1 D-20-2
WLpaddle m 0.445 0.465 0.495 0.515 0.515 0.495 0.515 0.515
WLtoe m 0.03 0.05 0.08 0.1 0.1 0.08 0.1 0.1
Tp s 3.578 3.578 3.578 3.578 3.578 3.578 3.578 3.578
Test duration s 3578 3578 3578 3578 3578 3578 3578 3578
Hmo AVG mm 69.1 71.8 78.8 85.8 85.0 78.8 85.8 85.0
Hi mm 58.4 60.5 62.4 66.7 66.1 62.4 66.7 66.1
Volumemeasured l 0.75 1.00 56.25 402.01 418.90 56.25 402.01 418.90
WLtoe m 0.6 1 1.6 2 2 1.6 2 2
Rc m 3.5 3.1 2.5 2.1 2.1 2.5 2.1 2.1
Tp s 16 16 16 16 16 16 16 16
Hmo AVG m 1.38 1.44 1.58 1.72 1.70 1.58 1.72 1.70
Hi m 1.17 1.21 1.25 1.33 1.32 1.25 1.33 1.32
Volumemeasured l 6000 8000 450000 3216113 3351200 450000 3216113 3351200
Overtopping rate l/s 0.38 0.50 28.13 201.01 209.45 28.13 201.01 209.45
Overtopping rate pm l/s/m 0.02 0.03 1.41 10.05 10.47 1.41 10.05 10.47
Stellenbosch University https://scholar.sun.ac.za
Stellenbosch University https://scholar.sun.ac.za
Page 155
18
E 0.9 m Model results
Test E-1 E-6 E-11 E-16 E-21 E-2
WLpaddle m 0.445 0.465 0.495 0.515 0.535 0.445
WLtoe m 0.03 0.05 0.08 0.1 0.12 0.03
Tp s 1.789 1.789 1.789 1.789 1.789 2.236
Test duration s 1789 1789 1789 1789 1789 2236
Hmo AVG mm 59.3 64.2 70.9 73.8 76.4 62.0
Hi mm 50.9 54.6 58.7 59.6 60.2 51.6
Volumemeasured l 0.00 0.00 0.13 6.60 35.43 0.00
WLtoe m 0.6 1 1.6 2 2.4 0.6
Rc m 3.5 3.1 2.5 2.1 1.7 3.5
Tp s 8 8 8 8 8 10
Hmo AVG m 1.19 1.28 1.42 1.48 1.53 1.24
Hi m 1.02 1.09 1.17 1.19 1.20 1.03
Volumemeasured l 0 0 1067 52800 283429 0
Overtopping rate l/s 0.00 0.00 0.13 6.60 35.43 0.00
Overtopping rate pm l/s/m 0.00 0.00 0.01 0.33 1.77 0.00
Test E-7 E-12 E-17 E-22 E-3 E-8 E-13 E-18 E-23 E-4
WLpaddle m 0.465 0.495 0.515 0.535 0.445 0.465 0.495 0.515 0.535 0.445
WLtoe m 0.05 0.08 0.1 0.12 0.03 0.05 0.08 0.1 0.12 0.03
Tp s 2.236 2.236 2.236 2.236 2.638 2.683 2.683 2.683 2.683 3.13
Test duration s 2236 2236 2236 2236 2638 2683 2683 2683 2683 3130
Hmo AVG mm 69.0 75.5 80.3 83.8 65.6 69.9 76.8 78.7 78.0 66.2
Hi mm 57.6 61.4 64.5 66.7 54.6 58.4 60.9 61.7 60.2 56.8
Volumemeasured l 0.24 2.75 23.64 176.19 0.00 0.89 8.73 99.46 472.41 0.00
WLtoe m 1 1.6 2 2.4 0.6 1 1.6 2 2.4 0.6
Rc m 3.1 2.5 2.1 1.7 3.5 3.1 2.5 2.1 1.7 3.5
Tp s 10 10 10 10 12 12 12 12 12 14
Hmo AVG m 1.38 1.51 1.61 1.68 1.31 1.40 1.54 1.57 1.56 1.32
Hi m 1.15 1.23 1.29 1.33 1.09 1.17 1.22 1.23 1.20 1.14
Volumemeasured l 1956 22000 189143 1409493 0 7111 69867 795658 3779288 0
Overtopping rate l/s 0.20 2.20 18.91 140.95 0.00 0.59 5.82 66.30 314.94 0.00
Overtopping rate pm l/s/m 0.01 0.11 0.95 7.05 0.00 0.03 0.29 3.32 15.75 0.00
0.9 m
Stellenbosch University https://scholar.sun.ac.za
Stellenbosch University https://scholar.sun.ac.za
Page 156
19
E 0.9 m Model results
Test E-9 E-14 E-19 E-24 E-5 E-10 E-15 E-20 E-25-1 E-25-2
WLpaddle m 0.465 0.495 0.515 0.535 0.445 0.465 0.495 0.515 0.535 0.535
WLtoe m 0.05 0.08 0.1 0.12 0.03 0.05 0.08 0.1 0.12 0.12
Tp s 3.13 3.13 3.13 3.13 3.578 3.578 3.578 3.578 3.578 3.578
Test duration s 3130 3130 3130 3130 3578 3578 3578 3578 3578 3578
Hmo AVG mm 70.1 76.8 80.1 82.1 67.8 72.0 78.7 85.0 89.2 89.6
Hi mm 59.2 60.5 62.6 63.4 57.2 60.4 62.3 66.1 69.0 69.1
Volumemeasured l 0.00 19.38 152.79 649.92 0.00 0.11 26.78 289.05 892.65 940.89
WLtoe m 1 1.6 2 2.4 0.6 1 1.6 2 2.4 2.4
Rc m 3.1 2.5 2.1 1.7 3.5 3.1 2.5 2.1 1.7 1.7
Tp s 14 14 14 14 16 16 16 16 16 16
Hmo AVG m 1.40 1.54 1.60 1.64 1.36 1.44 1.57 1.70 1.78 1.79
Hi m 1.18 1.21 1.25 1.27 1.14 1.21 1.25 1.32 1.38 1.38
Qmeasured l 0 155022 1222337 5199396 0 889 214222 2312417 7141210 7527134
Overtopping rate l/s 0.00 11.07 87.31 371.39 0.00 0.06 13.39 144.53 446.33 470.45
Overtopping rate pm l/s/m 0.00 0.55 4.37 18.57 0.00 0.00 0.67 7.23 22.32 23.52
F 1.2 m Model results
Test F-1 F-6 F-11 F-16 F-21
WLpaddle m 0.445 0.465 0.495 0.515 0.535
WLtoe m 0.03 0.05 0.08 0.1 0.12
Tp s 1.789 1.789 1.789 1.789 1.789
Test duration s 1789 1789 1789 1789 1789
Hmo AVG mm 52.0 57.6 63.7 65.2 65.7
Hi mm 44.5 48.8 52.4 52.2 51.4
Volumemeasured l 0.00 0.00 0.00 0.33 0.40
WLtoe m 0.6 1 1.6 2 2.4
Rc m 3.5 3.1 2.5 2.1 1.7
Tp s 8 8 8 8 8
Hmo AVG m 1.04 1.15 1.27 1.30 1.31
Hi m 0.89 0.98 1.05 1.04 1.03
Volumemeasured l 0 0 0 2667 3200
Overtopping rate l/s 0.00 0.00 0.00 0.33 0.40
Overtopping rate pm l/s/m 0.00 0.00 0.00 0.02 0.02
1.2 m
Stellenbosch University https://scholar.sun.ac.za
Stellenbosch University https://scholar.sun.ac.za
Page 157
20
F 1.2 m Model results
Test F-2 F-7 F-12 F-17-2 F-22 F-3 F-8 F-13 F-18 F-23
WLpaddle m 0.445 0.465 0.495 0.515 0.535 0.445 0.465 0.495 0.515 0.535
WLtoe m 0.03 0.05 0.08 0.1 0.12 0.03 0.05 0.08 0.1 0.12
Tp s 2.236 2.236 2.236 2.236 2.236 2.683 2.683 2.683 2.683 2.683
Test duration s 2236 2236 2236 2236 2236 2.683 2683 2683 2683 2683
Hmo AVG mm 57.2 60.4 67.4 70.2 71.4 58.9 62.6 68.6 70.2 69.2
Hi mm 48.1 50.6 54.5 56.1 56.1 51.9 52.7 54.9 54.8 52.5
Volumemeasured l 0.00 0.00 0.00 1.32 35.75 0.00 0.00 0.33 7.32 135.71
WLtoe m 0.6 1 1.6 2 2.4 0.6 1 1.6 2 2.4
Rc m 3.5 3.1 2.5 2.1 1.7 3.5 3.1 2.5 2.1 1.7
Tp s 10 10 10 10 10 12 12 12 12 12
Hmo AVG m 1.14 1.21 1.35 1.40 1.43 1.18 1.25 1.37 1.40 1.38
Hi m 0.96 1.01 1.09 1.12 1.12 1.04 1.05 1.10 1.10 1.05
Volumemeasured l 0 0 0 10571 286000 0 0 2667 58571 1085647
Overtopping rate l/s 0.00 0.00 0.00 1.06 28.60 0.00 0.00 0.22 4.88 90.47
Overtopping rate pm l/s/m 0.00 0.00 0.00 0.05 1.43 0.00 0.00 0.01 0.24 4.52
Test F-4 F-9 F-14 F-19 F-24 F-5 F-10 F-15 F-20 F-25
WLpaddle m 0.445 0.465 0.495 0.515 0.535 0.445 0.465 0.495 0.515 0.535
WLtoe m 0.03 0.05 0.08 0.1 0.12 0.03 0.05 0.08 0.1 0.12
Tp s 3.13 3.13 3.13 3.13 3.13 3.578 3.578 3.578 3.578 3.578
Test duration s 3130 3130 3130 3130 3130 3578 3578 3578 3578 3578
Hmo AVG mm 70.5 62.5 63.9 68.9 70.1 57.6 62.8 67.2 74.0 77.9
Hi mm 58.6 53.7 50.5 53.5 53.3 48.8 53.0 53.2 57.1 59.0
Volumemeasured l 0.00 0.00 0.75 18.76 199.57 0.00 0.00 2.53 48.50 282.39
WLtoe m 0.6 1 1.6 2 2.4 0.6 1 1.6 2 2.4
Rc m 3.5 3.1 2.5 2.1 1.7 3.5 3.1 2.5 2.1 1.7
Tp s 14 14 14 14 14 16 16 16 16 16
Hmo AVG m 1.41 1.25 1.28 1.38 1.40 1.15 1.26 1.34 1.48 1.56
Hi m 1.17 1.07 1.01 1.07 1.07 0.98 1.06 1.06 1.14 1.18
Volumemeasured l 0 0 6000 150095 1596578 0 0 20222 388000 2259154
Overtopping rate l/s 0.00 0.00 0.43 10.72 114.04 0.00 0.00 1.26 24.25 141.20
Overtopping rate pm l/s/m 0.00 0.00 0.02 0.54 5.70 0.00 0.00 0.06 1.21 7.06
Stellenbosch University https://scholar.sun.ac.za
Stellenbosch University https://scholar.sun.ac.za
Page 158
21
G 1.5 m Model results
Test G-1 G-6 G-11 G-16 G-21
WLpaddle m 0.445 0.465 0.495 0.515 0.535
WLtoe m 0.03 0.05 0.08 0.1 0.12
Tp s 1.789 1.789 1.789 1.789 1.789
Test duration s 1789 1789 1789 1789 1789
Hmo AVG mm 54.0 57.5 62.8 65.5 66.7
Hi mm 46.39 48.77 51.36 52.49 52.32
Volumemeasured l 0.00 0.00 0.00 0.00 1.50
WLtoe m 0.6 1 1.6 2 2.4
Rc m 3.5 3.1 2.5 2.1 1.7
Tp s 8 8 8 8 8
Hmo AVG m 1.08 1.15 1.26 1.31 1.33
Hi m 0.93 0.98 1.03 1.05 1.05
Volumemeasured l 0 0 0 0 12000
Overtopping rate l/s 0.00 0.00 0.00 0.00 1.50
Overtopping rate pm l/s/m 0.00 0.00 0.00 0.00 0.08
Test G-2 G-7 G-12 G-17 G-22 G-3 G-8 G-13 G-18 G-23
WLpaddle m 0.445 0.465 0.495 0.515 0.535 0.445 0.465 0.495 0.515 0.535
WLtoe m 0.03 0.05 0.08 0.1 0.12 0.03 0.05 0.08 0.1 0.12
Tp s 2.236 2.236 2.236 2.236 2.236 2.638 2.683 2.683 2.683 2.683
Test duration s 2236 2236 2236 2236 2236 2638 2683 2683 2683 2683
Hmo AVG mm 55.4 60.6 66.5 70.6 73.3 59.3 63.2 67.8 69.6 70.1
Hi mm 46.88 50.60 53.79 56.40 57.66 49.90 53.07 54.21 54.37 53.47
Volumemeasured l 0.00 0.00 0.00 0.20 30.25 0.00 0.00 0.25 3.44 107.99
WLtoe m 0.6 1 1.6 2 2.4 0.6 1 1.6 2 2.4
Rc m 3.5 3.1 2.5 2.1 1.7 3.5 3.1 2.5 2.1 1.7
Tp s 10 10 10 10 10 12 12 12 12 12
Hmo AVG m 1.11 1.21 1.33 1.41 1.47 1.19 1.26 1.36 1.39 1.40
Hi m 0.94 1.01 1.08 1.13 1.15 1.00 1.06 1.08 1.09 1.07
Volumemeasured l 0 0 0 1600 242000 0 0 2000 27556 863921
Overtopping rate l/s 0.00 0.00 0.00 0.16 24.20 0.00 0.00 0.17 2.30 71.99
Overtopping rate pm l/s/m 0.00 0.00 0.00 0.01 1.21 0.00 0.00 0.01 0.11 3.60
1.5 m
Stellenbosch University https://scholar.sun.ac.za
Stellenbosch University https://scholar.sun.ac.za
Page 159
22
G 1.5 m Model results
Test G-4 G-9 G-14 G-19 G-24 G-5 G-10 G-15 G-20 G-25
WLpaddle m 0.445 0.465 0.495 0.515 0.535 0.445 0.465 0.495 0.515 0.535
WLtoe m 0.03 0.05 0.08 0.1 0.12 0.03 0.05 0.08 0.1 0.12
Tp s 3.13 3.13 3.13 3.13 3.13 3.578 3.578 3.578 3.578 3.578
Test duration s 3130 3130 3130 3130 3130 3578 3578 3578 3578 3578
Hmo AVG mm 59.4 62.5 64.6 68.8 73.1 60.0 63.2 68.0 74.4 79.3
Hi mm 51.52 53.56 51.10 53.41 55.69 51.66 53.24 53.82 57.40 60.31
Volumemeasured l 0.00 0.00 0.00 13.76 204.16 0.00 0.00 1.50 36.35 312.46
WLtoe m 0.6 1 1.6 2 2.4 0.6 1 1.6 2 2.4
Rc m 3.5 3.1 2.5 2.1 1.7 3.5 3.1 2.5 2.1 1.7
Tp s 14 14 14 14 14 16 16 16 16 16
Hmo AVG m 1.19 1.25 1.29 1.38 1.46 1.20 1.26 1.36 1.49 1.59
Hi m 1.03 1.07 1.02 1.07 1.11 1.03 1.06 1.08 1.15 1.21
Volumemeasured l 0 0 0 110044 1633255 0 0 12000 290800 2499642
Overtopping rate l/s 0.00 0.00 0.00 7.86 116.66 0.00 0.00 0.75 18.18 156.23
Overtopping rate pm l/s/m 0.00 0.00 0.00 0.39 5.83 0.00 0.00 0.04 0.91 7.81
H 1.8 m Model results
Test H-1 H-6 H-11 H-16-2 H-21-2
WLpaddle m 0.445 0.465 0.495 0.515 0.535
WLtoe m 0.03 0.05 0.08 0.1 0.12
Tp s 1.789 1.789 1.789 1.789 1.789
Test duration s 1789 1789 1789 1789 1789
Hmo AVG mm 54.2 60.4 64.2 70.3 67.8
Hi mm 46.56 51.75 52.98 56.50 53.81
Volumemeasured l 0.00 0.00 0.00 0.00 1.15 0 0 0
WLtoe m 0.6 1 1.6 2 2.4
Rc m 3.5 3.1 2.5 2.1 1.7
Tp s 16 16 16 16 16
Hmo AVG m 1.08 1.21 1.28 1.41 1.36
Hi m 0.93 1.04 1.06 1.13 1.08
Volumemeasured l 0 0 0 0 9200
Overtopping rate l/s 0.00 0.00 0.00 0.00 1.15
Overtopping rate pm l/s/m 0.00 0.00 0.00 0.00 0.06
1.8 m
Stellenbosch University https://scholar.sun.ac.za
Stellenbosch University https://scholar.sun.ac.za
Page 160
23
H 1.8 m Model results
Test H-2 H-7 H-12 H-17-2 H-22-2 H-3 H-8 H-13 H-18-2 H-23-2
WLpaddle m 0.445 0.465 0.495 0.515 0.535 0.445 0.465 0.495 0.515 0.535
WLtoe m 0.03 0.05 0.08 0.1 0.12 0.03 0.05 0.08 0.1 0.12
Tp s 2.236 2.236 2.236 2.236 2.236 2.638 2.683 2.683 2.683 2.683
Test duration s 2236 2236 2236 2236 2236 2638 2683 2683 2683 2683
Hmo AVG mm 58.3 62.8 69.3 74.8 75.2 53.5 64.9 70.3 73.2 72.3
Hi mm 49.03 52.58 56.22 59.87 59.38 45.02 54.54 56.08 57.38 55.60
Volumemeasured l 0.00 0.00 0.00 0.25 23.43 0.00 0.00 0.50 6.83 101.89
WLtoe m 0.6 1 1.6 2 2.4 0.6 1 1.6 2 2.4
Rc m 3.5 3.1 2.5 2.1 1.7 3.5 3.1 2.5 2.1 1.7
Tp s 10 10 10 10 10 12 12 12 12 12
Hmo AVG m 1.17 1.26 1.39 1.50 1.50 1.07 1.30 1.41 1.46 1.45
Hi m 0.98 1.05 1.12 1.20 1.19 0.90 1.09 1.12 1.15 1.11
Volumemeasured l 0 0 0 2000 187429 0 0 4000 54667 815083
Overtopping rate l/s 0.00 0.00 0.00 0.12 18.74 0.00 0.00 0.33 4.56 67.92
Overtopping rate pm l/s/m 0.00 0.00 0.00 0.01 0.94 0.00 0.00 0.02 0.23 3.40
Test H-4 H-9 H-14 H-19-2 H-24-2 H-5 H-10 H-15 H-20-2 H-25-2
WLpaddle m 0.445 0.465 0.495 0.515 0.535 0.445 0.465 0.495 0.515 0.535
WLtoe m 0.03 0.05 0.08 0.1 0.12 0.03 0.05 0.08 0.1 0.12
Tp s 3.13 3.13 3.13 3.13 3.13 3.578 3.578 3.578 3.578 3.578
Test duration s 3130 3130 3130 3130 3130 3578 3578 3578 3578 3578
Hmo AVG mm 61.0 63.7 68.3 73.6 74.5 62.6 66.7 73.0 79.0 80.4
Hi mm 52.78 54.21 55.71 57.42 57.43 52.79 56.16 57.68 61.24 61.76
Volumemeasured l 0.00 0.00 0.50 14.25 173.76 0.00 0.00 1.75 35.60 268.85
WLtoe m 0.6 1 1.6 2 2.4 0.6 1 1.6 2 2.4
Rc m 3.5 3.1 2.5 2.1 1.7 3.5 3.1 2.5 2.1 1.7
Tp s 14 14 14 14 14 16 16 16 16 16
Hmo AVG m 1.22 1.27 1.37 1.47 1.49 1.25 1.33 1.46 1.58 1.61
Hi m 1.06 1.08 1.11 1.15 1.15 1.06 1.12 1.15 1.22 1.24
Volumemeasured l 0 0 4000 114000 1390104 0 0 14000 284800 2150796
Overtopping rate l/s 0.00 0.00 0.29 8.14 99.29 0.00 0.00 0.88 17.80 134.42
Overtopping rate pm l/s/m 0.00 0.00 0.01 0.41 4.96 0.00 0.00 0.04 0.89 6.72
Stellenbosch University https://scholar.sun.ac.za
Stellenbosch University https://scholar.sun.ac.za
Page 161
24
I 2.1 m Model results
Test I-1 I-6 I-2 I-7 I-3 I-8
WLpaddle m 0.515 0.535 0.515 0.535 0.515 0.535
WLtoe m 0.1 0.12 0.1 0.12 0.1 0.12
Tp s 1.789 1.789 2.236 2.236 2.683 2.683
Test duration s 1789 1789 2236 2236 2683 2683
Hmo AVG mm 70.7 71.9 75.8 78.4 74.4 74.7
Hi mm 56.83 57.26 60.84 62.08 58.54 58.14
Volumemeasured l 0.00 1.00 0.33 29.00 6.06 97.31
WLtoe m 2 2.4 2 2.4 2 2.4
Rc m 2.1 1.7 2.1 1.7 2.1 1.7
Tp s 8 8 10 10 12 12
Hmo AVG m 1.41 1.44 1.52 1.57 1.49 1.49
Hi m 1.14 1.15 1.22 1.24 1.17 1.16
Volumemeasured l 0 8000 2667 232000 48444 778492
Overtopping rate l/s 0.00 1.00 0.27 23.20 4.04 64.87
Overtopping rate pm l/s/m 0.00 0.05 0.01 1.16 0.20 3.24
Test I-4 I-9 I-5-1 I-5-2 I-10
WLpaddle m 0.515 0.535 0.515 0.515 0.535
WLtoe m 0.1 0.12 0.1 0.1 0.12
Tp s 3.13 3.13 3.578 3.578 3.578
Test duration s 3130 3130 3578 3578 3578
Hmo AVG mm 72.9 75.9 78.9 78.8 82.7
Hi mm 56.85 58.56 61.09 60.98 63.70
Volumemeasured l 10.78 174.86 55.00 53.75 294.92
WLtoe m 2 2.4 2 2 2.4
Rc m 2.1 1.7 2.1 2.1 1.7
Tp s 14 14 16 16 16
Hmo AVG m 1.46 1.52 1.58 1.58 1.65
Hi m 1.14 1.17 1.22 1.22 1.27
Volumemeasured l 86222 1398871 440000 430000 2359327
Overtopping rate l/s 6.16 99.92 27.50 26.88 147.46
Overtopping rate pm l/s/m 0.31 5.00 1.38 1.34 7.37
2.1 m
Stellenbosch University https://scholar.sun.ac.za
Stellenbosch University https://scholar.sun.ac.za
Page 162
25
G: Schoonees(2014) recurve results
B Recurve with 30 mm overhang
Test number B-4 B-3 B-2 B-6 B-7 B-1 B-5 B-5_2 B-5_3 B-5_4 B-8 B-9 B-10
PR
OT
OT
YP
E
ME
AS
UR
ED
Water level m 9 9.4 10 10 10 10.4 10.4 10.4 10.4 10.4 10.8 10.8 10.8
Water depth at toe m 0.6 1 1.6 1.6 1.6 2 2 2 2 2 2.4 2.4 2.4
Freeboard Rc m 3.4 3 2.4 2.4 2.4 2 2 2 2 2 1.6 1.6 1.6
Wave period s 10 10 10 10 10 10 10 10 10 10 10 10 10
Duration of wave attack s 10000 10000 10000 10000 10000 10000 10000 10000 10000 10000 10000 10000 10000
Hs probes m 1.195 1.288 1.273 1.242 1.223 1.268 1.223 1.213 1.227 1.210 1.165 1.162 1.145
Overtopping l/s per m 0.00004 0.02 0.4136 0.4224 0.312 4.4632 3.763 3.650 3.178 4.059 10.769 12.12 11.526
CL
AS
H
Probabilistic l/s per m 0.065 0.126 0.461 0.417 0.389 0.694 0.586 0.566 0.607 0.566 11.697 11.42 10.877
Deterministic l/s per m 0.091 0.177 0.861 0.778 0.727 1.295 1.094 1.057 1.133 1.057 21.835 21.318 20.304
MO
DE
L
ME
AS
UR
ED
Water level m 0.45 0.47 0.5 0.5 0.5 0.52 0.52 0.52 0.52 0.52 0.54 0.54 0.54
Water depth at toe m 0.03 0.05 0.08 0.08 0.08 0.1 0.1 0.1 0.1 0.1 0.12 0.12 0.12
Freeboard Rc m 0.17 0.15 0.12 0.12 0.12 0.1 0.1 0.1 0.1 0.1 0.08 0.08 0.08
Wave period s 2.236 2.236 2.236 2.236 2.236 2.236 2.236 2.236 2.236 2.236 2.236 2.236 2.236
Duration of wave attack s 2236 2236 2236 2236 2236 2236 2236 2236 2236 2236 2236 2236 2236
Hs (generator) m 0.05 0.05 0.05 0.05 0.05 0.05 0.05 0.05 0.05 0.05 0.05 0.05 0.05
Hs (probes) m 0.060 0.064 0.064 0.062 0.061 0.063 0.061 0.061 0.061 0.061 0.058 0.058 0.057
Overtopping l 0.001 0.5 10.34 10.56 7.8 111.58 94.08 91.26 79.44 101.48 269.22 303 288.14
Stellenbosch University https://scholar.sun.ac.za
Stellenbosch University https://scholar.sun.ac.za
Page 163
26
C Recurve with 60 mm overhang Test number C-5 C-4 C-1 C-2 C-3 C-6 C-7 C-8 C-9 C-10 C-11 C-12
PR
OT
OT
YP
E
ME
AS
UR
ED
Water level m 9 9.4 10 10 10 10.4 10.4 10.4 10.4 10.8 10.8 10.8
Water depth at toe m 0.6 1 1.6 1.6 1.6 2 2 2 2 2.4 2.4 2.4
Freeboard Rc m 3.4 3 2.4 2.4 2.4 2 2 2 2 1.6 1.6 1.6
Wave period s 10 10 10 10 10 10 10 10 10 10 10 10
Duration of wave attack s 10000 10000 10000 10000 10000 10000 10000 10000 10000 10000 10000 10000
Hs probes m 1.20024 1.3236 1.21615 1.20741 1.29462 1.254 1.25827 1.27242 1.28059 1.1846 1.17751 1.19335
Overtopping l/s per m 1.148 0.0488 0.0632 0.0952 0.1096 1.1992 0.8264 1.3752 0.784 6.1744 5.64 6.5816
CL
AS
H
Probabilistic l/s per m 1.335 0.126 0.389 0.376 0.492 0.649 0.671 0.694 0.717 2.197 2.197 2.277
Deterministic l/s per m 1.879 0.177 0.727 0.702 0.919 1.212 1.253 1.295 1.339 4.1 4.1 4.251
MO
DE
L
ME
AS
UR
ED
Water level m 0.45 0.47 0.5 0.5 0.5 0.52 0.52 0.52 0.52 0.54 0.54 0.54
Water depth at toe m 0.03 0.05 0.08 0.08 0.08 0.1 0.1 0.1 0.1 0.12 0.12 0.12
Freeboard Rc m 0.17 0.15 0.12 0.12 0.12 0.1 0.1 0.1 0.1 0.08 0.08 0.08
Wave period s 2.236 2.236 2.236 2.236 2.236 2.236 2.236 2.236 2.236 2.236 2.236 2.236
Duration of wave attack s 2236 2236 2236 2236 2236 2236 2236 2236 2236 2236 2236 2236
Hs (generator) m 0.05 0.05 0.05 0.05 0.05 0.05 0.05 0.05 0.05 0.05 0.05 0.05
Hs (probes) m 0.060 0.066 0.061 0.060 0.065 0.063 0.063 0.064 0.064 0.059 0.059 0.060
Overtopping l 28.7 1.22 1.58 2.38 2.74 29.98 20.66 34.38 19.6 154.36 141 164.54
Stellenbosch University https://scholar.sun.ac.za
Stellenbosch University https://scholar.sun.ac.za
Page 164
27
H: Overtopping reduction
0
0.5
1
1.5
2
2.5
1.0 1.5 2.0 2.5 3.0 3.5
k-f
act
or
Rc/Hmo
Reduction of overtopping: 30mm
0
0.5
1
1.5
2
2.5
1.0 1.5 2.0 2.5 3.0 3.5
k-f
act
or
Rc/Hmo
Reduction of overtopping: 45 mm
0
0.5
1
1.5
2
2.5
1.0 1.5 2.0 2.5 3.0 3.5 4.0 4.5
k-f
act
or
Rc/Hmo
Reduction of overtopping: 7.5 mm
0
0.5
1
1.5
2
2.5
1.0 1.5 2.0 2.5 3.0 3.5
k-f
act
or
Rc/Hmo
Reduction of overtopping: 15 mm
Stellenbosch University https://scholar.sun.ac.za
Stellenbosch University https://scholar.sun.ac.za
Page 165
28
0
0.2
0.4
0.6
0.8
1
1.2
1.0 1.5 2.0 2.5 3.0 3.5 4.0
k-f
act
or
Rc/Hmo
Reduction of overtopping: 60 mm
0
0.5
1
1.5
2
2.5
1.0 1.5 2.0 2.5 3.0 3.5 4.0
k-f
act
or
Rc/Hmo
Reduction of overtopping: 75 mm
0
0.2
0.4
0.6
0.8
1
1.2
1.0 1.5 2.0 2.5 3.0 3.5 4.0
k-f
act
or
Rc/Hmo
Reduction of overtopping: 90 mm
0
0.5
1
1.5
2
2.5
1.0 1.2 1.4 1.6 1.8 2.0
k-f
act
or
Rc/Hmo
Reduction of overtopping: 105 mm
Stellenbosch University https://scholar.sun.ac.za
Stellenbosch University https://scholar.sun.ac.za
Page 166
29
I: K-factor per wave period
Wave period (s)
8 10
Freeboard water level (m) Freeboard water level (m)
Over
ha
ng l
ength
(m
)
1.7 2.1 2.5 3.1 3.5 1.7 2.1 2.5 3.1 3.5
0.15 0.375 0.770 0.842 1.000 0.744 0 0 0.75 0.695 0.891
0.3 0.263 0.311 0.414 0.768 1.367 0.163 0.229 0.420 1.053 2.126
0.6 0 0.062 0.025 0.056 0.401 0.0001 0.009 0.084 0.577 1.572
0.9 0 0 0.002 0.078 0.258 0 0.004 0.024 0.143 0.966
12 0 0 0 0.004 0.003 0 0 0 0.008 0.196
1.5 0 0 0 0 0.011 0 0 0 0.001 0.166
1.8 0 0 0 0 0.003 0 0 0 0.002 0.128
2.1 0 0 0 0 0.007 0 0 0 0.002 0.159
12 14 Freeboard water level (m) Freeboard water level (m)
Over
han
g l
ength
(m
)
1.7 2.1 2.5 3.1 3.5 1.7 2.1 2.5 3.1 3.5
0.15 0.886 1.044 0.39 0.755 0.818 0.810 0.850 0.589 0.716 0.591
0.3 0.143 0.233 0.422 1.057 1.173 0.259 0.206 0.370 0.977 1.358
0.6 0.03 0.035 0.083 0.435 1.136 0 0.027 0.103 0.515 0.988
0.9 0 0.015 0.046 0.309 0.754 0 0 0.059 0.331 0.866
12 0 0 0.002 0.023 0.216 0 0 0.002 0.041 0.266
1.5 0 0 0.001 0.011 0.172 0 0 0 0.030 0.272
1.8 0 0 0.003 0.021 0.163 0 0 0.002 0.031 0.232
2.1 0 0 0 0.032 0.302 0 0 0 0.023 0.233
16
Freeboard water level (m)
Over
han
g l
ength
(m
)
1.7 2.1 2.5 3.1 3.5
0.15 0 0 1.034 0.888 0.703
0.3 0.141 0.208 0.490 1.007 1.323
0.6 0.070 0.017 0.170 0.580 0.977
0.9 0 0.002 0.081 0.408 0.885
12 0 0 0.008 0.069 0.273
1.5 0 0 0.005 0.051 0.302
1.8 0 0 0.005 0.050 0.259
2.1 0 0 0 0.077 0.285
Stellenbosch University https://scholar.sun.ac.za
Page 167
30
J: Influence of overhang length
0.000
0.002
0.004
0.006
0.008
0 0.5 1 1.5 2
q/(
g H
mo
3)0
.5
Br/Hmo
Influence of overhang length: Tp of 10 s
3.5 m 3.1 m 2.5 m 2.1 m 1.7 mRc
0.000
0.002
0.004
0.006
0.008
0 0.5 1 1.5 2
q/(
g H
mo
3)0
.5
Br/Hmo
Influence of overhang length: Tp of 12 s
3.5 m 3.1 m 2.5 m 2.1 m 1.7 mRc
0.000
0.002
0.004
0.006
0.008
0 0.5 1 1.5 2
q/(
g H
mo
3)0
.5
Br/Hmo
Influence of overhang length: Tp of 8 s
3.5 m 3.1 m 2.5 m 2.1 m 1.7 mRc
Stellenbosch University https://scholar.sun.ac.za
Page 168
31
0.000
0.002
0.004
0.006
0.008
0 0.5 1 1.5 2
q/(
g H
mo
3)0
.5
Br/Hmo
Influence of overhang length: Tp of 16 s
3.5 m 3.1 m 2.5 m 2.1 m 1.7 mRc
0.000
0.002
0.004
0.006
0.008
0 0.5 1 1.5 2
q/(
g H
mo
3)
0.5
Br/Hmo
Influence of overhang length: Tp of 14 s
3.5 m 3.1 m 2.5 m 2.1 m 1.7 mRc
Stellenbosch University https://scholar.sun.ac.za
Page 169
32
K: Influence of overhang length per Rc
0
10
20
30
40
0 0.5 1 1.5 2
Over
top
pin
g r
ate
[l/
s/m
]
Br/Hmo
Influence of overhang length: Rc of 2.5 m
8 s 10 s 12 s 14 s 16 sTp
0
2
4
6
8
10
0 0.5 1 1.5 2Over
top
pin
g r
ate
[l/
s/m
]
Br/Hmo
Influence of overhang length: Rc of 3.1 m
8 s 10 s 12 s 14 s 16 sTp
0.0
0.5
1.0
1.5
2.0
2.5
0 0.5 1 1.5 2Over
top
pin
g r
ate
[l/
s/m
]
Br/Hmo
Influence of overhang length: Rc of 3.5 m
8 s 10 s 12 s 14 s 16sTp
Stellenbosch University https://scholar.sun.ac.za
Page 170
33
0
10
20
30
40
0 0.5 1 1.5 2Over
top
pin
g r
ate
[l/
s/m
]
Br/Hmo
Influence of overhang length: Rc of 2.1 m
8 s 10 s 12 s 14 s 16 sTp
0
10
20
30
40
0 0.5 1 1.5 2Over
top
pin
g r
ate
[l/
s/m
]
Br/Hmo
Influence of overhang length: Rc of 1.7 m
8 s 10 s 12 s 14 s 16 sTp
Stellenbosch University https://scholar.sun.ac.za
Page 171
34
L: Wave period sensitivity per overhang length
0
10
20
30
40
8 10 12 14 16
Over
top
pin
g r
ate
(l/
s/m
)
Tp (s)
Wave period sensitivity of 0 m overhang
0.6 m 1 m 1.6 m 2 m 2.4 m𝑾𝑳𝒕𝒐𝒆
0
10
20
30
40
8 10 12 14 16
Over
top
pin
g r
ate
(l/
s/m
)
Tp (s)
Wave period sensitivity 0.15 m overhang
0.6 m 1 m 1.6 m 2 m 2.4 m𝑾𝑳𝒕𝒐𝒆
0
10
20
30
40
8 10 12 14 16
Over
top
pin
g r
ate
(l/
s/m
)
Tp (s)
Wave period sensitivity 0.3 m overhang
0.6 m 1 m 1.6 m 2 m 2.4 m𝑾𝑳𝒕𝒐𝒆
0
10
20
30
40
8 10 12 14 16
Over
top
pin
g r
ate
(l/
s/m
)
Tp (s)
Wave period sensitivity on 0.6 m overhang
0.6 m 1 m 1.6 m 2 m 2.4 m𝑾𝑳𝒕𝒐𝒆
Stellenbosch University https://scholar.sun.ac.za
Stellenbosch University https://scholar.sun.ac.za
Page 172
35
0
5
10
15
20
25
8 10 12 14 16
Over
top
pin
g r
ate
(l/
s/m
)
Tp (s)
Wave period sensitivity of 0.9 m overhang
0.6 m 1 m 1.6 m 2 m 2.4 m𝑾𝑳𝒕𝒐𝒆
0
5
10
15
20
25
8 10 12 14 16
Over
top
pin
g r
ate
(l/
s/m
)
Tp (s)
Wave period sensitivity on 1.2 m overhang
0.6 m 1 m 1.6 m 2 m 2.4 m𝑾𝑳𝒕𝒐𝒆
0
5
10
15
20
25
8 10 12 14 16
Over
top
pin
g r
ate
(l/
s/m
)
Tp (s)
Wave period sensitivity on 1.5 m overhang
0.6 m 1 m 1.6 m 2 m 2.4 m𝑾𝑳𝒕𝒐𝒆
0
5
10
15
20
25
8 10 12 14 16
Over
top
pin
g r
ate
(l/
s/m
)Tp (s)
Wave period sensitivity on 1.8 m overhang
0.6 m 1 m 1.6 m 2 m 2.4 m𝑾𝑳𝒕𝒐𝒆
Stellenbosch University https://scholar.sun.ac.za
Stellenbosch University https://scholar.sun.ac.za
Page 173
36
M: Analysing the accuracy of results using the Root Mean Squared Method
To further investigate the variability between the physical model tests and the EurOtop dataset
the Root Mean Squared (RMS) method is used.
The physic model results are compared to the corresponding probabilistic EurOtop data
overtopping rate as shown below.
Extract Series F: 1.2 m overhang length
Test number F-2 F-7 F-12 F-17 F-22
Water depth at toe m 0.6 1 1.6 2 2.4 Freeboard m 3.5 3.1 2.5 2.1 1.7 Wave period s 10 10 10 10 10
Hs (probes) m 0.96 1.01 1.09 1.12 1.12
Overtopping rate l/s/m 0.00 0.00 0.00 0.05 1.43
Probabilistic l/s/m 0.044 0.08 0.214 0.352 1.02
Deterministic l/s/m 0.082 0.149 0.399 0.657 1.905
Root Mean Square 0.002 0.006 0.046 0.090 0.170 0.25
The delivers a Root Square Error (RME) of 0.25. Similarly, Schoonees (2014) dataset is
compared with the same method. These test were conducted under similar conditions, as
discussed in Section 2.5.7.
Schoonees (2014) 1.2 m overhang length
Test number C-5 C-4 AVGC1-3 AVGC6-9 AVGC10-12
Water depth at toe m 0.6 1 1.6 2 2.4 Freeboard m 3.4 3 2.4 2 1.6 Wave period s 10 10 10 10 10 Hs (probes) m 1.200 1.324 1.239 1.266 1.185 Overtopping rate l/s/m 0 0.049 0.0893 1.046 6.132 Probabilistic l/s/m 0.08 0.126 0.419 0.688 2.224 Deterministic l/s/m 0.11 0.177 0.783 1.275 4.150 Root Mean Square 0.006 0.006 0.109 0.132 15.28 1.76
Stellenbosch University https://scholar.sun.ac.za
Page 174
37
A higher RME is achieved by Schoonees (2014), however the RME is still low indicating a
small error. The same process is followed for the vertical wall (0 m overhang).
Extract Series A: vertical wall (0 m overhang length)
Test number A-2 A-7 A-12 A-17 A-22
Water depth at toe m 0.6 1 1.6 2 2.4 Freeboard m 3.5 3.1 2.5 2.1 1.7 Wave period s 10 10 10 10 10
Hs (probes) m 0.903 1.006 1.067 1.130 1.085
Overtopping rate l/s/m 0.40 2.21 4.55 6.63 7.30
Probabilistic l/s/m 0.47 2.18 3.91 7.31 10.44
Deterministic l/s/m 0.661 4.065 7.298 13.637 19.483
Root Mean Square 0.00476 0.00102 0.4104 0.45854 9.87373 1.47
Schoonees (2014) vertical wall (0 m overhang)
Test number AVG A6-7 AVGA4-5 AVGA2-3 A-1 AVGA8-10
Water depth at toe m 0.6 1 1.6 2.0 2.4 Freeboard m 3.4 3 2.4 2.0 1.6 Wave period s 10 10 10 10.0 10 Hs (probes) m 1.203 1.254 1.261 1.191 1.174 Overtopping rate l/s/m 1.2 5.1 12.5 18.2 18.2 Probabilistic l/s/m 1.354 4.164 8.899 10.56 17.721 Deterministic l/s/m 1.906 7.238 16.946 19.71 33.079 Root Mean Square 0.04 0.901 13.008 58.22 0.224 3.80
The vertical wall for the physical model tests as well as for Schoonees (2014) provides a larger
RME, however still indicates a small error between the two datasets. As the EurOtop is based
on results conducted in a large variety of conditions.
Stellenbosch University https://scholar.sun.ac.za
Page 175
38
N: Measured versus calculated k-factor per overhang length
0
0.5
1
1.5
2
2.5
0 1 2 3 4 5
k-f
act
or
Rc/Hmo
K measured vs calculated 0.3m
Calculated k-factor Measured k-factor
0
0.5
1
1.5
2
2.5
0 1 2 3 4 5
k-f
act
or
Rc/Hmo
K measured vs calculated 0.6m
Calculated k-factor Measured k-factor
0
0.5
1
1.5
2
2.5
0 1 2 3 4 5
k-f
act
or
Rc/Hmo
K measured vs calculated 0.9m
Calculated k-factor Measured k-factor
0
0.5
1
1.5
2
2.5
0 1 2 3 4 5
k-f
act
or
Rc/Hmo
K measured vs calculated 0.15 m
Calculated k-factor Measured K-factor
Stellenbosch University https://scholar.sun.ac.za
Stellenbosch University https://scholar.sun.ac.za
Page 176
39
0
0.5
1
1.5
0 1 2 3 4 5
k-f
act
or
Rc/Hmo
K measured vs calculated 1.5 m
Calculated k-factor Measured k-factor
0
0.5
1
1.5
0 1 2 3 4 5
k-f
act
or
Rc/Hmo
K measured vs calculated 1.2 m
Calculated k-factor Measured k-factor
0
0.5
1
1.5
2
2.5
0 1 2 3 4 5
k-f
act
or
Rc/Hmo
K measured vs calculated 1.8 m
Calculated k-factor Measured k-factor
Stellenbosch University https://scholar.sun.ac.za
Stellenbosch University https://scholar.sun.ac.za
Page 177
40
O: EurOtop comparison per overhang length
0.001
0.010
0.100
1.000
10.000
100.000
1.0 1.5 2.0 2.5 3.0 3.5
q/(
g H
mo
3)0
.5
RC/Hmo
EurOtop comparison 0.3 m overhang
Measured data Probabilistic Deterministic
0.0001
0.0010
0.0100
0.1000
1.0000
10.0000
100.0000
0.0 1.0 2.0 3.0 4.0
q/(
g H
mo
3)0
.5
RC/Hmo
EurOtop comparison 0.6 m overhang
Measured data Probabilistic Deterministic
0.01
0.10
1.00
10.00
100.00
0.0 1.0 2.0 3.0 4.0 5.0
q/(
g H
mo
3)0
.5
RC/Hmo
EurOtop comparison 0 m overhang
Measured data Probabilistic Deterministic
0.01
0.10
1.00
10.00
100.00
0.0 1.0 2.0 3.0 4.0 5.0
q/(
g H
mo
3)0
.5
RC/Hmo
EurOtop comparison 0.15 m overhang
Measured data Probabilistic Deterministic
Stellenbosch University https://scholar.sun.ac.za
Stellenbosch University https://scholar.sun.ac.za
Page 178
41
0.001
0.010
0.100
1.000
10.000
100.000
0.0 1.0 2.0 3.0 4.0
q/(
g H
mo
3)0
.5
RC/Hmo
EurOtop comparison 1.2 m overhang
Measured data Probabilistic Deterministic
0.001
0.010
0.100
1.000
10.000
100.000
0.0 1.0 2.0 3.0 4.0
q/(
g H
mo
3)0
.5
RC/Hmo
EurOtop comparison 1.5 m overhang
Measured data Probabilistic Deterministic
0.001
0.010
0.100
1.000
10.000
0.0 1.0 2.0 3.0 4.0
q/(
g H
mo
3)0
.5
RC/Hmo
EurOtop comparison 2.1 m overhang
Measured data Probabilistic Deterministic
0.001
0.010
0.100
1.000
10.000
100.000
0.0 1.0 2.0 3.0 4.0
q/(
g H
mo
3)0
.5
RC/Hmo
EurOtop comparison 1.8 m overhang
Measured data Probabilistic Deterministic
Stellenbosch University https://scholar.sun.ac.za
Stellenbosch University https://scholar.sun.ac.za
Page 179
42
P: Reflection Analysis interface
Stellenbosch University https://scholar.sun.ac.za
Page 180
43
P: Probe temperature influence
Stellenbosch University https://scholar.sun.ac.za
Stellenbosch University https://scholar.sun.ac.za