ROZA LEIKIN, MARK LEIKIN, ILANA WAISMAN and SHELLEY SHAUL EFFECT OF THE PRESENCE OF EXTERNAL REPRESENTATIONS ON ACCURACY AND REACTION TIME IN SOLVING MATHEMATICAL DOUBLE-CHOICE PROBLEMS BY STUDENTS OF DIFFERENT LEVELS OF INSTRUCTION Received: 8 June 2011; Accepted: 30 November 2012 ABSTRACT. This study explores the effects of the presence of external representations of a mathematical object (ERs) on problem solving performance associated with short double- choice problems. The problems were borrowed from secondary school algebra and geometry, and the ERs were either formulas, graphs of functions, or drawings of geometric figures. Performance was evaluated according to the reaction time (RT) required for solving the problem and the accuracy of the answer. Thirty high school students studying at high and regular levels of instruction in mathematics (HL and RL) were asked to solve half of the problems with ERs and half of the problems without ERs. Each task was solved by half of the students with ERs and by half of the students without ERs. We found main effects of the representation mode with particular effect on the RT and the main effects of the level of mathematical instruction and mathematical subject with particular influence on the accuracy of students’ responses. We explain our findings using the cognitive load theory and hypothesize that these findings are associated with the different cognitive processes related to geometry and algebra. KEY WORDS: accuracy, external representations, internal representations, level of instruction, reaction time, solving mathematical problems, split attention effect INTRODUCTION Literature review reveals inconsistencies in the role of external repre- sentations of mathematical objects (ERs) in problem solving. On the one hand, researchers argue that ERs support problem solving performance and mathematical reasoning by enabling mathematical communication and conveying mathematical thought (Kilpatrick, Swafford & Findell, 2001; Larkin & Simon, 1987; National Council of Teachers of Mathematics (NCTM), 1989, 2000). On the other hand, some studies show that ERs as information sources can damage problem solving performance by increasing cognitive load (Moreno & Mayer, 1999; Sweller, van Merriënboer & Paas, 1998; Tarmizi & Sweller, 1988). This study aimed to examine this inconsistency by analyzing student’s problem solving performance on short double-choice problems that require very quick (correct/incorrect) answers. We examine whether International Journal of Science and Mathematics Education 2013 # National Science Council, Taiwan 2013
Transcript
ROZA LEIKIN, MARK LEIKIN, ILANA WAISMAN and SHELLEY SHAUL
EFFECT OF THE PRESENCE OF EXTERNAL REPRESENTATIONSON ACCURACY AND REACTION TIME IN SOLVING
MATHEMATICAL DOUBLE-CHOICE PROBLEMS BY STUDENTSOF DIFFERENT LEVELS OF INSTRUCTION
Received: 8 June 2011; Accepted: 30 November 2012
ABSTRACT. This study explores the effects of the presence of external representations of amathematical object (ERs) on problem solving performance associated with short double-choice problems. The problems were borrowed from secondary school algebra and geometry,and the ERs were either formulas, graphs of functions, or drawings of geometric figures.Performance was evaluated according to the reaction time (RT) required for solving the problemand the accuracy of the answer. Thirty high school students studying at high and regular levelsof instruction in mathematics (HL and RL) were asked to solve half of the problems with ERsand half of the problemswithout ERs. Each taskwas solved by half of the students with ERs andby half of the students without ERs. We found main effects of the representation mode withparticular effect on the RT and the main effects of the level of mathematical instruction andmathematical subject with particular influence on the accuracy of students’ responses. Weexplain our findings using the cognitive load theory and hypothesize that these findings areassociated with the different cognitive processes related to geometry and algebra.
KEY WORDS: accuracy, external representations, internal representations, level of instruction,reaction time, solving mathematical problems, split attention effect
INTRODUCTION
Literature review reveals inconsistencies in the role of external repre-sentations of mathematical objects (ERs) in problem solving. On the onehand, researchers argue that ERs support problem solving performanceand mathematical reasoning by enabling mathematical communicationand conveying mathematical thought (Kilpatrick, Swafford & Findell,2001; Larkin & Simon, 1987; National Council of Teachers ofMathematics (NCTM), 1989, 2000). On the other hand, some studiesshow that ERs as information sources can damage problem solvingperformance by increasing cognitive load (Moreno & Mayer, 1999;Sweller, van Merriënboer & Paas, 1998; Tarmizi & Sweller, 1988).
This study aimed to examine this inconsistency by analyzing student’sproblem solving performance on short double-choice problems thatrequire very quick (correct/incorrect) answers. We examine whether
International Journal of Science and Mathematics Education 2013# National Science Council, Taiwan 2013
ERs influence the accuracy of the problem solving performance and thereaction time (RT). Additionally, as part of a larger study, we examinedifferences between the performance of students who learn mathematicsat a high level of instruction and of those who learn mathematics at aregular level of instruction. We apply E-Prime software to implement RTmeasurement (Schneider, Eschman & Zuccolotto, 2002).
THEORETICAL BACKGROUND
External and Internal Representations
Perceptual processes are activated by external representations whilecognitive processes are usually activated by internal representations (Zhang& Norman, 1994; p. 118). Commonly, representations can be divided intotwo interrelated categories: external and internal representations (Goldin,2003; Goldin & Kaput, 1996; Kaput, 1998; Zhang, 1997).
External representations (ERs) refer to the physically embodied,observable configurations such as words, graphs, pictures, equations,and tables (Goldin & Kaput, 1996). ERs are considered as “acts stimulion the senses or embodiments of ideas and concepts” (Janvier, Girardon& Morand, 1993, p. 81). ERs, which enable manipulation withmathematical relations and meanings, are involved in mathematical taskssuch as manipulations on algebraic expressions, geometry problems,graph understanding, and more (Zhang, 1997).
Internal representations (IRs) are considered to be a mental imagecorresponding to the internal formulation of what we see around us inexternal reality. IRs are regarded as “cognitive or mental models, schemas,concepts, conceptions, and mental objects” which are illusive and notdirectly observed (Janvier et al., 1993; p. 81). IR determines knowledge andmemory structures (Zhang, 1997) and refer to possible mental configurationsof learners or problem solvers (Goldin & Kaput, 1996).
When communicating and expressing mathematical ideas, students andteachers use ERs (Lesh, Post & Behr, 1987). Lesh, Landau & Hamilton(1983) found five kinds of representations that are useful for mathemat-ical understanding: (a) real life experiences, (b) manipulative models, (c)pictures or diagrams, (d) spoken words, and (e) written symbols. Larkin& Simon (1987) stress that visual representation (pictures, diagrams,graphs, etc.) preserves, in great detail, information about the topologicaland geometric relations between the components of the mathematicalobjects more than verbal (spoken words) or symbolic (written symbols
ROZA LEIKIN ET AL.
such as algebraic equations and formulas) representations do. Anotherimportant distinction between different types of ER is the distinctionbetween dynamic ER, for example, shown on a computer monitor andstatic ER that can be viewed printed on paper (Hegarty, 2004).
Mathematical reasoning requires manipulations with internal representa-tions and translation between representations of different kinds (Janvier,1987). The nature of external mathematical representations with whichstudents learn concepts influences the nature of internal mathematicalrepresentations of the concept (Kaput, 1989, 1998). At the same time,according to Presmeg (2006), visual imagery (internal representation) under-lies the creation of a drawing or spatial arrangement (external representation).
In a theory of representation, terms “to mean” or “to signify” are central“as they are used to express the link existing between external representation(signifier) and internal representation (signified)” (Janvier et al., 1993; p. 81).The relationship between internal representations of mathematical ideas thatproduce networks of knowledge (Hiebert & Carpenter, 1992) correspondingto a mathematical idea is understood only if it is connected to existingnetworks of previously learned concepts. Thus, mathematics educators agreethat the use of different types of representations of mathematical objects inthe learning process positively influences development of students’conceptual understanding, their mathematical reasoning, problem solvingskills, and mathematical communications (Goldin & Steingold, 2001;Hiebert & Carpenter, 1992; Janvier, 1987; Kaput, 1989; NCTM, 1989,2000; Pape & Tchoshanov, 2001; Sfard, 1991).
ER and Split Attention Effect
During the learning process, learners need to search for and match differentparts of information which are mutually connected. Such parts of informationmay be a geometric drawing and an associated formula, or a graph of functionand its corresponding equation. While different sources of information arecrucial for understanding a concept, learners often have to split their attentionbetween different sources of information and thenmentally merge themwhenlearning the concept. This mental process is called split attention effect(Sweller et al., 1998; Sweller, Ayres & Kalyuga, 2011).
There are two types of split attention effect. The first is the spatialcontiguity effect (Moreno & Mayer, 1999; Sweller et al., 1998; Tarmizi &Sweller, 1988) where the different sources of information are spatiallyseparated. The second is the temporal contiguity effect (Mayer, 2009;Mayer & Anderson, 1991, 1992) where the different sources ofinformation are separated in time. This physical separation (spatial or
THE PRESENCE OF EXTERNAL REPRESENTATIONS
temporal) can hurt the performance of different types of instructionalmaterial due to the necessity of switching from one source of informationto another in order to analyze and integrate the material (Bobis, Sweller &Cooper, 1993; Mayer & Anderson, 1991).
On the one hand, it is commonly hypothesized that ERs supportworking memory and therefore improve people’s performance oncomplex cognitive tasks (Cox, 1999; Zhang & Norman, 1994). However,on the other hand, the presence of several ERs of objects that requireswitching and connecting them increases cognitive load (Sweller, 1994;Sweller et al., 1998) and thus can impede problem solving performance.
In this study, we explore the influence of the presence of ERs ofmathematical objects on students’ performance on mathematical tasks bymeasuring RT and the accuracy of the responses. We assume that a longerRT with a similar accuracy of responses is an indication of highercognitive load. At the same time, if the presence of ERs increasesaccuracy of responses, this means that ERs reduce split attention effect.
Reaction Time Methodology
It has been frequently assumed that mental processes are manifested throughcertain behavioral measures such as a subject’s RT and response accuracy(Pachella, 1974; Posner &McCleod, 1982). The subject’s RT is measured asthe interval between the onset of the presentation of a stimulus to a subjectand initiation of the subject’s response (Pachella, 1974; p.44).
In the past two decades, a considerable body of research in cognitivepsychology has used the RT paradigm in several domains, such as learningdisabilities, intelligence, language, reasoning, problem solving, decisionmaking, and movement control (Ashcraft, 1982; Babai, Brecher, Stavy &Tirosh, 2006a; Babai, Levyadun, Stavy & Tirosh, 2006b; Groen& Parkman,1972; Jensen, 2006; Luce, 1986; Miller & Poll, 2009; Sternberg, 1969).
Sternberg (1969) developed the Stage Model in order to obtain andanalyze a subject’s RT in the performance of simple perception tasks.According to this model, performance on a task can be divided into asequence of time-consuming processes such as perception of a stimulus,retrieval of stored information from memory, making decisions based onthis information, and preparing a suitable response.
Jensen (2006) analyzes RT on a particular type of task amongparticipants with different IQ levels. These experiments reveal highcorrelation between IQ and RT; thus, Jensen implies that chronometrictasks can be used as measures of IQ. Some studies in mathematicseducation analyze students’ mathematical thinking using the RT
ROZA LEIKIN ET AL.
paradigm. For example, the studies by Stavy, Babai, and their colleagueshave suggested that the response to tasks with intuitive rules is immediate(Babai et al., 2006a, b; Stavy & Babai, 2008).
In this study, we used RT as a quantitative indicator of cognitiveprocesses associated with solving short double-choice mathematicalproblems. We supposed that longer RTs indicate a more complex mentalprocess and wondered whether the presence of ERs at the solution stageaffects the degree of complexity and, if so, in what way. In particular, wewere interested in examining whether ERs of mathematical objectsaccelerate, decelerate, or have a neutral effect on mental processing.
Neurocognitive Aspects of Representation
A significant number of studies in neuroscience which focus onrepresentations of information in the nervous system emphasize visual,motor, memory, and prefrontal cortical functions of the brain (Funahashi,2007). In particular, studies that relate to mathematics address therepresentation of a number in the brain (Nieder & Dehaene, 2009; CohenKadosh & Walsh, 2009). The meaning of representation in these studiesis somehow different from the meaning of representation in our research.While neurocognitive studies analyze topology and processing of externalinformation in the brain, our study analyzes the role of the presence ofERs in mathematical problem solving. To the best of our knowledge, thistopic has not been studied, neither in mathematics education nor incognitive psychology. In addition, our literature review did not identifyany systematic study focusing on the differences between students’reasoning in algebra vs. geometry.
RESEARCH GOALS AND QUESTIONS
The goal of the current study was to resolve the inconsistency found in theliterature review with respect to the role of ERs in thinking and learningprocesses. We aimed to examine problem solving performance on shortmathematical tasks presented to students, either with or without ERs at thesolution stage, by measuring RT and accuracy of the responses.
To achieve the study goal, we asked the following questions:
1. What are the differences (if they exist) in the accuracy of problemsolving performance on the items that differ in the presence of ER (a)in algebra, (b) in geometry?
THE PRESENCE OF EXTERNAL REPRESENTATIONS
2. What are the differences (if they exist) in the RT of problem solvingperformance on the items that differ in the presence of ER (a) inalgebra, (b) in geometry?
3. Are findings in question 1 and 2 related to the level of mathematicsthat the students study in school?
Additionally, the study presented in this paper was aimed at thevalidation of items for neurocognitive investigation.
METHODOLOGY
Study Participants
Thirty students from a high school in the north of Israel (16 –17 years old)participated in this study. Twenty seven of the 30 students completed all thetests; thus, we report results related to these 27 students only. Fourteenparticipants who study at the highest level of mathematical instruction (HL)and 13 who study at the regular level (RL) completed all the assignments. Allparticipants were randomly assigned to one of two groups (group 1 and group2) with 13 and 14 participants, respectively: group 1 (G1) had six HL andseven RL participants, group 2 (G2) had eight HL and six RL participants. Allparticipants were familiar with the topics included in the experiment’s tasks.
Note that mathematics is a compulsory subject in Israeli high schools, andthe students can be placed in one of three levels of mathematics: high,regular, and low. The level of instruction is determined by students’mathematical achievements in earlier grades. The differences in instructionat HL differ from that at RL in terms of the depth of the learning material andthe complexity of the mathematical problem solving involved. The items weuse in our study are basic items for both RL and HL curricula and are learnedidentically by the students in HL and RL groups. All the students in the studyshared a similar socioeconomic background.
Tools and Data Collection
There were four tests: two tests (T1 and T2) in geometry and two tests (T3 andT4) in algebra. Each test contained 60 tasks. All tasks were presented visuallyat the center of the computer screen, displayed in black characters on a whitebackground. Task presentation and response collection were conducted usingthe E-Prime software package (Schneider et al., 2002). Each task in each testwas presented in two windows with different stimuli (S1—task condition andS2—suggested answer) that appeared consecutively (Fig. 1).
ROZA LEIKIN ET AL.
Each trial started with the fixation cross. The cross was replaced by theproblem description (S1) after 500 ms. The problem description was visiblefor 3,000 ms and separated from the answer (with or without externalrepresentation) by a blank time period (ISI) of 1,000ms. The answer remainedvisible until the participant responded or for a maximum of 8,000 ms. Timeperiods were determined by a pretest performed by three participants.
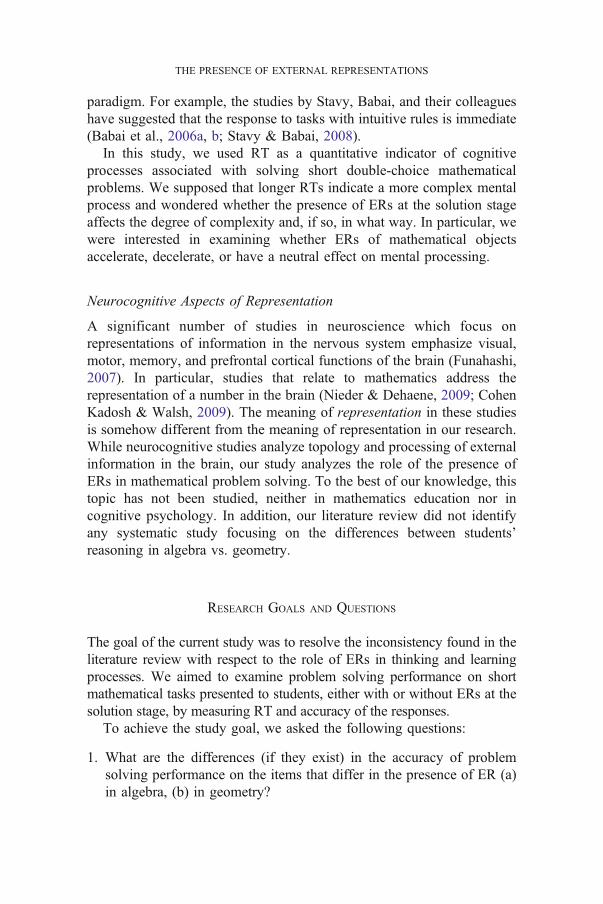
For each task, an answer was presented, and the students were asked todecide whether or not the answer was correct (Fig. 2). In each test, 30 ofthe 60 tasks depicted a correct answer, while the other 30 tasks depictedan incorrect answer for the task given. We call the task “double choice”since the students had to press “3” (0correct) or “1” (0incorrect)according to their decision. The tasks were presented to participants inrandom order. The sequence of events is presented in Fig. 1.
Participants were tested individually in a quiet room, seated in front ofa computer. They were told that they would be presented with a series ofmathematical problems in algebra and geometry from the schoolcurriculum and that they had to make a judgment about the correctnessof the result displayed at the end of each problem. Participants wereinstructed to press one of two keys on the computer keyboard as quicklyas possible when the displayed result was correct and the other key whenthe result was incorrect.
Test T1: Geometry (“Theorems”). Participants received a geometricdrawing with the angles marked by Greek letters α and β. The drawingwas followed by a statement with α and β referring to this drawing. Theparticipants had to determine the correctness of the statement.
Test T2: Geometry (“Areas”). Participants received a drawing of ageometric object. Part of this drawing was shaded. The participants had to
+
S1
3000 ms
ISI
1000 ms
S2
8000ms
ISI
1000ms
Response
Time
+
S1
Figure 1. Sequence of events
THE PRESENCE OF EXTERNAL REPRESENTATIONS
determine what area of the drawing was shaded or what the area of thegeometric object was in reference to the shaded part.
Test T3: Algebra (“From Formula to Graph”). Participants received agraph of a mathematical function followed by an equation. They had todetermine whether the graph and the equation represented the samefunction.
Test T4: Algebra (“From Graph to Formula”). Participants received anequation of a mathematical function followed by a graph. The participants hadto determinewhether the equation and the graph represented the same function.
For each test, two modes were designed. In ER mode, a drawing of agiven mathematical object presented in stimuli 1 (S1—window 1—
FieldGeometryTheorems
T1
GeometryAreas
T2
AlgebraGraph to formula
T3
AlgebraFormula to graph
T4
General instructions for the test
In each task determine correctness of the relationship between angles (α and β)
In each task determine correctness of the
algebraic expression provided for the
denoted area
In each task determine whether the algebraic formula can represent the function defined
by a graph
In each task determine whether the graph can represent the function
defined by an algebraic formula
S1
Object displayed in Window 1 common to ER and IR modes
ISI
S2 – IR-mode
Object displayed in Window 2 in IR mode
S2 – ER-mode
Object displayed in Window 2 in ER mode
After S2 the student was required to press “3” if S2 included a correct answer or “1” if S2 included an incorrect answerCorrect choice 3 3 1 3
Legend: T1, T2, T3, T4- the study tests, G1-Group1, G2-Group2
The triangle is a right triangle.
The area of square is x.
The area of colored triangle is:
x
ay
2
x 3xy90
90
x
ay
2
x
3xy
Figure 2. Examples of items in the test
ROZA LEIKIN ET AL.
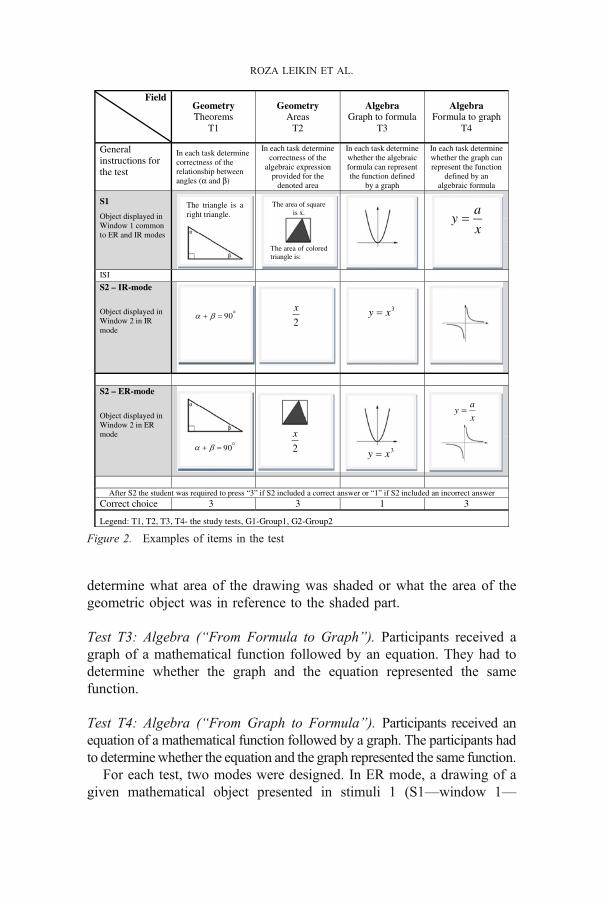
givens) remained presented in stimuli 2 (S2—window 2—suggestedanswer). In IR, a mode drawing of a given mathematical objectpresented in stimuli 1 (S1—window 1—givens) disappeared (was notpresented) in stimuli 2 (S2—window 2—suggested answer). Presenta-tion of a suggested answer without presence of the given object(without ER) required activation of a mental image of the given object(activation of IR) in order to examine the answer. Figure 2 presentsthe task in both modes. Students were asked to cope with four tests(T1, T2, T3, and T4), each one presented in two modes: ER/IR (seeTable 1).
Reliability of the Instrument
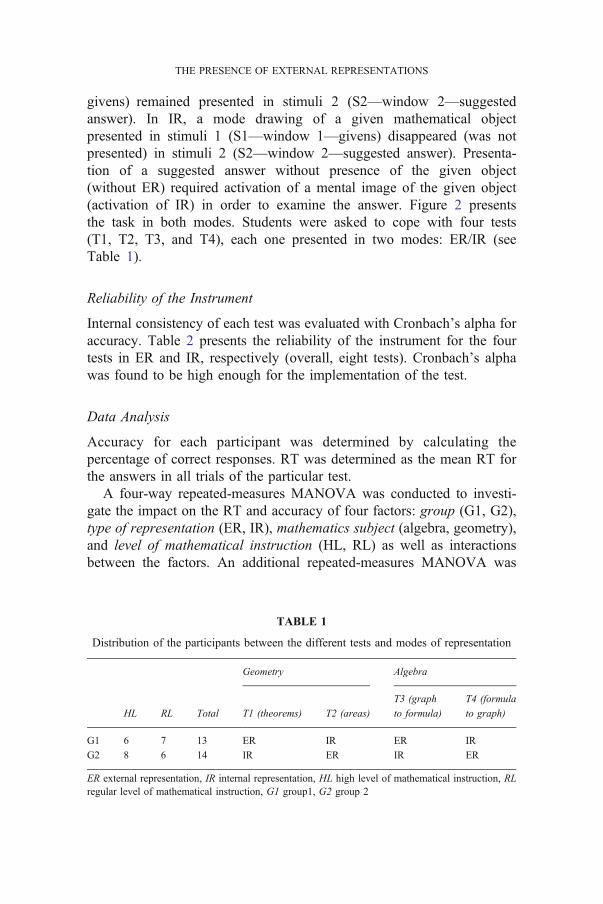
Internal consistency of each test was evaluated with Cronbach’s alpha foraccuracy. Table 2 presents the reliability of the instrument for the fourtests in ER and IR, respectively (overall, eight tests). Cronbach’s alphawas found to be high enough for the implementation of the test.
Data Analysis
Accuracy for each participant was determined by calculating thepercentage of correct responses. RT was determined as the mean RT forthe answers in all trials of the particular test.
A four-way repeated-measures MANOVA was conducted to investi-gate the impact on the RT and accuracy of four factors: group (G1, G2),type of representation (ER, IR), mathematics subject (algebra, geometry),and level of mathematical instruction (HL, RL) as well as interactionsbetween the factors. An additional repeated-measures MANOVA was
TABLE 1
Distribution of the participants between the different tests and modes of representation
HL RL Total
Geometry Algebra
T1 (theorems) T2 (areas)
T3 (graph
to formula)
T4 (formula
to graph)
G1 6 7 13 ER IR ER IR
G2 8 6 14 IR ER IR ER
ER external representation, IR internal representation, HL high level of mathematical instruction, RLregular level of mathematical instruction, G1 group1, G2 group 2
THE PRESENCE OF EXTERNAL REPRESENTATIONS
conducted to investigate the tests’ impact on RT and accuracy in aninteraction with representation and level of mathematical instruction. RTand accuracy are two interdependent measures (Pachella, 1974; Jensen,2006) and therefore were examined as two measures in the sameMANOVA. The type of representation and the mathematics subject werewithin-subject factors, whereas the group and the level of mathematicalinstruction were between-subject factors.
RESULTS
Differences in Accuracy and in Reaction Time
First, we ascertained that the distribution of students among the groupsdid not affect the study results. Indeed, MANOVA revealed neither asignificant main effect of group nor a significant interaction betweengroup and mathematical topic (algebra vs. geometry); findings weresimilar for the interaction between groups and level of mathematicalinstruction (HL vs. RL). This suggests that both groups performedsimilarly in terms of mathematical topics and levels of mathematicalinstruction.
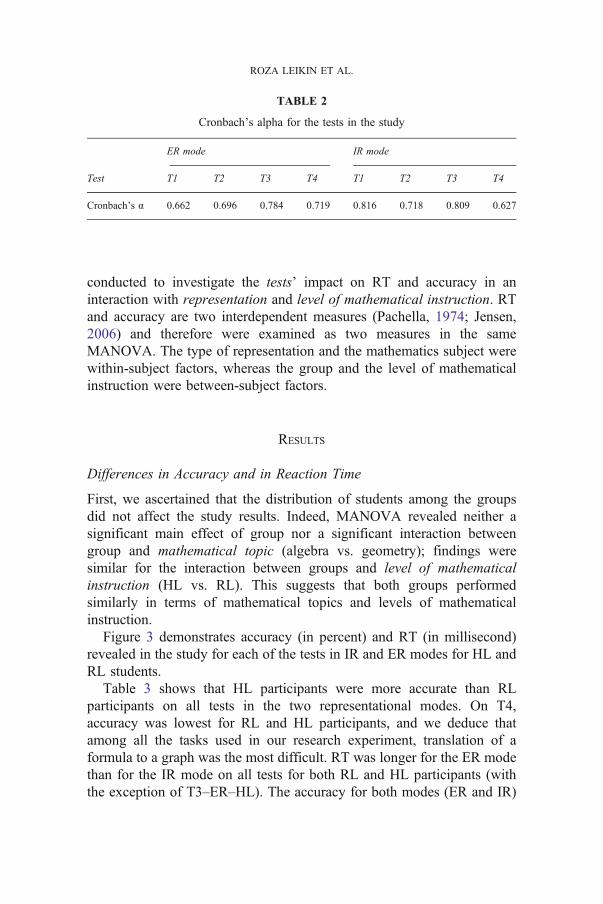
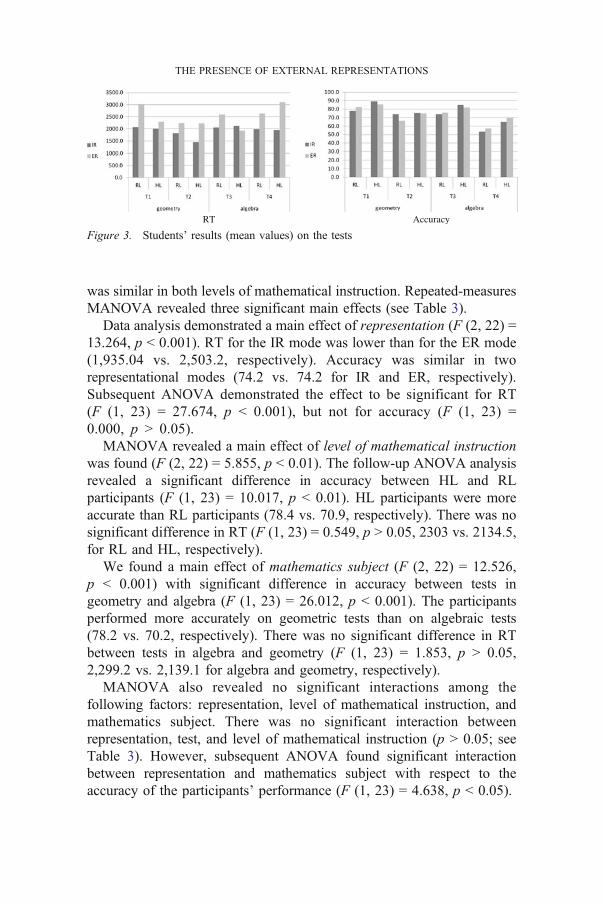
Figure 3 demonstrates accuracy (in percent) and RT (in millisecond)revealed in the study for each of the tests in IR and ER modes for HL andRL students.
Table 3 shows that HL participants were more accurate than RLparticipants on all tests in the two representational modes. On T4,accuracy was lowest for RL and HL participants, and we deduce thatamong all the tasks used in our research experiment, translation of aformula to a graph was the most difficult. RT was longer for the ER modethan for the IR mode on all tests for both RL and HL participants (withthe exception of T3–ER–HL). The accuracy for both modes (ER and IR)
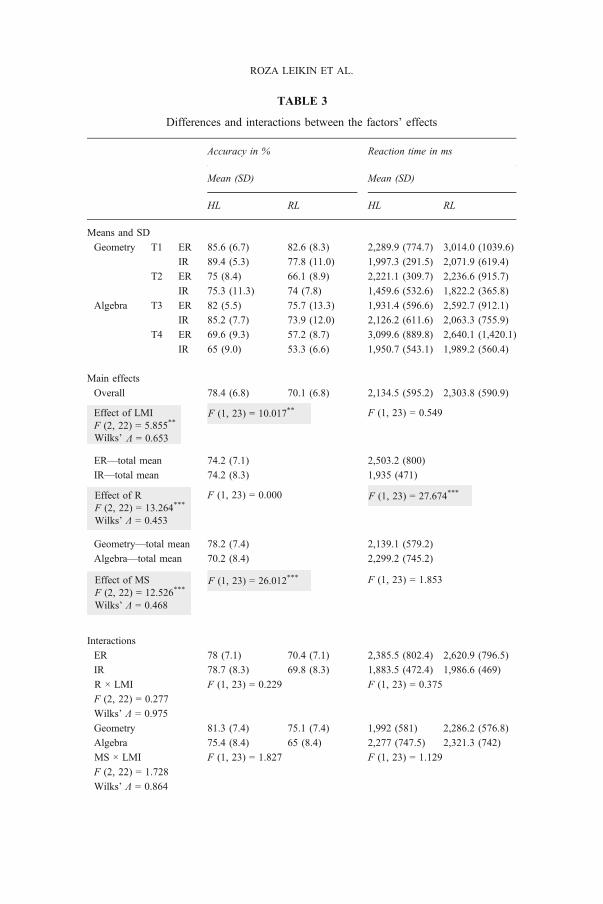
was similar in both levels of mathematical instruction. Repeated-measuresMANOVA revealed three significant main effects (see Table 3).
Data analysis demonstrated a main effect of representation (F (2, 22) 013.264, p G 0.001). RT for the IR mode was lower than for the ER mode(1,935.04 vs. 2,503.2, respectively). Accuracy was similar in tworepresentational modes (74.2 vs. 74.2 for IR and ER, respectively).Subsequent ANOVA demonstrated the effect to be significant for RT(F (1, 23) 0 27.674, p G 0.001), but not for accuracy (F (1, 23) 00.000, p 9 0.05).
MANOVA revealed a main effect of level of mathematical instructionwas found (F (2, 22) 0 5.855, p G 0.01). The follow-up ANOVA analysisrevealed a significant difference in accuracy between HL and RLparticipants (F (1, 23) 0 10.017, p G 0.01). HL participants were moreaccurate than RL participants (78.4 vs. 70.9, respectively). There was nosignificant difference in RT (F (1, 23) 0 0.549, p 9 0.05, 2303 vs. 2134.5,for RL and HL, respectively).
We found a main effect of mathematics subject (F (2, 22) 0 12.526,p G 0.001) with significant difference in accuracy between tests ingeometry and algebra (F (1, 23) 0 26.012, p G 0.001). The participantsperformed more accurately on geometric tests than on algebraic tests(78.2 vs. 70.2, respectively). There was no significant difference in RTbetween tests in algebra and geometry (F (1, 23) 0 1.853, p 9 0.05,2,299.2 vs. 2,139.1 for algebra and geometry, respectively).
MANOVA also revealed no significant interactions among thefollowing factors: representation, level of mathematical instruction, andmathematics subject. There was no significant interaction betweenrepresentation, test, and level of mathematical instruction (p 9 0.05; seeTable 3). However, subsequent ANOVA found significant interactionbetween representation and mathematics subject with respect to theaccuracy of the participants’ performance (F (1, 23) 0 4.638, p G 0.05).
RT Accuracy
Figure 3. Students’ results (mean values) on the tests
THE PRESENCE OF EXTERNAL REPRESENTATIONS
TABLE 3
Differences and interactions between the factors’ effects
The present study examined the impact of the ER of a mathematicalobject (drawing, graph, and formula) on participants’ performance in fourdifferent mathematical tests. The study aimed to examine the effectproduced by the presence of ER of the mathematical object, at thedecision making stage of double-choice tasks, on task performance.
The results showed that, in general, students who study mathematics atHL were more accurate on all the tests and performed more quickly thanRL students (with the exception of T3 in IR mode). In most cases, RTdecreases when students perform tasks in IR mode as compared to theirperformance in ER mode. Surprisingly, compared to our expectations,students performed more accurate geometry tests than algebra tests.
Research in cognitive science indicates that diagrams used as part ofER can improve decision making or problem solving as compared to texts
ER Geometry 77.3 (10.6) 2,445.4 (818.6)
Algebra 71.2 (12.8) 2,606.5 (1,020.6)
IR Geometry 79.7 (10.6) 1,849 (485.3)
Algebra 70 (15) 2,037.7 (587.1)
R × MS F (1, 23) = 0.262
F (2, 22) = 2.288
Wilks’ Λ = 0.828
ER Geometry 79.5 (9.2) 75 (11.8) 2,250.6 (532.6) 2,655.2 (1,026)
R × test × LMI F (3, 69) = 0.463 F (3, 69) = 0.175
F (2, 22) = 0.374
Wilks’ Λ = 0.899
ER external representation, IR internal representation, MS mathematics subject, LMI level of mathinstruction, R representation*p G 0.05; **p G 0.01; ***p G 0.001
(continued)
Accuracy in % Reaction time in ms
Mean (SD) Mean (SD)
HL RL HL RL
TABLE 3
THE PRESENCE OF EXTERNAL REPRESENTATIONS
or tables (e.g. Larkin & Simon, 1987). Larkin & Simon (1987) arguedthat “the diagrammatic representation preserves explicitly the informationabout the topological and geometric relations among the components ofthe problem” (Larkin & Simon, 1987; p. 66). Therefore, diagram useseems to reduce the speed of search and recognition. In addition, externalrepresentation is also thought to provide a memory aid and cansignificantly ease many cognitive tasks (Zhang & Norman, 1994).
Our findings demonstrate that the presence of ER enhances the RT ofstudents’ problem solving performance, but it does not improve accuracy.We explain these findings by the split attention effect that accompaniessolving processes with the presence of both the ER of the mathematicalobject and the corresponding formula. We suggest that split attentioneffect led to an increase in cognitive load and was not helpful in solvingthe tasks. However, more careful investigation has to be performed.
The multiple sources of information in our experiment were separatedtemporally in both modes (since different pieces of information werepresented in S1 and S2) and spatially in ER mode (when different pieces ofinformation were displayed simultaneously in S2). The temporal separationoccurred in two experimental modes; therefore, we suppose that thedifferences between RT in the two experimental modes are due to spatialseparation. We assume that ER induces extraneous cognitive load byrequiring the splitting of attention among several types of information:geometrical object and its property written symbolically or function graphand its formula. This cognitive load requires mental integration of multiplesources of information (Mayer, 2009; Sweller et al., 1998, 2011).Consequently, we assume that maintaining a mental image (IR) of the givenmathematical object reduces cognitive load and decreases RT. Moreover,this effect was true for both levels of mathematical instruction. The RT forthe ER condition was longer than for the IR condition (except in T3—“graphto formula” for HL students): this extraneous load did not affect the accuracyof responses.
RTs are generally used to determine differences in times of informationprocessing with respect to experiment tasks or experiment conditions: thelonger the RT, the more complex the cognitive process (Luce, 1986;Pachella, 1974; Sternberg, 1969). We speculate here that the main effect ofthe mathematics subject (especially its effect on the accuracy of mathemat-ical performance) and the interaction between representation mode andmathematics subject revealed in this study are associated with differentcognitive processes related to geometry and algebra tasks used in ourresearch. We plan to carefully examine the hypotheses raised in this studyfrom both the cognitive and neurocognitive perspectives. We currently
ROZA LEIKIN ET AL.
conduct a multidimensional examination of mathematical giftedness thatexamines a population of 200 students with respect to basic cognitive skillsand brain activity with ERP methodology (e.g. Waisman, Shaul, Leikin &Leikin, 2012; Shaul, Leikin, Waisman & Leikin, 2012).
We assume that results of this study as well as of the neurocognitivestudy will contribute to our understanding of underlying principles fordesign of mathematical tasks with respect to the use of ER or IR. Betterexplanation of the performance differences associated with ER vs. IR andwith algebra vs. geometry tasks (as within-subjects differences) and of theeffects of level of mathematical instruction and gender (as between-subjects differences) can be given, and it will inform mathematicseducators about the place and the role of ER in instructional design.
Some limitations of our study can be seen in the scope of the researchpopulation of the experiment described in this paper. Additionally, wehave to note that definitions of ER and IR used in our study were ofoperational nature for experimental purposes. We are aware that in realmathematics education settings, students may use different ERs and IRsother than those used in this study. For example, in our experiment, wedid not address distinctions between static and dynamic ER ofmathematical objects (cf., Hegarty, 2004).
NCTM (2000) stressed that “The ways in which mathematical ideas arerepresented is fundamental to how people can understand and use thoseideas” (ibid, p. 67). Based on our findings, we speculate that whereas HLmathematics students can successfully operate with mathematical conceptsand solve mathematical problems based on IR, the role of ER becomesespecially important in teaching mathematics to students who do not excel inmathematics. We assume that ER of mathematical objects can supportlearning and solving processes in students who study mathematics at RL andis essential for low achievers in mathematics. Since the former hypothesiswas not explored in our study, it opens an interesting direction for futureresearch in mathematics education. Additional direction for future researchcan be seen in exploring the role of IR and ER in solving more advancedtasks than those that were used in our study.
REFERENCES
Ashcraft, M. H. (1982). The development of mental arithmetic: A chronometric approach.Developmental Review, 2, 213–236.
Babai, R., Brecher, T., Stavy, R. & Tirosh, D. (2006a). Intuitive interference inprobabilistic reasoning. International Journal of Science and Mathematics Education,4, 627–639.
THE PRESENCE OF EXTERNAL REPRESENTATIONS
Babai, R., Levyadun, T., Stavy, R. & Tirosh, D. (2006b). Intuitive rules in science andmathematics: A reaction time study. International Journal of Mathematical Educationin Science and Technology, 37, 913–924.
Bobis, J., Sweller, J. & Cooper, M. (1993). Cognitive load effects in a primary-schoolgeometry task. Learning and Instruction, 3, 1–21.
Cohen Kadosh, R. & Walsh, V. (2009). Numerical representation in the parietal lobes:Abstract or not abstract. The Behavioral and Brain Sciences, 32, 313–328.
Cox, R. (1999). Representation construction, externalised cognition and individualdifferences. Learning and Instruction, 9, 343–363.
Funahashi, S. (Ed.). (2007). Representation and brain. Tokyo, Japan: Springer.Goldin, G. & Steingold, N. (2001). Systems of representations and the developmentof mathematical concepts. In A. A. Cuoco & F. R. Curcio (Eds.), The roles ofrepresentation in school mathematics. NCTM 2001 Yearbook (pp. 1–23). Reston,VA: NCTM.
Goldin, G. A. & Kaput, J. J. (1996). A joint perspective on the idea of representation inlearning and doing mathematics. In L. P. Steffe, P. Nesher, P. Cobb, G. A. Goldin & B.Greer (Eds.), Theories of mathematical learning (pp. 397–430). Hillsdale, NJ: Erlbaum.
Goldin, G. A. (2003). Representation in school mathematics: A unifying research perspective.In J. Kilpatrick, W. G.Martin & D. Schifter (Eds.), A research companion to principles andstandards for school mathematics (pp. 275–285). Reston, VA: NCTM.
Groen, G. J. & Parkman, J. M. (1972). A chronometric analysis of simple addition.Psychological Review, 79, 329–343.
Hegarty, M. (2004). Diagrams in the mind and in the world: Relations between internaland external visualizations. In A. Blackwell, K. Mariott & A. Shimojima (Eds.),Diagrammatic representation and inference: Lecture notes in artificial intelligence2980 (pp. 1–13). Berlin: Springer.
Hiebert, J. & Carpenter, T. P. (1992). Learning and teaching with understanding. In D. A.Grouws (Ed.), Handbook of research on mathematics teaching and learning (pp. 65–97). New York, NY: Macmillan.
Janvier, C. (1987). Translations processes in mathematics education. In C. Janvier (Ed.),Problems of representation in the teaching and learning of mathematics (pp. 27–32).Hillsdale, NJ: Erlbaum.
Janvier, C., Girardon, C. & Morand, J. (1993). Mathematical symbols and representations.In P. S. Wilson (Ed.), Research ideas for the classroom: High school mathematics (pp.79–102). Reston, VA: NCTM.
Jensen, A. R. (2006). Clocking the mind: Mental chronometry and individual differences.Amsterdam, the Netherlands: Elsevier.
Kaput, J. (1989). Linking representations in the symbol systems of algebra. In S. Wagner(Ed.), Research issues in the learning and teaching of algebra. NCTM: Reston, VA.
Kaput, J. (1998). Representations, inscriptions, descriptions and learning: A kaleidoscopeof windows. The Journal of Mathematical Behavior, 17(2), 265–281.
Kilpatrick, J., Swafford, J. & Findell, B. (Eds.). (2001). Adding it up: Helping childrenlearn mathematics. Washington, DC: National Academy Press.
Larkin, J. H. & Simon, H. A. (1987). Why a diagram is (sometimes) worth 10,000 words.Cognitive Science, 11, 65–100.
Lesh, R., Landau, M. & Hamilton, E. (1983). Conceptual models in applied mathematicalproblem solving research. In R. Lesh & M. Landau (Eds.), Acquisition of mathematicsconcepts and processes (pp. 263–343). New York, NY: Academic.
ROZA LEIKIN ET AL.
Lesh, R., Post, T. & Behr, M. (1987). Representations and translations amongrepresentations in mathematics learning and problem solving. In C. Janvier (Ed.),Problems of representation in the teaching and learning of mathematics (pp. 33–40).Hillsdale, NJ: Erlbaum.
Luce, R. D. (1986). Reaction times: Their role in inferring elementary mentalorganization. New York, NY: Oxford University Press.
Mayer, R. E. (2009). Multimedia learning (2nd ed.). Cambridge, UK: CambridgeUniversity Press.
Mayer, R. E. & Anderson, R. (1991). Animations need narrations: An experimental test ofa dual-coding hypothesis. Journal of Educational Psychology, 83, 484–490.
Mayer, R. E. & Anderson, R. (1992). The instructive animation: Helping students buildconnections between words and pictures in multimedia learning. Journal of EducationalPsychology, 84, 444–452.
Miller, C. A. & Poll, G. H. (2009). Response time in adults with a history of languagedifficulties. Journal of Communication Disorders, 42(5), 365–379.
Moreno, R. & Mayer, R. E. (1999). Cognitive principles of multimedia learning: the roleof modality and contiguity. Journal of Educational Psychology, 91, 358–368.
National Council of Teachers of Mathematics (NCTM) (1989). Curriculum andevaluation standards for school mathematics. Reston, VA: The Council.
National Council of Teachers of Mathematics (2000). Standards for school mathematics.In Principles and standards for school mathematics. Reston, VA: NCTM.
Nieder, A. & Dehaene, S. (2009). Representation of number in the brain. Annual Reviewof Neuroscience, 32, 185–200.
Pachella, R. G. (1974). The interpretation of reaction time in information processingresearch. In B. Kantowitz (Ed.), Human information processing: Tutorials inperformance and cognition (pp. 41–82). New York: Wiley.
Pape, S. J. & Tchoshanov, M. A. (2001). The role of representation(s) in developingmathematical understanding. Theory in Practice, 40(2), 118–127.
Posner, M. I. & McCleod, P. (1982). Information processing models—In search ofelementary operations. Annual Review of Psychology, 33, 477–514.
Presmeg, N. (2006). Research on visualization in learning and teaching mathematics. InA. Gutirrez & P. Boero (Eds.), Handbook of research on the psychology of mathematicseducation: Past, present and future. Sense: Rotterdam.
Schneider, W., Eschman, A. & Zuccolotto, A. (2002). E-prime computer software(version 1.0). Pittsburgh, PA: Psychology Software Tools.
Sfard, A. (1991). On the dual nature of mathematical conceptions: Reflections onprocesses and objects as different sides of the same coin. Educational Studies inMathematics, 22, 1–36.
Stavy, R. & Babai, R. (2008). Complexity of shapes and quantitative reasoning ingeometry. Mind, Brain, and Education, 2, 170–176.
Sternberg, S. (1969). Memory scanning: Mental processes revealed by reaction timeexperiments. American Scientist, 57, 421–457.
Sweller, J. (1994). Cognitive load theory, learning difficulty and instructional design.Learning and Instruction, 4, 295–312.
Sweller, J., Ayres, P. & Kalyuga, S. (2011). Cognitive load theory. New York, NY:Springer.
Sweller, J., van Merriënboer, J. J. G. & Paas, F. G. W. C. (1998). Cognitive architectureand instructional design. Educational Psychology Review, 10, 251–296.
THE PRESENCE OF EXTERNAL REPRESENTATIONS
Tarmizi, R. & Sweller, J. (1988). Guidance during mathematical problem solving. Journalof Educational Psychology, 80, 424–436.
Waisman, I., Shaul, S., Leikin, M. and Leikin, R. (2012). General ability vs. expertise inmathematics: An ERP study with male adolescents who answer geometry questions. InThe electronic proceedings of the 12th International Congress on MathematicsEducation (Topic Study Group-3: Activities and Programs for Gifted Students), (pp.3107–3116). Seoul, Korea: Coex.
Shaul, S., Leikin, M. Waisman, I., and Leikin, R. (2012). Visual processing in algebra andgeometry in mathematically excelling students: an ERP study. In The electronicproceedings of the 12th International Congress on Mathematics Education (Topic StudyGroup-16: Visualization in mathematics education) (pp. 1460–1469). Seoul, Korea: Coex.
Zhang, J. & Norman, D. A. (1994). Representations in distributed cognitive tasks.Cognitive Science, 18, 87–122.
Zhang, J. J. (1997). The nature of external representations in problem solving. CognitiveScience, 21, 179–217.
Faculty of Education Interdisciplinary Center for Research and Advancement ofGiftedness and Excellence (RANGE)University of HaifaHaifa, 31905, IsraelE-mail: [email protected]