Effect of three-year consumption of erythritol, xylitol and sorbitol candies on various plaque and salivary caries-related variables Riina Runnel a, *, Kauko K. Ma ¨ kinen b , Sisko Honkala c , Jana Olak a , Pirkko-Liisa Ma ¨ kinen b , Rita No ˜ mmela a , Tero Vahlberg d , Eino Honkala b,c , Mare Saag a a Department of Stomatology, Faculty of Medicine, University of Tartu, Estonia b Institute of Dentistry, University of Turku, Finland c Faculty of Dentistry, Kuwait University, Kuwait d Department of Biostatistics, Faculty of Medicine, University of Turku, Finland j o u r n a l o f d e n t i s t r y 4 1 ( 2 0 1 3 ) 1 2 3 6 – 1 2 4 4 a r t i c l e i n f o Article history: Received 14 February 2013 Received in revised form 24 September 2013 Accepted 24 September 2013 Keywords: Sugar alcohol Dental plaque Biofilm Saliva Clinical trial Children a b s t r a c t Objective: The objective of the present paper is to report results from oral biologic studies carried out in connection with a caries study. Methods: Samples of whole-mouth saliva and dental plaque were collected from initially 7- to 8-year-old subjects who participated in a 3-year school-based programme investigating the effect of the consumption of polyol-containing candies on caries rates. The subjects were randomized in three cohorts, consumed erythritol, xylitol, or sorbitol candies. The daily polyol consumption from the candies was approximately 7.5 g. Results: A significant reduction in dental plaque weight from baseline (p < 0.05) occurred in the erythritol group during almost all intervention years while no changes were found in xylitol and sorbitol groups. Usage of polyol candies had no significant or consistent effect on the levels of plaque protein, glucose, glycerol, or calcium, determined yearly in connection with caries examinations. After three years, the plaque of erythritol-receiving subjects contained significantly (p < 0.05) lower levels of acetic acid and propionic acid than that of subjects receiving xylitol or sorbitol. Lactic acid levels partly followed the same pattern. The consumption of erythritol was generally associated with significantly (p < 0.05) lower counts of salivary and plaque mutans streptococci compared with the other groups. There was no change in salivary Lactobacillus levels. Conclusion: Three-year consumption of erythritol-containing candies by initially 7- to 8-year old children was associated with reduced plaque growth, lower levels of plaque acetic acid and propionic acid, and reduced oral counts of mutans streptococci compared with the consumption of xylitol or sorbitol candies. # 2013 Elsevier Ltd. All rights reserved. * Corresponding author at: University of Tartu, Department of Stomatology, Raekoja plats 6, Tartu 51003, Estonia. Tel.: +372 731 9856; fax: +372 731 9856. E-mail address: [email protected](R. Runnel). Available online at www.sciencedirect.com ScienceDirect journal homepage: www.intl.elsevierhealth.com/journals/jden 0300-5712/$ – see front matter # 2013 Elsevier Ltd. All rights reserved. http://dx.doi.org/10.1016/j.jdent.2013.09.007
Transcript
Effect of three-year consumption of erythritol,xylitol and sorbitol candies on various plaque andsalivary caries-related variables
Riina Runnel a,*, Kauko K. Makinen b, Sisko Honkala c, Jana Olak a,Pirkko-Liisa Makinen b, Rita Nommela a, Tero Vahlberg d,Eino Honkala b,c, Mare Saag a
aDepartment of Stomatology, Faculty of Medicine, University of Tartu, Estoniab Institute of Dentistry, University of Turku, Finlandc Faculty of Dentistry, Kuwait University, KuwaitdDepartment of Biostatistics, Faculty of Medicine, University of Turku, Finland
j o u r n a l o f d e n t i s t r y 4 1 ( 2 0 1 3 ) 1 2 3 6 – 1 2 4 4
a r t i c l e i n f o
Article history:
Received 14 February 2013
Received in revised form
24 September 2013
Accepted 24 September 2013
Keywords:
Sugar alcohol
Dental plaque
Biofilm
Saliva
Clinical trial
Children
a b s t r a c t
Objective: The objective of the present paper is to report results from oral biologic studies
carried out in connection with a caries study.
Methods: Samples of whole-mouth saliva and dental plaque were collected from initially 7-
to 8-year-old subjects who participated in a 3-year school-based programme investigating
the effect of the consumption of polyol-containing candies on caries rates. The subjects
were randomized in three cohorts, consumed erythritol, xylitol, or sorbitol candies. The
daily polyol consumption from the candies was approximately 7.5 g.
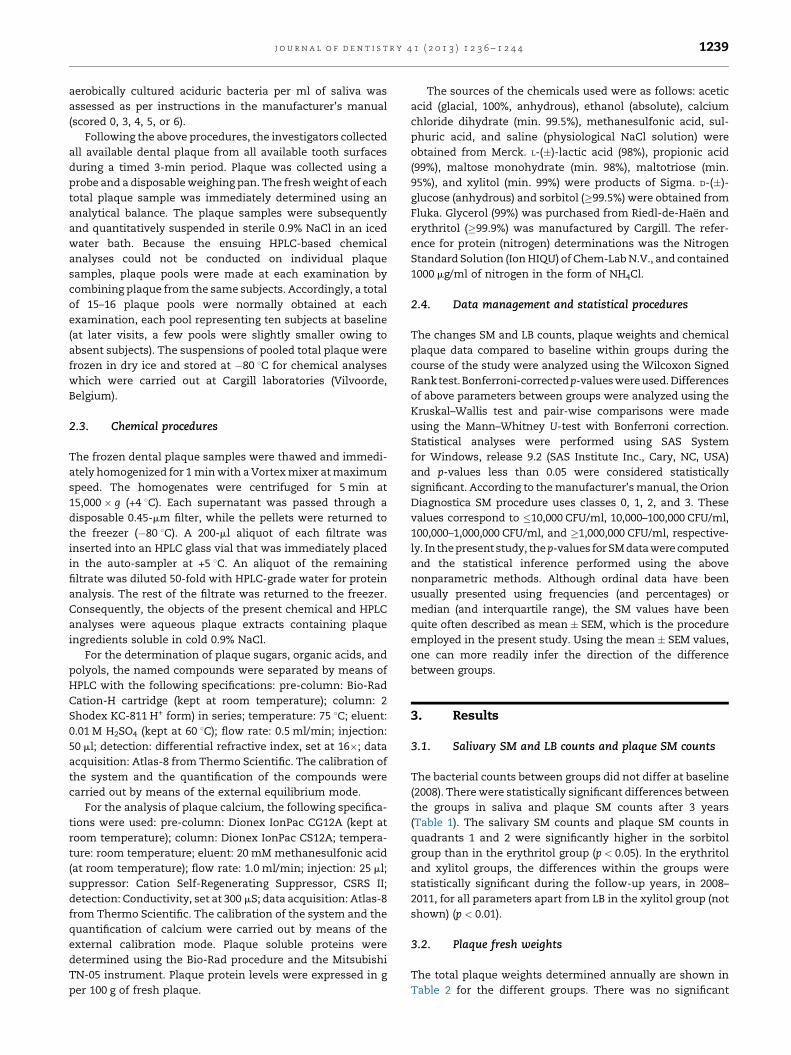
Results: A significant reduction in dental plaque weight from baseline (p < 0.05) occurred in
the erythritol group during almost all intervention years while no changes were found in
xylitol and sorbitol groups. Usage of polyol candies had no significant or consistent effect on
the levels of plaque protein, glucose, glycerol, or calcium, determined yearly in connection
with caries examinations. After three years, the plaque of erythritol-receiving subjects
contained significantly (p < 0.05) lower levels of acetic acid and propionic acid than that of
subjects receiving xylitol or sorbitol. Lactic acid levels partly followed the same pattern. The
consumption of erythritol was generally associated with significantly (p < 0.05) lower counts
of salivary and plaque mutans streptococci compared with the other groups. There was no
change in salivary Lactobacillus levels.
Conclusion: Three-year consumption of erythritol-containing candies by initially 7- to 8-year
old children was associated with reduced plaque growth, lower levels of plaque acetic acid
and propionic acid, and reduced oral counts of mutans streptococci compared with the
* Corresponding author at: University of Tartu, Department of Stomatology, Raekoja plats 6, Tartu 51003, Estonia. Tel.: +372 731 9856;fax: +372 731 9856.
on tooth surfaces; (2) plaque adheres to tooth surfaces; a
greater plaque mass may be potentially more harmful than a
thin, newly formed plaque integument as it forms a barrier to
j o u r n a l o f d e n t i s t r y 4 1 ( 2 0 1 3 ) 1 2 3 6 – 1 2 4 41242
acid-neutralizing substances in saliva; (3) plaque is biochemi-
cally capable of rapidly metabolizing dietary carbohydrates to
acids. The biological markers included the oral counts of SM
and LB, plaque gravimetry, and concentration levels of dental
plaque compounds believed to reflect the biochemical and
cariologic status of plaque. Since there were no side effects,
the usage of the saliva stimulants was similar in all study
groups.
4.2. Plaque mass, SM, and comments on differencesbetween the tested alditols
Most oral biologic studies involving the use of xylitol- or
sorbitol-sweetened products have revealed distinctive differ-
ences between these polyols. Xylitol has almost consistently
been shown to reduce the mass and adherence of dental
plaque on tooth surfaces, and to reduce the growth of SM on
tooth surfaces; this reduction has occasionally also been
reflected in whole-mouth saliva SM levels. Plaque mass and
adherence, and plaque SM level, can be regarded as surrogate
end points of dental caries. The few oral biologic studies
carried out with erythritol have suggested that this alditol may
affect these endpoints similarly to xylitol, or its effect may
even exceed that of the latter.7–9 In the present three-year
intervention, only erythritol reduced the amount of dental
plaque consistently during the entire follow-up. There were no
significant changes over time in the sorbitol (control) and
xylitol groups over time during the intervention. What is more,
detectable and more consistent reduction in plaque levels of
acetic acid, propionic acid, and lactic acid occurred in the
erythritol group, and the salivary and plaque SM counts
determined for the 1st and 2nd quadrant (upper teeth) were
significantly lower in subjects who received erythritol,
compared with other groups.
The superiority of erythritol in the above measurements
can be evaluated from the standpoint of its generally known
molecular properties that differentiate it from pentitols and
hexitols, i.e., the erythritol molecule’s significantly smaller
molar mass (122.1 g/mol) and its consequently higher ‘‘mobil-
ity’’ in biological systems.9–11 The smaller molar mass of
erythritol should make it more permeable and more active in
biological environments than its larger homologues xylitol
and sorbitol, with their molecular mass of 152.1 g/mol and
182.2 g/mol, respectively. Although erythritol does share most
of the general polyol properties with xylitol and sorbitol, it is
likely that the erythritol-associated plaque effects can be
partly interpreted in terms of the erythritol molecule’s smaller
molar mass and its general osmoregulator role in biological
environments. Previous papers have shown that erythritol is
an effective hydroxyl radical scavenger10,11 and that it retards
the growth of certain SM strains more effectively than xylitol
or sorbitol.7 Although xylitol, too, has pronounced free-radical
quenching ability, it is still possible that erythritol provides
certain cariologic advantages over xylitol and sorbitol. The
final mechanism of action may turn out to be more complex
provided the results obtained with a chronic wound biofilm
model can be used as a point of comparison: erythritol
preferentially inhibited Pseudomonas aeruginosa and Staphylo-
coccus aureus, while xylitol preferentially targeted P. aerugi-
nosa.12 These results speak for pronounced selectivity in
effects of alditols on human pathogens. Contrasting results of
erythritol and xylitol were obtained with SM: compared with
xylitol, erythritol at low concentrations had a weaker effect on
the growth and acid production of SM, but had a stronger
effect at high concentrations.13
In a comparative study by Elseviers et al.,14 it transpired,
inter alia, that D-erythrose and L-erythrulose (the aldose and
ketose forms corresponding to erythritol) displayed anti-
cariogenic properties in terms of their inhibitory action on
SM ATCC 25175. These sugars turned out to be effective growth
inhibitors even when blended with glucose, and certain blends
produced no lactic acid upon fermentation. A later study
showed that certain mixtures of erythritol with sorbitol or
xylitol effectively retarded the growth of SM in interproximal
dental plaque.8 An aspect of previous research dealing with
erythritol suggested that erythritol was neither utilized as a
substrate for lactic acid production nor for plaque formation of
SM and certain oral microorganisms.15 Erythritol was also not
utilized for water-insoluble glucan synthesis or cellular adher-
ence by glucosyltransferase from SM PS-14 and S. sobrinus 6715.
Combined, these results suggest that four-carbon carbohy-
drates and alditols may constitute a promising next-generation
group of natural and physiologic sugar substitutes.
The failure of xylitol to reduce plaque and SM levels
consistently during the present follow-up study is difficult to
explain in view of previously reported, generally recognized
effects. About 90% of all plaque studies with xylitol and
sorbitol have shown xylitol to reduce plaque mass and SM
counts, while the use of sorbitol has normally been associated
with no change in these parameters, or even increased plaque
quantity and bacterial levels. One possible reason may be the
fact that treatment during the span of the study was relatively
mild: (1) test products were only consumed 3 times a day with
the last consumption just before children left school around 2
pm, (2) test products were only consumed during weekdays
and not during the weekend, and (3) test products were not
consumed during 2 months of school vacation.
The presence of polyols in plaque did not correlate with
group assignment; salivation was considered to have caused a
relatively effective clearance of occasional erythritol and
xylitol residues from plaque. These polyols may not be
regarded as constitutive plaque metabolites in the same
way sorbitol is known to be involved in plaque carbohydrate
metabolism.
The present study subjects displayed relatively high LB
counts, which is in agreement with a previous study reporting
high levels of salivary LB in Estonian schoolchildren.16
Increased salivary LB levels have previously been ascribed
to the presence of untreated dentine caries. Some studies have
indeed demonstrated a correlation between high levels of LB
in whole-mouth saliva and dentine caries17, and long-term use
of xylitol chewing gum in a school programme did reduce the
salivary LB levels compared with controls (Belize and China
studies).17–19 The present trial showed a significant difference
between the intervention groups in the number of dentine
carious teeth and surfaces (in the primary dentition) at the last
two visits (after 2nd and 3rd year).3–5 This difference was not
reflected in the LB measurements, however. This may have
resulted from the relatively low overall number of untreated
dentine caries lesions in the present child cohort.
j o u r n a l o f d e n t i s t r y 4 1 ( 2 0 1 3 ) 1 2 3 6 – 1 2 4 4 1243
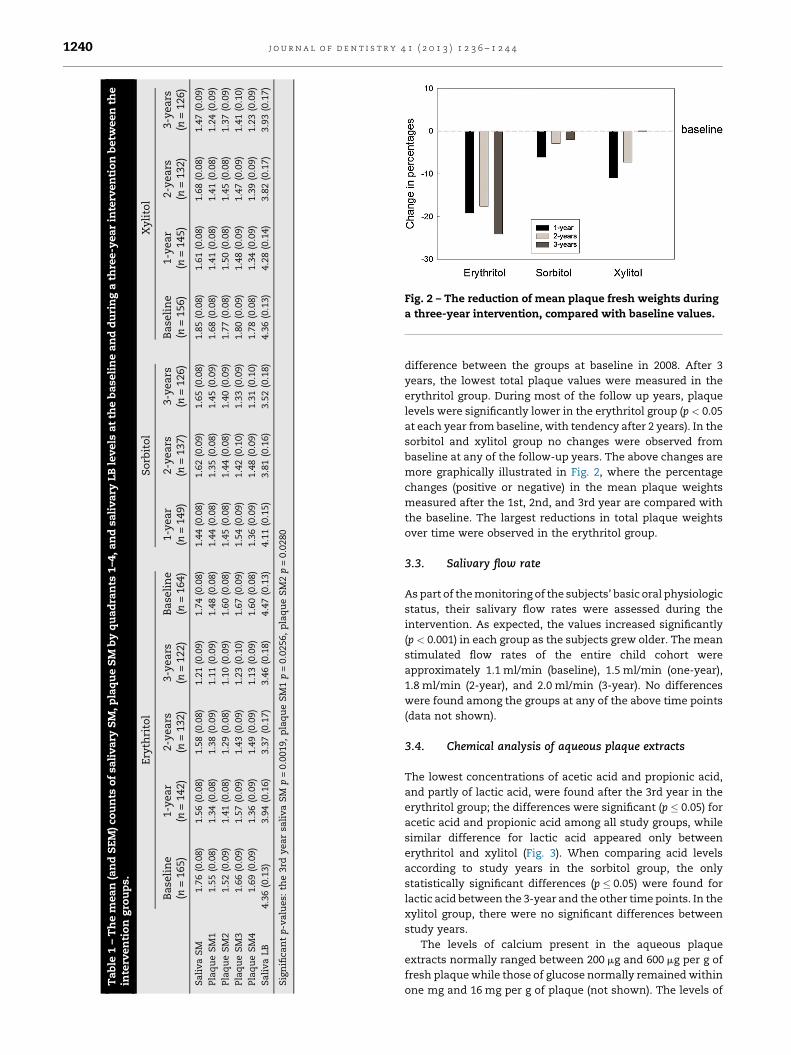
4.3. Plaque acids
One of the pathogenic properties of dental plaque results from
its biochemical capability to metabolize dietary carbohydrates
to acids that can demineralize the tooth and contribute to the
formation of an acidic microenvironment within plaque for
increased growth of aciduric organisms (such as lactobacilli).
A variety of organic acids have been detected in dental plaque.
In the present study, acetic acid, propionic acid, and lactic acid
were selected to represent acidic end products of plaque
bacterial metabolism (i.e., surrogate markers of caries), in
which these acids can be visualized as being formed after
hexose-to-pyruvic acid conversion of bacterial metabolism.
Although the acid levels varied remarkably over time in all
experimental groups, the plaque collected from erythritol-
using subjects showed most significant reduction in these
plaque acid levels. It was noted already in the early history of
erythritol research that acetic acid bacteria do not ferment
erythritol and that yeast is totally incapable of metabolizing
erythritol.20 The same appears to apply to the lactic acid
bacteria harboured in the oral cavity.
4.4. Plaque mass-to-calcium relationship
The present study showed that the plaque levels of protein
and calcium remained within a relatively normal range during
the intervention. The fact that the concentrations of plaque
protein, which may be considered to represent more stable,
basic plaque constituents, remained within a quite narrow
range during the trial, suggests that the results of other
chemical analyses reflected the metabolic state of the present
plaque samples relatively well. The rationale behind the
present calcium determinations was to investigate the
possibility that the present alditol usage would result in
similar Ca-to-plaque ratios as in four previous studies.9 In
these studies, plaque calcium levels increased in subjects who
had consumed xylitol. These phenomena were assumed to be
related to the complexation of calcium with alditols, but more
specifically resulting from an increase in plaque protein levels
in the dental plaque of xylitol-consuming subjects. Dental
plaque may thus be regarded as a calcium reservoir which
releases calcium to aid repair.21 The present analyses did not
reveal the same Ca:plaque (or Ca:protein) relationship in any
of the test groups analyzed after each visit, as had been found
in the four studies referred to above. There were no differences
between the experimental groups. It is possible that the
present polyol treatment was too mild for the above Ca:plaque
ratios to occur.
4.5. Comparison with the previous 6-month study
A previous short-term study carried out in the same
geographic area with teenage subjects revealed significant
differences in several oral biologic parameters between the
same alditols investigated in the present trial.7 In the short-
term study, the use of erythritol and xylitol was associated
with a statistically significant reduction in the plaque and
saliva levels of SM and in the growth of dental plaque. The use
of sorbitol did not affect these oral biologic variables in the
same way. The teenage subjects received 6.72 g of the above
polyols in the form chewable tablets, and additionally used
twice daily a dentifrice containing 34.5% (w/w) of the same
polyols, increasing the overall daily polyol usage to about 7.0 g
per subject, i.e. to about the same level as in the present three-
year intervention trial. This polyol usage continued uninter-
rupted over the entire six-month period. The tablets were
consumed in six separate episodes per day, the overall daily
frequency of exposure of the dentition to the tested polyols
thus being eight. This polyol usage covered most of the waking
period of the subjects, whereas in the present trial the test
items were normally consumed daily within a relatively short
six-hour period. Therefore, the study designs of these two
studies are disparate. In spite of the differences between study
designs, the use of erythritol candies was associated with
significantly decreasing plaque amounts during both the
short-term and the long-term intervention. Also, the signifi-
cant plaque weight reduction observed for erythritol com-
pared to xylitol and control in this long-term intervention is
consistent with the finding in the short-term intervention,
where a significantly higher plaque weight reduction was
observed for erythritol compared to xylitol and sorbitol.
5. Conclusions
The present study showed that plaque levels of acetic acid,
propionic acid, and lactic acid were significantly lower after the
3rd year in the erythritol group compared with xylitol and
sorbitol groups. The amount of dental plaque was consistently
reduced only in the erythritol group during the entire follow-up.
Also the saliva SM counts and the plaque SM counts in the 1st
and 2nd quadrant (upper) were lower in the erythritol group
than in the other intervention groups. These results are in
congruence with the reduction in the number of dentine caries
teeth and surfaces reported in the clinical paper of this series.3–5
Acknowledgement
The funding provided by Cargill R&D Centre Europe (Vilvoorde,
Belgium) to this study (ClinicalTrials.gov Identifier:
NCT01062633) is gratefully acknowledged.
r e f e r e n c e s
1. Makinen KK, Scheinin A. Turku sugar studies VII. Principalbiochemical findings on whole saliva and plaque. ActaOdontologica Scandinavica 1975;33:129–71.
2. Makinen KK, Chen CY, Makinen PL, Bennett CA, IsokangasPJ, Isotupa KP, et al. Properties of whole saliva and dentalplaque in relation to 40-month consumption of chewinggums containing xylitol, sorbitol or sucrose. Caries Research1996;30:180–8.
3. Honkala S, Runnel R, Saag M, Olak J, Nommela R, Russak S,et al. Effect of erythritol and xylitol on dental cariesprevention in children. Caries Research 2013;7. Submitted toCaries Research 7/2013.
4. Honkala E, Runnel R, Honkala S, Olak J, Vahlberg T,Saag M, et al. Measuring dental caries in the mixeddentition by ICDAS. International Journal of Dentistry 2011.
j o u r n a l o f d e n t i s t r y 4 1 ( 2 0 1 3 ) 1 2 3 6 – 1 2 4 41244
http://dx.doi.org/10.1155/2011/150424. Available at: http://www.hindawi.com/journals/ijd/2011/150424/.
5. Runnel R, Honkala S, Honkala E, Olak J, Nommela R,Vahlberg T, et al. Caries experience in the permanentdentition among first- and second-grade schoolchildren insoutheastern Estonia. Acta Odontologica Scandinavica2013;71:410–5.
6. Ismail AI, Sohn W, Tellez M, Amaya A, Sen A, Hasson H, et al.The International Caries Detection and Assessment System(ICDAS): an integrated system for measuring dental caries.Community Dentistry Oral Epidmiology 2007;35:170–8.
7. Makinen KK, Saag M, Isotupa KP, Olak J, Nommela R,Soderling E, et al. Similarity of the effects of erythritol andxylitol on some risk factors of dental caries. Caries Research2005;39:207–15.
8. Makinen KK, Isotupa KP, Kivilompolo T, Makinen PL,Murtomaa S, Petaja J, et al. The effect of polyol-combinantsaliva stimulants on S. mutans levels in plaque and saliva ofpatients with mental retardation. Special Care in Dentistry2002;22:187–93.
9. Makinen KK. Sugar alcohols, caries incidence,and remineralization of caries lesions: a literaturereview. International Journal of Dentistry 2010. http://dx.doi.org/10.1155/2010/981072. Available at: http://www.hindawi.com/journals/ijd/2010/981072/.
10. de Cock P. Erithritol. In: O’Donnell K, Kearsley MW, editors.Sweeteners and sugar alternatives in food technology. 2nd ed.Wiley-Blackwell: Oxford; 2012. p. 215–41. doi:10.1002/9781118373941.ch10.
11. den Hartog GJM, Boots AW, Adam-Perrot A, Brouns F,Verkoojen IW, Weseler AR, et al. Erythritol is a sweetantioxidant. Nutrition 2010;26:449–58.
12. Dowd SE, Sun Y, Smith E, Kennedy JP, Jones CE, Wolcott R.Effects of biofilm treatments on the multi-species Lubbock
wound biofilm model. Journal of Wound Care2009;18(508):510–2.
13. Yao J, Zhang JL, Wu YQ, Lu ZJ. Contrasting study of erythritoland xylitol on Streptococcus mutans. 2009;27:603–5. [inChinese, abstract in English].
14. Elseviers M, Wannemaeker B, Roper H. A sweet tooth?Dental plaque and the use of anti-cariogenic sweeteners.Agro Food Industry Hi-Tech 2000;11:24–9.
15. Kawanabe J, Hirasawa M, Takeuchi T, Oda T, Ikeda T.Noncariogenicity of erythritol as a substrate. Caries Research1992;26:358–62.
16. Koll-Klais P, Mandar R, Leibur E, Kjaeldgaard M. High levelsof salivary lactobacilli in Estonian schoolchildren. EuropeanJournal of Pediatric Dentistry 2004;5:107–9.
17. Makinen KK, Bennett CA, Hujoel PP, Isokangas PJ, IsotupaKP, Pape HR, et al. Xylitol chewing gums and caries rates: a40-month cohort study. Journal of Dental Research1995;74:1904–13.
18. Makinen KK, Chen C-Y, Makinen P-L, Bennett CA, IsokangasPJ, Isotupa KP, et al. Properties of whole saliva and dentalplaque in relation to 40-month consumption of chewinggums containing xylitol, sorbitol or sucrose. Caries Research1996;30:180–8.
19. Makinen KK, Alanen P, Isokangas P, Isotupa K, Soderling E,Makinen PL, et al. Thirty-nine-month xylitol chewing-gumprogramme in initially 8-year old school children: afeasibility study focusing on mutans streptococci andlactobacilli. International Journal of Dentistry 2008;58:41–50.
20. Carr CJ, Krantz JC. Metabolism of the sugar alcohols.Advances in Carbohydrate Chemistry and Biochemistry1945;1:175–92.
21. Rose RK, Dibdin GH, Shellis PR. A quantitative study ofcalcium binding and aggregation in selected oral bacteria.Journal of Dental Research 1993;72:78–84.